SING THE MICROSOFT ECURITY INTELLIGENCE...
33
Security Intelligence Report USING THE MICROSOFT SECURITY INTELLIGENCE REPORT Volume 9 (January 2010 through June 2010) Frank Simorjay, senior product manager, Trustworthy Computing, Microsoft Corporation www.microsoft.com/sir
Transcript of SING THE MICROSOFT ECURITY INTELLIGENCE...

Security Intelligence Report
USING THEMICROSOFT
SECURITY INTELLIGENCE REPORTVolume 9 (January 2010 through June 2010)Frank Simorjay, senior product manager, Trustworthy Computing, Microsoft Corporation
www.microsoft.com/sir

About Security Intelligence Report Volume 9
• Malicious software key findings cover:
– Vulnerability disclosures
– Usage trends for Windows® Update and Microsoft® Update
– Security breach trends
– Trends in malicious and potentially unwanted software
– Email threats
– Malicious and compromised websites
– Phishing sites and traffic
– Analysis of malicious software hosts
– Analysis of drive-by download sites
– Automated SQL injection attacks
• Contains data and intelligence from the past several years, but focuses on the first two quarters of 2010 (1Q10 and 2Q10)

TwC SecurityProtecting Microsoft customers throughout the entire life cycle
(in development, deployment and operations)
Microsoft Security
Engineering Center
(MSEC)
Microsoft Malware
Protection Center
(MMPC)
Microsoft Security
Response Center
(MSRC)
Centers Supporting TwC Security

Security Intelligence Report Volume 9Data sources
• Windows Live Hotmail®: More than 280 million active users
• Windows Internet Explorer®: The world’s most popular browser with SmartScreen® and Microsoft Phishing Filter
• Forefront Online Security for Exchange: Scans billions of email messages a year
• MSRT: User base of more than 600 million unique computers worldwide
• Bing™: Billions of webpages scanned each month
Product name
Main customer segment Malicious softwareSpyware and potentially
unwanted softwareAvailable at
no additional
charge
Maindistribution
methodsConsumers Business
Scan and remove
Real-timeprotection
Scan and remove
Real-time protection
Windows Malicious Software Removal Tool (MSRT)
●Prevalent malware families
●
Windows Update/MicrosoftUpdate Download Center
Windows Defender ● ● ● ●Download Center Windows Vista®/ Windows 7
Windows Live® OneCare safety scanner
● ●●
● Cloud
Microsoft® Security Essentials ● ● ● ● ● ● Cloud
Microsoft Forefront® Online Protection for Exchange
● ● ● Cloud
Forefront Client Security ● ● ● ● ● Volume licensing

Volumes 1 & 2 Volumes 3 & 4 Volumes 5 - 8
Security Intelligence Report Evolution

Security Intelligence Report Volume 9

Industry-Wide Software Vulnerability Disclosures
3450 3474
2919 29623188
27072546
2360
0
500
1,000
1,500
2,000
2,500
3,000
3,500
4,000
19598 124 83 109 98 89 126
15621494
15871447 1402
12661144
1693
1882
1208
1677
12891191
1090
0
500
1,000
1,500
2,000
Low (0 - 3.9)Medium (4 - 6.9)High (7 - 10)
3079 3110
2547 25732807
23512161
1943
259 242 276 310 256 207 237 196
112 122
96 79 0
500
1,000
1,500
2,000
2,500
3,000
3,500
Application
vulnerabilities
Operating system Browservulnerabilities vulnerabilities
3,280 3,322 2,822 2,869
3,042
2,594 2,417
2,215
170 152 97 93 146 113 129 145
0
500
1,000
1,500
2,000
2,500
3,000
3,500
Non-MicrosoftMicrosoft

Security Breach Trends
0
50
100
150
200
250
300
350
400
1H08 2H08 1H09 2H09 1H10
Missing
Malware
Accidental Web
Lost Equipment
Postal Mail
Disposal
Fraud
―Hack‖
Stolen
Equipment

Security Breach Trends Physical Threat
0
50
100
150
200
250
300
350
400
1H08 2H08 1H09 2H09 1H10
Missing
Malware
Accidental Web
Lost Equipment
Postal Mail
Disposal
Fraud
―Hack‖
Stolen
Equipment

0.0
10.0
20.0
30.0
40.0
50.0
60.0
1Q09 2Q09 3Q09 4Q09 1Q10 2Q10
Worldwide
Brazil
Saudi Arabia
Guatemala
Russia
Jordan
Malicious and Potentially Unwanted Software Most improved between 1Q09 and 2Q10 by CCM (100,000 MSRT executions)

0.0
10.0
20.0
30.0
40.0
50.0
60.0
1Q09 2Q09 3Q09 4Q09 1Q10 2Q10
Worldwide
Turkey
Spain
Korea
Taiwan
Brazil
Malicious and Potentially Unwanted Software Highest infection rates 1Q09–2Q10 by CCM (100,000 MSRT
executions)

0.0
10.0
20.0
30.0
40.0
50.0
60.0
1Q09 2Q09 3Q09 4Q09 1Q10 2Q10
Worldwide
Turkey
Spain
Korea
Taiwan
Brazil
USA
UK
Germany
Malicious and Potentially Unwanted Software Highest infection rates 1Q09–2Q10 by CCM (100,000 MSRT
executions)

Malicious and Potentially Unwanted SoftwareGeographic distribution of malware—MSRT, 2Q10
• Worldwide infection rate average: 9.6 CCM for 2Q10
• Worldwide most infected: Turkey 36.6, Spain 35.7, Korea 34.4 • Worldwide least infected: Belarus 1.3, Bangladesh 1.5, Sri Lanka 1.8
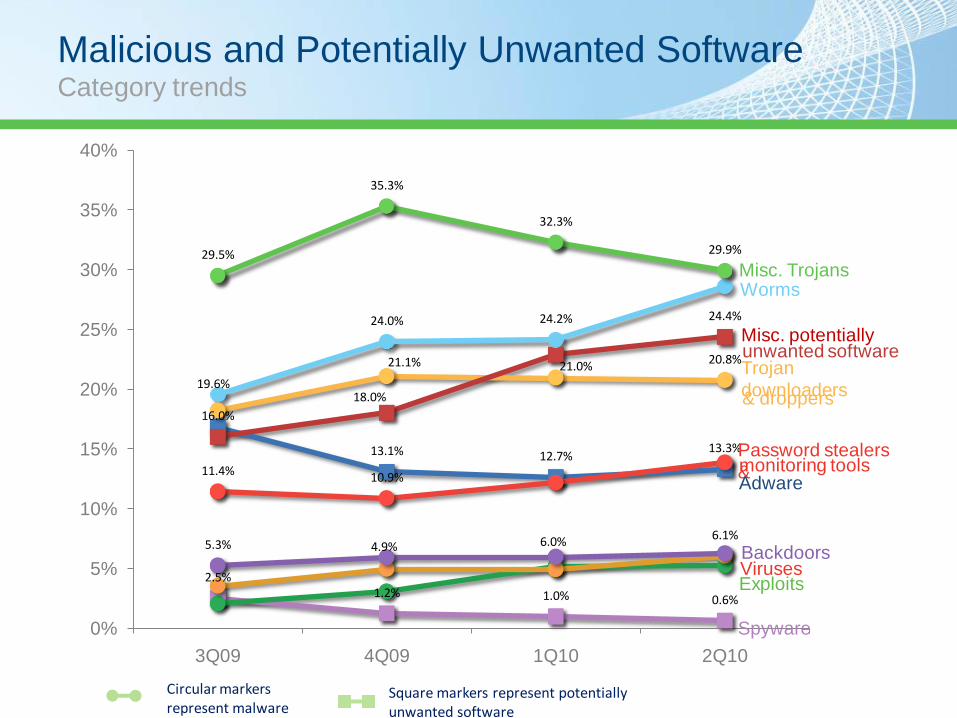
Malicious and Potentially Unwanted SoftwareCategory trends
Circular markers represent malware
Square markers represent potentially unwanted software
2.5%1.2% 1.0% 0.6%
4.9%6.1%
5.3% 6.0%
13.1% 12.7%13.3%
11.4% 10.9%
21.1% 21.0%20.8%
16.0%
18.0%
24.4%
19.6%
24.0% 24.2%
29.5%
35.3%
32.3%
29.9%
0%
5%
10%
15%
20%
25%
30%
35%
40%
3Q09 4Q09 1Q10 2Q10
Misc. TrojansWorms
Misc. potentiallyunwanted software
& droppers
Password stealers
&monitoring toolsAdware
BackdoorsVirusesExploits
Spyware
Trojan
downloaders

Data from All Microsoft Security ProductsTop 10 families worldwide in 2Q10
Family Most significant category 1Q10 2Q10 1 year trend
1 Win32/Taterf Worms 1,495,286 2,320,953
2 Win32/Frethog Password stealers and monitoring tools 2,010,989 1,997,669
3 Win32/Renos Trojan downloaders and droppers 2,691,987 1,888,339
4 Win32/Rimecud Worms 1,807,773 1,748,260
5 Win32/Autorun Worms 1,256,356 1,645,851
6 Win32/Hotbar Adware 1,015,055 1,482,681
7 Win32/FakeSpypro Miscellaneous Trojans 1,244,353 1,423,528
8 Win32/Conficker Worms 1,496,877 1,663,349
9 Win32/Alureon Miscellaneous Trojans 1,463,885 1,035,079
10 Win32/Zwangi Misc. potentially unwanted software 542,011 859,801
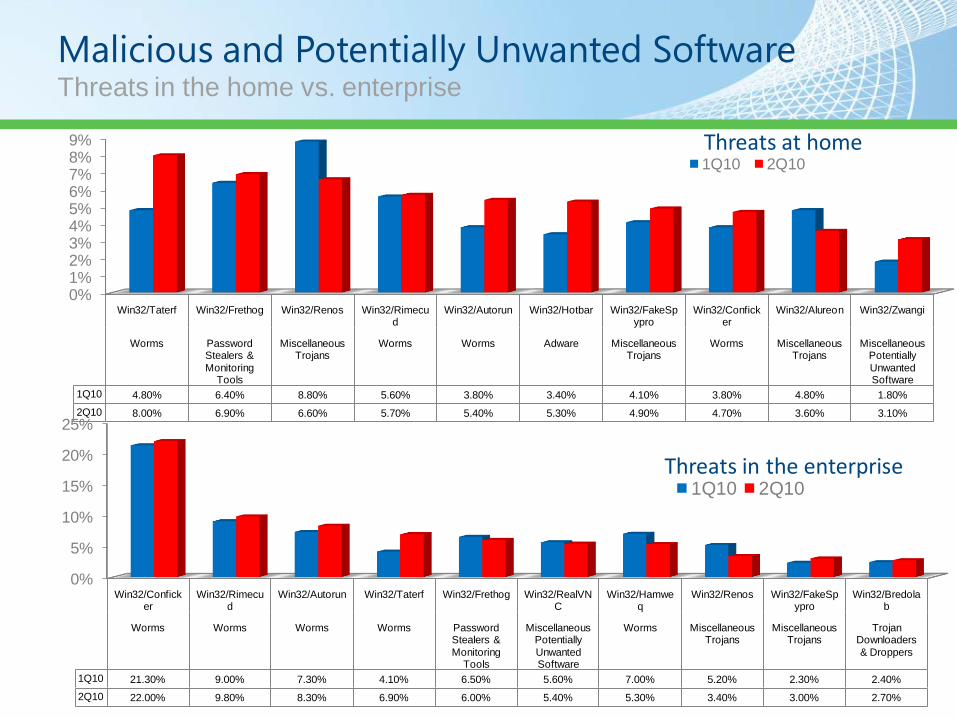
Malicious and Potentially Unwanted Software Threats in the home vs. enterprise
0%
5%
10%
15%
20%
25%
Win32/Conficker
Win32/Rimecud
Win32/Autorun Win32/Taterf Win32/Frethog Win32/RealVNC
Win32/Hamweq
Win32/Renos Win32/FakeSpypro
Win32/Bredolab
Worms Worms Worms Worms Password Stealers &
Monitoring Tools
Miscellaneous Potentially
Unwanted Software
Worms Miscellaneous Trojans
Miscellaneous Trojans
Trojan Downloaders
& Droppers
1Q10 21.30% 9.00% 7.30% 4.10% 6.50% 5.60% 7.00% 5.20% 2.30% 2.40%
2Q10 22.00% 9.80% 8.30% 6.90% 6.00% 5.40% 5.30% 3.40% 3.00% 2.70%
1Q10 2Q10
0%1%2%3%4%5%6%7%8%9%
Win32/Taterf Win32/Frethog Win32/Renos Win32/Rimecud
Win32/Autorun Win32/Hotbar Win32/FakeSpypro
Win32/Conficker
Win32/Alureon Win32/Zwangi
Worms Password Stealers &
Monitoring Tools
Miscellaneous Trojans
Worms Worms Adware Miscellaneous Trojans
Worms Miscellaneous Trojans
Miscellaneous Potentially
Unwanted Software
1Q10 4.80% 6.40% 8.80% 5.60% 3.80% 3.40% 4.10% 3.80% 4.80% 1.80%
2Q10 8.00% 6.90% 6.60% 5.70% 5.40% 5.30% 4.90% 4.70% 3.60% 3.10%
1Q10 2Q10
Threats at home
Threats in the enterprise

Malicious and Potentially Unwanted SoftwareOperating system trends
Number of computers cleaned for every 1,000 MSRT executions, by operating system, 2Q10
0.0
2.0
4.0
6.0
8.0
10.0
12.0
14.0
16.0
18.0
20.0
Windows XP RTM
Windows XP SP1
Windows XP SP2
Windows XP SP3
Windows Vista RTM
Windows Vista SP1
Windows Vista SP2
Windows 7 RTM
12.9
9.3
19.2
15.6
8.08.4
6.4
3.3
6.6
5.6
2.7
Client
6464Windows
Server 2003 SP1
Windows
Server 2003 SP2
Windows
Server 2008 SP2
Windows
Server 2008 R2 RTM
6.45.9
2.9
8.3
6.2
3.5
Server
64646432 323232 32 3232 32 32 32 3264

Security Intelligence Report
BATTLING BOTNETS FOR
CONTROL OF COMPUTERS
www.microsoft.com/sir

Example: Botnet in Action
1. “Malware author” grows botnet and makes available to “buyers”2. Access is purchased via
“Marketplace”
4. Botnet attacks seen at multiple
entry points
5. Botnet also serves to “recruit” additional bots
3. Botnet use
granted

Botnet Online Black Markets

C&C Mechanisms Used by Botnet Families in 2Q10
IRC38.2%
HTTP29.1%
P2P2.3%
Other30.5%

25 Locations with Most Bot Cleanings 2Q10
Country/regionComputers with bot cleanings
(1Q10)
Computers with bot
cleanings (2Q10)
Bot cleanings per 1000 MSRT executions
(bot CCM)
1 United States 2,163,216 2,148,169 5.2
2 Brazil 511,002 550,426 5.2
3 Spain 485,603 381,948 12.4
4 Korea 422,663 354,906 14.6
5 Mexico 364,554 331,434 11.4
6 France 344,743 271,478 4.0
7 United Kingdom 251,406 243,817 2.7
8 China 227,470 230,037 1.0
9 Russia 181,341 199,229 4.3
10 Germany 200,016 156,975 1.4
11 Italy 191,588 130,888 2.6
12 Turkey 91,262 98,411 4.7
13 Canada 96,834 87,379 1.4
14 Netherlands 115,349 77,466 2.5
15 Colombia 76,610 71,493 5.8
16 Portugal 83,379 68,903 5.7
17 Australia 72,903 66,576 2.8
18 Poland 87,926 62,704 3.9
19 Taiwan 52,915 54,347 3.4
20 Japan 63,202 52,827 0.6
21 Argentina 38,229 43,162 3.8
22 Saudi Arabia 33,283 40,793 5.5
23 Belgium 51,689 39,508 3.4
24 Chile 37,705 39,245 5.1
25 India 37,895 38,954 1.0

Bot Infection Rates 2Q10
• Worldwide botnet infection rate average: 3.2 CCM for 2Q10
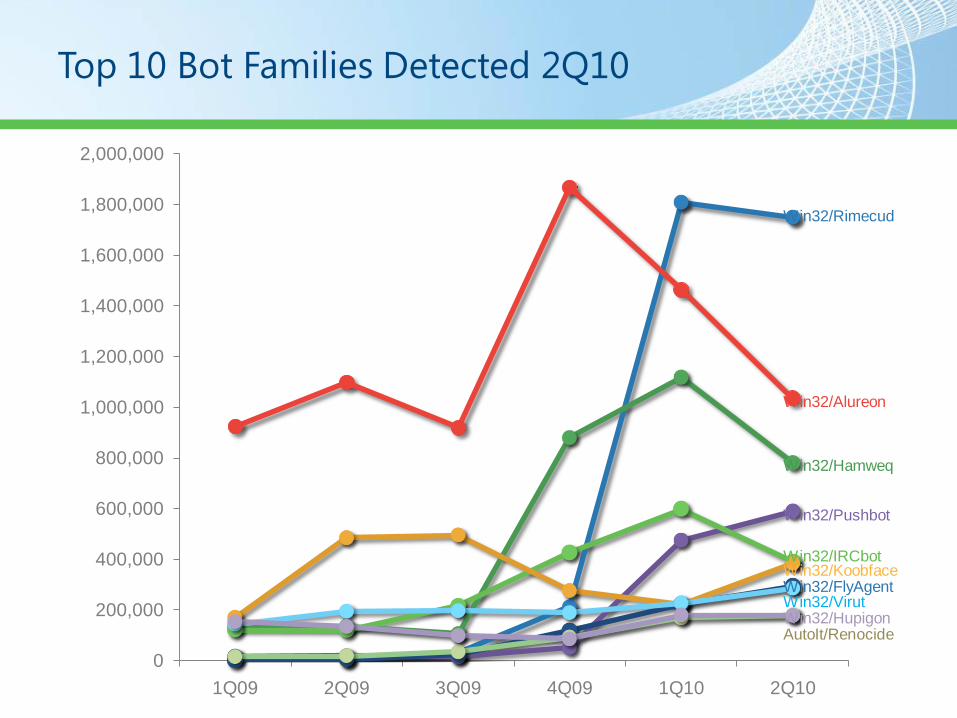
Top 10 Bot Families Detected 2Q10
0
200,000
400,000
600,000
800,000
1,000,000
1,200,000
1,400,000
1,600,000
1,800,000
2,000,000
1Q09 2Q09 3Q09 4Q09 1Q10 2Q10
Win32/Rimecud
Win32/Alureon
Win32/Hamweq
Win32/Pushbot
Win32/IRCbotWin32/KoobfaceWin32/FlyAgentWin32/VirutWin32/HupigonAutoIt/Renocide

Top 25 Bot Families 1Q10–2Q10
FamilyPrimary control
mechanism
Computers cleaned
(1Q10)
Computers cleaned
(2Q10)Change
1 Win32/Rimecud Other 1,807,773 1,748,260 -3.3% ▼
2 Win32/Alureon HTTP 1,463,885 1,035,079 -29.3% ▼
3 Win32/Hamweq IRC 1,117,380 779,731 -30.2% ▼
4 Win32/Pushbot IRC 474,761 589,248 24.1% ▲
5 Win32/IRCbot IRC 597,654 388,749 -35.0% ▼
6 Win32/Koobface HTTP 222,041 383,633 72.8% ▲
7 Win32/FlyAgent HTTP 221,613 293,432 32.4% ▲
8 Win32/Virut IRC 227,272 284,519 25.2% ▲
9 AutoIt/Renocide IRC 167,041 178,816 7.0% ▲
10 Win32/Hupigon Other 178,706 177,280 -0.8% ▼
11 Win32/Sdbot IRC 125,466 146,922 17.1% ▲
12 Win32/Nuwar P2P 8,098 133,951 1554.1% ▲
13 Win32/Bubnix HTTP 91,144 132,771 45.7% ▲
14 Win32/Zbot HTTP 107,363 131,078 22.1% ▲
15 Win32/Ursap IRC 121,239 121,302 0.1% ▲
16 Win32/Rbot IRC 145,107 110,316 -24.0% ▼
17 Win32/Pasur Other 95,040 91,612 -3.6% ▼
18 Win32/Rustock HTTP 82,712 52,312 -36.8% ▼
19 Win32/Slenfbot IRC 56,898 51,228 -10.0% ▼
20 Win32/Bagle Other 48,326 34,240 -29.1% ▼
21 Win32/Tofsee HTTP 29,367 32,031 9.1% ▲
22 Win32/Bifrose Other 28,966 30,466 5.2% ▲
23 Win32/Waledac P2P 83,580 29,816 -64.3% ▼
24 Win32/Prorat Other 26,913 25,726 -4.4% ▼
25 Win32/Trenk Other 24,093 21,749 -9.7% ▼

Short-term—Setting precedent
Botnet Takedown: WaledacWaledac botnet ―takedown approach‖

Notice Posted at www.noticeofpleadings.com

Active IP Addresses in the Win32/Waledac
Botnet 2Q10

FakeSpypro Rogue Security Downloaded by Waledac

Botnets Sending Spam
0%
10%
20%
30%
40%
50%
60%
70%
80%
90%
100%
Spam Messages IP Addresses
Lethic
Rustock
Cutwail
BobaxGrumStorm
All Others
Botnet spam messages Botnet IP addresses
sending spam

Protect Your EnvironmentRecommended actions
• Keep all software on your systems updated
– Third-party as well as Microsoft
• Use Microsoft Update, not Windows Update
– Updates all Microsoft software
• Run antivirus software from a trusted vendor
– Keep it updated
• Download the Microsoft Security Update Guide
– www.microsoft.com/securityupdateguide

Questions and Answers
• Submit text questions by using the Ask button
• Don’t forget to fill out the survey
• For upcoming and previous webcasts, visit
www.microsoft.com/webcast
• Got webcast content ideas? Contact us at
http://go.microsoft.com/fwlink/?LinkId=41781
© 2010 Microsoft Corporation. All rights reserved. Microsoft, Windows, Windows Vista and other product names are or may be registered trademarks and/or trademarks in the U.S. and/or other countries.
The information herein is for informational purposes only and represents the current view of Microsoft Corporation as of the date of this presentation. Because Microsoft must respond to changing market
conditions, it should not be interpreted to be a commitment on the part of Microsoft, and Microsoft cannot guarantee the accuracy of any information provided after the date of this presentation.
MICROSOFT MAKES NO WARRANTIES, EXPRESS, IMPLIED OR STATUTORY, AS TO THE INFORMATION IN THIS PRESENTATION.33