SIMULATOR STUDY OF DEEPWATER PORT SHIPHANOLING AND ... · Experienced VLCC masters and mates, some...
193
SIMULATOR STUDY OF DEEPWATER PORT SHIPHANOLING AND NAVIGATION--ETC(U) JAN 81 R C COOK. K L MARINO. R B COOPER DOT-CG-944467-A UNCLASSIFIED EA-O4.fr099 USCG-D-66-8O NL ;6 E,20 EEE0000 EE EE~hhEE~hElh EhmhEmhhEEohhE I IhohEEEEmhhmhE EEEmhEEEEEohEI
Transcript of SIMULATOR STUDY OF DEEPWATER PORT SHIPHANOLING AND ... · Experienced VLCC masters and mates, some...

SIMULATOR STUDY OF DEEPWATER PORT SHIPHANOLING AND NAVIGATION--ETC(U)JAN 81 R C COOK. K L MARINO. R B COOPER DOT-CG-944467-A
UNCLASSIFIED EA-O4.fr099 USCG-D-66-8O NL;6 E,20 EEE0000 EEEE~hhEE~hElhEhmhEmhhEEohhE
I IhohEEEEmhhmhEEEEmhEEEEEohEI

Report No. CG-D-66-80
A SIMULATOR STUDY OF DEEPWATER PORTSHIPHANDLING AND NAVIGATION PROBLEMS ,
IN POOR VISIBILITY
ECLECTECH ASSOCIATES, INC.
NORTH STONINGTON PROFESSIONAL CENTER
NORTH STONINGTON, CONNECTICUT 06350
ofTIA
JANUARY 1981
FINAL REPORT
Document Is available to the U.S. public through the
National Technical Information Service,
Springfield. Virginia 22161
Prepared for
U.S. DEPARTMENT OF TRANSPORTATIONC.., United States Coast GuardSOffice of Research and Development.Washington, D.C. 20593L-C.,
"

NOTICE
This document is disseminated under the sponsorship of the Departmentof Transportation in the interest of information exchange. The UnitedStates Government assumes no liability for its contents or use thereof.
The contents of this report do not necessarilv reflect the official viewor policy of the Coast Guard; and they do not constitute a standard,specification, or regulation.
This report, or portions thereof may not be used for advertising orsales promotion purposes. Citation of trade names and manufacturersdoes not constitute endorsement or approval of such products.

Technical Report Documentation Page
(" ; A Simulator Study of Deepwater Port Shiphandling and 31 anm~ l
to L 2 Go Accession No . 8. PeioinsCata 7on Repo t No.
'1/ R.C. Cook K.L.MarnoliI R.B.Coo rEA8UP99. fPe'fotrtr ng O tgan, za ','o ' Name oa Address
10 W o,k U n , Nc rRA I S)
Eclectech Associates, IncorporatedNorth Stonington Professional Centerrat.North Stonington, CT 06359 1 DOTCG-944467A .
13. Type od Report and Per,,d Covered12. Sionsoring Agency Name and Ad rPessDepartment of Transportation " / Final oedtU. S. Coast Guard (DMT-/5.)
_ _--_-Office of Research and Development 14. sor..g Agency CodeWashingngt,
D. C. 205905 sopyle......y Not.. The U. S. Coast Guard Project Manager and Monitor were Dr. John S.
Gardenier and LTJG Paul T. Neiswander, respectively. Advice and guidance were provided byCAPT James T. Montonye, LCDR Leo Vaske and Mr. David A. Walden.
16 Abstract
The study used a ship's bridge simulator to investigate safety of navigation, the effect ofnavigation displays, and the effect of bridge personnel organization during low visibilityapproaches of a VLCC to a deepwater port complex. Experienced VLCC masters and mates,some team trained and team organized, performed over 90 simulated approaches to theLouisiana Offshore Oil Port (LOOP) using either radar, radar with added racons in the area anautomatic radar plotting aid (ARPA), or an ARPA displaying fairway boundary lines. Threescenarios were examined: a landfall approach, coastwise approach, approach to pick up themooring master, and a dead reckoning approach with degraded position information. Strategieswhich were chosen by the masters in their approaches are described in light of their effect ondeepwater port safety. Conclusions derived from descriptive and statistical evidence ofperformance led to recommendations for relocating the mooring master pickup point, providingan anchorage for use by masters, and the placement and implementation of racons within thedeepwater port area. Other recommendations advocate the use of special bridge procedures andnavigation systems during port approaches, and further research into the effect of trafficseparation or advisory schemes on deepwater port safety. Findings suggest that whileapproaches of VLCCs to an offshore deepwater port under conditions similar to those simulatedare not deceptively difficult or inherently unsafe, there are opportunities to mitigate thepotential for hazardous navigation and shiphandling problems.
I;. Key Wo,ds I. Distrbuton Stawere,
Louisiana Offshore Oil Port (LOOP), port I Document is available to the public throughdesign, oil port, oil terminal, deepwater the National Technical Information Serviceport, offshore port, inshore port, Gulf of Springfield, VA 22161Mexico port, port approach, port navigation,port safety, navigation hazard, (Cont'd)
19 SeCr ty C os $., or r '.,s renc.in ,r 20 . S ecurrtr tlo . it r 1hs p a ge) 2). N o or P a ;es 2. P ce
UNCLASSIFIED UNCLASSIFIED 188
Form DOT F 1700.7 Reprod.cton of completed page acru or,ted
w 11 11 II-4'... ... ..

17. Key Words (Cont'd)
navigation risk, navigation safety, navigation workload, shiphandling, ship control,hazard avoidance, trackkeeping, human factors, low visibility, anchorage, pilotage,mooring master, ship simulation, chart design, very large crude carrier (VLCC),supertanker, navigation systems, navigation equipment, navigation displays, bridgedisplays, aids to navigation, radar navigation, racon, radar, collision avoidance system(CAS), automatic radar plotting aid (ARPA), loran, radio direction finder (RDF),Fathometer, bridge team training, crew organization, bridge procedures, operatingguidelines, safety fairway, traffic advisory, traffic separation, traffic lanes
ii

ACKNOW LEDGEMENTS
The authors wish to express their appreciation to Dr. John S. Gardenier, Officeof Research and Development of the U. S. Coast Guard, for his close personalguidance throughout the experiment. They also wish to thank LTJG Paul T.Neiswander, Office of Marine Environment and Systems, whose contributions duringthe planning and analysis phases of the study ensured its success.
Special recognition is due CAPT James T. Montonye, LCDR Leo Vaske, and Mr.David A. Walden, all of the U. S. Coast Guard, for their enthusiastic interest in theproject and continued advice throughout its conduct.
Finally, the authors wish to thank the more than 30 masters and mates fromaround the world who took time from their busy schedules to provide consultation oract as subjects during the simulation.
F1
~1
ii

* -- A-0
E E0
01 9* I If
e 0
cc- vs 4
- iv

TABLE OF CONTENTS
Section Title Page
I EXECUTIVE SUMMARY I
1.1 Overview 11.2 Findings and Conclusions 2
2 BACKGROUND AND OBJECTIVES 4
2.1 Purpose of the Research 42.2 Objectives of the Experiment 5
3 THE EXPERIMENT 7
3.1 Description of the Presimulation Process 73.2 Experimental Variables 163.3 Scenario Design 213.4 Subject Selection 283.5 Simulation 293.6 Data Collection 32
4 DATA ANALYSIS 34
4.1 Description of the Analysis Process 344.2 Derivation of Landfall Approach Strategies 364.3 Derivation of Coastwise Approach Strategies 494.4 Derivation of Mooring Master Pickup Approach Strategies 654.5 Derivation of Degraded Dead Reckoning Approach 804.6 Analysis of Questionnaires and Subjects' Recommendations 94
5 CONCLUSIONS AND RECOMMENDATIONS 1025.1 Research Questions 1025.2 Categories of Evidence 102
5.3 Conclusions on the Safety of Navigation in Deepwater PortApproaches 103
5.4 Conclusions on the Effect of Navigation Displays and BridgePersonnel Organization in Deepwater Port Approaches 110
5.5 Specific Recommendations 112
Appendi x
A STATISTICAL COMPARISON IN CROSSTRACK VARIABILITY A-I
B TRACK PLOTS BY CONDITION SHOWING MEAN TRACK ANDPLUS OR MINUS TWO STANDARD DEVIATION CROSSTRACKVARIABILITY B-I
C EXAMPLE OF QUESTIONNAIRES C-i
BIBLIOGRAPHY
v

LIST OF ILLUSTRATIONS
Figure Title Page
1 Average Times Required To Plot Navigational Fix Data 10
2 Master Preferences for Deepwater Port Approaches 14
3 Position of Added Racons 15
4A Representative Radar Display 19
4B Representative Radar Display with Racons 19
5A ARPA Course and Speed Vector Display 20
5B ARPA with Navigation Display Option 20
6 Landfall Approach Scenario 22
7 Coastwise Approach Scenario 24
8 Mooring Master Pickup Approach Scenario 25
9 Degraded Dead Reckoning Approach Scenario 27
10 Experimental Design 30
11 Individual Ship Tracks During the Landfall Approach 37
12 Three Strategies of the Landfall Approach 38
13 Dominant Strategy of the Landfall Approach 39
14 Secondary Strategy "A" of the Landfall Approach 47
15 Secondary Strategy "B" of the Landfall Approach 48
16 Individual Ship Tracks During the Coastwise Approach 51
17 Three Strategies of the Coastwise Approzch 52
18 Dominant Strategy of the Coastwise Approach 54
19 Secondary Strategy "A" of the Coastwise Approach 5,5
20 Secondary Strategy "B" of the Coastwise Approach 56
21 individual Ship Tracks During the Mooring Master Pickup Approach 67
22 Three Strategies of the Mooring Master Pickup Approach 69
23 Dominant Strategy of the Mooring Master Pickup Approach 70
24 individual Ship Tracks During the Degraded Dead Reckoning Approach 81
25 Three Strategies of the Degraded Dead Reckoning Approach 82
26 Dominant Strategy of the Degraded Dead Reckoning Approach 83
27 Dominant Strategy Tracks with Radar/Racon Enhancement 86
28 Dominant Strategy Tracks with ARPA Enhancement 87
29 Dominant Strategy Tracks with Radar Enhancement 90
vi

LIST OF TABLES
Table T;tle Page
I Composite Hazard Ranking 8
2 Navigation Workload Data Recorded at Sea 9
3 Interview Subject Experience and Qualifications 11
4 Typical Equipment Accuracy/Errors 17
5 Data Collecte'd for Deepwater Port Experimental Analysis 33
6 Ship Control and Course Keeping- Landfall Approach, DominantStrategy 41
7 Navigation Workload - Landfall Approach, Dominant Strategy 43
8 Hazard Avoidance - Landfall Approach, Dominant Strategy 44
9 Summary of Landfall Approach Performance 50
10 Ship Control and Course Keeping - Coastwise Approach, DominantStrategy 57
I I Navigation Workload- Coastwise Approach, Dominant Strategy 58
12 Hazard Avoidance - Coastwise Approach, Dominant Strategy 59
13 Summary of Coastwise Approach Performance 66
14 Ship Control and Course Keeping - Mooring Master Pickup Approach,Dominant Strategy 72
15 Navigation Workload - Mooring Master Pickup Approach, DominantStrategy 73
16 Summary of Mooring Master Pickup Approach Performance 77
17 Reorientation and Position Fixing - Degraded Dead ReckoningApproach, Dominant Strategy 85
18 Ship Control and Course Keeping - 0egraded Dead ReckoningApproach, Dominant Strategy 88
19 Navigation Workload - Degraded Dead Reckoning Approach,Dominant Strategy 89
20 Factors in the Resolution of Actual Position for the Dominant
Strategy 92
21 Summary of Degraded Dead Reckoning Approach Performance 95
22 Summary of Questionnaire Results 96
23 Subject Recommendations 101
24 Hazard Avoidance tor All Display Enhancements and All Bridge
Organizations 105
25 Shiphandling and Navigation for All Display Enhancements and
All Bridge Organizations 107
vii

Section 1
EXECUTIVE SUMMARY
1.1 OVERVIEW
In early 1981, the Louisiana Offshore Oil Port (LOOP) will begin operation as theUnited States' first offshore deepwater port. Other deepwater port projects are invarious stages of planning. These include energy islands off the east coast andinshore deepwater terminal facilities such as those proposed in Galveston and CorpusChristi, Texas. The U.S. Coast Guard, in response to requirements of the DeepwaterPort Act of 1974, has undertaken a broad based research program to examine theissues affecting safe operation of large ships in connection with deepwater portoperations; and to take action to mitigate hazards which are identified.
Included in the research program have been fast-time simulation studies of vesselmaneuvering characteristics to define the size and shape of precautionary areas;hazard and risk analysis to identify and assess the risk of incidents resulting fromdeepwater port operations; and studies designed to improve hydrodynamic simulationmodels through empirical measurement and at-sea observation.
This research is a direct follow-on to the study of likely hazards and risks oftanker approaches to an offshore deepwater port. That study concluded that themajor navigation hazards were human factors and weather. The areas of highestnavigational risk were identified to be the straits entering the Gulf of Mexico andthe areas immediately adjacent to the deepwater port where intersecting fairwaysand the high density of offshore structures complicated ship operations. Lowvisibility and vessel traffic are other principal hazards expected in the Gulf ofMexico.
A systematic study of low visibility approaches to a deepwater port was neededto reveal hazards in port approaches and to identify any procedural or navigationalenhancements that would increase safety.
This is the first U. S. sponsored study to methodically examine the transition oflarge ships from open ocean operations to the port approach. Previously this pnaseof the transit, which may be its most critical portion, has received little attention.The ship's crew, after directing the vessel for several thousand miles across the openocean, must make a landfall and conduct an approach through an area that may beboth unfamiliar and hazardous. Although this study was developed in the context ofapproaches to the LOOP complex, its findings and conclusions could be generalizedto inshore and offshore deepwater ports in the Gulf of Mexico and elsewhere.
The research was conducted using the ship bridge simulator at EclectechAssociates, Inc. to evaluate the safety of deepwater port approaches and identifythe effectiveness oi display enhancements and bridge team organization on thetransits under poor visibility conditions. Twelve very large crude carrier (VLCC)masters and mates representing five nationalities conducted over 90 simulatedapproaches using radar, radar with racons, and two different automatic radarplotting aid (ARPA) displays. Test subjects were chosen to represent likely users ofan offshore deepwater port in the Gulf of Mexico. All transits were conducted inreal time using typical bridge and navigation equipment, and charts. Loran, radiodirection finder (RDF), and Fathometer information was available.

Care was taken to develop a realistic simulation program to achieve the researchobjectives. Interviews were conducted with VLCC operators to characterize likelyapproach processes and strategies. Navigational charts werte augmented with thedeepwater port fairways and structures. The hydrodynamic ressponse of a 280, 0dwt oil tanker was carefully modeled for all likely mane'pr, 1,) liJding slowing,backing, and turning. Displays were developed to reprfs-mt the h.iricteristirs ofradar, racons, and ARPAs. Realistic traffic and offshore st it jr" de'.s!ties weremodeled for each scenario.
Both the simulator system and trained observers re-jrd,! tIr OkIoJt theexperiment. At the end of each simulation, subject co(- .n ,s were
also obtained. Results and conclusions of the study -&e rtti. , ' f>)w)igparagraphs.
1.2 SUMMARY OF FINDINGS AND CONCLUSIONS
Conclusions of the study are based upon a logical rhi.'- of evidence frominterviews, research notes, simulation observations and a stAtistical analysis ofquantitative data which were recorded during the experiment.
1.2.1 Safety of Navigation in Deepwater Port Approaches
The simulation scenarios provided a maximum freedom of choice to masters intheir selection of approach strategies. While hazardous navigational and trafficsituations could have developed, no difficulties leading to a collision or groundingoccurred. In approaching the mooring master pickup point, proficiencies for speedcontrol and maneuvering were demonstrated to adequately receive the mooringmaster or from which a safe contingency was possible in the event the mooringmaster was delayed. When degraded navigation information resulted in an erroneousship's position, all masters responded characteristically and safely (I) to detect theerror, (2) to establish and confirm their actual position, and (3) to maneuver to anappropriate new course for the fairway.
Finally, although all transits were not error free, the waterway design wasroutinely tolerant of those which did occur. Findings suggest that while approachesof VLCCs to an offshore deepwater port under conditions similar to those simulatedare not deceptively difficult or inherently unsafe, there are opportunities tomitigate the potential for hazardous navigation and shiphandling problems.
1.2.2 Effect of Aids to Navigation, Personnel Organization and Bridge Equipment onDeepwater Port Approaches
Conclusions and specific recommendations of the study apply directly to Gulf ofMexico deepwater ports. Many of the findings reported are also relevant to inshoreports and offshore ports in other areas. For example, the study showed that themajority of masters entered and remained within the safety fairway when it wasclose to the ship's route. For approaches where complying with the safety fairwaywould have required traveling considerably "out of the way," most of the mastersselected a more direct course to LOOP outside the fairways. Masters' selection ofpoints of entry into the safety fairways resulted from tradeoffs in satisfactorilyclearing all traffic and rigs, and entering the safety fairway without majormaneuvering. Such behavior could be expected at any inshore or offshore port thathas safety fairways.
2

The study also concluded that slowing to pick up the mooring master as well asmaneuvering in the event the mooring master is delayed could be significantlyimproved by (1) removing the dogleg near the pickup point or relocating the pickuppoint further south, and (2) providing a convenient, well-marked anchorage for useby masters in the event the mooring master is unavailable. Additional recommendations to aid in the deepwater port approach are the development of operatingguidelines which describe the unique navigational characteristics of the portincluding rig patterns and racon usage, and a port specific chart of appropriate scaleand coordinates.
Conclusions of the study also show that when racons are provided, masters usethem as a single point range or for radar parallel indexing. The result is a focusingof tracks toward the racon. Use of ARPA with a navigation option display produceddifferent effects. The clear delineation of fairway boundaries and implied highprecision of the system enabled masters to choose alternative tracks either in thecenter or along the right edge of the fairway.
While both of these behaviors were shown to result in safe operation during thesimulation, this study alone cannot determine which of the behaviors is moredesirable in terms of deepwater port safety arid operating effectiveness. Additionalcontrolled experimentation unique to racon and ARPA, utilization is recommended.
The study also concluded that traffic encounters as they were simulatedpresented no undue hazard or difficulty during the port approach. There wereindications based upon demonstrated navigation capabrlity and achieved CPAs that ifadditional fairway traffic had been present it ,vould have bec:n handled safely.Traffic separation schemes and a traffic advisory service for deepwater ports werenot examined in this project. Decisions on these topics should be derived from amore explicit and comprehensive study of the traffic problem.
Comparisons in navigation and shiphandling performance between traditionallyorganized bridge personnel and team organized crews showed no difference withrespect to safety or overall operational effectiveness. These were a number oftechniques employed by the team organization which augmented the approaches anddemonstrated an increased capability to deal with contingencies. These techniquesinclude preplanning the approach, delegation of duties, review of contingencyactions, cross-checking procedures and assuring effective communications. Thestudy recommends implementing certain of these techniques in the deepwater portapproach, possibly through operating manuals or port guidelines.
The availability of multiple aids to navigation systems were shown to facilitatethe transition from open-sea to the port approach phase of the voyage. Also, duringthe approach which occurred under conditions of degraded navigational accuracy,multiple aids provided an additional margin of safety arid aided in determining actualposition. This extra aid further promoted an early initial identification of rigpatterns on the radar, thus enabling masters to confirm their position and morejudiciously maneuver to the fairway.
Additional findings and subsequent detailed recommendations are presented inSection 5 of the report. While this research supports the conclusions of the earlierdeepwater port risk and hazards analysis, that approaches to an offshore deepwaterport will nornally be safe and rotine even under moderately severe environmentalconditions, the research raises add~tir,al major issues relevant to port design,operating pro-edures, navigator) systems and personnel qualifications.
3

Section 2
BACKGROUND AND OBJECTIVES
2.1 PURPOSE OF THE RESEARCH
Although about 100 offshore oil ports exist around the world, the first offshoredeepwater port to be constructed in the United States will begin operation in 1981.The Louisiana Offshore Oil Port (LOOP) is located in the Gulf of Mexicoapproximately 40 miles west of the Southwest Pass into the Mississippi River. TheU.S. Coast Guard has a variety of responsibilities under the Port and Tanker SafetyAct of 1978 and the Deepwater Ports Act of 1974 related to LOOP and subsequentoffshore ports proposals. These responsibilities have prompted a broad researchprogram aimed at evaluating and minimizing potential hazards to navigation and riskof oil spills resulting from tanker operations associated with operation of adeepwater port.
Under most conditions, the approach of very large crude carriers (VLCCs) to adeepwater port should be routine, uncomplicated, and safe. The approach has beenaided by the designation of safety fairways and vessel traffic advisory servicesprovided at the deepwater port facility. Nevertheless, VLCC masters approachingthe port can encounter a combination of hazards. Immediately adjacent to thefairways are oil and gas production platforms. There is cor, istent small boat trafficbetween rigs and around fishing grounds and other VLCCs transiting into and out ofthe facility. The use of safety fairways is not mandatory, and those fairways maynot always provide the most economical routes to a vessel's destination. Poorvisibility is not unusual in the vicinity of deepwater ports. Unusual currentconditions may also be encountered. Any one or all of these factors could lead to"competent" errors on the part of a shiphandler in the vicinity of a deepwater portwhich would induce significantly increased risk of an oil spill accident.
Navigation and shiphandling during poor visibility in and about the deepwaterport proposed for construction in the Gulf of Mexico are made difficult by acombination of conditions. The principal factors contributing to these difficultiesare the lack of easily identifiable landmarks on radar and the potential formisinterpreting radar patterns from surrounding oil rigs, vessels, and aids of
navigation. A recently completed study I indicates that oil spillage risks associatedwith navigation of large tankers into and through the Gulf of Mexico to theLouisiana Offshore Oil Port (LOOP) deepwater port are not large and appear smallerthan for alternate modes of shipment. Nevertheless, the U.S. Coast Guard isendeavoring to reduce these few risks even further.
This project is only one element in the broad Coast Guard research program toaddress issues related to the safety of operation of VLCCs in association withoffshore deepwater ports.
Previous research into deepwater port vessel operations attempted to evaluatepotential hazards to navigation and oil spill risks resulting from tanker operationsassociated with a deepwater port in the Gulf of Mexico and examined the necessary
'Faragher, W.E., J.T. Pizzo, et al. Deepwater Ports Approach/Exit Hazard and RiskAssessment. Report Number CG-D-79, February 1979.
4

size and configuration of safety and precautionary areas surrounding a deepwater
port.2
Results of the studies were not totally conclusive based in part on inconsistencyof relevant data and because there was no direct deepwater port data upon which tobase the risk evaluations. Nevertheless, the Coast Guard was able to conclude thatthe means of mitigating the hazards associated with deepwater port operations maybe more procedural and commonplace and do not require exotic, high technologysolutions. The simulation study reported herein was conducted to complement thefindings of the hazard and risk assessment by providing a characterization andunderstanding of the likely transit strategies and performance data associated withapproaches to an offshore deepwater port in poor visibility. It provided theopportunity to examine large vessel transits associated with port approaches undercontrolled conditions. Through this process investigators identified the importantelements of the approach process and the impact on VLCC operator approachstrategy as a function of navigation display enhancements and bridge personnelorganization.
The results of this study provide important insights into the port approachprocess and suggest possbile operating procedures and general navigation enhance-ment options which would impact the safety of vessel transits through the area.
While the experiment was conducted using a LOOP area approach scenario, thefindings of this report are not uniquely applicable to LOOP. Instead, they can beconsidered appropriate for general application to port approaches where safetyfairways, stationary and moving hazards, and the potential for ambiguous radarpatterns exists.
2.2 OBJECTIVES OF THE EXPERIMENT
The objectives of the deepwater port simulation study were to:
" Determine which combinations of hazards, if any, present serious precisionnavigation problems to VLCC masters in the vicinity of the deepwater portsand which mitigating measures appear most desirable in terms of effective-ness, timing and ease of implementation.
" Appraise the value of potential electronic aid enhancement that may be moregenerally applicable to offshore and shoreside ports, and the full mix ofvessels that use them.
To accommodate these research objectives, an experiment was designed in whichexperienced VLCC bridge personnel would be permitted through simulation to entera deepwater port complex much as they would in real world conditions. Controlledvariables were introduced in order to examine the full spectrum of proposeddeepwater port operations. This included varying the type of bridge personnelorganization, the navigation equipment available to them, and the possibility ofapproaching the complex from different geographical locations or with degradednavigation information as a result of equipment failure.
2 ]bid.
• ' ' -i i ,ll . , b... ...

Since prior to the study it was relatively unknown how masters and mates wouldoperate in the deepwater port environment, a review of relevant research andinterviews with numerous VLCC crews was con,-;cted. This endeavor, known as thepresimulation process, laid the groundwork for the selection of experimentalvariables, the detailed design of scenarios, and for the measures employed in theevaluation of performance.
6

Section 3
THE EXPERIMENT
3.1 DESCRIPTION OF PRESIMULATION PROCESS
Before designing the experiment and data collection methodology, a review ofrelevant research and interviews with VLCC masters and mates regarding deepwaterport approaches was conducted. The highlights of this presimulation process arepresented in the following sections.
3.1.1 Review of Relevant Research
In September 1977, the U.S. Coast Guard initiated a program to evaluatepotential hazards to navigation and assess the risk of oil spills resulting from
deepwater port tanker transits in the Gulf of Mexico. 3 This study used the U.S.Coast Guard's Vessel Casualty Reporting System (VCRS), Pollution IncidentReporting System (PIRS), Tanker Casualty Files (TCF), and at-sea observations toidentify causal factors resulting from a potential vessel accident in and arounddeepwater ports. As a result, the study made basic assumptions regarding tankeroperations and deepwater port transits.
The project compiled a hazard criticality index which reflects the relativecontribution of each hazard to vessel operations over the deepwater port transit.The results of this analysis are shown in Table 1. Since the objectives of thedeepwater port simulation study are to address all potential navigation andshiphandling hazards in approach to the LOOP complex, categories 2 through 5 ofthe Composite Hazard Ranking appeared applicable. Otherwise all other applicablehazards identified in the report were considered in the design of the experiment.
In 1976, during a standardized bridge study 5 conducted for the MaritimeAdministration, at-sea performance data was collected aboard a variety of merchantvessels. Data collected during the study included documentation of deck officerperformance aboard tankers in the Gulf of Mexico between New Orleans, Louisianaand Port Arthur, Texas. Radar contact and workload data were coded and compiledfor computer analysis. Workloads based on the observed performance were thenprojected to describe future open sea, U.S. coastwise and English Channeloperations. Those data pertaining to task allocation, navigation tasks performed andtime to complete typical tasks were used to characterize hardware requirements andpredict subject activity prior to deepwater port simulation experiments.
3 Ibid.
4 Bertsche, W.R. and A.. Pesch. An Automated Standardized Bridge Design for theU.S. Merchant Marine. Report Number EAG-76-38006, U.S. Department ofCommerce, Maritime Administration, January 1977.
5 Bertsche, W.R. and J.A. Walsh. "Impact of Bridge Design on the Navigation of
Ships." Presented to the International Association of Lighthouse Authorities, 1979.
7

U'N Uf, f , M~ (%4 C4 e C4
4n
L N 4)4
u . CL 0 -:
m fel c (N
CL
.L. ;;
< C > --
4- &) m4)r4
N 04
.e* LL rei N
> C)>
o -
I-.- -
Nr- ell~ C4 C4 (4 (4 0
4- 4)
00-C TZ C: 6
ui tj 0

Analysis of the Navigation Function Performed At Sea. The term navigationfunction collectively describes tasks performed by mates on the bridge which relatedto position fixing of their vessel. The tasks included acquiring visual and electronicfix data, plotting the fix data on charts, performing related navigation calculations,reviewing navigation publications, and updating charts. Table 2 illustrates theobserved navigation workload distribution as a percentage of overall bridge time.Workload during collision avoidance, communications and other watch functions wasalso reviewed. Percentage of time allocated to these tasks, however, was found tovary widely by circumstances not unique to port operations. As a result, thisworkload distribution is not reported.
Operator performance during an approach to an offshore deepwater port in theGulf of Mexico is expected to be similar to a U.S. coastwise transit where relianceon radar navigation will prevail and loran or satellite fixes will be used to augmentradar fixes.
It was expected that about 10 to 15 percent of the mate's time would bededicated to navigation tasks during the simulation runs. The data base alsoindicated that negligible differences appear to exist between navigational workloadsat night and during the day in restricted waters. An increase in navigation workloadwas observed, however, during periods of poor visibility and in the presence ofincreased navigation hazards (i.e., in more restrictive waters). These data indicatethat although a relatively equal amount of time was allocated to obtaining fixes, themate spent additional time rechecking and verifying his fix in the presence ofincreased navigation hazard.
TABLE 2. NAVIGATION WORKLOAD DATA RECORDED AT SEA*
Percentage of Time
U.S. English English ChannelWorkload Open Sea Coastwise Channel Limited Visibility
General navigation tasks 3.2 4.8 8.0 22.2
Plot all fix data 3.0 3.8 5.4 9.4
Obtain radar data 0.5 1.4 0.9 1.5
Obtain loran data 3.4 0.5 -- --
Obtain Decca data -- -- 1.1 0.8
Obtain ROE data --- - - --
Obtain fathometer data -- 0.1 -- --
Obtain visual bearingsdataj 0.1 2.3 0.4 0.7
Obtain sun and starfix data -- 0.1 --
Total all navigation tasks 10.2 12.9 15.9 34.6
*Froin Reference 4
9

Electronic Fixing Tasks and Equipment. Analysis of workload data indicated thatthe average time to obtain and plot fix data does not vary significantly as a functionof equipment used. Figure 1 illustrates that the average time required to plot anavigational fix varies from 90 seconds for a radar range and bearing to about 2minutes for loran coordinates, Decca coordinates or latitude and longitude. It is dueto tihese relatively small differences observed, that loran data obtained during thesimulation will be provided as latitude and longitude, representative of outputobtained by an commercial loran receiver and processor.
Additional evidence indicated exclusive reliance on loran, omega, satellite, etc.in open sea operations. Fixes were taken about once an hour. Radar appeared to bethe primary navigation tool used in U.S. coastwise operations and in the EnglishChannel. In the coastwise transits, frequency of fixes increased to about three perhour.
Two other navigation systems, the Fathometer and RDF were seldom used. TheFathometer was utilized primarily for detecting depth contours when making alandfall. The RDF was also used at this time to obtain bearing information on keyaids to navigation.
inI
I,'' INU t AT L H' k
FIGU.RE 1. AVERAGE TIMES REQUIRED TO PLOT NAVIGATIONAL FIX DATA
10

3.1.2 Summary of Master and Mate Interviews
Because the LOOP project is not yet operational, there are no pilots or VLCCmasters familiar with its operation. To augment the hazard and risk analysis and toimprove the characterization of the likely navigation process associated withapproaches to LOOP, interviews were conducted with mariners who had combinedexperience in (1) the Gulf of Mexico, (2) other deepwater port installations, and (3)VLCC operations. These individual subject qualifications are summarized in Table 3.
The interviews were structured to reveal a characterization of VLCC transits toan offshore deepwater port such as the LOOP complex. Charts of the Gulf ofMexico and local LOOP vicinity were provided for annotation and discussion. Eachinterview subject was asked to project himself into the LOOP operating area fromeither the Florida Straits or the Yucatan. As the discussion focused on the approachto the LOOP safety fairways more detail was elicited from the masters regardingtheir use of speed, radar, personnel, and navigation aids to assist their approach tothe deepwater port.
Following the description of a routine transit to a Gulf Coast deepwater port,discussions of operating limitations, risks, and additional navigation assistance wtreconducted. These identified possible navigation display enhancements that would beof significant assistance during vessel transits to the deepwater port. Theinterviews were open ended to cover all the desired material without unduly
TABLE 3. INTERVIEW SUBJECT EXPERIENCE AND QUALIFICATIONS
SUBJECT I 38 years licensed deck officer13 years as a masterCurrently master of 265,000 dwt VLCCCurrent operations - Persian Gulf and Phillippines
SUBJECT 2 35 years licensed deck officer20 years as a masterRecently retired master of 265,000 dwt VLCCSignificant experience in the Gulf of Mexico
SUBJECT 3 36 years licensed deck officer23 years as a master and pilotCurrently master of a 165,000 dwt oil tankerCurrent operations - Alaska to Panama CanalLittle experience in the Gulf of Mexico
SUBJECT 4 Current masters license - serving as chief mateCurrently operating Panama Canal to Gulf Coast PortsSignificant experience in gulf coastal operations
SUBJECT 5 39 years as a licensed pilotVLCC pilot and pilot instructor at Limetree Bay, St. CroixPiloted over 200 VLCC's in excess of 100,000 tonsConsultant on pilotage matters
II

influencing the masters. In this way the interviews obtained the desired informationdevoid of preconclusions. The results presented in the following paragraphssummarize this sample group's prior assessment of the way in which they wouldtransit and improve the navigation system associated with Gulf of Mexico deepwaterport operation.
Use of the Safety Fairways. The consensus was that the fairways were placedalong a reasonable track from either the Florida Straits or the Yucatan. For themost part the subjects stated that they would routinely use the fairways. Themaster's previous operational experience in gulf coastal operations appeared toinfluence his expected use of the fairways. The most experienced masters felt leastinclined to insist upon use of the fairway, and the master with the least experiencein the Gulf of Mexico indicated that he would enter the safety fairway well to thesouth of the existing east-west safety fairway. Several of the masters commentedthat although use of the fairways was not mandatory, they assumed that casualtiesoccurring outside of the safety fairways would impose an additional liability on thevessel master for not keeping to the established shipping lanes. All of the masterscommented on the jogs in the safety fairway, prefering that the approach be asstraight as possible.
Navigation Systems. During the open ocean approach to a deepwater port, initialreliance would be on celestial and long range electronic aids such as satellite andloran. These aids would be augmented by interpretation of radar displays,Fathometer, and radio direction finding equipments as the vessel began its approachto the fairways. Several of the masters indicated that they would continue to relyon loran and satellite navigation systems well into the safety fairways, using thelocal aids primarily as back-up to confirm the electronics systems. Where the radarpatterns began to provide a clear indication of the ship's location, there would be ashift to radar navigation for the final phase of the approach. Masters indicated thatthey would use radar fixes on identified rigs to monitor their ship's position. Onemaster said that where possible he would align his track with rigs on radar much thesame as a pilot would use a visual range to navigate a channel. Fix frequency wouldvary, while the masters implied that they would determine their position frequently,it appeared that actual plotting of fixes on the chart would occur from 15 minuteintervals to hourly.
Radar Range Scales. The masters stated that they would typically use longerrange scale (24 miles) during the initial approach to the safety fairways. As theyproceeded up the fairways, their attention would focus on the area 10 to 12 milesfromr their vessel. Due to the expected high concentration of rigs and vessels in theimmediate vicinity of the deepwater port, they would prefer to focus on closer-inconditions. One master stated that he used a rule of thumb for selection of a rangescale which allowed him to observe tile area within one-half hour steaming from hisvessel. All of the masters indicated that they would change range scale periodicallyto examine significant contact threats or to orient themselves to the larger area.All agreed that land returns in this area were unreliable as navigation aids.
Minimum Clearance to Offshore Oil Rigs. The masters interviewed indicatedthat they would maintain a minimum clearance from offshore rigs of from 1/2 to 2nautical miles. They did not appear to be concerned with the existence of the rigseven under poor visibility conditions. Masters' primary concern was thle presence ofuncharted rigs and the small supply craft which accompany rigs. For the most partthe rigs would: (1) provide recognizable patterns on radar, (2) serve a: aids tonavigation, and (3) tend to add to the radar contact level, and consequently to theoverall radar workload.
12

Environmental Conditions. Tiie masters tended to minimize the effect of windon a fully loaded VLCC. Current could become a problem if the vessel was requiredto wait for the mooring master to arrive at the pickup point, but concern overenvironmental effects on approach operations was limited to the severe "northers"and hurricanes experienced in the Gulf of Mexico.
Bridge Watch. The masters agreed that they would be on the bridge, andcontrolling the ship during the approach to the deepwater port. Along with a mateand helmsman, they would conduct the transit under normal conditions. In severeweather or limited visibility an additional lookout and/or radar operator would beadded to the bridge team.
Risks and Hazards. All of the masters interviewed felt that transits to a gulfdeepwater port would be routine and safe under normal conditions. Their universalassessment was that the presence of traffiAc was the most significant hazardassociated with the port approach. Fishing vessels, offshore supply boats, andcrossing coastal traffic were specifically identified. Other hazards mentioned bythe masters were uncharted rigs, excessive vessel speed, and reported obstructionsidentified on area charts.
Transit Speeds. Figure 2 illustrates the point at which masters indicated theywould be at maneuvering speed. While this point varies over a 20 mile band, itappears to illustrat(-- the master's perception of where the open ocean transit and theport approach begins. Those masters most familiar with operations in the Gulf ofMexico tended to wait longer to reduce from sea speed, and the master whoindicated that he might maintain sea speed to within 7 or 8 miles of theprecautionary zone was the only non-VLCC master.
At approximately the point where an oil rig is just to the west of the safetyfairway, all of the masters would begin to slowv toward a final mooring master pickupspeed of 2 to 3 knots. One of the masters stressed that speed changes should bemade continuously from maneuvering speed to final approach speed and that thevessel's speed versus time curve should be a straight line at any point in theapproach. This would provide a smooth transition to the pickup point and alleviatethe problem of excessive speed in the final approach and delays caused by slowingtoo soon.
Failure of the Mooring Master to Meet the Ship. In the event that the mooringmaster did not arrive at the pickup point on schedule, the masters felt they couldmaintain their position in the fairway for up to 2 hours. If the anticipated delaysexceeded 2 hours, thle masters indicated that they would leave the safety fairwayand anchor in the vicinity of the precautionary zone. Individual preferences for thleanchorage (Figure 2) were based on avoiding other traffic or rigs and finding shallowwater to anchor.
Preferred Navigation Enhancements. All of the masters had experience withracons and felt that racons in addition to the one on the pumping platform wouldassist the transit. The desired location of one additional racon is indicated on Figure3. Typically, the masters were looking for an aid to navigation placed at theintersection of the east-west and north-south safety fairways. Several of themasters indicated a preference for buoys to mark the final leg of the safety fairway.One of the masters stated that in his mind he organizes a voyage by stages. Stageone is the open ocean transit. The transition from stage one to stage two is marked
13

ANCHORING A REAS
2- K, S
MANEUVERING SPEED
SEA SPEED .
.0 At
., 9 3 o40 3
*14

EA 11000R APPROACHES TO LOOP SCENARIO__
29921 -
29
init
26 3 93 S45 .
, 643.4 44 .4 '.-"
is$i
.. ... +;7'" .
.4 1,
FIUR 3. POIINO ADDRCN
1 5 40
-i.- "" .4
"f ".. .4 it ', . . . +i ' 4
24"'i '
*--+ .3 - i. .4 l
9 .9' 7..8 0 -0 I(FIGUR 3.PSIIN FADE RCN
I ". ... ". . / 4.1 i m i7

by a point of departure, preferably something physical, which tells the master thathe has arrived and is beginning the port approach phase of his transit. If there areno physical objects to sight visually or detect on radar in that area, the two stagesof the transit may overlap, contributing to confusion of strategy and procedure.Two additional stages in the scenario which he discussed would take the ship throughthe slowing process to pickup the mooring master, and finally to the single pointmooring.
Summary. The interviews conducted during the presimulation phase of theproject helped to augment more general performance data and characterize theoperation of large tankers during their approach to a Gulf of Mexico deepwater port.For the most part, the masters felt that the approach was n,'t a difficult one, andthat the local aids to navigation would be adequate for routine transits. The resultsof the interviews were then used to develop realistic and believable scenarios forsubsequent simulation of deepwater port approaches.
3.1.3 Navigational Equipment Accuracies
Solutions to the navigation problems experienced in deepwater port safetyfairways and approaches to a deepwater port complex were addressed through a
review of relevant literature 6 ' 7 as well as access to the at-sea data base anddiscussions with user and provider (i.e., USCG) personnel. Errors customary in thenavigation systems found at proposed deepwater port facilities were identified forinclusion in the simulation. Bias or propagation errors unique to the LOOP areawere not simulated. Table 4 shows the results of a navigation equipment errors
8analysis conducted for the U.S. Coast Guard's aids to navigation study . Thefollowing equipment errors were incorporated in the simulation based upon theanalysis and capabilities of the simulator facility. All are considered appropriate fora VLCC approach to a deepwater port facility such as LOOP.
3.2 EXPERIMENTAL VARIABLES
The variables examined during the simulation experiment were selected as aresult of the presimulation process and the requirement to fulfill objectives of theoverall project (Section 2). Although the scenarios themselves representedapproaches to the LOOP complex, experimental variables were selected whichpermit extrapolatian of conclusions to other deepwater ports.
The two major variables of the experiment were bridge personnel organization,traditional or team trained; and type of navigation display enhancement, whetherradar alone, radar with racons, ARPA (automatic radar plotting aids) or ARPA with
6 U.K. National Ports Council. Navigational Aids in Harbours and Port Approaches.
London, England, January 1972.
7 Bertsche, W.R., A.J. Pesch, et al. Study of the Performance of Aids to NavigationSystems, Phase I, An Empirical Model Approach. Report Num5er CG-D-36-73, U.S.Department of Transportation, U.S. Coast Guard, July 19, 1978.
8 lbid.
16

TABLE 4. TYPICAL EQUIPMENT ACCURACY/ERRORS
EQU IPMENT ACCURACY/ERRORS
Gyro input to repeaters and display -0.3 degrees
Display range accuracy (including interpre - ptation) -1 percent of scale
Display bearing accuracy (including inter- +3 degrees near center to -+I degreepretation) near periphery
Loran-C position Q0.1 nautical miles
RDF bearing -3 degrees
Speed log -0.1 knot
Racon Same as display range and bearing
a navigation option. Combinations of the levels of each variable were exercisedacross three normal approaches to the deepwater port complex and one approach inwhich ownship's navigation information was significantly degraded. The detaileddescription of scenarios is presented in Section 3.3.
3.2.1 Bridge Personnel Organization
Twelve subject teams were employed in the experiment. All teams consisted ofVLCC qualified masters and watchstanding mates. Two different types of bridgeorganizations were identified and incorporated into the research as an experimentalvariable. Subjects who had received formal bridge team training or who areemployed by a company which practices formal bridge team organization wereclassified as a "team organization." These subjects used specific procedures for theplanning and conact of their bridge tasks. They also employed methods of checkingeach other's work during the conduct of their own tasks. Each team, however,maintained numerous characteristic differences, perhaps as a result of differentcoMp-ir policies and individual personalities. It could be concluded fromobservations that procedures employed in the true team concept were most evidentwhen the master and mate were comparably experienced or had worked togetherpreviously.
All other bridge organizations exhibited during the simulation were considered a"tr iditional organization." In some instances, masters and mates had workedtogether previously; in most instances, they had not. None had received formalbridge team training, nor did they use procedures associated with formal teamtraining cotirses such as radar parallel indexing.
The bridge organization variable was introduced into the experiment to examinethe effect of bridge procedures on display enhancement effectiveness. One-third ofthe subject groups consisted of formally organized bridge teams. This was believedto be approximately representative of the potential user population since teamtrained crews will operate tankers for the two largest shareholders in the LOOPventure and would be expected to enter other proposed Gulf of Mexico deepwaterports. Feca,,se performance differences were expected to result between bridge
17

team organized subjects and traditionally organized individuals, the experimentalanalysis was structured to examine the interaction effects between organizationswhen they used each different display. Further discussion of subject selection ispresented in Section 3.4.
3.2.2 Navigation Display Enhancement
The second variable examined during the simulation was the effect of easilyimplemented navigation enhancements on the reduction of risks associated withapproaches to an offshore deepwater port. Four levels of this variable were selectedas representative of currently available technology. The following paragraphsdescribe each display enhancement and explain its role in the simulation experiment.
Radar. Since all vessels of the size considered in this study are required to haveradar equipment installed and operating, the baseline navigation system includes adisplay which presents radar contact range and bearing information (Figure 4A). Theradar display along with simulated loran, RDF, and Fathometer data formed thebaseline navigation system for approaches to a deepwater port. A racon located onthe LOOP complex was also available as a baseline navigation aid. This baselinesystem provided sufficient navigation information for the characteristic approach ofa VLCC to a deepwater port under poor visibility conditions. Accuracy consistentwith radar and all other navigation equipment was simulated.
Radar with Racons (Radar/Racon). The first level of navigation systemenhancement was the introduction of two additional racons on oil rigs adjacent tothe north/south safety fairway. The purpose of the added aids was to provideidentifying features which readily isolated key oil rigs from the large number ofradar contacts in the area and provided positive identification of the rigs to enhancetheir use as navigation aids. An example of the appearance of a racon on radar isnresentd in Figure 4B.
Placement of the two racons was determined by the Coast Guard as a feasibleinstallation for LOOP. The added racons were generally representative of a numberof electronic aid options which would provide a positive point of reference toaugment radar. Accuracy consistent with both radar and racons was simulated.
Automated Radar Plotting Aids (ARPA). Several radar plotting aid formats areavailable and are in general commercial use today. Generically, they processinformation with respect to the radar presentation and display representative motionof objects and/or the risk of collision with ownship. One ARPA display format(Figure 5A) was selected for evaluation to determine its usefulness as anenhancement of the navigation process. Positive effects of the display mightsuggest increased use of ARPA displays for navigation assistance in the contactconditions, normally found near offshore ports.
The selected display presents moving objects as course vectors with a lengthcontrolled by the operator to show future position. Objects are manually acquiredand automatically tracked. Their range, true bearing, true course, true speed, andclosest point of approach are displayed. Accuracy consistent with ARPA systemswas simulated.
ARPA with Navigation Option (ARPA/NAV). Another commercially availabledisplay is a navigation option for use with ARPA equipment. A channel outline or
18

I
FIGURE 4A. REPRESENTATIVE RADAR DISPLAY
CURSOR
RANGE 7 NM
FIGURE 4B. REPRESENTATIVE RADAR DISPLAY WITH RACON5
19

RANGE 7 1 NMAR COURSE 280YB A IG 030°T 00 SEED 10 0 KTS
L CPA 15 MIN
CPA 2 0 NM
FIGURE 5A. ARPA COURSE AND SPEED VECTOR DISPLAY
RANGE 7,1 No C R 2 coos 80"T
BEA IN 300 T 'ISED•0 T
CPA 2 0 NM 1
FIGURE B. ARPA WITH NAVIGATION DISPLAY OPTION
20

chart display is superimposed over the ARPA display to indicate the position of thevessel relative to it (Figure 5B). Normally, the display is oriented to the ship'sgeographic position using an object on radar or an external navigation system foralignment. In this way, the position of ownship with respect to the surrounding areacan be readily determined. The display to be used in the simulation program isaligned from a radio aids to navigation system such as loran C. The purpose of thisnavigation enhancement was to determine the ability of simple graphic displays tomitigate navigation hazards by providing the vessel operator with another source ofinformation correlation. Accuracy consistent with both the radio aids to navigationsystem and the ARPA/NAV system were simulated.
3.3 SCENARIO DESIGN
To create a realistic setting for the simulation experiment, and one in whichapproach procedures, facility operations and physical characteristics are alreadywell defined, the LOOP operating area was chosen as the basis for the investigation.LOOP is currently the only active deepwater port project in the U.S. and isscheduled to begin operation within the near future. It was, however, an objectiveof this project to provide findings applicable to other ports, as well. As a result,specific attempts were made both in the design of the scenarios and the conduct ofthe experiment to elicit conclusions which are relevant not only to the LOOPfza . 1 ty but to near inshore ports or offshore ports in other areas.
Four unique scenarios were designed primarily from the results of thepresimulation interviews with VLCC masters. Each scenario required up to 2 hoursof simulation time to complete. Rationale for ownship's starting position and theintroduction of traffic and environmental factors is presented with the descriptionof each scenario.
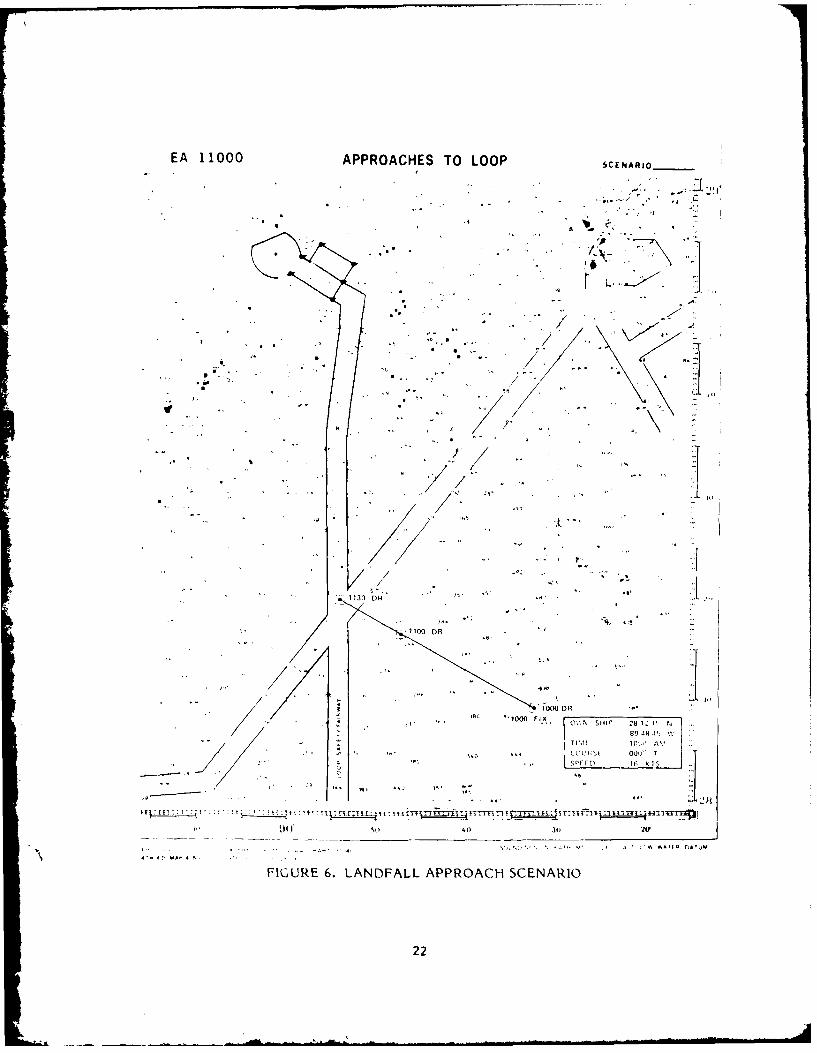
3.3.1 Landfall Approach Scenario
The landfall approach scenario was designed to examine the transition from opensea operation to the approac) nl transit of a deepwater port safety fairway. Thescenario shown in Figure 6 depicted the end of a voyage from the Yucatan or FloridaStraits direct to the north/south safety fairway of LOOP. A course of 305 degreestrue was laid on the charts to reflect the movements of ownship from midnight localtirno to the 1050 start of the simulation. Ownship was initially at 16 knots, 80 rpm,ha, iig just mnane vered to give way to a traffic ship outbound from the northeast.Tli - iiulation started with ownship on a heading of 000 degrees true as a result ofIain,i,,verling from this "traffic ship close aboard." Another ship was downbound inthe east/west safety fairway. This "traffic ship crossing" was introduced into theep.rrrewnt to permit the option of a higher CPA or passing astern of a stand-onve.,I at the expense of not entering the north/south safety fairway at its entrance.T'i. !to-rnitive was intended to reveal subjects' regard of the overall safety fairways () v! n ,.
T'ie wind for the scenario was fron the southeast at 25 knots. There was anorthwest current of 2 knots. Poor visibility was simulated. Subjects wereins-jcted to approach and enter the north/south safety fairway in transit to thedt',pwator port complex.
21
EA 11000 APPROACHES TO LOOP SCENARIo-__
* .*. ,-.. .... 4
I .. 9
1. 4o
. .. -
c( I
"': .. ., spf r~ 1 6 KIS
'% ". [, *• ....i
IT : rI
'A 4. 4
FIUR 6. LADALAPOC SEARI
22I

3.3.2 Coastwise Approach Scenario
The coastwise approach scenario was designed to examine how mst,rs mighttransit to a deepwater port complex from a location which would make the use ofsafety fairways inconvenient or uneconomical. In this scenario, perceived benefitsof circumventing the safety fairways were negated somewhat by increased risksfrom traffic avoidance, the requirement to steer a course through or around charteddrilling rigs, and the uncertainty of uncharted structures located within the oil leaseblocks.
The scenario shown in Figure 7 depicts a transit from the east, past SouthwestPass, to the LOOP complex. ,,k 235-degree true course was laid on the charts toreflect the movements of ownship when passing abeam the Southwest Pass Light.Ownship was initially at 16 knots, 80 rpm on a heading of 235 degrees true. Therewere two traffic ships visible on the radar or ARPA and a number of rigs ahead. A"traffic ship close aboard" was inbound to Southwest Pass in the east/west fairway.This ship would remain the giveway vessel if ownship's course were maintained oraltered to enter the safety fairway southbound. If ownship's course were changed tothe north, a vessel outbound from Southwest Pass would become the "traffic shipclose aboard." As revealed in the subsequent analysis of performance, the derivationof three independent strategies for the coastwise approach caused both of thesevessels to come close aboard as anticipated.
Ownship was originally positioned within the scen1ario so that no one approachroute appeared highly preferential. Rigs were located dead ahead of ownship, and itsoon became apparent to each subject that he wou!d either have to (1) sail to thesouth staying within the safety fairway, (2) sail to the south then to the west,keeping just outside the rigs, or (3) sad to the north then to the west through therigs. If he chose to transit to the south outside the rigs as was hypothesized, hewould encounter a "traffic ship crossing" near the end of the voyage at thenorth/south safety fairway. This crossing traffic was introduced to examinesubjects' tradeoffs between CPAs to traffic and the relative angle with which theywould enter the safety fairway. It was hypothesized that otherwise normal CPAsmight be sacrificed to minimize the fairway entrance angle.
The wind for the scerario was from the southeast at 25 knots, with a northeastcurrent of 2 knots (same as for all approaches). Again, poor visibility was simulated.Subjects were instructed to make an approach to the north/south safety fairway andproceed toward the precautionary area to meet the LOOP mooring mnaster.
3.3.3 Mooring Master Pickup Approach Scenario
The mooring master pickup approach s(.enario was designed to examrine howmasters might approach the mooring master pickup point, how well they couldmaintain their position in the event the mooring master's arrival was briefly delayed,and what contingencies would be expected (e.g., anchoring, extended stationkeeping, returning to sea) if the mooring master delay was exten'd.
The scenario shown in Figure 8 depicts the end of a northerly transit up the"I, north/south safety fairway to a point approximately 15 miles from the mooring
master pickup point which is at the eastern boundary of the LOOP precautionaryarea. The approach initially requires position and speed determination, then coursekeeping and slowing to arrive at the pickup point on schedule. Whcn it is indicated
23

EA 11000 APPROACHES TO LOOP SCENARIO___
SOUTHWEST PASS
S. .
Tr. C 10.0A7/ ii ..: I- !
90 SO 4 34) 10
T. I). M.--
FIGURE 7. COASTWISE APPROACH SCENARIO
24

EA 11000 APPROACHES TO LOOP SCENARIO___
- 'T
1.7 EllIFIUR 8. MORN lATRPCUPAPOCHSEAIS -.. 'C 25

that the mooring master has been delayed, the subject must station keep, anchor, orreturn to sea.
Notification of the mooring master delay was methodically introduced to permita comparison between subject responses. The subject was first informed of anapproximate 1 hour delay when he was within 30 minutes (1 to 2 nautical miles) ofthe scheduled pickup. If the subject elected to continue slowing to further delayarrival at the pickup point, or if he decided to station keep at the pickup point, hewas informed after another 30 minutes that the delay had been extended for severalmore hours. This, it was hoped, would promote a desire to anchor, steam back downthe fairway, or extend his station keeping. With a 2 knot crosscurrent andsubstantial wind effect, both the original and subsequent decisions of the subjectswere of paramount interest to the research. The analysis addresses both thesubjects' decisions and how well they accomplished their goals.
A 010 degrees true course was previously laid down on the chart to reflect themovements of ownship up the north/south fairway. Ownship was initially at 12knots, 60 rpm on a heading of 010 degrees true. There was no traffic within theimmediate area although ships were at ancho_-r !,)side the designated LOOPanchorage. The mooring master boat was not visible on the radar or ARPA display.
The wind for the scenario was again from the southeast at 25 knots, with anortheast current of 2 knots. Subjects were instructed to make the approach to themooring master pickup point and to be sufficently slowed to bring him onboard at1330 local time.
3.3.4 Degraded Dead Reckoning Approach Scenario
The degraded dead reckoning (DR) approach scenario was designed to simulate arealistic landfall situation with the potential for promoting navigational disorienta-tion. Of primary interest was the possibility of a master being lured into falsenavigating confidence as a result of bogus rig locations and patterns presented onthe radar or ARPA display. In effect, the scenario was designed to introduceownship into the lease blocks at a location other than that indicated by the previousDR. To accomplish this with minimum suspicion on the part of the subject, thisscenario was administered at the end of all runs; after maximum confidence in theexperiment had been achieved. Further, because no other erroneous informationother than the DR was desired, subjects were told that their loran was inoperative;but that they still had their other navigational equipment (i.e., Fathometer, radar,RDF, etc.). In the scenario, ownship was placed approximately 20 nautical milessouthwest on the same ROF bearing and at a relative comparable depth. A slowmoving fishing boat was placed ahead at a location comparable to the charted rig.
This scenario which is shown in Figure 9 depicts the end of a transit from eitherthe Florida Straits or Yucatan. A dead reckoning track of 306 degrees true had beenlaid down on the charts to reflect the intended track for approximately 12 hours.Overcast skies precluded celestial navigation for the past 24 hours, and loranpositions could not be plotted due to equipment malfunction. Ownship was initiallyat 16 knots, 80 rpm, heading 305 degrees true. There was a stationary return on theradar or ARPA display bearing 330 degrees true at a range of 14 miles. It wasbelieved to be the southwestern most rig of a large group to the east of the LOOPcomplex. The wind for the scenario was again fromn the southeast at 25 knots.
26

EA 11000 APPROACHES TO LOOP SCENARIO
23 k- 26. 3"- -
.P -~.,' 56 " /
12"3#2 t
01 3
....... .. .. / / .1 A
9 ,•3 8
3, 1 + ' / / P' . - " **
136 3
20 D .: ., -,,,, .
& *'e '105 O .
+' *"' 36 9 )0 SED 6 T•3 , l + /. " 5 / 2 / .3t 3
)e - , . .. . , .. . . __ - 5_ _ *},
D..
5"i; . 9 i' ; - +~
FI U E 9 D G A E D E D R E K N I G A P R A C C E A I
2 47
3 3 103~'321,
3 6 , O V,. HI 2.1 0
1050E 105 AM
3-.
10 50 40 313
4~~~~~ 1.1 A 9 9- 21
FIGURE~~.4 9..9, 1-GAE EDRCOIN PRAHSEAI
270 ~I
33 .933ilm

Again there was a northwest current of 2 knots. Poor visibility was simulated.Subjects were instructed to make the approach and enter the north/south LOOPsafety fairway.
3.4 SUBJECT SELECTION
The deepwater port simulation experiment used twelve subject teams consistingof licensed masters and mates who had operational experience aboard VLCCs.Subjects were selected by availability to represent a cross section of vesseloperators likely to use the LOOP. Of these, four groups were masters and mateswho had formal bridge team training (subjects I through 4). Seven of the remainingeight traditional groups were U.S. licensed. Subject profiles were compiled whichdescribe the subjects' background including the amount of licensed deck officerexperience he has had, the largest vessel he has piloted and his previous simulatorexperience. The following is a summary of these profiles:
Subject 1. This team consisted of two team-trained Italian subjects who bothhave unlimited masters licenses. Each captain had extensive experience with 25years as a licensed deck officer. Both masters are graduates of the Italian NauticalInstitute and have used the ship simulators for shiphandling training at Delft,Genova, and Grenoble.
Subject 2. This team consisted of two British deck officers from a major oilcompany. The master had previously piloted a 340,000 dwt oil tanker. Both subjectshad previous ship simulator experience at Southampton.
Subject 3. This British master had over 20 years of licensed deck officerexperience and both he and his mate were team-trained. The largest vessel he hadpiloted was a 272,000 dwt VLCC. He had extensive ship simulator training atGrenoble, Southampton and La Guardia.
Subject 4. This Italian master had 16 years of licensed deck officer experienceand is team-trained. The largest vessel he had piloted was a 240,000 dwt VLCC. Heis a graduate of the Italian Nautical Institute and had used the ship simulators inGenova and Southampton.
Subject 5. This master had considerable VLCC and Gulf coastal experience overa 30-year career. The largest vessel he had piloted was a 400,000 dwt VLCC. H-ehad used the ship simulators at Grenoble and La Guardia.
Subject 6. This master had 14 years of licensed deck officer experience. Thelargest vessel he had piloted was a 260,000 dwt VLCC. He had no prior shipsimulator experience.
Subect 7. This master had 12 years of licensed deck officer experience. Thelargest vessel he had piloted was a 225,000 dwt VLCC. He had no prior shipsimulator experience.
Subject 3. This master had 17 years of licensed deck officer experience with 25years of sea time. The largest vessel he had piloted was a 265,000 dwt VLCC; hehad no prior ship simulator experience.
28

Subiect 9. This master had 27 years of licensed deck officer experience and hismate had 16 years of experience. Each had piloted a 220,000 dwt oil tanker in FarEastern, European, and U.S. waters. Neither had prior ship simulator experience.
Subject 10. This master had 16 years of licensed deck officer experience. Thelargest vessel he had piloted was a 265,000 dwt VLCC. He had been a subject on theCompute±r Aided Operations Research Facility (CAORF) ship simulator.
Subject I I. This master had 12 years of licensed deck officer experience. Thelargest vessel he had piloted was a 265,000 dwt VLCC. He had participated invarious maritime training programs; however, he had no prior ship simulatorexperience.
Subject 12. This master had close to 10 years of licensed deck officerexperience. The largest vessel he had piloted was a 265,000 dwt VLCC. He was asubject on the CAORF ship simulator.
When the subjects arrived at the Eclectech Associates simulator, they wereadministered a structured course and given the opportunity to maneuver the vesselthrough a trial scenario not related to LOOP. This orientation familiarized themwith the arrangement and operation of bridge equipment, the simulated ship'shandling characteristics and the helmsman's proficiency.
3.5 SIMULATION
There are a number of possible sources of empirical observations on therelationship between stimulus conditions and human performance. They include thereal world, simulation and laboratory. The real world obviously contains therelationships of interest in all their complexity and validity; but equally obviously,extensive data collection in the real world is difficult, expensive and possiblydangerous. A more basic limitation to such a method is the unamenability of thereal world to experimental control. The alternatives have been proven throughresearch to be both practical and valid as long as fundamental principles are applied.Each subject was assigned seven runs. These included two each of the landfallapproaches, coastwise approaches, and mooring master pickup approaches. Theseventh scenario for each subject was the degraded dead reckoning approach. Thisscenario was always last to avoid affecting the master's confidence and possibly hisperformance in other scenarios. When a subject repeated a scenario, it was with adifferent navigation display enhancement. Each mooring master pickup approachscenario was run as a continuation of each landfall and coastwise approach scenario,and thus it immediately preceded them and contained the same display enhance-rnent. The order in which subjects experienced their first six scenarios wasrandomized. To the greatest extent possible, each scenario and each displayenhancement appeared in every order an equal number of timn.s. Thz statisticalapplication to accommodate this design is presented in Section 4.
Simulation as a research methodology is uniquely able to bring components of thereal world into a controlled experimental situation. In analyzing a complexsituation, it is possible to examine both the major effects within simulated variablesas well as the interaction between variables. This, of course, requires a wellstructured experimental plan, properly designed, and reliably executed simulation,and appropriately selected measures of performance and statistical analysis.
The experiment required extensive preplanning to ensure all of these.
29
NOWN~hMMMUM

3.5.1 Description of the Experimental Design
The experimental design is shown in Figure 10. It is the result of accommoda-tions to the number of levels of variables to be examined, the logistics of elicitingparticipation by qualified sujbjects, and constraints of the statistical analysis formeasures of performance. The order of presentation of en; ,dcernents wasrandomized while exposure to each scenario was controlled.
The design enabled an analysis of performance due to the major effects (e.g.,navigation display enhancement or bridge personnel organization) as well as ananalysis of performance due to the interaction between them.
3.5.2 Simulator Facility
The simulator used in the experiment was developed at and by EclectechAssociates, Inc., to evaluate bridge displays such as those exhibited as displayenhancements. Previous research by the U.S. Coast Guard and U.S. MaritimeAdministration has been conducted at this facility for evaluation of short rangecollision avoidance displays, maritime radar interrogator/transponder systems,predictor steering displays, and electronic radio aids to navigation displays.
The primary apparatus for the experiment was a Digital Equipment CorporationGT-44 computer graphics system with PDP-11/40 central processor and VT-Il
N "A C MI NR A AV
I / / I
PIC " / / k
I" ' I z /
I , I / I /
N OIATOANIZAPL¥ -1 _ N
TEAM , /
FIGURE 10. EXPEIMNT,,'\L DF\,IG(N
30

graphic generation hardware. The VR-17 CRT display is mounted in a free standingpedestal comparable to bridge installed planned position indicator (PPI) systems. Itis located on the centerline of the ship and against the forward bulkhead of thebridge just below the gyrocompass repeater. The helm, engine order telegraph,rudder angle indicator, and rpm indicators are installed on a steering console,located to the right of center and also forward. This arrangement is solely for thebenefit of the experiment, enabling the subject to monitor all ship control functionswith minimum distraction. The facility includes a visual simulation capability whichwas not employed in the experiment. It is noted that without a visual scene thlehelmsman did not require a visual range for steering and was able to maintain courseusing his own console mounted gyro repeater. The simulator facility consists of:
e wheelhouse
e ship's controls
* ship's indicators
* radio aids to navigation display
a scene projection system
9 PDP 11/40 with requisite interface equipment
* data reduction facility
The WVheelhouse. The wheelhouse is approximately 16 feet wide and 11I feetdeep. When the visual scene is used, it can be viewed through all windows for thepresentati,,n of day, night,, and intermediate scenes. Additional facilities include achart table with chart stowage. The lighting in the wheelhouse can be varied innight operating conditions.
Ship's Controls. The control mechanisms found in the bridge simulator are tieddirectly to the PDP 11/40 computer, providing the proper inputs for ship's controlswith resultant ship's motion incorporated in the visual image. These controlmechanisms include the following:
* a ship's wheel and helm unit
* an engine order telegraph which provides control of the ship's speed bothahead and astern. Propeller rpm is determined by ownship characteristicsprogrammed into the computer
Ship Indicators. The indicators available to provide information to the pilotinclude:
" a gyrocompass overhead repeater and console mounted repeater providingindications of ownship's heading as transmitted by thle computer
" a shaft rpm indicator that shows the shaft rpm transmitted by the tLompUter
" a rudder angle indicator
" a rate of turn indicator
" a ship's clo:k which has been modified to show scenario time
Radar and _Naviation Display. The electronic bridge display unit Is ca' ihile ofpresenting radar, ARPA, and a variety of other information displays to thle watchof ficer.
31

The PDP 11/40 Computer. The PDP 11/40 computer provides dynamic signals forthe electronic bridge display or visual system. These signals are modified by theappropriate program to reflect ownship's characteristics including maneuverability,visibility, hydrodynamic influences, and individual scenario conditions.
Data Reduction Facility. The computer facilities are configured to providesupporting data reduction and analysis with a minimum of data manipulation orconversion.
3.6 DATA COLLECTION
Data from the experiment was collected during the simulation by observers on astructured "observer sheet," as the result of subject questionnaire responses, andautomatically by the simulator computer. Additionally, some information such ascontrol commands and the type of fixes performed were manually input into thecomputer during the simulation. All ship position and ship status information wasrecorded by the computer at 60-second intervals. Once unique strategies weredetermined, it was possible to compute a mean strategy track. Perpendicular lineswere then inscribed along this mean track, extending out until they intersected allother tracks within the strategy. Wherever a perpendicular crossed a trackline, thedata collected at 60-second intervals closest to the perpendicular were retained forcomparative analysis. In the case of measures requiring a frequency count (i.e.,frequency of radar fixes, engine orders, etc.), events were accumulated and recordedat each perpendicular. All closest point of approach (CPA) measures to stationaryobjects and traffic were computed after the run as a result of the track< made good.
Data collected and/or computed during all runs are shown in Table 5. While allof this data was available to the researchers for analysis, only specific measureswere selected for each scenario and strategy. This selection of intasures and theirsubsequent statistical analysis is discussed in the next section.
32

0j
L2, 0
roV
V, ~ C C, 0 .LU -U Q.-
0 C
7- 0')L
0LL.
LL < r04X-
En E
- D.~. IA
.,0 ~ ~ Cr-
0 7D _
CIO C7
:70en t-; E
Ci -u L-
0 o~e33

Section 4
DATA ANALYSIS
4.1 DESCRIPTION OF THE ANALYSIS PROCESS
To adequately describe and quantitatively compare runs performed during thedeepwater port approach experiment, a variety of analysis techniques wereemployed. Observations of the research team made during each simulation wererecorded and compiled on structured run profile sheets. These sheets detailed,among other things, planned and actual strategy, effects of traffic, navigationmethods, and a description of the resulting track made good. A summary of these
observations was published as an interim project report. 9 They provided a guide forthe selection of performance measures to be quantitatively analyzed as well as amethod of identifying and categorizing different strategies within each scenario.
In effect, the analysis of observations made during each simulation enabled adetermination of how that simulation should be measured. Observation data werealso used after the quantitative analysis to explain unique occurrences or behaviorsand to check the effectiveness of the particular measure. For example, if from thequantitative data it was determined that subjects seldom use RDF under certainconditions, the observation would not only confirm that the RDF was not used, butmight explain why it was not used. Observation data for interpreting quantitativedata employed extensively in the data analysis, and many of the conclusions of thestudy are derived through this chain of evidence.
Questionnaries were used to elicit additional information about what the subjecthad planned to do and what he actually accomplished (or thought he accomplished).Questionnaire results were also used in compiling the run profile sheets and, as such,provided valuable insight into what had actually occurred during the simulation.Some questionnaire results related to the subjects' perceptions of the displayenhancements and the simulation in general. These results are discussed along withrecommendations of the subjects in Section 4.6.
A quantitative analysis was conducted on the performance measures selected foreach scenario and strategy. These measures, the rationale for their selection, andthe statistical tests applied to them are discussed by scenario and strategy inSections 4.2 through 4.5.
4.1.1 Statistical Applications
Design of the deepwater port experiment attempted to control the order in whichscenarios were administered and maintain equal sample sizes of subjects usingdifferent display enhancements. Subjects, however, were permitted to select theirown strategy for each approach, and these strategies themselves were of majorinterest to the research. Because the strategies differed both in tracks made good
9Eclectech Associates, Inc. Preliminary Observations and Sample Data Analysis for aSimuldtor Study of Deepwater Port Potential Tanker Problems in Poor Visibility.U.S. Department of Transportation, U.S. Coast Guard, July 1980.
34

and ofteii enmounters with different rigs and traffic, it was difficult to statisticallycompare the quantitative measures of an entire scenario.
The result is that each strategy in each scenario was analyzed individually.While this provided a thorough description of each potential deepwater portstrategy, the reduced and occasionally unequal sample size somewhat limited theability to derive statistical conclusions.
To accommodate unequal cell sizes, an analysis of variance (ANOVA) method ofunweighted means statistic was chosen. This procedure is described in Snedecor and
10 Mes 1 1 tet h en fclsCochran and more recently by Myers. It essentially treats the means of cells,allowing for some disparity as a result of the unequal samples. The analysis ofvariance is a two-factor design providing an evaluation of "main effects" such as theeffect of bridge organization or display enhancement as well as "interaction effects"between particular organizations with particular enhancements.
The F-statistic was applied to compare two population variances. It wasperformed on crosstrack variance to compare the trackkeeping consistency ofdifferent groups. The results are presented graphically in Appendix A. The F-test
which was used is described in Pfaffenberger and Patterson. 1 2
When the test of a hypothesis produces a sample value falling in the criticalregion of the test, the result is identified in this report as "significant." On tables,the significant value is designated with an asterisk (*). This means the nullhypothesis, that the values are similar, should be rejected, and that some otherhypothesis is necessary. The probability of committing a type I error (i.e., that thenull hypothesis is true but still rejected) is called the level of significance. For allstatistical tests performed in this experiment, the level of significance has beenchosen equal to or less than 9.19. In other words, for all measures which areindicated as "significant" in this report, there is a 10 percent possibility that theresults really could have occurred by chance alone.
4.1.2 Analvsis of Performance
The analysis combined results of the run profile sheets (i.e., observations,research notes, and questionnaire responses), run track plots, and statistical analysisof quantitative measures, to provid, a logical "chain of evidence" from which allconclusions about overall performance could be derived. This analysis is presentedin the remainng subsections by scenario. The rationale for deriving each strategy aswell as its analysis is included. Each subsection concludes with an overview offindings and summary of approach performance for the entire scenario.
1 0 Snedecor, G.W. and W.G. Cochran. Statistical Methods, 6th edition. Ames, IowaState University, 1967.
11 Myers, J.L. Fundamentals of Experimental Design, 3rd edition. Allyn and Bacon,Inc., 1979.
1 2 Pfaffenberger, R.C. and I.H. Patterson. Statistical Methods for B'usiness and Eco-nomics. Hornewood, Illinois, Richard D. Irwin, Inc., 1977.
35

4.2 DERIVATION OF LANDFALL APPROACH STRATEGIES
The resultant tracks of all runs in the landfall approach scenario are shown inFigure It. The plots show the center of gravity (CG) of ownship from the startingposition until the goal of each run had been achieved. Differences in track goals andtheir attainment are obvious in the figure. Some subjects made a concerted effortto enter the north/south safety fairway at the intersection, others were content tocut off the intersection corner, still others were intent on first handling the trafficship then entering the fairway further north. This graphic portrayal of tr.ickkeepingresults as well as the subjects' stated intentions during the approach led the analyststo identify and categorize three unique strategies for the landfall approach scenario.All runs were grouped by strategy for the analysis of performance. Strategies arecompared and discussed on an individual basis.
The mean track plus or minus two standard deviations of crosstrack variabilityfor each strategy was computed and plotted to show how the strategies differed intheir resultant approach. These plots are shown on Figure 12. The plot assumes anormal crosstrack distribution for all runs within each strategy. As a result, thecenter or mean track can be considered the average track for that particularstrategy If the runs were normally distributed, the shaded portion of the plotswould represent the area in which 97 percent of the master population would transitthe waterway under similar operating conditions. It appears from the raw data thatnot all portions of all plots were normally distributed. As a result, some artisticlicense has been exercised in drawing the plots so as not to give the erroneousimpression of an unsafe condition. Relatively robust statistical tests wereemployed. The assumption of normality should not significantly affect the results.
The 'nost dominant strategy which appeared in the landfall approach scenario seta course for the north/south safety fairway intersection and made every effort toenter the fairway in the center or just to the right of center. This dominantstrategy which occurred in 76 percent of the runs is considered most representativeof the landfall approach. As a result, the dominant strategy of the landfall approachscenario is considered characteristic of anticipated deepwater port operations and istherefore the most thoroughly examined.
The remaining 24 percent of all runs is included in two secondary strategies.These are labeled secondary strategy "A" and secondary strategy "B" and aredescribed in their respective sections.
4.2.1 Analysis of Dominant Strategy
Figure 13 shows the mean track and crosstrack variability of the landfallapproach dominant strategy. The group includes a near equal number of runs usingeach of the display enhancements (i.e., radar, radar/racon, ARPA and ARPA/NAV),but more than twice as many subjects practiced traditional bridge organization thanwere team organized. The figure shows the subjects clearing the traffic ship closeaboard, setting a course for the fairway intersection and entering the north/southsafety fairway for a transit to right of center of the fairway.
In general, the transits were all considered safe and characteristic of prudentshiphandling. The review of postsimulation questionnaires from subjects suggeststhat under the conditions of visibility only a few subjects would have been hesitantto maintain full maneuvering speed. Subjects considered thq shiphandling character-istics, bridge equipment, traffic encounters, and deepwater port approach require-merits realistic and appropriate for the fulfillment of their prescribed objectives.
36

I j S A 6 9
) 0 2 6 6 " ,
123 6 s o 7-
-4i~11 244. .' "
- i ~~62 ,,•w.4, 4 7
'N 121 211566
3--1 0 2 5' 5 1 16 62
* 36 .: 2 ~ '28' 27 - --- ~ 2- . 23 27,
5 - -39
266 .33629 . '8 365
- 256 392
59 13f 291 .286 360 4. 4
3 E / 416
S2 129'
/~5 2,05 365. 92 ...
4 53" - 4
6(C , 6 384 452
48 "3
; 13 191 2&44 , - ,,."
0, ;, S 6, 1" 385 ,
473
86 At
,,) 2286 380' 478
t) - 380. 424
363
178 2! U. 25 -- 337 6
I / 76 259 32 387 38. ' 340
385-- ~~.)()03,m.
F=IGURE II. INDIVIDUAL SHIP TRACKS DURING THE LANDFALL APPROACH
37
L

Ads~M 59697
123 102 166 4
241 23 244 131 /
62 A.48 254. . .r SECONDARY 6 26
"" - . . STRATEGY "B"
*SECONDARY 02% OF SAMPLE POPUJLATION) 248STRATEGY A'
112% OF SAMPLE POPULATIONJ . 27
-39
............ 15"4o _
2:8 36539
DOMINANT
STRATEGY 392(76% OF SAMPLE POPULATION)
38416
/5545 -291 4if
,/ Ad" 452
69 ; 384
83 136....... ,%STARTING 385
POINT ' 473" 126 b,19 234 ;3175JS86 ..
fO380 478129 2 11 1% 206 286
__ _ __ _ __ _ 4W78 61
A
2!~ 7 . T33(A OCI.(IA2
25TVVO STANAI"()A D \ A HS
16 f 2 9 32 387L~TI4FO(L.( 1O LEET[ 0
44
900 ' 385
FIGURE 12. THREE STRATEGIES OF THE LANDFALL APPROACH
38

.. . . . 7 I I 0 ' ..... . . .. . .. .. . .. .. .
I 6
'23 102 166 s ,w 64-
2e 244 131 0o
r48 2254 6225
25' .~ -) 2 15; 151 166 16
* 36"6 23( 28 27 248
* . 46
P1 310 53
.54, //5
;-8 369'41 5c 21 29 3- /.38 365
9 "9 ,392
59 131 7 29' .286 360 " ----38 45
4
/55 416
45 221 291 4
6 At
47 / 53 62 7158 295 365 , 452 L-
69 s 226 384"' 452
594133, W 1 9 1 1 2 4 4 '
B~~~ ~3 . ... . . - ",[STARTING 3 8 5,
POINT 47312 19; 234 ;3 17 ,5
86 156 5
12 ,6 206 286 380 478
r "24
78 i61 2,7 ",..-" "337 SHADED AREA REPRESk N S325 TWO STANDARD DI VI
I Ilw
CROSSTRACK VARIABILI T Vo1TH71 AOSUITHE MEAN TRA R DI4AI.
176 2T9 H H32 387 CENTER
/ ,,on 385 .'
FIGURE 13. DOMINANT STRATEGY OF THE LANDFALL APPROACH
39

4.2.1.1 Analysis of Performance
Performance measures and the application of statistics to the dominant strategyof the landfall approach scenario are as follows:
1. Mean track
2. Crosstrack variability
3. Mean speed and rpm
4. Mean frequency of engine, rudder and course orders
5. Mean frequency of radar, loran, RDF and Fathorneter fixes, and DRs
6. Mean CPA to each traffic ship
7. Lowest CPA to each traffic ship
Note: There are no rigs in the landfall approach scenario which present a potentialhazard to navigation.
A two-way analysis of variance (ANOVA) was conducted to test main effects ofthe display enhancement and bridge organization variables, as well as potentialinteractions. The results which were indicated at the 0.10 level of significance areso identified in the text by the words "statistically different" or "significantdifference." A detailed explanation of the significance level chosen is presented inSection 4.1
4.2.1.2 Effect of Display Enhancement on Performance
An analysis of subject performance as a function of which display enhancementthey had used during the run was conducted by combining all runs of traditional andteam bridge organizations. The results show some impact of display enhancementupon overall performance. First of all, all radir and radar/racon runs werecombined and labeled "radar based displays." Next, all ARPA and ARPA/NAV runswere combined and labeled "ARPA based displays." For a description of thesedisplays, refer to Section 3.2.2. Approach performance was compared between radarbased displays and ARPA based displays with the intent of examining what effectcomputed ownship and triffic motion would have on the deepwater port approachwithout additional navigation aids such as racons or the ARPA navigation option.Following this analysis, a comparison of performance was conducted betweenindividual radar, radar/racon, ARPA and ARPA/NAV displays. In the followingdiscussion, all results are attributed solely to the effect of display enhancement.
The comparison of trackkeeping performance between radar based displays andARPA based displays shows a significant difference in crosstrack variability (FigureA-1 of Appendix A) and some difference in mean tracks (Figures B-1 and B-2 ofAppendix Bl). While the mean tracks and crosstrack variability were almost identicalup to the fairway entrance, the ARPA based display mean was continuously furthereast. This difference increased as ownship proceeded up the north/south fairwayuntil the radar based track was exactly in the center of the fairway and the ARPAbased track was exactly in the center of the right half of the fairway. Crosstrackvariability with the radar based displays was more than double the ARPA baseddisplays. Table 6 (lines I and 2) shows no significant difference in s'ip controlbetween when radar based displays were used and when ARPA based displays were
40

TABLE 6. SHIP CONTROL AND COURSE KEEPING -LANDFALL APPROACH, DOMINANT STRATEGY
Strategy Mean
Speed Engine Rudder CourseVariable (knots) RPM Orders Orders Orders
Enhancement Effect
1. Radar based displays 14.2 77 0.6 4.6 4.92. ARPA based displays 14.3 78 0.2 8.9 4.1
3. Radar 14.6 79 0.2 5.8 5.04. Radar/racon 13.9 69 0.8 3.6 4.85. ARPA 13.9 76 0.0 5.2 4.66. ARPA/NAV 14.3 80 0.4 12.6 3.6
Organization Effect
7 Traditional organization 14.6 79 0.3 8.6 4.18. Team organization 13.3 71 0.6 1.8 5.4
9. Radar based displays - traditionalorganization 14.6 79 0.3 5.3 4.9
10. Radar based displays - team irganiza-tion 13.0 69 1.5 2.0 5.0
11. ARPA based displays - traditionalorganization 14.7 80 0.3 11.5 3.4
12. ARPA based displays - team organiza-tion 13.5 73 0.0 1.7 5.7
13. Radar - traditional organization 14.6 79 0.2 5.8 5.014. Radar - team organization .. .. ......
15. Radar/racon - traditional organization 14.6 79 0.3 4.7 4.7I 16. Radar/racon-team organization 13.0 69 1.5 2.0 5.0
17. ARPA - traditional organization 14.6 80 0.0 7.7 3.718. ARPA - team organization 12.9 69 0.0 1.5 6.0
19. ARPA/NAV - traditional organization 14.8 80 0.5 13.4 3.320. ARPA/NAV - team organization 14.6 80 0.0 2.0 5.0
NOTE: No statistical difference at p±0.10 level of significanre indicated for anyvalue.
41

used. Tables 7 (navigation workload) and 8 (hazard avoidance), lines I and 2, alsoshow no differences in performance. As a result, it is suggested that thosedifferences in performance which did occur during the landfall approach were notmanifest in ship control, navigation or hazard avoidance performance; but insteadappeared to have affected only trackkeeping during the approach. This findingsuggests a conscious difference among subjects in their selection of tracks which canonly be explained by a more detailed comparison of performance between individualdisplay enhancements.
Comparison Between Radar, Radar/Racon, ARPA and ARPA/NAV Displays. In atrackkeeping comparison between when the radar and radar/racon disocc'y wereused, significantly larger crosstrack variability (Figure A-2) occurred with the radardisp:, i prior to the fairway entrance. Once inside the fairway, crosstrackvariability renaned small for both. Table 6 shows overall few engine orders with aresultant very consistent speed throughout the approach. Again, ship controlperformance was virtually unaffected by enhancement. Table 7 (lines 3 and 4) showsconsiderahly fewer (though not statistically significant) RDF fixes when the raconwas avalable than when radar alone was used. This indicates a trend toward usingte R1)F less whenever an alternate, positively identifiable, and perhaps morea.ceirate, aid to navi;ation is available.
..n.i)r differences in performance between the ARPA based displays were asignificantlv larger crosstrack variability toward the end of the transit when
R P.-%/NA V wa s used (Figure A-3). This variability was the result of substrategies
whi,, a-: irreJ when masters entered the safety fairway. Although all masters'ori t.-ii t . was to transit up the center of the safety fairway, this was revised
b somre at the fairway entrance. After initiating their entrance maneuver, it
be c aarentto these masters that they would end up to the right of center.Sin,-(- &, . recJlt of the ARPA/NAV information each knew precisely where he was inth-.: r.~ an:] that ther, was no traffic ahead, each elected to revise his strategy
al)i k t, tie right side. This substrategy was not analyzed separately although itsegest that when the navigati, n option was provided on ARPA (i.e.,
f ', id. daries are delineated) subjects tended to be more confident of their, .thir abihty to navigate within the fairway. The review of Table 6
! b( 'nore (though not statistically significant) rudder orders (line 6)., ,... , Table 7 (also line 6) does show significantly fewer radar fixes,
F ,, and DRs when the ARP.-\/N'\V information was utilized. This isar' ,-;.! i ro-, )f the si1biects' confidence in ARPA/NAV position information.
: t' - t b, po;ntead oat that the frequency of loran fixes did not change,t, ., l ' e 'Acderia' to show that the navigation option on ARPA substitutedfor tr .t:, n'igation methods. No significant differences in hazard avoidance(T iY ai , f rictiori of display enhancement were identified, further suggestin" ,
1 ,'...,, t rAisit', f 3r all enhancements.
4. 2. 1.3 [fte t of FBridge Organ ization on Performance
-Nn an,,ls,, of performance as a function of how the bridge team was organi.zedanl operated was conducted by combining runs of all display enhancements. For ad's-riptioi of bridge organi7ations, refer to Section 3.2.1. The results show thatmerin tracks differed only at the entrance to the north/south safety fairway. Thetr .l1tonaf organi ration's ,nean track was to the east, tending to cut off the :orner(Fg res li-7 and B-8). At the corner, there was a significantly higher crosstrickvariab)lity (Figure A- 4). On tie other hand, the team organization consistently
42

TABLE 7. NAVIGATION WORKLOAD -LANDFALL APPROACH, DOMINANT STRATEGY
Mean Frequency ofRadar Loran RDF Fathometer
Variable Fixes Fixes Fixes Fixes DRs
Enhancement Effect
1. Radar based displays 8.0 4.2 0.7 1.7 4.72. ARPA based displays 4.1 3.9 0.8 1.5 2.3
3. Radar 6.0 3.3 1.2 1.8 3.74. Radar/racon 9.6 5.0 0.2 1.6 5.45. ARPA 5.0 4.8 0.8 2.8 4.06. ARPA/N/.V 3.2* 3.0 0.8 0.2* 0.6*
Organization Effect
7. Traditional organization 5.3* 3.4 0.8 1.1 2.98. Team organization 7.8 5.8 0.6 2.8 5.0
9. Radar based displays - traditionalorganization 7.4 3.4 0.7 1.0 4.1
10. Radar based displays - team organiza-tion 10.0 7.0 0.5 4.0 6.5
11. ARPA based displays - traditionalorganization 3.1 3.4 0.9 1.3 1.6
12. ARPA based displays - team organiza-tion 6.3 5.0 0.7 2.0 4.0
13. Radar - traditional organization 6.0 3.3 1.2 1.8 3.714. Radar - team organization .. .. ......
15. Radar/racon - traditional organization 9.3 3.7 0.0 0.0 4.716. Radar/racon - team organization 10.0 7.0 0.5 4.0 6.5
17. ARPA - traditional organization 4.3 4.0 1.0 2.7 3.318. ARPA - team organization 6.0 6.0 0.5 3.0 5.0
19. ARPA/NAV - traditional organization 2.3 3.0 0.7 0.2 0.220. ARPA/NAV - team organization 7.0 3.0 1.0 0.0 2.0
statistically different at p-"0.10 level of significance
43

.C
4j
LU
<(V n \ M C,400O aO"(N (nC I L-\ C' 00~ %0 a L
4, V)- --
z
<
0~ >
( 4( ( N(N (N r4c4( N (N- c- ( ( 14 (N (N (14(rN (4 r-
CL C
Q. c L
C- Vaz) -- an6\0
m 0 u
N 0
o: C
m- ra c
C~G. NC c:toN
< ~~C) - . L aZr0 0 ii a tC o m- (vC
(U CN -0
M C0 " 0.0 co0 C c toa
Uj 4- -o 0 o U)L 9
Cj eo oN N z 0'
.0- o. Zn CC)1..2 I ~
uj~'. -( a) V 0 0 ) M
'n Q < 6j M r Ln<
ru zC: t 44

entered the safety fairway closer to its center. Table 6 (lines 7 and 8) shows nosignificant difference between organizations for rudder orders, course orders, orspeed. Table 7, however, shows that the team organization took significantly moreradar fixes throughoit the approach. This was also verified in the observationswhich revealed that the team organization was more methodical and repetitive in itsperformance of radar fixes.
There was no observable difference in the selection of strategies between bridgeorganizations. However, those individuals from among both organizations who hadthe most Gu'f of Mexico experience tended to be the ones who traveled outside the_afiv fa~rways. There is evidene that bridge organization had the most effectupon perfor;::ance during the landfall approach. To define this effect, theinter3ction between particular enhancements with particular bridge organizations isfujrther examined.
4.2.1.4 Effect of Enhancement/Organization Interaction on Performance
An analysis of performance was conducted on the interaction effects betweentype of display enhancement used and the organization of the bridge personnel whoused it. ThIs particular analysis was expected to explain some of the morefundamental differences which were apparent in the main effects. It must be noted,however, that due to greatly decreased sample size at the interaction level of theanalysis, it was more difficult to derive statistical conclusions.
In the comparison of performance between bridge organizations for personnelusing radar based displays, the mean tracks were different only at the fairwayintersection. Again, the tean organimri groap maneuvered closer to the fairwaycenter (Figures B-9 and B-10). The largest difference in crosstrack variabilityoccurred within the first mile after entering the fairway. The traditionallyorganized subjects' variability was significantly l.ss and more uniform (Figure A-5)through the entrance. Tables (, and 7 (lines 9 and 10) show no difference inshi ' ;Idlinig or navigation technique as a result of bridge organization with radarand racons.
With ARPA based displays, the bridie teiam organized subjects had the smalleroverall crosstrack variability. The greatest difference (Figures A-6, B-Il, and B-12)occurred just before the entrance to the northy'/outh fairway. The two mean trackswere generally similar except it the fair,,vay entrance where the team organizationentered closer to the fairway center. From the center, they eventually moved tothe right half of the fairway: v')---,I- the traditional group cut the corner byentering the fairway on the right and re'nain,-d on the right all the way toward thecomplex. Again, no difference in ship control or navig,ion workload was indicated.
Lines 13 through 2'0 of the tables show the basic interactions between eachenhancement and each bridge oritan i/aton. They also provide insight into whatactually o(-curred diring the landfall appro.,ci and what ramifications thisperformance could have on a deepwater ) )rt approach in gerneral. No teamorganication used only tl,: rid.i, lisplay in this strAt,':;v, however, conclusions aboutthe radar/racon utilization can be nde. \Major dJff.re:ices in performance gleenedfrom the review of inter,tction tra k plnts and Tibles , throughi S are that regardlessof the display used, traditionally orginized hritoe personnel tended to enter thefairway along the right side and wit' a more .;ra. I 1natwer. Consequently, theycut acrss the fairway corne-. The trad it 0:. i gro-Jp w.as 'note consistent among
a a w • u " -' | ' na ~ ~ ~ ~ ~ ~ ~4.. . . . . . . . . . . . . . .. . .... . . . . . . . ... . ..

themselves in this behavior. Team organized personnel were more individual in theirgoal, some choosing a large course change, entering the fairway in the center, thenmaneuvering to the right.
Overall, there were no significant differences in CPA to traffic ships for eitherorganization or display enhancement. In fact, it is noteworthy that exemplaryperformance was demonstrated for all traffic avoidance (there were no oil rigs closeaboard in this scenario). As shown in Table 8, the following prevailed for each andevery variable tested:
" To the traffic ship close aboard:
a. Mean CPA was always greater than I nautical mile.
b. Lowest CPA was always greater than I nautical mile.
" To the traffic ship crossing:
a. Mean CPA was always greater than 2 nautical miles.
b. Lowest CPA was always greater than 1.5 nautical miles.
4.2.2 Analysis of Secondary Strategies
Approximately one quarter (24 percent) of all subjects in the landfall scenariochose to approach the deepwater complex without an explicit goal for where toenter the north/south safety fairway. These masters, of which exactly half weretraditionally organized and half were team organized, were completely unconcernedwith entering the fairway at the intersection and did not even feel that animmediate entrance to the fairway was important. They were first concerned withhandling the immediate traffic; then, as a result of where they "ended up," theywere concerned with setting a direct course for the complex and entering thefairway enrokite. The major implication here is that for a deepwater port facility ofsomewhat comparable design, a portion of the population can be expected toapproach the complex outside the safety fairway, particularly if their course isunobstructed by rigs or traffic and if entering the fairway at its entrance isperceived by them as inconvenient.
4.2.2.1 Analysis of Performance
Because there was some desire to compare performance exhibitod in thedominant landfall strategy with that of the secondary strategies, performancemeasures and analysis identical to the dominant strategy were employed. Theresults, however, are not tabulated to the equivalent detlil, buit are presented insum maliry tables in Section 5 (Table', 24 ind 25).
4.2.2.2 Effect of Display Enhancement and Bridge Organization on Per formance
Two secondary strategies were identified as a result of the prerun discussionswith subjects and as a function of how they actually transited the waterway.Subjects choosing strategy "A," shown in Figure 14, maneuvered less sharply to enterthe fairway than those using the dominant strategy. Strategy "B" subjects initiallymaneuvered to the east to pass astern of the crossing traffic ship; then !.ecause theywere well beyond the fairway intersection, set courses directly for the complex.Strategy "B" is shown in Figure 15.
46

14 ,4-d S
697123 !02 166 5 /4
4 1 2244 130 QbM1 6221
33 - 40 -6 2572'r 25J ' -
9 151 166 21
*36. 23 t281 27 248
46 27
4 _ " " 5! 231 3 -
35 154 " /S 26639
'4? 50 6 2 -: 3 8 365
236 392
3e 4 G 29 286 360 -
/55
45 2(' '-291 "
/ 6~
47 . 53 6-. 295 365 452
A~4
6( 158 384' 452
59 ," :"1 , A., 4133 ,"
t, -Ad 1 9 1 2 4 4 " "83/ .......6
STARTING 385 .
POINT 473
86 56 19 234 317
ttAt
206 286 380 478
_ 5 - '-4
178 337 SI4-, 11 AKE- A- Ht" I.,. , .,,t. I " ',"' ! (, \KA. W ', ' I ".
7 1, T , ?0[AN Ih,. , , '
T I tm w ', oi T10 I i k ;2659 32 38744
,I).= 385
FIGURE 14. SECONDARY STRATE(GY "A" OF THE LANDFALL APPROACH
47

'23 02 166 S 69
•4' • 9" ' p233 24'.
-62 A
48 6 254. 6 6 12" 16
9 2516 16€
23 28' 27 24846 " 27
" .. .- t -, v ... - - 31CL 5 __ .4' __ 4 3 /
~35 , 5 439
'4; 50 9E 2'. 3 a 365
IE 392
59 20; 131 286 360 "" - 4
/55I 416
45 72e91
6 Al .07:., 15 295 365 , 452 .:.
47 ,- 53 626(1 4560 .'384' 452
59 483.," .' ," /t13 191 244--
! 13 STARTING 385• LPOINT 473
b. 15b M~ 19 234 317 o
(09 6 206 286 380 478
5I 424
78 11 2! 7 323?
1 " 2 32 3874
FIuLtRE 15. SECONDARY STRATEGY "B" OF THE LANDFALL APPROACH1
48

Results of the analysis show that bridge organization did not have an effect onthe sel.,ction of strategy, nor on performance within each strategy. In bothstrategies, however, subjects using the ARPA base displays tended to make largercourse changes but only in the traffic avoidance maneuver. There were no otherdifferences in crosstrack variability or between mean tracks as a function of whichdisplay enhancement was used.
Comparisons in performance for shiphandling and navigation workload showed nosignificant differences between variables for either of the secondary strategies.This of course could be attributed to the significantly diminished sample size. CPAsto both "close aboard" and "crossing" traffic ships, likewise, showed no significantdifference as a function of variables (i.e., enhancement and organization). Theconclusion is that both secondary strategies were accomplished with normalshiphandling and navigation practice and that safety as a result of CPAs to hazardswas not affected. Summary Table 24 (lines 3 and 4) suggests that in secondarystrategy "A" ownship passed an average of 1.79 nautical miles ahead of the "trafficship crossing" while secondary strategy "B" ship passed an average of 2.27 nauticalmiles astern. In both instances, mean CPAs to the "traffic ship close aboard" wereabout equal.
4.2.3 Overview
Table 9 presents a brief summarization of the analysis of performance for thelandfall approach scenario. An adlitional discussion comparing strategies andscenarios is presented in Section 5.
The analysis of run profiles in conjunction with the quantitative analysis suggeststhat all three strategies employed during the landfall approach were conductedsafely and were characteristic of poor visibility performance. The effects of displayenhancement and bridge organization as summarized in Table 9 can be expected tohave similar effects on other deepwater port approaches. All conclusions whichwere derived from the chain of evidence could be generalized to near inshore portsor offshore ports in areas other than the Gulf of Mexico.
4.3 DERIVATION OF COASTWISE APPROACH STRATEGIES
The resultant tracks of all runs in the coastwise approach scenario are shown inFigure 16. Three unique strategies were identified in the coastwise approach,primarily as a result of the subjects' initial decision on where and how to conduct thetransit. These are identifitLd in Figure 17. The dominant strategy, which wasdemonstrated in 68 percent of the approaches, was to cut across the fairways,passing south of the rigs and obstructions to enter the north/south fairway near the100 fathom line. Each of the two secondary strategies was used by 16 percent of thesample population. Secondary strategy "A" cut across the fairways, passing to thenorth and through the rigs. This northwest course would enable ownship to enter thenorth/south fairway almost at the precautionary area. Secondary strategy "B" wasto enter the east/west safety fairway traveling southwest and to remain within ituntil its intersection with the north/south safety fairway.
As a result of the three different strategies certain rigs were encountereddiffe-rently throughout the scenario. A rig which was an obstacle to the desired
49

TABLE 9. SUMMARY OF LANDFALL APPROACH PERFORMANCE
" The three strategies of the landfall approach which were experienced in thisexperiment are characteristic of the type which can be expected in a deepwaterport operation.
" The frequency with which these three different strategies occurred can beconsidered representative of a deepwater port approach. A majority of the time,a concerted effort will be made to enter the safety fairway at its entrance. Withsignificantly less frequency, ships diverted from the entrance as a result oftraffic or other perturbation will return to the fairway as soon as possible; or willavoid any additional maneuver by entering the fairway at a small angle wellbeyond its entrance, providing the area is clear of rigs and traffic.
" No change in speed was indicated as a function of display enhancement or bridgeorganization.
" The frequency of loran fixes remained constant for all display enhancements andbridge organizations.
" CPA to traffic was unaffected as a function of which display enhancement wasused. In fact, traffic avoidance was considered both exemplary and realistic forthe given conditions.
* There was no significant difference in overall performance indicated solely as afunction of whether radar or ARPA was used during the approach.
" There was a major tendency to direct ownship's course on a common track whenusing racons, thus maintaining small group crosstrack variability.
" With the addition of the navigation option to ARPA, subjects exercisedsignificantly more maneuvering freedom as evidenced by their selection ofpreferred tracks and more precise positioning within the fairway
" Despite increased maneuvering with the ARPA/NAV display, subjects performedfewer radar fixes, fewer RDF fixes, and fewer DRs.
" While both organizations appeared equally intent on entering the north/southfairway near the center of the intersection, the team organization best achievedthis goal. The traditional organization varied from cutting off the corner toovershooting the centerline.
" In general, the team organization performed more consistent trackkeeping withARPA.
" There is a basic premise which must be resolved before the conclusions of thisexperiment can be extrapolated to deepwater port applications. The addition ofracons to the scenario tended to homogenize runs, making them similar intrackkeeping. Addition of the navigation option to ARPA tended to diversifyperformance by accommodating individual trackkeeping preferences. Thequestion that is raised relative to this particular waterway is whether it is moredesirable to have all masters following a single track such as that promoted bythe racon, or to provide masters with such precise information (i.e., ARPA/NAV)that they can maneuver at their own discretion with high confidence.
50

VVF12Sc 28 - ICi~ IB 51
PA P912 Chart // 3 .5 8 (!.,0
PA Ref4 r 2's Fl 4Secs 3' /~ 4 413 -N 2
3t 15 ir ,ep),PA 44
-r's ep) -4
PA Ref "U . PA 48 4526 46 C~s ' /Obh,
26 41 48( s.(- 44 56(6 ep
29 $A 1.6 2it" e~HR46 (1gltS HO N /5 5
594.2 5054A
5a 52
55 52 70 I67 5916
s 1 f 490
?812
2323
1544
C, 1 1291 .286 360 .. ......'
550

"yo~q RA R- Z.L38 - .*A e 1-7, 26 2
PI~ kq F14 Secs .34, 4(s c" 1 1-P -e PA 44- ,
p, , 41 32 " f
" 6 , ' , s e ) 4 1
Ft Secs .str PA 148 - ,y
RA Ref U
24 2 )
29 5 SECONDARY
29 /' 565 "STRATEGY 'A'"
15 (16% OF SAMPLE POPULATIONI 7 59
"5 5 a
P 55 a/I 563 6 70
A4 5... . ...... 63
90
11 0 .7 2i 2I 1 STARTING '- 114
I ~POINT ..
6( 1126169
Q34
2 22
DOIAT3 5 204-Ssr - STRATEGY 31C
168' OF SAMPLE POPULATION, "
-~6 266 392; 29 " .- " 8 365 '265
"9 373 ,
S CONDARY
S2 c STRATEGY r" 350
(16 OF SAMPLE POPULATION) 350 .. ,
7C 9 t 22- 29 SHADED AREA REPRSE TS"
TWO SIANDARD DEVIAIUN,
CEIUSSTRACK VARIAILITY W7lTH
6 Af THE MEAN TRALK DliAV-N
.07 - 158 295 365 452 THROU;H THE CENTER
- ,*479r
FIGURE 17. THREE STRATEGIES OF THE COASTWISE APPROACH
52

track and one which the subject had to maneuver around was labeled a "turn rig." Arig which was not a obstacle but which had to be passed close aboard to maintaincourse was labeled a "Pass abeam rig." A rig which was potentially hazardous butnot likely encountered was labeled "other rig." Figures 17 through 20 show the rigsfor each strategy labeled according to the way they are identified in the analysis.
Again, the dominant strategy of the coastwise approach scenario can beconsidered characteristic of anticipated deepwater port operations and consequentlyis the most thoroughly examined.
4.3.1 Analysis of Dominant Strategy
Figure 18 shows the mean track and crosstrack variability of the coastwiseapproach dominant strategy. The group includes an equal number of runs usingdifferent display enhancements and traditional or team bridge organizations. It wasanticipated that differences in crosstrack variability for this strategy would occurearly in the run as a result of maneuvering to pass the "traffic ship close aboard,"then maneuvering around the "turn rig" at a predetermined distance. At the sametime, there should have been a desire to make ownship's actions well known to thetraffic ship.
Neither the traditional nor the team bridge organization showed much differencein performance at this segment of the scenario. Greater differences in performancewere shown at lower levels of interaction between organizations with a specificenhancement and at an area in the scenario southwest of the "turn rig."
4.3.1.1 Analysis of Performance
Due to the similar nature of this scenario to the landfall approach, performancemeasures identical to the landfall scenario were employed (see Section 4.2.1.1).However, because of the routes selected by the strategies and their close proximityto drilling rigs, the following two additional measures were added:
1. Mean CPA to each rig
2. Lowest CPA to each rig
Statistical procedures were also similar to the landfall analysis.
4.3.1.2 Effect of Display Enhancement on Performance
No statistical differences were in evidence for any of the performance measuresbetween when the radar based displays were used and when the ARPA based displayswere used. Crosstrack variability was similar for both display types; but there wasan overall more northerly, close to the rigs, mean track when ARPA displays wereused. The two mean track and variability plots are shown in Figures B-13 and B-14of Appendix B. Tables 10 and 11 show no significant differences in ship control ornavigation workload between display types. CPAs to the "turn rig" and "pass abeamrig" also are not statistically different. Tiiese measures shown in Table 12, however.do indicate a t-d which is relevant to the research. When the ARPA baseddisplays were used (lines I and 2), ownship passed 1/2 nautical mile closer to both

VV F 1 2 Se 2 .
2833 " ' , |
0.9 29 Chart 1/358 8 2
L~ -zO 0e.R A O AR' 3' '41 /-- I -r,
RA Ref3412
-q 9 S - 31 m L 5 f - repPA I (3
I--
0 06 fmsre) "41 44 - 1 - 3
Fl 4 Secs I6RARfUs,, 1
AO PA 48 4
2 --- 4448 6 ; f m ep
29 ! 46 • ( 9ghted - Af 56
I I 0 f, .ep 9 5. / 1I_4 47c '' < - 59
.51 _ , 57 AO
5 65 70I , _ "6 7, 6 0 . , , 5 8 6 3' F
59 72-M
69 33' , 72
s A • 4 9060 44 SA
STARTING 114POINT
169134
' 5,. 281 232 2 3
3 345 204.
.54399
09 9 ".." 8 365 "265
236 392 373
2c 3 74 29, 286 360 - 42 I3. 0 ""
5 ,416 454 1,,,i, tP5
7 9 221 29'1 SHADIL) AREA REPRESENTSTWO STANDARD DEVIATION
6" CROSSTRACK VARIABI LIT " VITH,W THE MEI AN TRACK [DR,%%N
58 295 365 452 THRO(U'4 THE CENTER
FIGURE 18. DOMINANT STRATEGY OF THE COASTWISE APPROACH
54
- 1 I I -~~~I' i " -I

V. F-. 2 sec 28-0y
I -29Cha ' 8
-44R 2- 37
RA
24831 -5 ," eo)PA 36, 32
41 4. 9),, mm _
, . fr5932 50'6
/ 5 .... 65 70I' v 9 , '6' % 6
'46
2 • : 230
444-
266166 3272
29 - 3 8 365 .4,2623 6 3 96
222 29I 286 360 350 ' ' ' ' '..
"5 .- ~11 4 644 .~ .7
Ad6 Ad-I 59 N II. A
32 50 54 9,
0' '5 295 365 4" fl4IlU',.I A t,.,, N',,I '
0- -ft '-
' , FIGURE 19. SECONDARY STRATEGY "A" OF THE COASTWISE APPROACH
5,.

VV V 2Sees 8 28
Re Ref Char f /358 - ' -38.
.qt RI '2 ' . .. .. 2 . -l-~
,q9 o, RA Ref - 1Vj31 1 4 SeesA34 42
3- 30 (/6 's rep) - 41 4
F * .- 40 46-
2646 .6 c'26 AeU 2A'4
29 454'51 >2 156
) 29
29e" / b'e PI'' g 80. "~ -.' ?
47 , - ,
595 577....SO /
32 0 0 M 54 V STA G
5 50 52 70
/ / 58 65
167 459 6.
J69
~ .~'
6 959 729
- 39 3 3.
!07 166 4s v 9c
43 4. 13 1 B 0 "4
2' I
• Ik TWO STA dTNG 114. . ll /
6 ,,
1691. 9 '3 16 4
2 3 ' iii- -2
'93
92C,- 3 29, 286 360 - 3502
416 494. .4 l
29f SMALIE A; f, RUH Ff lf[ rr.
6 I CNOSST R ( 'jA V A I3JT VviTH
0~4* 58 25 3C5T45 ME AN TRACK~ Pfl.V'.%9 18 2 5 65 52THR~OUGH THlE CENTik
FIGURE 20. SECONDARY STRATEGY "B" OF THE COASTWISE APPROACH
56

TABLE 10. SHIP CONTROL AND COURSE KEEPING -
COASTWISE APPROACH, DOMINANT STRATEGY
Strategy Mean
Speed Engine Rudder CourseVariable (knots) RPM Orders Orders Orders
Enhancement Effect
1. Radar based displays 14.2 75 0.4 1.8 4.42. ARPA based displays 14.4 77 0.4 2.1 6.6
3. Radar 14.1 73 0.6 1.6 5.24. Radar/racon 14.5 77 0.2 2.0 3.55. ARPA 14.8 80 0.2 1.0 6.86. ARPA/NAV 14.0 75 0.5 3.3 6.5
Organization Effect
7 Traditional organization 14.6 78 0.3 2.0 5.68. Team organization 14.0 74 0.5 1.9 5.49. Radar based displays - traditional
organization 14.4 76 0.6 1.4 4.810. Radar based displays - team organiza-
tion 14.0 74 0.2 2.3 4.0
11. ARPA based displays - traditionalorganization 14.8 80 0.0 2.8 6.5
12. ARPA based displays - team organiza-tion 14.0 75 0.7 1.5 6.8
13. Radar - traditional organization 14.8 78 0.7 1.0 6.014. Radar - team organization 13.0 67 0.5 2.5 4.0
15. Radar/racon - traditional organization 13.9 74 0.5 2.0 3.016. Radar/racon - team organization 15.0 80 0.0 2.0 4.0
17. ARPA - traditional organization 14.8 80 0.0 1.0 7.518. ARPA - team organization 14.8 79 0.5 1.0 6.0
19. ARPA/NAV - traditional organization 14.7 80 0.0 4.5 5.520. ARPA/NAV - team organization 13.2 70 1.0 2.0 7.5
NOTE: No statistical difference at p- 0.10 level of significance indicated for anyvalue.
57

TABLE 11. NAVIGATION WORKLOAD -COASTWISE APPROACH, DOMINANT STRATEGY
Mean Frequency of
Radar Loran RDF FathometerVariable Fixes Fixes Fixes Fixes DRs
Enhancement Effect
1. Radar based displays 9.2 3.0 0.1 1.3 5.12. ARPA based displays 8.7 2.8 0.6 1.8 4.8
3. Radar 8.8 2.8 0.2 1.2 4.64. Radar/racon 9.8 3.3 0.0 1.5 5.85. ARPA 9.8 2.0 0.5 0.0 5.36. ARPA/NAV 7.8 3.5 0.7 3.5 4.3
Organization Effect
7. Traditional organization 6.8* 2.8 0.3 1.8 3.6*8. Team organization 12.2 3.0 0.4 1.2 6.5
9. Radar based displays - traditionalorganization 8.0 3.4 0.2 1.8 3.8
10. Radar based displays - team organiza-tion 10.1 2.5 0.0 0.7 6.8
11. ARPA based displays - traditionalorganization 5.3 2.0 0.5 1.8 3.3
12. ARPA based displays - team organiza-tion 11.4 3.5 0.7 1.8 6.2
13. Radar - traditional organization 6.3 3.3 0.3 1.0 3.314. Radar - team organization 12.5 2.0 0.0 1.5 6.5
15. Radar/racon - traditional organization 10.5 3.5 0.0 3.0 4.516. Radar/racon - team organization 9.0 3.0 0.0 0.0 7.0
17. ARPA - traditional organization 4.5 0.5 0.0 0.0 3.018. ARPA - team organization 15.0 3.5 1.0 0.0 7.5
19. ARPA/NAV - traditional organization 6.0 3.5 1.0 3.5 3.520. ARPA/NAV - team organization 9.5 3.5 0.5 3.5 5.0
* = statistically different at p!_O0.10 level of significance
• ' . . .. . ..t . ... . . ' ' - l • / I l i8

(N enu- (N4 0) '_r U\ P0 as N C)
Ea*.\ r r4 ~ as 01% Q\ ('-. C14 (Nr C s
W" C-lW W-'c m a" CINo "C\ W" W 9 N 0 VI
L) --- -,: - -, m WN Co C-
0~~C C: r-4~00 ', ~ . 0.0 ( .
V) U .
(1) 4t C4UC- C tC4 ~ -
Z M~ (0 0000 000000 00 00 00 as 0 (N" 0 .
ro o 0- -10( - C- 0N -(N - ('44 0" (N
cr, % 00- 00 0~ 0D -400 C 00 0 0
CL 000 " -t .00 00\0 -t (Nt V00 zj- L- r
V) E0(N UN 3C V -u C) 00 :t - Cn
4)bea-" -I-'. ('.0 '.0 11, 00 \Z0 (Nq 00 CN (00 r. r"
<N( <~\N'( (N(N (NA r4* C4J (N C\4' -4 (N (
CC.0
0 CD ' D - -00 o0N. ->..' f" - N
Mi (n- ( N (N( 4( (N -4 f' (14 ( N~ ffNN
C UC c
c C)
Uo o" > , M > ,.-1
-- -C( (a. C) - L - L - -.
0 L- 4
U]0 Ci 0 C (0 C
* rC (0NrO (, (0 L. uMCu k< C C o0 to O C "a '
'C N (0
.0 'o' CL 04 r"'C E C ' .a.C C C E0 >j , . " jC .CC 0c ( 0
4 m z C C)0 ( m m0 CK Of m Q
01E < n <- <
.59

0' (N '.t V ~ C
_ E
Z C- <N ( 0
z 04- C C).O
0 < O D N e
C-)
LU 4)
0 V) ~ - 0 ~ N e.-~ r~ 0 ~.O 0 00
z u az m o ~ 0 -0VN W
L-0.0
0
<c o ~ 14r~0
El
Ll <
I- C - .D-C,) 0 Cbl (N 0 '.
o < 'C -4
LU r0 a, c0 00
0- It C'14~ (
m 00 (n vl
0 cr N -_eu C
L 00
Z Z-
C <o
C:
W 0 OD
< 00 <' 0
60

rigs and 1/2 nautical mile further from the traffic ship close aboard. Lowest CPAsfor both types of displays were about I nautical mile to the rigs; but when the radarbase was used, only 1/4 nautical mile to the traffic ship. An examination of the runprofile sheets indicated that this single low CPA represented one isolated incidentwhich occurred not as a result of the experimental var'ia'le but from difficulty inreflection plotting the traffic ship. This problem was attributed to the reflectionplotting process and could have occurred either with or without the racons. Thedifficulty cannot be attributed to the racon variable. It is, however, unlikely thatthe problem would have occurred with an ARPA based displays since they performthe plotting task automatically.
With this incident discounted, the conclusion of the radar versus ARPAcomparison is that with ARPA type information available, masters may elect totransit closer to rigs in deference to other traffic. This conclusion, however, is notstatistically supportable, and is further examined in the remaining analysis.
Comparison Between Radar, Radar/Racon, ARPA, and ARPA/NAV Displays. Whencomparing the radar with radar/racon display performance, differences are shownboth for mean track and crosstrack variability (Figures A-7, B-15, and B-16). Nodifferences are shown in CPAs to rigs (Table 12, lines 3 and 4). The significantdifference in CPA to the "traffic ship close aboard" as discussed previously, isdiscounted as unrelated to the racon enhancement. Tables 10 and 11 show nostatistical difference in shiphandling or navigation. Nevertheless, it is noteworthythat when the radar/racon was used, absolutely no RDF fixes were taken. Thissupports conclusions of the landfall approach that racons offer both redundant andalternative quality positioning information.
On the basis of the trackkeeping analysis and simulation observations, it ispossible to conclude that subjects tended to focus their course by ranging on theracon. The racons resulted in approximately two-thirds less variance in track thanthe radar alone because of this focusing effect. Also the racons appeared topromote a straighter mean track with more consistency among all subjects.
In the comparison of performance between when ARPA and ARPA/NAV wereused, there were no observed differences in mean tracks, but a significantly smallervariability with the ARPA/NAV display particularly at the "turn rig." See FiguresA-8, B-17, and B-1. When navigating with ARPA, the masters took no Fathometerfixes; while with the ARPA/NAV, they took as many Fathometer fixes as loran fixes.The only explanation for this behavior is offered from a further review of Table I I(lines 17, 18, 19 and 20). The table suggests that with the ARPA/NAV whichsyntheti:.tll displayed both rig location and fairway boundaries, masters wereinclined to maintain a check of the display's accuracy as well as their own position.CPAs to traffic and rigs were unaffected (Table 12, lines 5 and 6) by the navigationoption. Mean CPAs to both rigs were about 2 nautical miles; and as might beexpected, the low crosstrack variability with ARPA/NAV resulted in a lowvai ability of CPAs to the "turn rig."
In conclusion, there were no major differences in shiphandling or navigation as afunction of which enhancement was used for the coastwise approach. Use of eitherracons or the navigation option tended to increase trackkeeping consistency amongmasters; but overall, all mean tracks were relatively simnilyr, ai1d p1rformancedifferences in CP/\s to the traffic ships or rigs do not warrant safety concerns.
61

4.3.1.3 Effect of Bridge Organization on Performance
In the coastwise approach scenario, the traditional bridge organization'sperformance differed from the team organization's in several ways. The traditionalorganization's mean track was approximately I nautical mile north and closer to the"turn rig" than the team organization. At the same time, the traditionalorganization's crosstrack variability was low while the team group's was high. Tothe west of the "turn rig," mean tracks were similar, but crosstrack variability forthe traditional group gradually increased. This increased variability was the resultof individual differences in maneuvering for the "traffic ship crossing." Theseresults are shown in Figures A-9, B-19, and B-20. A review of Table 12 (lines 7 and8) shows almost a I nautical mile greater CPA to the "turn rig" for the teamorganization. The analysis of navigation workload, Table I1 (lines 7 and 8) showsthat the team organization took significantly more radar fixes and made more DRsthan the traditional groups. This is consistent with the landfall approach scenariowhich also showed the team organization making more radar fixes. Again, thebehavior is believed to be caused by differences in bridge procedure which result inmore repetitions for the team organization. With no other significant differencesshown for shiphandling (Table 10) or navigation (Table 11), it must be concluded thatthe major difference between bridge organizations was how they chose to maneuveraround the rig and, later in the run, how they handled the crossing traffic.
The traditionally organized group consistently chose a 2-nautical mile CPA tothe "turn rig" and consistently maintained this distance. On approaching the "trafficship crossing," however, the mean CPA was 3 nautical miles but with largevariability. One subject passed this ship at less than I nautical mile. The teamorganization out of preference chose different distances to pass off the "turn rig"and thus achieved a high variability. The team organization's lowest CPA to the"turn rig" was about the same as the traditional group's. However, at the "trafficship crossing," the team organization was more consistent in its trackkeeping andCPA. It must be concluded that the team organization exercised more individualpreference in maneuvering around stationary objects but more consistency whenmaneuvering around traffic.
4.3.1.4 Effect of Enhinc inment/Organization Interaction on Performance
When comparing between bridge organizations for subjects using the radar baseddisplays, there were again those differences in mean track and crosstrack variabilitywhich were reflected in the analysis of major effects (Figures fl-21 and B-22i.Again, the team group's tracks show large variability at the "turn rig;" but withradar, the team group chose to keep even further from the "pass abeam rig" (Table12, lines 9 and 10). In effect, when the team organization used radar based displays,its CPAs to all rigs and traffic averaged 1/2 nautical mile more than the traditionalorga li.ation's. Aside from this, there were no shiphandling or navigationdifferences.
The absolute values of CPA for both organizations suggest that when radar alonewas used, both teat is operated more conservatively and safely in their selection ofpassing distances off rigs and traffic.
With the ARPA based displays, the team organization's mean CPA was largeronly at the "turn rig" (Figures B-23 and B-24). Crowstrack variability was similar tothat for radar, but the traditional group', (-1P.A to the rig was I nile smaller. This is
62

shown in Table 12 (lines II and 12) and further reflected in lines 17 through 20.Table II (lines 13 through 20) shows a prevailing pattern of more DRs for the teamorganization with all enhancements. However, when the radar/racon enhancementwas used by the traditional organization, its subjects made as many radar fixes asthe team organization, and more than they had for any other display enhancement.While this finding is not statistically supportable, it shows that the traditionallyorganized subjects did make good and consistent use of the racons when they wereprovided, and the racons may have prompted a more methodical ad'herence to thenavigation process.
In conclusion, there is evidence that the traditionally organized and teamorganized subjects did not benefit equally from ARPA information. That this effectwas actually caused by the way personnel were organized is doubted. Instead, it issuggested that the population from which the subjects were obtained and theirprevious experiences may have contributed to these differences. Considering theiroperating climate, formal training, and the sophistication of equipment to which theteam organized personnel are normally exposed, it is reasonable to assume that theymay have been more familiar with the operation of ARPA systems and theimplementation of ARPA information.
While this is a prominent finding of the coastwise approach scenario, it isimportant to recognize that the introduction of racons had probably the singlelargest impact on performance across all organizations. The fact that racons, as inthe landfall approach, tended to focus trackkeeping and thus reduce variability oftracks among subjects is in itself a factor of safety worth further investigation.Also, it is noteworthy that the racons were used extensively, perhaps more than anyother enhancement, by the traditionally organized subjects. This contribution ofracons is again revealed in the analysis of secondary strategies.
4.3.2 Analysis of Secondary Strategies
Two secondary strategies were identified fo- the coast'vise approach. Secondarystrategy "A" shown in Figure 19 was chosen by 16 percent of all subjects, and theonly displays used were radar/racon and ARPA/NAV. This strategy required clearingthe "traffic ship close aboard" (i.e., otithound from the Southwest Pass), maneuveringaround rigs to the north, then passing northeast through a gap in the charted rigpattern.
Secondary st-ategy "B" shown in Figure 20 was also chosn by 16 percent of allsubjects, and they used all display enhancements to accomplish it. The plan for thisstrategy was to remain within the east/west fairway to the intersection, then directthe ship up the north/south fairway to the complex. The distribution of thesestrategies is important to deepwater port applications because it suggests that mostsubjects will select the economical and convenient course as long as it is perceivedas safe. The majority of subjects chose the dominant strategy to cut across thefairways by identifying a clear path and passing south of the rig structures. Thesubjects who chose secondary stritegy "A" weighed the risk of traveling outside therigs versus transiting through them. They det-,r iined that ample CPAs to rigs couldbe achieved either way, and once their course was sufficiently perturbed to thenorth as a result of maneuvering for the "traffic ship close aboard," tht-y elected thenorthern route. The secondary strategy "[" group appeared most conservative andperhaps artificu 'ly so. Of those that did continue down the east/west fairway to theintersection, one subject suggested he would probably cut off the intersection corner
63

anyway while another suggested that he would probably not go this way if givenanother opportunity. It is the conclusion of this research, although based on a smallsample size, that in deepwater port applications masters will probably not hesitateto depart from or cross over fairways and transit among rigs in which CPAs inexcess of their own criteria are achievable. The fact that uncharted obstructions orship traffic may be present did not seem to alter the masters' decision.
4.3.2.1 Analysis of Performance
Because there was some desire to compare performance exhibited in thedominant coastwise strategy with that of the secondary strategies, performancemeasures and analysis identical to the dominant strategy were employed. Theresults, however, are not tabulated to the equivalent detail, but are presented in thesummary tables in Section 5 (Tables 24 and 25).
4.3.2.2 Effect of Display Enhancement and Bridge Organization on Performance
Secondary strategies were chosen only by subjects from among the traditionalorganization. While insufficient size of the experimental sample precludes astatistical conclusion, the lack of any team organized participation in the secondarystrategies suggests that organizations (and again their subsequent experience,training, equipment, etc.) could have been a factor in the selection of thesestrategies. If so, it implies that given the factors which comprise a teamorganization, it may be possible to predict how and under what conditions differentmasters would transit the waterway in approach to a deepwater port complex.Regretfully, this experiment can offer little for the explanation of such occurrencemuch less statistical proof that it even existed. It is noteworthy, however, that themasters who selected secondary strategy "A" did have extensive previous experiencein Gulf of Mexico operations.
In a comparison of performance between when the radar/racon was used andwhen ARPA/NAV was used for secondary strategy "A," the ARPA/NAV mean trackwas continuously further south. Radar/racon crosstrack variability remained lowdue to masters' ranging on the northern most racon. ARPA/NAV, however, tendedto draw the subjects' attention to objects closer and more immediate, enabling therito steer from rig to rig. The crosstrack variability for ARPA/NAV was more thaifour times greater than the radar/racon variability at the onset of the runs. Thiswas due to preferential handling of the traffic ship when collision avoidanceinformation was provided. As ownship approached the north/south safety fairway,crosstrack variability reduced as a result of splitting the distance between the "turnrig" and "pass abeam rig." See Figure 19.
A statistical comparison of performance between display enhancements withineach secondary strategy was not possible due to the small sample population.Nevertheless, a number of factors were evident and are reported. In the secondarystrategies the comparison of performance between when racon and ARPA/NAV wereused yielded some noteworthy results.
There was no difference in CPA to any of the rigs passed abeam in secondarystrategy "A." Mean CPA to the closest rig was 1.79 nautical miles for radar/raconand 1.86 nautical miles for ARPA/NAV. Lowest CPAs were 1.79 nautical miles and
64

1.72 nautical miles, respectively. A comparison in CPAs between all rigs passedabeam in the transit showed not only no difference as a function of displayenhancement but also that all were passed at approximately the same 2 nauticalmile distance. In effect, no difference in hazard avoidance was shown as a functionof display enhancement for the transit north between the rigs. It is concluded thatall the transits were conducted safely.
For CPAs to traffic and the rigs in secondary strategy "B," again insufficientsample size prevented statistically supportable conclusions. Nevertheless, areporting of the trends and Implications is warranted. Since in this strategy ownshipremained inside the fairway, a close passing to an inbound ship as well as passingabeam the "turn rig" were required. Lowest CPAs to these potential hazards arelisted below.
Enhancement CPA to Traffic Ship (nm) CPA to Rig (nm)
Radar 0.54 2.91Radar/racon 0.17 3.58ARPA 0.49 2.95ARPA/NAV 1.11 2.12
It is evident from a review that tradeoffs in CPA between the potential hazardscould well be a function of the display enhancement used. With radar, radar/racon,and ARPA, CPA to traffic is uncharacteristically low (about 1/2 mile) for a poorvisibility condition; yet distance off the rig is about 3 nautical miles. WithARPA/NAV, the traffic CPA is increased to about I mile; and the distance to therig, an acceptable 2 miles. In other scenarios and strategies of this experiment,CPAs of 1 and 2 miles were found to be the norm. It appears that there is evidenceto suggest that ARPA/NAV does promote safer passing of potential hazards whenownship is passing between these potential hazards and when fairway boundaries, riglocations and traffic motion are well delineated.
4.3.3 Overview
An additional discussion comparing strategies and scenarios is presented inSection 5. Table 13 summarizes the findings and conclusions of the coastwiseapproach analysis. It is derived from the statistical analysis of measures anddescriptive tita obtained during the simulation such as research notes, structuredobservations, and responses to subject questionnaires. In general, it can beconcluded that the strategies demonstrated represent an accurate accounting of thetype of approaches which would be attempted at a deepwater port complex. Allconclusions which were derived from the chain of evidence could be generalized tonear inshore ports or offshore ports in areas other than the Gulf of Mexico.
4.4 DERIVATION OF MOORING MASTER PICKUP APPROACH STRATEGIES
The resultant tracks of all runs in the mooring master pickup approach scenarioare shown in Figure 21. Three different strategies were id ,-tified primarily as afunction of how quickly subjects elected to slow and their technique for slowing.The dominant strategy, which was demonstrated in 92 percent of the approaches,appeared to be te most practical in terms of shiphandling and navigation. Subjectsslowed ownship by redic:,i g rpm very soon into the run and maintained course untilclose to the pickup area, then altered course to position the ship for the mooring
65
A2

TABLE 13. SUMMARY OF COASTWISE APPROACH PERFORMANCE
" Of the three strategies which occurred in the coastwise approach, the strategywhich passed south and outside the rigs but between the safety fairways probablyis most representative of what would occur under comparable conditions in adeepwater port approach.
" The two other strategies, one which passed through the rigs and one whichfollowed the safety fairway some 30 miles "out of the way" would probably occurin deepwater port applications at a lower frequency than occurred in thesimulation.
* No change in speed was indicated as a function of display enhancement or bridgeorganization.
" There was very little reliance upon RDF for navigating within this scenarioprobably because rig patterns were always within radar range.
" While there was no significant difference in overall performance indicated solelyas a function of whether radar or ARPA was used. There is evidence to suggestthat with radar subjects achieved lower CPAs to traffic.
" The addition of racons in the scenario significantly reduced track variabilityamong both bridge organizations. It also promoted straighter tracks with aresultant direct and consistent route to the port complex.
" The tendency of both bridge organizations to use racons for ranging was mostdramatically demonstrated in this scenario.
" No differences in overall performance between ARPA and ARPA/NAV wereindicated for the coastwise approach scenario. This was probably due to thedominant strategy which transited between fairways and thus made little use ofthe ARPA/NAV displayed information (i.e., fairway boundaries).
" Differences were indicated between ARPA and ARPA/NAV at the "turn rig"where fairway boundaries could be displayed. These differences showed moreconsistency of CPAs when maneuvering around the "turn rig" with ARPA/NAV.CPAs to other rigs were relatively unaffected.
" The team organization showed greater individual preference in its selection ofCPAs to rigs than the traditional group although both organizations minimumCPAs were comparable and adequate.
* The team organization showed greater consistency in its achievement of CPAs totraffic ships than the traditional organization although much of this occurredonly when the team organization used ARPA.
" This consistency in performance when the team organization used ARPA also isreflected in more uniform maneuvering around the "turn rig" with other traffic inthe vicinity.
" [n addition to verifying that racons tend to promote a common track, thecoastwise scenario further reinforced the finding that team organized subjectstended to better utilize and implement ARPA information in the conduct of theirtask. Whether this is due to their organization, training, or equipmentexperience was not resolved by the experiment.
66

"vt IC "A" -l, ecs C* RAe Ref qyM * I
RA Ref / C0 R "2"29 /RA-q 1/" R Ref31/
G 3F1 Secs / 34F 1 4Secs
RA Ref / " (5 fm
* (16 tmsG s1" lf Sub mnF I 4 Secs aa ohsr.rs
, RA Ref26 I..
46I 29 45•
S"/ Obs tr rep Subm" 47/(5 frs
.,32 .5 0 -
- " ', c ed) *-P
, \ - / ,,/51 ",- -. / . M
- -- 167 '9 " 59-" / • Platiorms (I g
II0 SfA4 F l-**7. -
FIGURE 21. IN:DIVIDUAL SHIP TRACKS DURINGrHE MOORING MASTER PICKUP APPROACH
67

master's arrival. Secondary strategies "A" and "B,"1 however (see Figure 22),involved rudder cycling and hard rudder maneuvers to slow the ship. The applicationof the more extreme measures exhibited in the secondary strategies is notconsidered necessary for slowing the ship in the required distance. The fact that 92percent of all runs were completed satisfactorily without it provides this assurance.A review of the data shows that both secondary strategies occurred with differentdisplay enhancements, different bridge personnel organizations, and at a differenttime in the simulation schedule. For one subject, it was his first run through thisscenario; for the other subject, it was his second run. For these reasons, it wasdecided to analyze these two strategies separately.
Again, the dominant strategy of the mooring master pickup approach can beconsidered characteristic of anticipated deepwater port performance and conse-quently is the most thoroughly examined. While the secondary strategies were ofsignificantly lesser frequency, their actual occurrence suggests that users probablywould not hesitate departing from the safety fairway in order to accomplishshiphandling goals (such as slowing) which they consider more important.
4.4.1 Analysis of Dominant Strategy
Figure 23 shows the mean track and crosstrack variability of the dominantmooring master pickup strategy. The group includes approximately twice as manytraditional organized subjects as team organized subjects. There are an equalnumber of runs in this scenario for each display enhancement. The strategyconsisted of subjects heading toward the precautionary zone without major coursechanges until they arrived at the pickup point. Maneuvers at and beyond the pickuppoint were based solely upon individual preference (see Figure 21) and, as a result,represented substrategies. Subject performance within these substrategies was notquantified but is analyzed descriptively in Section 4.4.4.
The analysis plot in Figure 23 shows small track variability early in the run whichgradually increased as individual preferences for the pickup developed. Somesubjects elected to remain to the right, others to the left of the fairway; still otherstransited in the center. This difference in behavior is not attributed to displayenhancement although bridge organization with its consequent experience, training,and procedures may have had an effect. This was investigated.
4.4.1.1 Analysis of Performance
Performance measures and the application of statistics to the dominant strategyof the mooring master pickup approach are the same as items I through 5 for thelandfall approach scenario (see Section 4.2.1.1). The absence of rigs and trafficclose aboard made CPA an impractical measure of performance. CPAs to themooring master pickup point were never achieve-d duoe to the design of the scenario(i.e., according to the script, the mooring master never arrived).
Descriptive measures of performance included:
1. Decision of subject at first delay
2. Mianeuver technique following first delay
3. Ability to achieve the maneuiver goal following first delay
68

vv i f
WISc Fl 2', FI Secs / 0 2
SRATG RefEJ
F4 OE SAMPL POPULAT1ION)f
STRATEGY SAb
(92~(% O F SAMPLE POPULATION ) ~ 15 fr
2 5
STARTIANGAlIDE
51I( -SAME
FIGURE 22. THREE STRATEGIES OF THEMOORING MASTER PICKUP APPROACH
69

jke RA Ref qyM *- 0 2
N 34
RARf31 5~ * fm/ (16 tins
GU8 SubmF*. Sc obtsrs
26
4629 4
Obs ir rep Sb
~1 ~~(/5 fins
32 50
5a 52
167 SHADE D AREA REPRE SNIS/TWO STANO ( )[ I AIW
--- CR0 STRA( 1' VARI'BLT VOT
110 Sf 4 THE "I FAN I, -K
FIGURE 23. DOMINANT STRATEGY OF THEMOORING MASTER PICKUP APPROACH
70
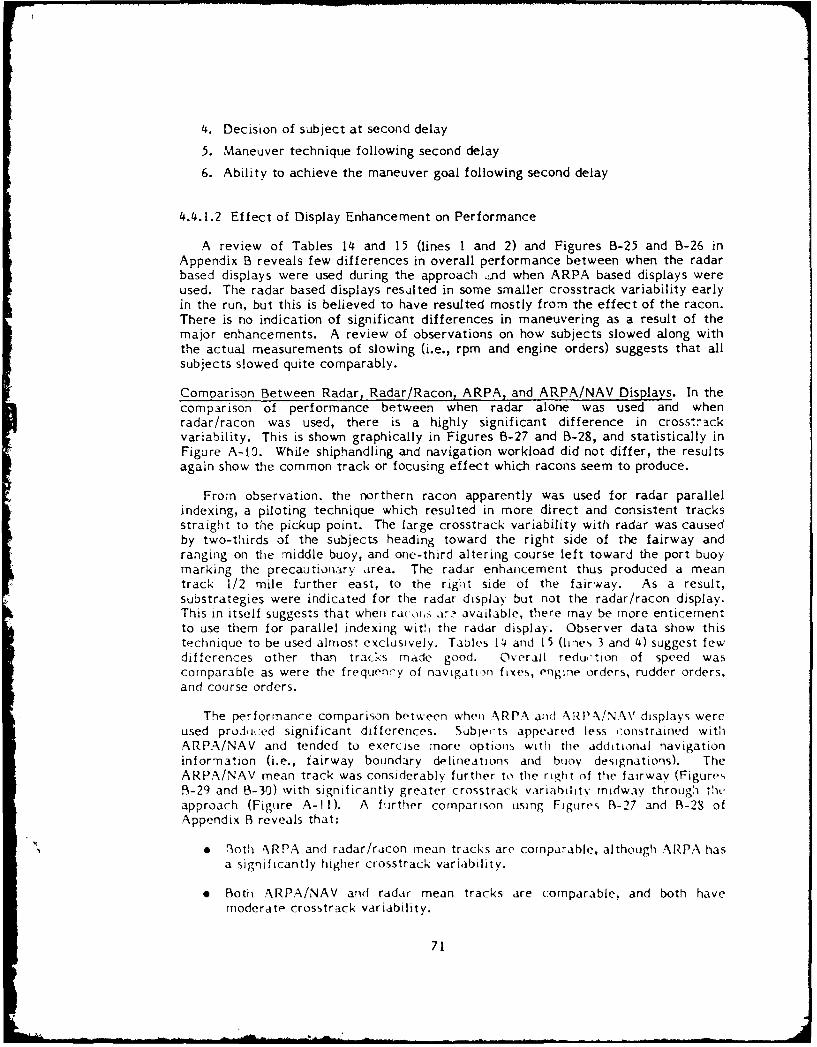
4. Decision of subject at second delay
5. Maneuver technique following second delay
6. Ability to achieve the maneuver goal following second delay
4.4.1.2 Effect of Display Enhancement on Performance
A review of Tables 14 and 15 (lines I and 2) and Figures B-25 and B-26 inAppendix B reveals few differences in overall performance between when the radarbased displays were used during the approach ,jnd when ARPA based displays wereused. The radar based displays resulted in some smaller crosstrack variability earlyin the run, but this is believed to have resulted mostly from the effect of the racon.There is no indication of significant differences in maneuvering as a result of themajor enhancements. A review of observations on how subjects slowed along withthe actual measurements of slowing (i.e., rpm and engine orders) suggests that allsubjects slowed quite comparably.
Comparison B~etveen Radar, Radar/Racon, ARPA, and ARPA/NAV Displays. In thecomparison of performance between when radar alone was used and whenradar/racon was used, there is a highly significant difference in crosstrackvariability. This is shown graphically in Figures B-27 and B-28, and statistically inFigure A-1. While shiphandling and navigation workload did not differ, the resultsagain show the common track or focusing effect which racons seem to produce.
From observation, the northern racon apparently was used for radar parallelindexing, a piloting technique which resulted in more direct and consistent tracksstraight to the pickup point. The large crosstrack variability with radar was causedby two-thirds of the subjects heading toward the right side of the fairway andranging on the middle buoy, and one-third altering course left toward the port buoymarking the precautionry area. The radar enhancement thus produced a meantrack 1/2 mile further east, to the right side of the fairway. As a result,substrategies were indicated for the radar display but not the radar/racon display.This in itself suggests that when racki,s ara available, there may be more enticementto use them for parallel indexing with the radar display. Observer data show thistechnique to be used almost exclusively. Tables 14 and 15 (lines 3 and 4) suggest fewdifferences other than tracks made good. Overall reduction of speed wascomparable as were the frequency of navigation fixes, engine orders, rudder orders,and course orders.
The performance comparison between when ARP .\ and ARP.\/NAV displays wereused prodiced significant differences. Subjects appeared less constrained withARPA/NAV and tended to exercise more options with the additional navigationinformation (i.e., fairway boundary delineation% and buoy designations). TheARPA/NAV mean track was considerably further to the right of the fairway (FiguresB-29 and B-30) vith significantly greater crosstrack variabilty midway through theapproach (Figure A-1 1). A further comparison using Figures B-27 and 13-28 ofAppendix B3 reveals that:
* 1.oth N\RPA and radar/racon mean tracks are comparable, although ARPA hasa significantly higher crosstrack variability.
* Both ARPA/NAV and radar mean tracks are comparable, and both havemoderate crosstrack variability.
71

TABLE 14. SHIP CONTROL AND COURSE KEEPING -
MOORING MASTER PICKUP APPROACH, DOMINANT STRATEGY
Strategy Mean:
Speed Engine Rudder Course
Variable (knots) RPM Orders Orders Orders
Enhancement Effect
1. Radar based displays 7.5 17 3.6 2.2 1.82. ARPA base displays 8.1 25 3.4 1.1 2.6
3. Radar 7.5 20 4.0 2.3 2.34. Radar/racon 7 4 14 3.2 2.0 1.25. ARPA 7.6 19 3.7 0.2 2.56. ARPA/NAV 8.6 31 3.2 2.0 2.7
Organization Effect
7 Traditional organization 8.0 23 3.7 1.8 1.88. Team organization 7.3 17 3.0 1.1 3.1
9. Radar based displays - traditionalorganization 7.5 17 3.9 2.4 1.2
10. Radar based displays - team organiza-tion 7.4 16 3.0 1.8 2.8
11. ARPA based displays - traditionalorganization 8.4 28 3.6 1.3 2.2
12. ARPA based displays - team organiza-tion 7.3 17 3.0 0.3 3.7
13. Radar - traditional organization 7.3 17 4.0 3.5 2.014. Radar - team organization 8.2 36 4.0 0.0 3.0
15. Radar/racon - traditional organization 7.8 18 3.7 1.2 0.516. Radar/racon - team organization 6.6 6 2.0 3.5 2.5
17. ARPA - traditional organization 7.8 20 4.3 0.0 2.018. ARPA - team organization 7.3 16 2.5 0.5 3.5
19. ARPA/NAV - traditional organization 8.9 34 3.0 2.4 2.420. ARPA/NAV - team organization 7.2 21 4.0 0.0 4.0
NOTE: No statistical difference at p±-,10 level of significance indicated for anyvalue.
72

TABLE 15. NAVIGATION WORKLOAD -
MOORING MASTER PICKUP APPROACH, DOMINANT STRATEGY
Mean Frequency of
Radar Loran RDF FathometerVariable Fixes Fixes Fixes Fixes DRs
Enhancement Effect
1. Radar based displays 7.2 0.9 0.1 0.3 2.62. ARPA based displays 6.2 0.7 0.0 0.9 1.6
3. Radar 6.3 0.5 0.0 0.2 2.54. Radar/racon 8.0 1.3 0.2 0.5 2.75. ARPA 7.0 0.7 0.0 1.7 2.86. ARPA/NAV 5.5 0.7 0.0 0.2 0.3
Organization Effect
7. Traditional organization 5.8 0.8 0.1 0.2 1.88. Team organization 8.9 0.9 0.0 1.6 2.7
9. Radar based displays - traditionalorganization 6.8 0.7 0.1 0.2 2.6
10. Radar based displays - team organiza-tion 8.0 1.2 0.0 0.5 2.5
11. ARPA based displays - traditionalorganization 5.0 0.8 0.0 0.2 1.1
12. ARPA based displays - team organiza-tion 10.0 0.3 0.0 3.0 3.0
13. Radar - traditional organization 6.8 0.5 0.0 0.2 3.014. Radar - team organization 5.5 0.5 0.0 0.0 1.5
15. Radar/racon - traditional organization 6.8 1.0 0.2 0.2 2.316. Radar/racon - team organization 10.5 2.0 0.0 1.0 3.5
17. ARPA - traditional organization 6.2 0.7 0.0 0.2 2.513. ARPA - team organization 8.5 0.5 0.0 4.5 3.5
19. ARPA/NAV - traditional organization 4.0 0.8 0.0 0.2 0.020. ARPA/NAV - team organization 13.0 0.0 0.0 0.0 2.0
NOTE: No statistical difference at p <0.10 level of significance indicated for anyvalue.
73

A check of ship control and navigation workload measures (Tables 14 and 15)shows overall few loran, RDF and Fathometer fixes regardless of which enhance-ment was used. Although not statistically significant, there were considerably fewerDRs when ARPA/NAV was used which would be expected.
In general, conclusions from the mooring master pickup approach in terms ofdisplay enhancement, must be drawn from the trackkeeping performance. This canbe summarized as follows:
1. With the radar display, traditional pilotage prevailed. There was a tendencyby some subjects to keep to the center of the fairway; however, most subjectsgradually moved to the right to avoid potential traffic and because they consideredthis a more "comfortable" (sic) position to receive the mooring master.
2. When racons were available, all subjects headed directly toward the pilotpickup point in the center of the fairway.
3. With thie ARPA display, most subjects kept to the center of the fairwayconfident with their added ARPA infornation that they could avoid any trafficencounter. Some subjects gradually moved to the right similar to the radarenhancement.
4. When the navigation option was added to ARPA (i.e., ARPA/NAV), somesubjects immediately moved to the right, some remained left, and others continuedup the center. Apparently the ARPA/NAV display instilled the greatest confidence
in the subjects, allowing them to maneuver and position themselves in t.Ne fairwayexactly where they intended
4.4.1.3 Effect of Bridge Organization on Performance
When comparing traditional organization with team organization in the mooringmaster pickup approach, no differences in performance were indi7-ited. Figures B-31 and B-32 show almost identical trackkeeping performance while Tables 14 and 15show no significant shiphandling or navigation workload differences.
4.4.1.4 Effect of Enhancement/Organization Interaction on Performance
As might be expected by the previous discussion, little difference in performancewas indicated between bridge organizations as a function of whether radar based orARPA based displays were used. Instead, the interaction analysis concentrated oni-idividual enhancements and the effect bridge organization might have on them.
Th M of trick pints for the traditional and team organizations when they- a small difference in mean tracks but significant difference in.mtv. The traditionally organized group had more than double the
. . ,th,, mooring master pickup point, wLth their mean trackt>, fr iwjv. All team organized subjects using radar kep,
v,r,,-t!on demonstrated comparable speed reduction,
S ir rv, , 'i )%(-(I')o J.ference between
I . - 1 -;a')11t . Tlw s is ofie )f the

more useful findings of the mooring master pickup scenario since it indicates thatwhen racons are used, trackkeeping performance may be highly predictableregardless of bridge personnel experience, training, or organization.
When comparing ARPA and ARPA/NAV trackkeeping performance betweenbridge organizations, mean tracks and crosstrack variability were similar, and thisvariability gradually increased for both organizations up to the mooring masterpickup point. See Figures A-12, B-31 and B-32. Also, there were no significantdifferences in shiphandling or navigation tasks between the bridge organizations. Itis concluded that whatever differences did occur between ARPA and ARPA/NAV,they were not the result of bridge personnel experience, training or organization.
It is further concluded that the -oininant strategy was conducted safely by allsubjects and that differences in the approach to a deepwater port mooring masterpickup will be manifest in the approach route and not the means by which it isachieved. As a result, the safety and appropriateness of a mooring master pickupcould possibly be enhanced by specifying the approach route; and this, as theexperiment has shown, could be achieved through the use of prudently locatedracons.
4.4.2 Analysis of Secondary Strategies
Only 8 percent of the sample population chose a strategy different from thedominant strategy in the mooring master pickup approach scenario. These secondarystrategies, shown in Figure 22, differed from the dominant strategy both in trackand rudder utilization with a resultant significant effect on ship speed. While thetwo strategies were conducted differently and are so analyzed, the result common toboth but different from the dominant strategy was an initial major reduction inspeed with a subse jrit very slow approach toward the mooring master pickup point.The requirement to remain within the safety fairway was essentially deferred.
4.4.2. 1 Analysis of Performance
To compare performance exhibited in the dominant mooring master pickupapproach strategy with that of the secondary strategies, performance me.sires andanalysis identical to the dominant strategy were employed. Small sample size of thesecondary strategies precluded a statistical comparison of many measures; never-theless, data are presented in Section 5 (Table 25).
4.4.2.2 Effect of Display Enhancement and Bridge Organization on Performance
In secondary strategy "A," a traditionally organized bridge crew using the radardisplay moved well to the left of the fairway and used the platform racon and buoy'number one for ranging. The crew performed few radar fixes. They initiallyreduced speed quickly by reducing rpm and rudder cycling, then increased rpm forshort durations to maintain steerageway. Overall the approach to the pickup pointwas very slow. This strategy was best characterized by the crew's intention to slowthe ,hip ipickly and early instead of gradually. This is shown in the summary datapresented in Section 5 (Table 25, line 12) by slowest mean speed, lowest mean rpm,nost engine orders, and most rudder orders.
In secondary str.egy "B," a team organization using the AIZPA/NAV displayirninvdiately ordered hard right rudder to slow the ship, made a lengthy turn outside
75

the fairway, then reentered it further north but at a much reduced speed. Thesubjects stated that they would much prefer to have the mooring master wait forthem than have to station keep or circle at the pickup point. The summary data inSection 5 (Table 25, line 13) show that this strategy was conducted at an averagecomparable speed with the dominant strategy but with considerable manipulation ofthe throttle. In fact, while the dominant strategy gradually reduced speed,secondary strategy "B" slowed early in the initial maneuver, then proceeded at aconstant slow speed to the pickup point.
*In summary, the conduct of both secondary strategies appears to have been avery well planned and executed tactic for approach to the mooring master pickup.Whether the initial maneuver to slow was re-ally warranted or even necessary canonly be judged by the outcome. If it is desirable to approach at a slower speed, inthe real world, the master would have ample opportunity to do so prior to where hestarted the simulation. In this case, such a maneuver might not be necessary.
4.4.3 Overview
The conclusion of the analysis and its application to deepwater ports operationssuggests that the approach as demonstrated in the dominant strategy is valid andsafe. It shows the feasibility of a gradual reduction in speed. The approachesdemonstrated in the secondary strategies would probably never occur becauseindividuals desiring a slower transit would have already slowed prior to the locationwhere the simulation started. In any event, the satisfactory conduct of bothsecondary strategies does suggest that emergency and/or rapid slowing is possible atthe mooring master pickup point regardless of display enhancement or bridgeorganization.
Table 16 presents a brief summarization of the analysis of performance for themooring master pickup approach scenario. An additional discussion of strategies andscenarios is presented in Section 5. Of the three strategies experienced in theexperiment, only the dominant strategy is expected to normally occur at theapproach to a deepwater port complex. Further, conclusions suggest that theapproaches, as they were simulated, were conducted with comparable safety. Theseconclusions which were derived fromn the chain of evidence could be generalized tonear inshore ports or offshore ports in areas other than the Gulf of Mexico.
4.4.4 Delay Consequences at the Mooring Master Pickup Point
A descriptive analysis is provided which compares the effects of displayenhancements and bridge organizations for subject actions after they were told thatthe mooring master's arrival would be delayed. Two delays were analyzedseparately. In the first, subjects were informed the master would be delayed about30 minutes. In the second, they were informed he would be delayed several hours.Following the first delay notice, subjects were permitted to achieve their decisiongoal. After their second delay notice, subjects were evaluated on how well theybegan to achieve their decision goal.
All results were analyzed by (1) categorizing each decision such as stopping,circling, returning to sea; (2) identifying the maneuver which was required such asreducing rpm, ni~der cycling, hard turning; and (3) actual achievement of the goal.
76

TABLE 16. SUMMARY OF MOORING MASTERPICKUP APPROACH PERFORMANCE
* Of the three strategies experienced in the mooring master pickup approach, onlythe normal straight ahead while slowing technique would be expected to occurfor the majority of ships entering a deepwater port.
e The extreme measures for slowing such as rudder cycling and hard turns whichoccurred during the secondary strategies of the approach, are expected to occurinfrequently in the real world.
e Strategies for the approach to a deepwater port mooring master pickup will varyin rate of slowing and/or position within the fairway when approaching the pickuppoint. All will be conducted characteristic of normal pilotage, regardless ofdisplay enhancement or bridge organization.
o Approach tracks were the main differences in performance shown for thedominant strategy to pick up the mooring master. Shiphandling, rate of slowing,and navigation workload were for the most part unaffected.
* The existence of the two alternatives to slowing straight ahead suggests thatmasters would not hesitate to leave the safety fairway in order to adjust theirspeed.
* Performance differences which did occur as a function of display enhancement orbridge organization occurred close to the mooring master pickup area whereactual maneuvering to receive the mooring master was necessary. Initialcoursekeeping and slowing tactics were not affected.
* There was no significant difference in overall performance indicated solely as afunction of whether radar based or ARPA based displays were used during theapproach.
* There was a highly significant reduction in trackkeeping variability and astraighter, more direct meanf track to the pi( kup point as a result of introducingracons to the scenario. This is believed to have occurred as a result of radarparallel indexing on the racows.
e Runs with ARPA and ARPA/NAV showed a significant increase in individualoptio s for the mooring master dpproach and pickup. Individual preferences wereexercised for positioning ownship in the center of the fairway with ARPA and tothe right, left, and center with ARPA/NAV. The delineated fairway boundariesand buoys evidently provided an additional dimension of navigation confidence inthe overall pilotage.
* Major differences were shown in subject responses to delays in the arrival of themooring master. While these responses were diverse, results of the analysissuggest (I) that all were characteristic of normal shiphandling procedures in acomparable situation, (2) that they were accomplished safely and could have beenfulfilled given adequate time, and (3) that they occurred as a function ofindividual preference and not display enhancement or bridge personnel organiza-tion.
o The highly diverse maneuvers which were exhibited at the mooring master pickuppoint when the mooring master was delayed suggests a major uncertainty amongmasters as to the best course of action in such instances.
o The diverse and consequently unpredictable responses of masters to the mooringmaster delay were the result of difficulties in handling a loaded VLCC at low
77

TABLE 16. SUMMARY OF MOORING MASTERPICKUP APPROACH PERFORMANCE (CONTINUED)
speeds with the given environmental conditions while at the same timemaneuvering through the safety fairway dogleg.
Masters are characteristically suspicious that once the mooring master is delayedit is likely the delay will be extended. As a result, they plan their contingencymaneuver to accommodate an extended delay.
The ability to satisfactorily convert all initial contingency maneuvers toextended delay maneuvers was achieved prior to terminating each simulation.
78

It is obvious from the following description of subject responses that no differencesin this performance were revealed which could be attributed solely to displayenhancement or to bridge organization. The results of the analysis suggest that anyof the described tactics could be employed at a deepwater port in the event themooring master is delayed. Further the tactics could be accomplished with ardnimum of risk as tested in the simulation and might be experienced in real worldsettings with the frequency of occurrence revealed by the simulation. Variations insubject's actions appear to be a function of individual preference and/or experienceand are not attributed to display enhancement or bridge organization.
Radar Display. When the radar alone was being used during the first delay
notification, subjects either circled in the fairway, turned the ship 180 degrees anddrifted, stopped the ship by various engine orders and let it sit, found a shallow spotto anchor the ship, returned to sea, or maneuvered east out of the fairway slowlyturning the ship around to meet tli mooring master at the new time. There was no
identifiable difference in these responses as a function of bridge organization.
When the second delay was issued, subjects maintained their original decision andcontinued to carry out their plan.
Radar/Racon Display. When racons were added to the scenario, responses varied butwith no established pattern to suggest that they were caused by bridge organization.Subjects either swung to the right and sat, anchored, steered well out of the fairwayin consideration of traffic, circled to the left, turned 180 degrees and steamed downthe channel at slow speed, left the deepwater port area until visibility cleared,turned to the starboard with very little way on, or after notifying the deepwaterport facility, maneuvered a slow racetrack turn in the safety fairway.
Again, the second delay notification prompted a continuation of the plannedprocedure but with a more serious consideration toward anchoring just outside t hechannel. This is evidence that the existence of racons instilled an added degree ofconfidence contributing to the decision to anchor outside the fairway.
ARPA Display. When the subjects using ARPA were informed the mooring masterwould initially be delayed, they either stopped engines and drifted, altered course toleave the fairway and anchor, left the fairway to circle, turned the ship 180 degreesand steamed down the fairway, or drifted in the fairway where there would be notriific. There was no difference indicated as a function of bridge organization.
Responses to the second delay produced no major changes in plans. With thisdisplay, subjects appeared more content to drift in the fairway knowing they wouldhave ample detection of approaching traffic.
ARPA/NAV Display. When subjects using the ARPA/NAV were informed themooring master would be delayed, they either anchored on the spot if there was notraffic, stopped the ship southeast of th signated anchorage, left the fairway andcircled the rigs to the northeast, steameo inshore to the 16 to 19 fathoms area andanchored, let the ship circle 360 degrees, or turned the ship to the right then slowedthe engines to kill the way. One subject said in the event of a long delay, he wouldenter the anchorage whether allowed to or not. Another subject said if there weremore traffic, he would leave the fairway and drop anchor until the visibility cleared.Although there were no differences noted as a function of bridge organization, thenumerous and potentially complex opti,)s proposed suggests that with ARPA/NAVsubjects may have been more confident both of their actual position and of theirability to maneuver within the area.
79

Notification of the second delay did not appreciably change original plans ormaneuvers already underway.
All Enhancements, All Organizations. An additional finding relevant to any portoperation is that once masters were notified of a mooring master delay, regardlessof the estimated time of the delay, they tended to choose a "holding maneuver"which could easily and safely be extended in time or which could be converted for anindefinite delay. In the simulation, when the delay was extended, it provided themasters an excellent opportunity to test the appropriateness of their initial decision.In general, all were pleased.
4.5 DERIVATION OF DEGRADED DEAD RECKONING APPROACH
Unlike the other scenarios in which strategies were revealed just prior to thesimuilation and as a function of how well the strategy goal was achieved, thestrategies of the degraded DR approach were categorized by the initial response ofthe subject as soon as he was sure of his actual position. These results are shown inFigure 24.
Of the three strategies identified, the dominant strategy consisted of all runswhich, once the subject was sure of his position, turned toward the LOOP complex toenter the north/south fairway well north of the intersection. A different strategyturned approximately 135 degrees back to the intersection. This was considered anunlikely but possible maneuver and was labeled secondary strategy "A" (see Figure25). In the third strategy (secondary startegy "B"), as soon as the subject doubted hisposition he turned southwest to travel down the east/west fairway. When he wassure that the DR was in error, he continued on a reciprocal RDF bearing while usinga "line of szuldings" to determine his position. Upon determining his position heturned around and headed toward the north/south fairway entrance by then well tohis northeast.
4.5.1 Analysis of Dominant Strategy
Figure 26 shows all the tracks in the dominant strategy. Mean track andcrosstrack variability does not provide a good measure of what occurred except toshow that most subjects maintained their original course even while they doubtedtheir actual position. Only after they were sure of their position, did theymaneuver.
Fro n the observation data, it was possible to determine (1) when subjects firstdoubted their original DR, (2) when they confirmed their error, and (3) how long ittook them to resolve their actual position. It was also possible to determine whichsubjects maneuvered prior to position certainty and the rationale for that maneuver.Of primary concern to the research was how the crew went about handling theirdilemma, wheth, lisorientation or confusion occurred (if so, how severe and why),and the appropriateness of the crew's overall response.
4.5.1.1 Analysis of Performance
Performance measures for the degraded DR approach scenario varied somewhatfrom the previous scenarios. Mean tracks and small crosstrack variability up to thepoint of maneuver are obvious from the track plots. None were statistically
80

r~ 0m
3 102 166 69 412 3 1 M 6- " ;' 24, 13 1, 60 ';-;
41 213 243 O ~ .
'-. ,d' 254 6248625
248* 36 2 5 1 281 27
* - . 46 A. 27
35 1 54 39
... 266
4129 50 0 23 3 8 365S"392
45 20, 131 74 291 286. 360 4
7 19 221 -29i 4
.7 At473 7 ." 15 8 295 365 452
47-3
6 158 226 384' 52
59 483 - .
'] 191 244 ,, , .
8 3 3 8 5 ;o
473
2b 19234 :37
8b 156 Al *
2fl 5 206 +. 286 380 478 , .
11380:' 424bl 337 363
78 , i 27 ' 2 .. * 67 -71 ,.u.J,
176 259 132 387 340 ' 4
__________ -385
FIGURE 24. INDIVIDUAL SHIP TRACKS DURING THE
DEGRADED DEAD RECKONING APPROACH
81

'69'23 ' 02 66 S AO 4
'3 241.4 31 6062 '
48 2-
3 d , 6 52 26 16
236 F: 287 2 248
__-" 2. 30----6- .,__ 2__
____5 / I -_ __________ _26639'
4' a 2 9 "'"3 836
26 39
2 29 286 360
35 4 9
4i6
.44 -/R4/ (F 295 365 452
-, A38
t 1
STARTING
2 POINT 286 38,. 478
38-0j424
- , - 337 363- 3253
A S8(1" AMI P(iP;L~l A TIO)N. LA,
32 I 3 8 7 - ' 3 40
30 3854
\ FIGURE 25. THREE STRATEGIES OF THE DEGRADED DEAD RECKONING APPROACH
82

'A , 69
1 2 3 10 2 1 6 6 A O 7-41 1 244 13, 50-"-.213
Af "'-4 I N - 62" " ,A5 6
3 4 1- 622 5- - 251 *--v 2
. '91 166 16
36 ,23 281 7 . 24 846 --------- 4w.... . . 27
541 - 5 231 ,143s~ 54 ,bik . ol/ . e" 97! ; _'. ",266 '3
4 5 0? 2 9 ' 2 0' 3 8 3 6 5
-E 236 39259 201 131 74 291 6 360 - 44 ,5 /4 .
38 1 6
55 '416
45 9 221 .94
67 07 58 295 365 452647 3
6 158 226 384" 4' 2
59,, .SA13 191, Af 244 4-63
93 ' 385
4736 19 234 :31786 15 5
- I ,
129 61 211 I6 206 286 380 478
11380, 424178 161 337 363' 2! 7 --' 366 25I ,* 32 '-- - ' "
'176 259 32 387 30 4 4
FIGURE 26. DOMINANT STRATEGY OF THE DEGRADED DEAD RECKONING APPROACH
83

different. The time element (i.e., time to doubt position, time to determineposition, time to maneuver, etc.) is employed as an additional measure of pilotageproficiency. Causes for each decision are also included. Performance measures forthe dominant strategy of the degraded DR approach scenario are as follows:
1. Mean elapsed time- to first doubt original position- to confirm erroneous position- to determine with confidence actual position
2. Factors contributing to the resolution of position
3. Mean speed and rpm
4. Mean frequency of engine, rudder, and course orders
5. Mean frequency of radar, RDF and Fathometer fixes, and DRs
Note: The single traffic ship within the area was maintained at a distance in excessof 3.5 nautical miles for all subjects and its CPA is not considered relevant toperformance.
4.5.1.2 Effect of Display Enhancement on Performance
The analysis of subject performance comparing between radar based and ARPAbased displays showed no significant difference in the amount of time required to (1)doubt original position, (2) confirm the erroneous position, or (3) determine actualposition (Table 17, lines I and 2). Further, the review of track plots, Figures 27 and28, show no trackkeeping performance or maneuvering technique which can beattributed solely to the use of a radar based or ARPA based display. No significantdifferences occurred in ship control or navigation workload, Tables 18 and 19 (lines Iand 2).
In the performance comparison between when individual enhancements were usedby all subjects, some differences were indicated. With ARPA and radar/racon, forexample, there were significantly fewer rudder orders but more course orders (Table18, lines 3, 4, and 5) than with radar alone, while overall speed was unaffected. Thisbehavior tends to indicate a higher frequency of steering maneuvering when radarwas used; perhaps partial instead of full course changes, and certainly maneuverswith less confidence in a final DR. This rationale is also illustrated in Figure 29 bythe more gradual course chang, exhibited when radar was used than whenradar/racon or ARPA was used.
The previously revealed benefit of racons to augment position fixing cannot bestatistically supported in Table 17; neverthelsiz, trends are indicated (lines 3, 4, and5) that when racons were used, detection time of the original erroneous DR wasreduced by an average of 27 percent (3 minutes), confirmation of the position errorby 15 percent (2 minutes), and a determination of actual position by 8 percent (3minutes). While this is hardly enough improvement to warrant the installation ofracons solely for this purpose, it does imply that the racons will be helpful in suchsituations. Obviously, if ownship had been closer to the racon on the onset of thesimulation or if ample time and manetiveri'n% room had not been available to obtainsufficient soundings, value of the racon would have been even more obvious.
In summary, there was no statistical evidence revealed in this experiment tofavor one display enhancement over the other in preventing disorientation or in
84

c
0Z F
c
uj
z -
~ 400000 on. 00 .004
04 "- 04 4 0 - 40 4
LI- Li<U w
<~~ Z Y
w0
.2.2
LUL
08

69
LL 3 1
. f ,-, 6C
- '66 6
-* -'9---" - ------- 3 ~ A3 3
'454
3639
3 8
473
13. 3 67
ST AR T ING
'l IPOINT 21 0 2e6 38'9 478
2046
_ 380 424.- 6 3632" - , 325 - 337
/ ' 259 I ,i387 340 44L r /3 385
FI(LRE 27. DOMINANT STRATEGY TRACKS WITH RADAR/RACON ENHANCEMENT
46
'A, 2.. . . -- - 33 363-"

6923 102 '66 s v 4
" 81 2 ?"/
"" - , 27
I- -5 . ... 231 -3,% 34,5
! -- " " , ./39! 966 41A, 298 2* ?'.8- 222
'54
26 3832
473
-9 9 22 7 5
POIN 47
4' -'- . 58 295 365 452
338A
2! - 23 333 7
*",. " / --€ #" 9:"-J "-- STARTING 3, " j4 "17 3 3 '"" "",5
POINT
206 286 38 4,78
380 1424
F 1 RE 28 . 1N 25" --" 337 363I-
•6 259 u 32 387 .'3
385
J-1G]I} F 28. 'XOM1\ANT STRA TEGY TRAK(KS' .ITtI -\} ' . p , .'* ""
• ; iI -

ADAO0 656 ECLECTECH ASSOCIATES INC NORTH STONINSTON CT /0 17/7SIMULATOR STUDY OF DEEPWATER PORT SHIPHANDLING AND NAVIGATION--ETC(U)
JAN 81 R C COOK. K 6 MARINO. R B COOPER DOT-CG-944467-AUNCLASSIFIED EA-BO'U-099 USCG-D-66-80 NL
I EEEE ahE-EE
mIIIIIEEEEIIIEIEIIEEEEEEIIEEIEIIIEEEEEEEEIII

TABLE 18. SHIP CONTROL AND COURSE KEEPING -DEGRADED DEAD RECKONING APPROACH, DOMINANT STRATEGY
Strategy Mean
Speed Engine Rudder CourseVariable (knots) RPM Orders Orders Orders
Enhancement Effect
1. Radar based displays 14.5 75 0.1 1.4 1.32. ARPA based displays 14.3 71 0.5 0.7 1.8
3. Radar 14.2 75 0.0 2.0 0.7*4. Radar/racon 14.9 76 0.3 0.7* 2.05. ARPA 14.3 71 0.5 0.7* 1.8
Organization Effect
6 Traditional organization 14.6 74 0.4 0.9* 1.27. Team organization 13.9 73 0.0 2.0 2.0
8. Radar based displays - traditionalorganization 15.0 78 0.2 0.7 1.2
9. Radar based displays - team organiza-tion 11.7 60 0.0 6.0 2.0
10. ARPA based displays - traditionalorganization 13.7 61 1.0 1.5 1.5
11. ARPA based displays - team organiza-tion 15.0 80 0.0 0.0 2.0
12. Radar - traditional organization 15.1 80 0.0 0.7 0.313. Radar - team organization 11.7 60 0.0 6.0 2.0
14. Radar/racon - traditional organization 14.9 76 0.3 0.7 2.015. Radar/racon - team organization .. .. .. .. ..
16. ARPA - traditional organization 13.7 61 1.0 1.5 1.517. ARPA - team organization 15.0 80 0.0 0.0 2.0
* = statistically different at p!0.10 level of significance
88

TABLE 19. NAVIGATION WORKLOAD -
DEGRADED DEAD RECKONING APPROACH, DOMINANT STRATEGY
Mean Frequency ofRadar Loran RDF Fathometer
Variable Fixes Fixes Fixes Fixes DRs
Enhancement Effect
1. Radar based displays 5.9 -- 3.0 4.7 1.42. ARPA based displays 5.8 -- 4.5 4.5 0.7
3. Radar 5.8 -- 3.0 5.3 1.54. Radar/racon 6.0 -- 3.0 4.0 1.35. ARPA 5.8 -- 4.5 4.5 0.7
Organization Effect
6. Traditional organization 5.4 -- 3.5 5.0 1.27. Team organization 7.0 -- 3.7 3.7 1.0
8. Radar based displays - traditionalorganization 5.2 -- 3.0 4.0* 1.5
9. Radar based displays - team organiza-tion 10.0 -- 3.0 9.0 1.0
10. ARPA based displays - traditionalorganization 6.0 -- 5.0 8.0 0.5
11. ARPA based displays - team organiza-tion 5.5 -- 4.0 1.0* 1.0
12. Radar - traditional organization 4.3 -- 3.0 4.0* 1.713. Radar - team organization 10.0 -- 3.0 9.0 1.0
14. Radar/racon - traditional organization 6.0 -- 3.0 4.0 1.315. Radar/racon - team organization .. .. ......
16. ARPA - traditional organization 6.0 -- 5.0 8.0 0.517. ARPA - team organization 5.5 -- 4.0 1.0* 1.0
* = statistically different at p- 0.10 level of significance
89
_ ' m m " l a
J.

69'20 10"2 166 /4 ,2: i6 S o4I . ' , 23 244 131 f 0
"" - 6248 2
36 406925' 51 166
36 r8 . 24822'-1 / 28 27* 2
46 27
4~ 1 . 31 3 0--- -
35 /154 ,-A 266 /
45 2 ? 29 3 8 365
I 392
592 74'' 29' 2 F,6 360 - 4
36. 6 4/6
'5545 7 e '9 221 29' 4
47 3 '07A07 58 295 365 452 "
///' 11M 4" 5
6 .' 58 226 364" 452
59 9 483
4732 99 234 l317
86 56Ad) . STARTING 38.7
~;)I 9 + b 2,11 POINT 2863847
380 424
17 6 2!325 ..--
7 1 / OS LL
, , : IL..-
176 259 32 387 340 4
/ ,, O 385
FIGURE 29. DOMINANT STRATEGY TRACKS WITH RADAR ENHANCEMENT
90
i . : i l i -: 'li

augmenting a determination of erroneous position information. The benefits derivedfrom racons are obvious, since they provided absolute identification and may havecontributed to an early detection of the erroneous DR. The benefits derived fromARPA are more difficult to intepret although it is suspected that the ARPAprovided an advance clue that the target ahead was a slow moving ship and not astationary rig as originally interpreted. These conclusions were derived from ananalysis of how the navigation problem was resolved. See Table 20. For measures ofshiphandling, specifically course changing, significant and comparable benefits ofboth radar/racon and ARPA were demonstrated.
4.5.1.3 Effect of Bridge Organization on Performance
Table 17 (lines 7 and 8) shows the team organization doubting its original positiononly 7 minutes into the run compared to 11 mintues for the traditional group. Thesedifferences are not statistically supportable; however, a review of the run profilesheets reveals that the team organizations generally did discover the positiondiscrepancy earlier because of their methodical procedures and double checkingtechniques. Table 18, however, shows the team organization making significantlymore rudder orders than the traditional group. These results prompted a closerscrutiny of enhancement/organization interaction effects.
4.5.1.4 Effect of Enhancement/Organization Interaction on Performance
Performance differences are apparent for the degraded dead reckoning scenariowhen comparing bridge organization of subjects using the radar based enhancements.Table 17 (lines S and 9) shows the team organization suspecting an erroneous DRover 50 percent (6 minutes) soon:r than the traditional group; and while theyconfirmed this error in comparable time, they were then able to determine theiractual position 25 percent (10 minutes) earlier. It must be acknowledged that thesample size is not adequately large to support statistical conclusions; nevertheless,the difference is noteworthy in light of the anticipated manning and equipping ofships for the deepwater port operation. A review of Table 19 shows that when theyused the radar based displays (including racon), the team organization tooksjgmficantly more Fathometer fixes and considerably (though not statisticallysignificant) more radar fixes. RDF fixes in this scenario which was conductedwithout loran were consistently frequent for all organizations and all enhancements.
With ARPA thie team organization took significantly fewer Fathometer fixes(Table 19, lines 16 and 17). Resultant tracks show one unique difference betweenorganizations with ARPA although it is thought to be the result more of individualpreference than attributed to the enhancement/organization interaction. Figure 23shows boti organizations all arriving in about the same new course. Note that withthe traditional organizati,:m , w, soon as actual position is confirmed one singleman-uver is executed. With the team organization, several course changes areexectited sometimes before ownship's position is confirmed. This interim leg wassteered primarily by the team organization using rudder commands, with the resultthat the team organization had significantly more rudder commands for the overallscenario than the traditional organization. The measure, ther-foro, serves only toindi,,ate what occurred and not how appropriately it occurred.
rF) ad,.,iately sumnari,!e the performance achieved in the dominant strategy andt (ninpare display enhancements and bridge org]ui .',,tion, the measures just
91

in 4.4) toto
LI to to
-a) E 4
0 X 0. X~0 .
0< 0 c0 L
00uJ -
Lnn
0-1Z 0 0 o 0o W n*0i
o c C:
Eg cd o co0. LIn 4) ) LM 4CL 0 L; W C
-j MC ! Z
I-- oc~0t
xL x x
Z LL 0 . LL.
o . 0 0 C4.0 00 0
inC C 4-..i*
4-'. 4- +- .% >0 0. to- t > O 0a
I 0 L. 4n n Q 0Cl _ 0 -i0i
I--
00
LL t
bo t
00 Co
I-. 0
CL V4) ... 0 V
92

discussed must be put into proper context. Since the primary purpose of thisscenario was to determine what ef fect the variables would have on reorientation andposition fixing, that single measure alone,, should provide a majority of rationale forthe conclusion of performance. Briefly, it was shown (Table 17) that in all runsregardless of enhancement or bridge organization:
1. Original position was first doubted at between 5 and 25 minutes into thesimulation;
2. Erroneous position was confirmed at between 20 and 30 minutes into thesimulation (an average of I I minutes later); and
3. Actual position was determined at between 30 and 55 minutes into thesimulation (an average of 20 minutes after the error confirmation.
In light of the speed with which ownship was traveling, the lack of immediatedanger from hazards or shallow water, and the navigation requirements imposedupon the subjects, this particular resolve of the disorientation problem signifiesacceptable performance. Other criteria such as ship control and course keeping,navigation workload, and the means by which the problem was resolved areimportant but tend only to reinforce the conclusion that such a situation could becomparably handled regardless of display enhancement or bridge organization.Maneuvers for the recovery of an otherwise potentially dangerous situation wereunique as a function of individual preference, but all would result in a safe andexpedient course to the deepwate- port complex.
4.5.2 Analysis of Secondary Strategies
Two secondary strategies are addressed in the degraded dead reckoning approachscenario. They wre shown in Figure 25. Both secondary strategies representimpractical and possibly artifical responses to a situation which does not requiresuch an extreme solution. Both are reported, however, since they do representpotential behaviors in an approach to a deepwatcr port. Neither, it is emphasized,jeopardized the vessel's safety and, in fact, were probably the result of over-cautiousness. A brief description of both secondary strategies was presented inSection 4.5.
4.5.2.1 Analysis of Performance
To compare performance exhibited in the dominant strategy with that of thesecondary strategies of the degraded dead reckoning approach, performancemeasures and analysis identical to the dominant strategy were employed. Smallsample size of the secondary strategies prevented a statistic3l comparison of manymeasures; nevertheless, available data are presented in Section 5 (Table 25).
4.5.2.2 Effect of Display Enhancement and Bridge Organization on Performance
Secondary strategy "A" is shown in Figure 25. It was considered J.istinctive fromthe dominant strategy because of the master's decis'on to return to the north/southfairway entrance instead of proceeding north to the complex as 84 percent of allother masters had done. No significant difference in trackkeeping was indicated
93

between secondary strategy "A" and the dominant strategy up to the point ofmaneuver. While this could be attributed to the small sample size, a review ofFigure 24 suggests that the secondary strategy was, in fact, very similar up to thepoint of maneuver. Secondary strategy "A" occurred with a team organization usingthe radar/racon enhancement. While it is acknowledged that the racon aided thesubject in initially determining his positioo, the racon was not the cause of hisaction. Instead, observations show that the subject misinterpreted the course of the"slow traffic" ship ahead and turning to pass astern, found himself in a long sternchase. It is concluded that use of the racon was helpful in the reorientation phase ofthe scenario, but that due to a deficiency of the subject's radar plot, the resultantresponse should not be considered characteristic.
Secondary strategy "B" is shown in Figure 25 but not statistically described inSection 5 (Table 25) due to its extreme departure from the anticipated normal track.This strategy, however, must be acknowledged as a potential alternative tocontinuing on course while attempting to determine position. A review ofobservations shows that the secondary strategy "B" subject considered several othermaneuver alternatives before turning southwest. One difference between secondarystrategy "B" and the other strategies was in the mean lapsed time to determineactual position. As opposed to the other strategies which averaged 38 minutes(range 25 to 55 minutes) to determine actual position, secondary strategy "B" took90 minutes. This delay was caused by the subject's direction away from the rigs,thus reducing his probability of pattern recognition and, in effect, decreasing hisavailability of navigation information. This particular strategy would be expected tooccur infrequently in an approach, although it is acknowledged that not only was itconducted safely, but it resulted in the subjects finding his position with completecertainty.
4.5.3 Overview
Table 21 represents a brief summarization of the analysis of performance for thedegraded dead reckoning approach scenario. Ao additional discussion comparingstrategies and scenarios is presented in Section 5. It concludes that all strategieswere conducted safely and that disorientation or major navigation errors were notexperienced in the approach to a deepwater port. All conclusions which werederived from the chain of evidence could be generalized to near inshore ports oroffshore ports in areas other than the Gulf of Mexico.
4.6 ANALYSIS OF QUESTIONNAIRES AND SUBJECTS' RECOMMENDATIONS
Questionnaires were administered to the subjects before and after eachsimulation to supplement the qua-ititative analysis. A prerun questionnaireidentified the master's planned strategy before the ship was actually underway andwas used for determining and categorizing strategies. The postrun questionnaire wasadministered as a so1f-avaluation of performance. Both questionnaires are presentedin Appendix C. The information from them was used for developing the run profilesheets from which descriptive data could be extracted.
4.6.1 Summary of Responses to the Postsimulation Questionnaire
The following conclusions were derived from the analysis of questionnaireresponses. They are discussed in conjunction with Table 22, the actuil questlonnaireresults.
94

TABLE 21. SUMMARY OF DEGRADED DEADRECKONING APPROACH PERFORMANCE
* Of the potential techniques for recovering from degraded navigational informa-tion on an approach to a deepwater port, the most likely to occur is described bythe dominant strategy of the experiment.
" The alternative strategies and, in fact, even the existence of alternativestrategies for recovering from the degraded dead reckoning approach are notshown to be a function of type of display used or bridge personnel organization.Further, they would be expected to occur with low frequency in a deepwater portoperation.
" All runs were conducted using accepted shiphandling procedures and navigationtechniques for a subsequent determination of actual position and the safeestablishment of a course toward the deepwater port complex.
* In general, subjects did not deviate from their original erroneous DR until thetime they had confirmed their actual position.
* All subjects altered course immediately upon determining actual position.
* Course alterations to the deepwater port complex were executed so as tominimize the maneuver and yet enter the north/south fairway prior to arriving atthe deepwater port.
* There is no indication, statistical or otherwise, to suggest that the type ofrecovery maneuver or new course selected to the complex occurred as a functionof display enhancement or bridge organization. Personal preference seemed todominate this decision.
" Racons were shown to aid both in confirming an erroneous position and indetermining actual position once they were within radar range.
" There is evidence that time to confirm the erroneous DR was reduced withARPA by the display of motion on the "bogus rig" ahead and with racons by theirabsolute identification.
" It is concluded that ARPA/NAV would provide additional navigational confidenceproviding it correlated with peripheral information such as rig positions aids tonavigation.
" Population sample size was inadequate to statistically test display enhance-ment/bridge effects; however, there are trends in performance to suggest whenonly radar was used, team organizations may have (1) suspected the erroneousDR earlier and (2) determined their actual position earlier than the traditionalbridge organization.
" At no time, with no display enhancement or bridge organization, did functionaldisorientation (loss of reasoning and logical process) or extreme anxiety occur forany subject. Further, although many subjects acknowledged that they weretemporarily "lost" (sic), none considered their situation dangerous or irreconcil-able.
95

TABLE 22. SUMMARY OF QUESTIONNAIRE RESULTS
ToicQuestion Response
Enhancements Subjects were asked to rank enhancement * 41% chose ARPA/NAVby most effective navigational tool * 28% chose radar with
racons* 21% chose ARPA* 10% chose radar only
Would subjects use ARPA in an actual * 92% said definitelysituation *.8% said may or may not
When asked to compare radar alone to * 77% said it added muchradar with additional racons significant information
* 23% said it added signi-ficant information
When asked if the scope representations * 92% stated yeswere significantly realistic * 8% stated no
Scenarios When asked which scenario was easiest * 53% chose the landfall ap-proach
* 25% chose the pilot areaapproach
* 22% chose the coastwiseapproach
When asked which scenario was most * 49% chose the pilot areadifficult approach
* 31% chose the coastwiseapproach
* 10% chose the landfall ap-proach
Would subjects have conducted all transits * 85% said yesunder similar conditions on an actual * 15% said noship
Did the lack of visibility affect the sub- * 69% stated yesjects' transits * 31% stated no
Ownship Have the subjects previously handled a * 100% answered yessimilar ship at sea
Did the subjects feel the ship's maneuver- * 100% answered yesing response was realistic for its size,type,and loading condition
Navigation Were the charts provided adequate * 85% responded yesConditions * 15% responded no
Was the navigation information provided * 100% responded yesduring the scenario adequate
96

TABLE 22. SUMMARY OF QUESTIONNAIRE RESULTS (CONTINUED)
Topic Question Response
General Was the bridge equipment adequate * 100% said yesSimulation When asked if the bridge equipment func- e 69% responded yes
tioned properly and if its arrangement * 31% responded nowas characteristic of a "typical" mer-chant ship bridge
Subjects' simulation experience * 62% had previous experi-ence
* 38% had no previous ex-perience
Subjects were asked if the simulation e 81% responded yesfelt natural on the first transit * 19% responded no
Subjects were asked if after 2 or 3 runs * 100% answered yesthey recognized elements of thesituation
Subjects were asked if they were able to * 100% answered yesadapt to the simulator so responseswere the same as they could be at sea
97

4.6.1.1 Display Enhancement
The majority of the masters preferred ARPA with the navigation option(ARPA/NAV), followed by ARPA, then radar with racons. Radar without racons wasrated as the least effective navigation tool. This was determined by weighting eachsubjects ranking of the displays. Those subjects who chose ARPA with thenavigation option did so because they could easily distinguish between fixed andmoving contacts in relation to the fairway boundaries. The subjects liked thetracking capability and the presentation of information which could easily betransferred between the display and the chart. The subject who chose ARPApreferred this enhancement because moving targets could be sorted out on thescreen. He did not believe the fairway boundaries added any significant information.Those subjects who preferred radar with racons felt this was the best method ofestablishing ownship's position under adverse conditions pirticularly since the radardisplay was most familiar and because few operating adjustments would be required.
Over 90 percent of the subjects stated they would use an ARPA display in thereal world; however, only 38 percent of the subjects stated that the fairwayboundaries added necessary information. When comparing radar alone to radar withracons, 77 ,orcent of the masters stated that the racons added significantinformation to the radar display.
Over 90 percent of the subjects stated the display representations weresufficiently realistic; however, one subject stated that a bearing line should havebeen provided on the radar since it is helpful during navigation.
4.6.1.2 Scenario Design
Fifty-three percent of the subjects stated that the landfall approach scenariowas the easiest because of ownship's position at the beginning of the scenario. Oncethe traffic had passed ownship, the approach was straight forward because therewere few rigs of concern and ownship could easily enter the fairway.
Fifty percent of all subjects stated that the approach and drift scenario was themost difficult because of the lack of offshore navigation aids and the timeconstraint to meet the mooring master. Subjects found it difficult to make a largeturn at a very low speed and to be stopped at the pickup point without entering theprecautionary area. Forty percent of the subjects stated that the coastwiseapproach scenario was the most difficult because of traffic in the fairway.
Eighty-five percent of the subjects would have condurted the transits similarlyon an actual ship, however, some subjects would have travelled at a slower speedunder similar visibility condition,.- Ov2 subject would have originally taken a moresoutherly route from Mobile, Alabama to avoid the entrance to the Mississippi River.Another stated that he came too close to the rigs for foggy conditions and shouldnot have done so.
Approximately 70 percent of the subjects said the lack of visibility affected theirtransits becauise a more cautious approach was reqii:d. Two subjects indicatedthey shoild have reduced speed even further.
98

4.6.1.3 Ship Type
All subjects had handled a similar ship at sea, and all stated that the shipmaneuvering response was realistic for its size, type, and load condition.
4.6.1.4 Navigation Conditions
All subjects stated that the navigation information proided during the scenarioswas adequate; however, 15 percent thought the charts could be improved by a largerscale of the deepwater port area and by extending the chart further south.
The most frequent recommendation for improving the navigational aids was toadd racons or radar reflectors at various locations. These are listed in the order inwhich they were deemed important: (1) at junction of N/S fairway (2) marking theE/W fairway either at S/W pass or rig southwest of S/W pass, (3) on one of the buoysmarking the precautionary area, and (4) on outer northeasterly corner of the N/Ssafety fairway. Other recommendations included placing a lower powered RDFstation on the LOOP platform or a buoy to mark the jog in the fairway.
The most frequent recommendation for improvements of the channel configura-tion was to provide a safe anchorage area close to the precautionary area that couldbe used without the mooring master onboard. Subjects also recommended theanchorage area be enlarged and repositioned to eliminate the dog leg turn. Severalsubjects recommended the jog in the fairway be eliminated. An alternative to thesechanges would be to rmove the mooring master pickup point further south so the turncould be made with the mooring master onboard the ship. Two subjectsrecommended the fairway be videned and a traffic scheme be developed andindicated on the chart.
4.6.1.5 General Simulation
All but one subject stated the bridge equipment was adequate. Seventy percentof the subjects stated the simulator functioned properly and its arrangement wascharacteristic of a "typical" merchant ship. Those who did not said the steeringwheel should have been in the center with the radars on the side and the turn rateindicator sh, 'l I have been in minutes rather than seconds. All agreed t'iat thesefactors did not affect the validity of the experiment.
Over 0 percent of the subjects had previousl' used a ship simulator, and all buttwo subjects said that the simlation felt natural on the first transit. The twosubjects who felt uncomfortable needed only one run to become comfortable withtile ship.
An additional recommendation made by on'. ihj ct was that the U.S. CoastGuard shoulJ strongly recommend simulator training for deepwater port approaches.Another stated that the repeated runs were not challenrging, and more trafimc shouldhave been included. A third subject stated that "hore set and drift should have beenapplied bocause of its effect on piloting a fjl!y loadd VLCC. A validated set anddrift was present in all simulatiors, b_t ,*cionall) wais not recognized by thesubjec t

4.6.2 Overview
Table 23 presents a summary of masters' recommendations. In general, whiletheir opinions were subjective, it must be remembered that all were qualified VLCCmasters, some with extensive experience in transiting the LOOP area. As a result,it is suggested that individual recommendations be carefully considered and, in lightof the performance revealed by the experiment, these recommendations be proposedas alternative solutions to the identified problems.
100
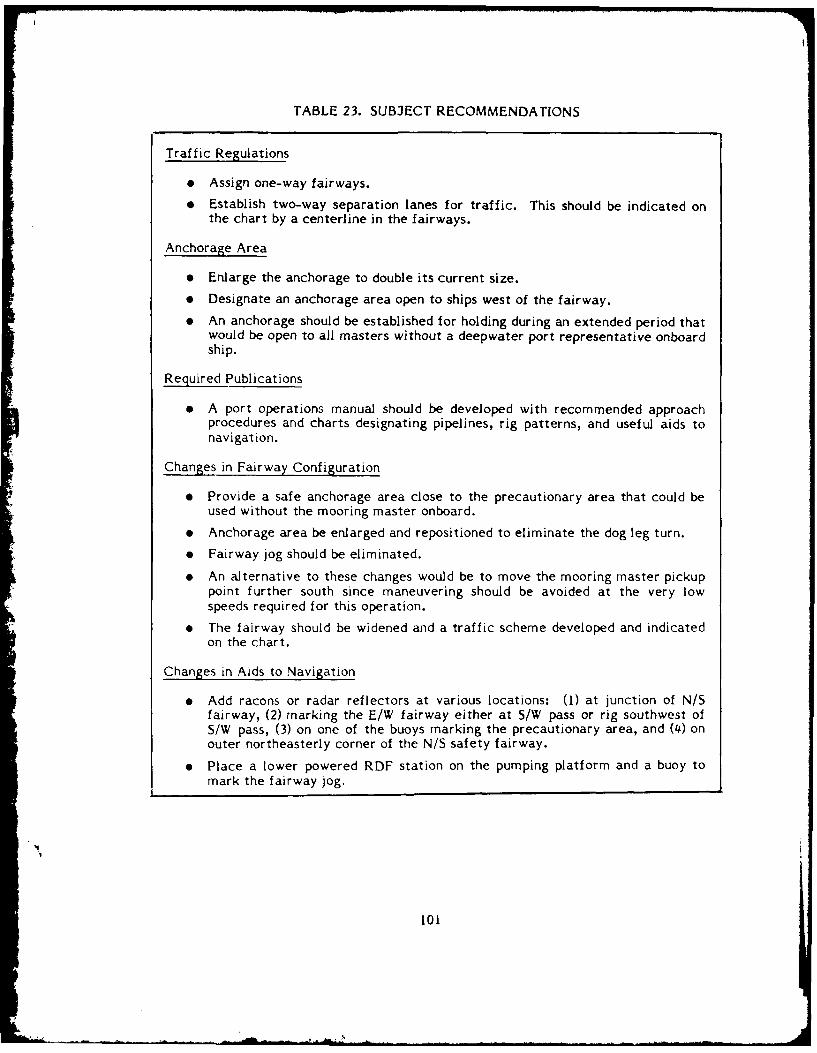
TABLE 23. SUBJECT RECOMMENDATIONS
Traffic Regulations
" Assign one-way fairways.
" Establish two-way separation lanes for traffic. This should be indicated onthe chart by a centerline in the fairways.
Anchorage Area
o Enlarge the anchorage to double its current size.
o Designate an anchorage area open to ships west of the fairway.
o An anchorage should be established for holding during an extended period thatwould be open to all masters without a deepwater port representative onboardship.
Required Publications
o A port operations manual should be developed with recommended approachprocedures and charts designating pipelines, rig patterns, and useful aids tonavigation.
Changes in Fairway Configuration
" Provide a safe anchorage area close to the precautionary area that could beused without the mooring master onboard.
" Anchorage area be enlarged and repositioned to eliminate the dog leg turn.
" Fairway jog should be eliminated.
" An alternative to these changes would be to move the mooring master pickuppoint further south since maneuvering should be avoided at the very lowspeeds required for this operation.
" The fairway should be widened and a traffic scheme developed and indicatedon the chart.
Changes in Aids to Navigation
" Add racons or radar reflectors at various locations: (I) at junction of N/Sfairway, (2) marking the E/W fairway either at S/W pass or rig southwest ofSIW pass, (3) on one of the buoys marking the precautionary area, and (4) onouter northeasterly corner of the N/S safety fairway.
" Place a lower powered RDF station on the pumping platform and a buoy tomark the fairway jog.
101

Section 5
CONCLUSIONS AND RECOMMENDATIONS
5.1 RESEARCH QUESTIONS
This section draws together the categories of evidence from the researchprogram into a summary of significant findings and conclusions. It is meant to focusthe specific findings of Section 4 to the general issue of VLCCs approaching anoffshore deepwater port during periods of low visibility.
The original basic research questions were:
1. What combination of hazards, if any, present serious precision navigationproblems to VLCC masters in the vicinity of a deepwater port?
2. What mitigating measures appear most practical in terms of effectiveness,timing and ease of implementation?
3. What is the value of potential electronic aid enhancements for generalapplication to offshore and shoreside ports?
5.2 CATEGORIES OF EVIDENCE
To answer these questions, a broad based research program was developed whichwould provide a variety of data to characterize and evaluate VLCC operationsduring poor visibility approaches to an offshore deepwater port. The categories ofdata included:
" Review of the hazard and risk assessment analysis performed for the CoastGuard.
" Presimulation interviews with VLCC masters and mates to characterize thenavigation process, obtain subjective assessment of hazards and risks, anddevelop believable and productive simulation scenarios.
" Quantitative, automatically and manually recorded data collected during thereal tine simulation experiments using practicing VLCC operators as testsubjects.
" Statistical analysis comparing subjects' ship control and trackkeeping perfor-mance, navigation workload, and hazard avoidance.
e Descriptive run profiles derived from observers' research notes and subjectquestionnaire responses.
Generally, the data can be considered to either be descriptive or inferential. Thedescriptive data included all data from the questionnaires, research notes, and
N simulation observations and the individual ship tracks. Descriptive data told thestory of the research. They documented observations, indicated trends, andhighlighted areas for analysis. In addition, they provided the logical supportstructure for the inferential evidence.
102

Inferential evidence was developed by the measurement of performance andapplication of standard statistical te-ts, specifically an analysis of variance and F-statistics. This inferential evidence led to statistically supportable conclusions.While the research attempted to derive support for conclusions from both types ofdata, certain behaviors were not revealed in the statistics. In these instances, thedescriptive data were reported, and whatever inferential data were availablecontributed to the logical chain of evidence.
5.3 CONCLUSIONS ON THE SAFETY OF NAVIGATION IN DEEPWATER PORTAPPROACHES
There is no evidence on the basis of this research which suggests that approachesof VLCCs to an offshore deepwater port are deceptively difficult. Even though thesimulation experiment presented some navigational and traffic situations whichcould have resulted in difficulties for the VLCC masters, no difficulties wereenr, intered which are attributed to the design or operation of the deepwater port asit was simulated.
Maximum freedom of choice was given to the VLCC operators to select theirapproach strategy from the starting point. This feature of the research designresulted in a number of opportunities to discuss safety related issues also applicableto near inshore ports or offshore ports in areas other than the Gulf of Mexico.
5.3.1 Landfall and Coastwise Approaches
Development of the simulation research plan began with a review of the hazardand risk assessment study and an at-sea navigation task analysis. Concurrently,interviews were conducted with VLCC masters to obtain a prior assessment of vesseltransit patterns associated with a Gulf of Mexico deepwater port. The findings onissues relating to safoty of the transit conclude:
" Safety fairways would be used routinely if they offered a reasonable trackfrom the ship's point of departure.
" Considerable coastwise navigation would be conducted outside of the fairwaysto make a more direct transit of the Gulf of Mexico.
" Long-range navigation techniques such as loran, satellite and celestialnavigatio would be used until an identifiable landfall was made. The radarpatterns and individual fixed structure locations would be used as primaryaids during the final phases of the approach.
" A minimum dearance of 0.5 to 2.0 nautical miles would be maintained tocharted offshore structures. The lack of visibility does not appear to be amajor concern.
* High traffic levels were universally assessed as the most significant hazardassociated with a port approach.
" The approach to a Gulf of Mexico deepwater port would not be difficult, andlocal aids to navigation would be adequate for routine transits.
103

The hazard and risk assessment study identified personnel fault and heavyweather as the principal hazards to navigation. Offshore rigs, vessel traffic, and lowvisibility were identified as additional hazards but were judged to be lesser risks.
The navigation function analysis indicated exclusive reliance on long-rangenavigation aids and techniques during open-sea operations. Radar, however,appeared to be the primary navigation tool used in U.S. coastwise operations.
Two .--mulation scenarios were developed as a result of the preplanning processto examine the transition from open sea and coastwise approaches to a deepwaterport safety fairway. Twenty-four simulation transits were conducted through eachscenario to develop information on likely approach strategies and safety of thetransits. Each scenario was constructed in such a way as to offer approach strategyoptions to the experimental subjects.
Analysis of the simulation runs revealed that:
* During the landfall scenario when an approach into the safety fairway wasgenerally adjacent to the vessel's track, 76 percent of the masters adjustedcourse and entered at the intersection of the safety fairways.
* In the landfall scenario, 24 percent of the masters were not concerned withentering the safety fairway. They set their objective in terms of expediencyand "convenience"' (sic) rather than fairway compliance. It should be notedthat there were no rigs, traffic, or shoal areas immediately outside thefairway that would have made the outside transit unsafe.
* During the coastwise approach, three different strategies were observed.Sixty-eight percent of the subjects crossed the Gulf east/west safety fairway,passing south of rigs and obstructions and entered the north/south safetyfairway near the 100 fathom curve.
* Six tecn ,)ercent entered and rcmained in the east/west safety fairway eventhough the transit was lengthened by about an hour.
@ Sixteen percent maneuvered through a gap in the rigs, and found a clear pathalong the most direct course to the port through the lease blocks.
Table 24 summarizes the recorded hazard avoidance measures for the simulationtransits.
" CPAs to fixed rigs exceeded 0.95 nautical mile under all conditions withmeans on the order of 2.0 to 2.5 nautical tniles.
" CPAs to traffic were lowest when ships passed on parallel headings in thesafety fairway. This would be expected in light of the predictability ofmastr'rs' intentions when passing close aboard in meeting or overtakingsitua~tions.
* The debriefing interviews support the observed data. Eighty-five percent ofthe subjects it-ttod that they would have conducted the transits similarlyaboard ship under these conditions. Only the one subject who passed a ship at1.7 natiticdl miles stated that he had passed too close to traffic.
104

(N 0I (N
0 .0
< b
4) C 0 ~ 0.(
o 4 mL.
o. 0
V)-0 G 0 r
Z 0
z m~ 0)
< U,
LL t4 C4 C4
4) IV)) C
> -0 -tI-
.4) - -1 0-< <U
LL C -C
IS.
c0 <
00
NU >, . ~ . . >, fA V
< Le) W
0
LU 0
410

Table 25 contains the shiphandling arnd navigation task summary for all scenarios.The results for the landfall and coastwise approaches (lines I and 2, and 5 through10) indicate that:
* No significant differences in overall shiphandling and navigation techniquewere found between landfall and coastwise scenarios or among the individualstrategies.
9 Radar and loran were the primary means of fixing positions for the landfalland coastwise approaches.
e Although the average use of radar for navigation was identical betweenscenarios, 50 percent more loran fixes were observed during the landfallapproach. This is supportive of previously obtained at-sea data which suggestthat operators will use radar as a primary means of navigation whenidentifiable rig patterns or aids to navigation are continuously available.
5.3.2 Mooring Master Pickup Approach
VLCCs maintain considerable inertia and become more sluggish in response tohelm and engine orders at slow speeds. Concern was expressed that the phase of theapproach involving slowing and maneuvering a VLCC in the vicinity of the mooringmaster pickup area might lead to disorientation affecting safety of the transit.Consequently, a scenario was developed to examine this phase of the deepwater portapproach. Ownship was located in the safety fairway approximately 7 miles fromthe mooring master pickup point, on a course to the north and at speed of 10 knots.Twenty-four simulation transits were conducted through that scenario to developdata on likely approach strategies and the safety of the transits. The objectives ofthe scenario were to:
* 1. Examine user strategies during the approach to a mooring master pickuppoint.
2. Observe operators' strategies, position keeping techniques and shiphandlingperformance in the event of brief delays by the mooring master's launch.
3. Determine the contingencies that would be expected in the event of extendeddelays of mooring masters.
e The dominant strategy which was demonstrated in 92 percent of the transitswas to slow the ship by reducing rpm soon into the run and maintain a directcourse to the pickup point. At the end of the approach, a maneuver was madeto position the ship to receive the mooring master.
e Additional strategies which were observed involved the use of rudder cyclingand hard rudder maneuvers to slow the ship. These more aggressiveshiphandling maneuvers were caused by a perception that the initial speed ofthe ship was excessive for this phase of the approach transit.
e No difficulties were observed in fixing position during this phase of thetransit. A variety of rig patterns were visible on the radar, and the portcomplex and precautionary area buoys were distinctive on the display.
106

C ooo 000 000 0005 00
CD 00Q- -~O 00 0o C, E
c -0.-'D - 00 00 -00 C-~
a' . 0000 000 000 00 01 C C
<- -
cCCD C
z 00LL 0 0 0 0 0 0 00CDL,0 4-
LL <>
000 000 000 0-0o 00 Z-
OCOO 000 000 'C. C 0
z S1 UJ CC C:
~~~~C tC O C' r ;.
('Z - 2'- '-c OC
UJ C
7 00
CL J CO4L
-- ILIa.-. c~ . > .1rI -
ca Z aab -7 C.~ 7 ~
1~L.2
~ 'UK~ ~<uj z a-..C

* Position fixing frequency increased during the approach transit, and loranpositioning frequency remained equal to the coastwise transits.
e In response to notification that the mooring master would be delayed, theindividual masters chose to drift, circle slowly, maneuver in a slow race trackwithin the safety fairway, or direct the ship back down the fairway until adefinite pickup could be arranged.
* When the delay was extended, the responses were continued drifting, slowsteaming in the fairways, leaving until the port was available, and anchoringinshore or south of the port complex. All represented a continuation of theresponse selected at the initial notification of the mooring master delay.
* While there were differences in individual subject responses to the mooringmaster delays, the analysis shows that all responses were consistent withfindings of the presimulation interviews, and occurred as a function ofindividual preference. There was no correlation of any of these responseswith a specific bridge organization or display enhancement.
Of major interest in this scenario was the range of masters' and mates'suggestions regarding potential port improvements. A variety of specific recom-mendations is presented in Section 4.6, and it is suggested that particularconsideration be given to:
* Boarding vessels in a straight fairway segment rather than asking the masterto slow and position his ship immediately after a turn. This would eliminatethe need for a major maneuver at slow speed in the dogleg.
" Designating a holding anchorage in the vicinity of the port which vessels canenter without a mooring master aboard. Delays as a result of weather, vesselarrivals, and port operations would be expected to occur even with the best ofpreplanning intentions.
" Providing a 1:80,000 scale chart for vessel operations in the immediatevicinity of the port. This chart should be sufficiently inclusive of patterns ofrigs and structures which would be expected to be used by VLCC operatcorspiloting in the vicinity of the port.
5.3.3 Degraded Navigation Equipment
fhe use of precision long-range navigation equipment provides sufficientlyaccurate positioning information to make the transition from open ocean tocoastxvise steamning routine and safe. When these systems are not available, as aresult of equipment malfunctions, the operator of a vessel transiting toward a portmust rely on the short range aids to establish his landfall. Under extreme conditionsof currents and poor weather, the possibility exists that discrepancies can occurbetween a ship's dead reckoning position and its actual location. The potentialconsen-uence of this is that the vessel would make a landfall where ambiguousinfo tation would lead to unsafe operation of the vessel. The final scenario whichwas examined involved such a situation. Celestial and long-range navigation hadbeen precluded for over 24 hours. The dead reckoning position indicated that thevessel would arrive in the vicinity of the deepwater port while the actual location ofthe vessel was several miles to the southwest along a similar RDF bearing. A slow
108

moving ship within radar range was located approximately where two rigs wouldhave been if the ship were at the DR location.
Several clues to the inconsistency of the information were available. Waterdepth was less than the DR would suggest, and of course the object on the radardisplay was moving very slowly. A close scrutiny of the Fathometer indication andthe radar presentation was required to detect the error in position. Such a scrutiny,it was believed, might only occur if the master was doubtful of his DR.
Each subject was exposed to this scenario only once and only after completing allof the other scenarios. There were 12 transits of this scenario. The analysis of datashows that:
" Ship masters rely on their best previous information when new information isunavailable. They do not maneuver immediately upon discovering that theirposition may be in error. Rather they attempt to accumulate additional,more reliable information before changing course. The exception to thisfinding would be in approaching shoal water or specifically identifiablehazards.
" Once masters had determined their actual location, they proceeded on acourse toward the safety fairway which would minimize maneuvering at thefairway.
" At no time did any apparent loss of reasoning or logical process, or extremeanxiety occur for any subject. Further, although some subjects acknowledgedthat they were temporarily "lost" (sic), none considered his situationdangerous or irreconcilable with the information available to him.
" DR position was doubted after one or two attempts to confirm it based on theavailable information. The time required to question ownship position variedfrom 5 to 25 minutes.
* Actual position was confirmed with available information at between 30 to 55minutes into the simulation (an average of 20 minutes after error confirma-tion).
" Table 25 (lines 4, 14, and 15) indicates significantly greater use of RDF,radar, and Fathometer than the coastwise or landfall approach scenarios.This suggests that during landfall ship operators will rely on the use of long-range aids when they are available but will readily increase their use of short-range aids when long-range information is unavailable.
" Typically, running RDF fixes, line of soundings, and radar pattern interpreta-tion were used to resolve the ambiguity of position and set a course for thedeepwater port fairway.
5.3.4 Summary of Navigational Safety Findings
No evidence was revealed which indicates that the transits to a Gulf of Mexicodeepwater port contain subtle hazards not previously identified. That is not to saythat the scenarios were error free. A number of procedural and shiphandling errorswere observed including:
109

1. A 10-degree error in a course order was given and not detected for nearlyhalf an hour.
2. The motion of a traffic ship was misjudged on one occasion, developing into along stern chase on a parallel heading.
3. During a presimulation exercise, a slow moving traffic ship was temporarilymistaken for a buoy marking the entrance to the precautionary area.
4. A lower than intended CPA to a passing traffic ship occurred in a safetyfairway, due in part to inattentiveness and unfamiliarity with the radar equipment.
After analyzing the causes and severity of these errors, it was concluded that thedesign of the deepwater port was not a factor in their occurrence.
5.4 CONCLUSIONS ON THE EFFECT OF NAVIGATION DISPLAYS AND BRIDGEPERSONNEL ORGANIZATION IN DEEPWATER PORT APPROACHES
Notwithstanding the results of the safety assessment analysis, there isconsiderable evidence to indicate that lridge procedures and display enhancementsdid affect ship transits in the vicinity of the simulated Gulf of Mexico deepwaterport. Behavior of ship operators was affected by the form and content of thenavigation displays, and there appears to be evidence that the application oforganized bridge team procedures resulted in observable performance differences.
5.4.1 The Effect of Display Enhancements
As a subset of the overall safety of navigation questions addressed by thisresearch, the impact of the availability of racons, ARPA, and chart datasuperimposed on ARPA, on approaches to the deepwater port was observed andevaluated.
Across all scenarios, there was a tendency to direct the vessel's track on acommon course when racons were provided.
" During the landfall approach, the tracks when the racons were availableshowed significantly smaller crosstrack variability when approaching thefairway entrance.
" During the coastwise approach, the addition of racons significantly reducedalmost all crosstrack variability.
" When the racons were provided, the operators tended to range or focus on theracon ahead. This display enhancement resulted in consistent and straighttracks to the safety fairway as well as reduced variability.
" Virtually ,, track variability was observed when the racons were provided inthe mooring master approach scenario. Overall, a more common approachwas demonstrated with comparable safety and shiphandling performance.
* Racons aided in recognition of position error and in determining actualposition during the degraded DR scenario.
110
Ir-i'
l,. . i I i m • I I1, P. - I - - l il . .-

The conclusion to be drawn from this evidence is that the racons did modifytrackkeeping behavior associated with approaches to an offshore deepwater port.The exact nature of the racon effect and the effect of racon placement was notaddressed in the research. In general, however, it appears that racons placed near adestination will tend to focus the tracks of vessels approaching the racon, whileracons placed adjacent to the port will direct ships on a course perpendicular to theracon. This pilotage technique, possibly a form of radar parallel indexing, appears tobe used even when the formal technique is not familiar to the operator.
There was little evidence that the ARPA display resulted in differences in track,although the masters appreciated the display's ability to differentiate fixed andmoving objects.
With the addition of the fairway boundaries superimposed on the ARPA display(ARPA/NAV), the evidence points to a conclusion that the display provided greaterfreedom of individual preference in the approach.
" With the addition of the navigation option during the landfall scenario,subjects exercised more maneuvering options by selecting a preferred trackas the result of increased confidence in their position in the fairway. Somesubjects transited down the center of the fairway while others chose totransit to the right of the center.
* In spite of the increased maneuvering which was observed, the subjects withthe ARPA/NAV option performed fewer navigation fixes.
" The mooring master area approach scenario provided evidence that mastersexercised more individual preference in selecting their tracks using theARPA/NAV display. The largest crosstrack variability in tracks was observedwhen the ARPA/NAV display was used. Overall, more individual pilotagepreference was demonstrated with comparable safety and shiphandlingperformance.
5.4.2 Effect of Bridge Personnel Organization
Four of the twelve experimental subjects employed a formal bridge teamorganization. While the quantitative evidence is not compelling, there is asubstantial descriptive evidence that those individuals who used the collaborativetechniques performed more consistently and were better able to attain the goalswhich they had set for themselves.
* In the landfall scenario, while both organizations attempted to enter thenorth/south safety fairway near th center of the intersection, the teamorganized crew achieved this goal while the traditionally organized crewstended either to overshoot or cut the corner.
" There is some indication that the traditionally organized crews benefitedmost frem the addition of the racons. The team organized crews were awareof the parallel indexing technique and practiced it regardless of theavailability of racons. The traditional crews tended to be more affected bythe presence of the racon. They may have relied upon it unintentionally.
Ill

*There did appear to be differences in performance as a result of organiza-tional procedures during the coastwise, degraded DR and mooring masterapproach scenarios. There is evidence that the team organized crews appliedcertain procedures which enabled them to more effectively conduct eachapproach.
The overall impression of the researchers was that the team organized crewsworked in a collaborative environment, checking information and confirming data.Their plans were at times extremely detailed, particularly during the mooringmaster approach scenario, yet they maintained the greatest flexibility in response todeveloping situations. This differed from the traditionally organized crews which attheir extreme were one man operations. In at least two instances, the traditionallyorganized masters dominated the scenarios and made little use of the'- mates.
5.5 SPECIFIC RECOMMENDATIONS
The research approach employed concentrated attention on issues of practicalinterest to the U. S. Coast Guard, deepwater port operators, and shipping companies.Conclusions and recommendations related to vessel operations in the vicinity of adeepwater port in the Gulf of Mexico follow directly from the research process.These conclusions and recommendations are presented in the following categories:
1. Offshore deepwater port operational guidelines.
2. Short-range aids to navigation.
3. Long-range aids to navigation and traffic management.
4. Training and procedures.
5. Bridge equipment/displays.
In addition to conclusions and recommendations which apply directly to Gulf ofMexico deepwater ports, some findings can be generalized to near inshore ports oroffshore ports in other areas. In instances where this supplemental application isappropriate, the findings are stated and qualified to reflect a judicious balancebetween maximum use of the findings and prudent caution to avoid overgeneraliza-t ion.
5.5.1 Offshore Deepwater Port Operational Guidelines
Recoinmendation
On the basis of descriptive experimental evidence which showed variedperformance among masters as they maneuvered a loaded VLCC at low speedthrough the dogleg in the LOOP safety fairway, we recommend that LOOP considerone or both of the following:
1. Removal or reduction of the dogleg to produce a straight-in approach to theprecautionary area.
2. Relocation of the mooring master pickup point further south in the safetyfairway such that the turn maneuver can be made at maneuvering speed rather thanat speed where control is marginal.
We believe that the following issues need to be addressed in consideration of thisrecoinmendat ion:
112

1. Lease block considerations may affect recommendation 1.
2. Other traffic within the vicinity may encumber the maneuver.
3. Mooring master delays may require additional maneuvering at low speed in anarea where the master's options are restricted.
In considering such action with respect to ports other than the Gulf of Mexico'sdeepwater ports, we believe that whenever possible, approaches should be designedto minimize requirements for turn maneuvering at areas in which low speed, traffic.environment or operational uncertainties are present. In effect, when nearing thepick-up point, the master should have a minimum of maneuvering requirements otherthan those which ensure the safe and expedient reception of the mooring master.
Recommendation
On the basis of conclusions that (1) mooring master delays will occur, (2) vesselscould encounter circumstances which would make circling or drifting impracticaland (3) some masters may feel the need to anchor either in the safety fairway orelsewhere rather than return to sea; we recommend that LOOP provide a holdinganchorage for use by ships' masters.
We believe that the following issues need to be addressed in consideration of thisrecommendation:
I. That the anchorage be sufficiently near the mooring master pickup point sothat (a) it may be used conveniently in the event the mooring master is delayed and(b) the mooring master need not travel far to board a ship in the anchorage.
2. That the anchorage be of sufficient d-pth for the vessels' drafts yet adequateto accommodate the scope of anchor cha'- available aboard a VLCC.
3. That the anchorage be adequately marked and identified for all weatheroperations.
In considering such action with respect to ports other than the Gulf of Mexico'sdeepwater ports, we believe that whenever possible an anchorage, which does notinterfere with port operations, should be provided for use by ship masters.
Recom mendat ion
On the basis of obse.rvation that the existing chart of the LOOP area, i.e..Barataria Bay and Approaches (NOAA 11358) are of insufficient scale and/orimproper coordinates for use in LOOP approach pilotage, we recommend that NOAAconsider the pub! ication of a 1:80,000 scale chart centered on 28 degrees 45 minutesnorth latitude and 90 degrees west longitude. The chart should include, but not belimited to, delineations of the safety fairway, anchorage, and precautionary area.Each special area should be clearly labeled to convey its use and lim tations. Thechart should show all offshore structures at least within 12 miles of the safetyfairway as well as pipelines, obstructions and other possible hazards to navigationwhich are outside the safety fairways.
We believe that the following issue needs to be addressed in consideration of therecommendation:
113

1. A chart has been designed and is planned for implementation in LOOP. Itdoes not, however, meet the above recommendations. Revision to the design shouldbe considered to make the chart reflect the location of all area boundaries and allowsufficient detail for piloting in the vicinity of LOOP.
In considering such action with respect to ports other than the Gulf of Mexico'sdeepwater ports, we recommend that safety fairway dimensions, density ofsurrounding structures and availability of aids to navigation all be considered in theselection of scale and geographic coordinates for port specific charts.
5.5.2 Short-Range Aids to Navigation
Recommendation
On the basis of inferential and descriptive experimental evidence which showedunique approach behavior to the deepwater port when racons were used, werecommend that the U. S. Coast Guard consider any or all of the following:
1. Controlled investigation of why racons tended to align all masters' tracks andeither focus them toward the racon or parallel them adjacent to the racon.
2. Investigation of racons as a mechanism for aiding the transition from open-sea navigation to the approach phase.
3. Investigation of other racon placements and racon navigating techniques toproduce desirable piloting characteristics in approach to a deepwater port.
We further recommend that LOOP and the Coast Guard consider any or all of thefollowing:
1. Lccation of an additional racon or racons south of the pumping complex forthe purpose of (a) providing a leading mark for vessels transiting outside the safetyfairway from Southwest Pass, (b) provide a leading mark for vessels entering thenorth/south safety fairway at its entrance and (c) provide positive identification ofthe LOOP area in the event of failure of long-range aids to navigation during theapproach.
2. Placement of racons as a position reference for communications, shipmaneuvering, traffic identification and control.
3. The use of racons to make the area more recognizable to masters.
Based upon the use of racons and their subsequent effect on pilotageperformance which was demonstrated in the study, we recommend the installation ofracons at the following locations within the LOOP area:
1. The platform structure located at approximately 28 degrees 32.8 minutesnorth latitude and 90 degrees 4.1 minutes west longitude.
2. The platform structure located at approximately 28 degrees 35.3 minutesnorth latitude and 89 degrees 42.0 minutes west longitude.
According to the study findings, racons located at these positions (I) willfacilitate the transition from open-sea navigation to the landfall phase of the
114

approach, (2) will enable masters to parallel or range on the racons using standardpiloting techniques, and (3) will provide a demarcation for identifying thesouthernmost part of the existing rig field.
We believe that the following issues need to be addressed in consideration of thisrecommendation:
1. Uncertainty of the causes for trackkeeping behavior which resulted from the
placement of a single racon or group of racons.
2. The effects of using racons in conjunction with other aids to navigation.
3. The use of racons with specific piloting techniques such as bow and beammethod, danger bearing method, and parallel index plotting.
4. The use of racon applications and techniques not addressed in this study, butwhich could be of more benefit in port specific approaches.
In considering such action with respect to ports other than the Gulf of Mexico'sdeepwater ports, we believe this study has shown that wider use of racons wouldserve a significant benefit to the safety and efficiency of the overall port operation.The extent and nature of the racon application, however, will be dependent uponresolution of the effectiveness of racon systems, and the specific design require-ments of the particular port.
5.5.3 Long-Range Aids to Navigation and Traffic Management
Recommendation
On the basis of the chain of experimental evidence which showed no detriment tosafety or prudent navigating practice as a result of removing the primary long-rangeaid to navigation (in this case loran-C), we recommend that alternative radio aids tonavigation systems be maintained at all times even in areas in which rig patterns arevisible on the radar. Further, it is recommended that while RDF is adequate as abackup long-range aid to navigation system, a hyperbolic line or satellite system isessential to ensure optimum transition from open sea to the approach phase of adeepwater port operation.
We believe that the following issues need to be addressed in consideration of thisrecommendation:
I. The actual accuracy and operational effectiveness of long-range aids tonavigation systems in the LOOP area.
2. Minimum equipment requirements of vessels employed in the LOOP operationand the ability of LOOP or regulatory organizations to impact this requirement.
3. The need for additional controlled experimentation on the effect of orabsence of various long-range aids to navigation systems during specific contingen-cies within the LOOP operating area.
In considering such action with respect to ports other than the Gulf of Mexico'sdeepwater ports, we conclude the effects will be similar to those demonstrated in
115

the LOOP simulation. That is, while the use of radar piloting and RDF alone cansupport a safe approach to the safety fairway, multiple long-range aids willsignificantly expedite the transit and offer an additional margin of safety.
Recommendation
On the basis of the chain of experimental evidence which showed mastersentering and transiting the safety fairways either on the right side or in the centeras they individually intended, it is concluded that the LOOP safety fairway is ofadequate width and its navigation aids are of adequate quality to promote safetraffic separation. Further, simulated encounters with traffic at safety fairwayjunctions and within safety fairways distant from the LOOP complex revealed safeCPAs for all passings. The absence of simulated passing encounters in thenorth/south safety fairway, however, renders this experiment insufficient for judgingthe requirements of a traffic separation scheme. We recommend that additionalexperimentation be conducted in which both traffic encounters and the LOOPproposed advisory system is simulated. Such an investigation would reveal potentialdifficulties in traffic control as well as limitations imposed by the physicalwaterway and VLCC maneuvering characteristics.
We believe that the following issues need to be addressed in consideration of thisrecommendation:
1. A definition of all operating aspects of the proposed LOOP advisory service.
2. A definition of the minimum equipment requirements for ships operatingwithin the LOOP area. The study findings showed a high degree of pilotageproficiency within the safety fairways when ARPA with a navigation option wasused. Such equipment, however, would not likely be installed aboard all VLCCsentering LOOP. The degree of sophistication of equipment which will be installedmust be identified.
3. If voluntary traffic separation for the transit of safety fairways appearsinadequate, methods other than formal traffic separation schemes could beemployed such as a LOOP directive to remain along the right side of the fairway atall times.
In considering such action with respect to ports other than the Gulf of Mexico'sdeepwater ports, we recommend each port design be addressed individually takinginto consideration the physical parameters of the waterway, type of trafficencountered, peripheral and environmental factors, and the results of the researchwhich is recommended.
Recoinmendat ion
On the basis of observed evidence and discussions with masters, the more trafficand operating information which can be provided within the vicinity of LOOP thebetter a master's opportunity for achieving prudent and safe pilotage. This isevidenced in the study findings which conclude that while a majority of masters willenter and operate within the safety fairways, some will choose to transit outside thefairways and among the rig structures. As a result, we recommend that a mandatorytraffic reporting and advisory scheme be implemented for all vessels approachingLOOP with the scope and detailed procedures to be determined.
116

We believe that the following issues need to be addressed in consideration of thisrecommendation:
1. The anticipated frequency and density of LOOP traffic.
2. The efficiency and reliability of the mooring master operation.
3. Ability of ship masters to accurately determine their position within thefairway, estimate their progress and communicate it to the LOOP facility; ability ofLOOP to monitor these.
In considering such action with respect to ports other than the Gulf of Mexico'sdeepwater ports, we believe the need for a vessel traffic advisory will be uniquelydependent upon the physical arrangement of each port, the type and amount oftraffic anticipated, and the requirements of the mooring or berthing operationinvolved.
5.5.4 Training and Procedures
Recommendation
on the basis of the chain of experimental evidence which showed only minorperformance differences between formally organized bridge teams arnd traditionalbridge crews, we conclude that LOOP approaches will be conducted with comparableeffectiveness and safety by either personnel organization. Based upon thosedifferences in performance which did occur, however, we recommend that theshipping companies operating in the LOOP area encourage the use of those methodscharacteristically employed by team trained and organized crews. These methodsare as follows-
1. Preplanning of the approach.
2. Assignment of individual duties to bridge personnel.
3. Review of contingency actions and alternatives.
4. Implementation of cross-checking procedures.
5. Maximized effectiveness of communications.
6. Encouragement of a collaborative spirit.
We believe that the following issue needs to be addressed in consideration of thisr ecommninend at ion:
1. Further investigation into the effects of bridge organization, training, portfamiliarity, and bridge equipment operating experience on deepwater portapproaches.
In considering such action with respect to ports other than the Gulf of Mexico'sdeepwater ports, we believe this study has not provided sufficient data to concludethe effects of personnel organization or procedures for generalized port approaches.
117

5.5.5 Bridge Equipment/Displays
Recoinmendat ion
On the basis of inferential and descriptive experimental evidence which showedunique approach behavior to the deepwater port when different displays were used,we recommend that shipping companies encourage the use of (1) radar for theearliest possible confirmation of position from rig patterns and aids to navigation,(2) racons for enhanced approach navigation and traffic advisory communications, (3)ARP-% for improved traffic assessment and rig pattern identification, and (4) ARPAwith the navigation optio- to augment both navigation and collision avoidance.
Further, based upon study conclusions (1) that ARPA with the navigation displayincreased maneuvering options and subsequently produced a greater diversity of shiptracks, and (2) that racons tended to homogenize all maneuvering and subsequentlyproduced a relatively common track; we believe the following issue needs to beaddressed:
1. From a safety, operational effectiveness and traffic control standpoinvt,determine the desirability of all masters achieving a common ship track versusexercising their preference for different ship tracks.
In considering such action with respect to ports other than the Gulf of Mexico'sdeepwater ports, we believe the effects on pilotage of ARPA and racons, which wercrevealed in this study will have direct and immediate impact on approachperformance to all ports. The effects, however, would be expected to vary as afunction of equipment use, personnel training, racon placement and port design; andconsequently should not be generalized without additional consideration.
1 18

Appendix A
STATISTICAL COMPARISON IN CROSSTRACK VARIABILITY
The figures presented in Appendix A were derived as a result of statisticallycomparing, using the F-statistic at the p 0.10 level of significance, one standarddeviation of crosstrack variability between conditions at preselected intervals (0.5nautical mile or 0.25 nautical mile) along the tracklines. These figures illustrate thedifference in variability which existed along the tracklines for each condition, andwhere it occurred. The data are used as statistical support for conclusions about thegroup mean track and crosstrack variability plots discussed in Section 4. Onlytracklines which revealed a statistically significant difference are presented.
A-i

LANDFALL APPROACH
RADAR BASED DISPLAYS
---RPA BASED DISPLAYS
04
(1 .5
12 0 10 11 It 13 1% 15 I 1, 17 1 2 2 9 30 M233 a1 0
DATA LINE =.5 (NM)FIGURE A- I
A- 2

LANDFALL APPROACH
-RADAR DISPLAT
2.5 --- RADAR/RACON DISPLAY
2.0
z .5
c1.0
ORT LIN . .NM
- STATISTICALLY DIFFERENT AT p mS 0.10 LEVEL OF SIGNIFICANCE
A-3

LANDFALL APPROACH
-RRPA DISPLATLS- ----RRPR/NRV DISPLAT
LO
z
1. -cc
3.0
-) 0.
I 2 3 i I I I I I I03 I2 I3 35 3I I 3 I S I I I I I
DATA LINE =.5 (NM)
t= STATISTICALLY DIFFERENT AT p 5 -010 LEVEL OF SIGNIFICANCE
FIGURE A-3
A-4

LANDFALL APPROACH
- TRADITIONAL ORGANIZATION
----TERM ORGANIZATION
Lo2.
z
31.
ad
1 2 2 11 a 6 1 a a 10 11 iti 1ii o1 oto3
DATA LINE =.5 (NM)STATISTICALLY DIFFERENT AT p -- 0.10 LEVEL OF SIGNIFICANCE
FIGURE A-4
A- 5

LANDFALL APPROACH, RADAR BASED DISPLAT
-TRADITIONAL ORGANIZATION
a--- TEAM ORGANIZATION
.0
Cie
U LO I T I 1 1 S 30 3132 31U 13 I 3 U u a u w
DATA LINE =.5 (NM)
FIGURE A-5
A-6

LANDFALL APPROACH, ARPA BASED DISPLAY
-TRADITIONAL ORGANIZATION
Ls - ----TEAM ORGANIZATION
Lo
z1.5
oz
Ole -----4h-------------
12 3 S I ? 0 1 10 11 12 13 114 13 If 17 13 IS820 X1 21 U 38 3 S 1)
DATA LINE =.5 (NM)FIGURE A-6
A-7

COASTWUI SE APPROACH
- RDRR DISPLAT
Ls ---- RRACON DISPLAT
,-n Ls
ID-
DATA LINE =.S (NM)
FIGURE A-7
A-8

COASTW ISE APPROACH
-ARPA DISPLAT
AL RPA/NAV DISPLAT -.
SLO
z-o
/ do
I-%
U LO
a Ita - a l l
ORTA LINE =.5 (NM)FIGURE A-8
A-9

COASTW ISE APf'RAC
TRADITIONAL ORGANIZATIONLa ----TERM ORGANIZATION
_2.0
u 0*0 1 11 111 1 11 11 11 1 11 1 111 r -- r11 2 1 6 7 3 1 10 11 013 1 L 0 17 18 0 WM Al AW VU
DATA LINE =.5 (NM)+ STATISTICALLY DIFFERENT AT p 10,10 LEVEL OF SIGNIFICANCE
FIGURE A-9
A-10

MOORING MR57ER PIU~UP RPPROPCH-
-RRORR OISPLRT2.-- RRDRR/RRCON DISPLRT
z
cn 0.5
ID
3 2 3 '4 5 6 7 9 1 10 IJ 32 13 1% I 1. 17 3 1 0 2 3 22 23 4 25 a1 27 a0 2 30
DRIR LINE =.25 NM.
Sl;ATl T'A-LL\ 'I[ f t H . AT 10 UVE L L ()F SIGNItFICANCE
Fkl(,RE A-10
A-1l

MOORING MRSER PICKUP PFPRODCH
-ARPA DISPLRT. ----RRPR/NAV DISPLRT
z
fr-
u) 0.0
3 2 a ~6 I 7 3 a le i] 1213 1I LU 317 13. m 21 22n n a 23 7 a 233
DRTA LINE = .25 NM.
+ STATISTICALLY DIFFERENT AT p - 0.10 LEVEL OF SIGNIFICANZE
FIGURE A-1l
A- 12

r1CCRIN\G rR57E P1CrUP RffRORCH- RRFR & ARR/NRV
-IRAITIONRL ORGRNIZRTION
----TERM ORGRNIZRTION
2.0
z
1.6
U-,
(u. 0.0 ~ I I I I I I Ii i
2 2 S 1 7 8 9 10 11 123311113 1 17 13 1920 122 I1111= 111V U U U13
DRTR LINE =.25 NM.t STATISTICALLY DIFFERENT AT p -0.10 LEVEL OF SIGNIFICANCE
FIGURE A-12
A- 13

Appendix B
TRACK PLOTS BY CONDITION SHOWING MEAN TRACK ANDPLUS OR MINUS TWO STANDARD DEVIATION CROSSTRACK VARIABILITY
The figures presented in Appendix B show differences in group mean track andplus or minus two standard deviation crosstrack variability for each displayenhancement and bridge organization conditions analyzed in Section 4.
B-I

5 69123 102 166 5 Af 4
-41 213 244 13!' 60
33 .~ 4, -, | I ....... "Af N 62 * ~ r,,
482533 46 '1 6 24
251 .1 6,". ~~1 r. 151 166" - 51/ / ... w.. 7
.36 46 , ', "I 23( 51 2817 . 248
46 ~- - #, 2741 231 '" .1'5 345
35 15 :1. 15c/OA ." 38 365 392
36 236 392 .
~~53 31 " ',. .
38 / 131 291', 28- 360 ,-438 1 '
"55 416
45 9 221--
/ ,6 .
47 - 53 62 1 2 365 4
60 456926384"" 5 - =
59
63385191 244' " '.6 " , 83 136/ 38 "" " " "
.. 286 , 3 -478
1126
86 e 19' 234 i3 17 " 5
- 80 0 4 24129 61 211 .1(6 206 286 , 3 047 ...-
l.. 38 , 4,24178 161 21' 1 '-" " "337 363 ...
171
1j 6 259 o" 32 387 ' 340 44
385
FIGURE B-1. RADAR BASED DISPLAYS -LANDFALL APPROACH
B-2

5 '69
123 102 166 "4
4 1 .... 2 13 2 4 4 3 ! , 0O b s , ,
48 254' 62----33 * 40 - 6
K25 51 16r - 2 5 1 .1 5 1 1 6• 36 51,
23( 281 27 4 24m , 4 6 7/2-------. 27I1"' 4 1 - 15 5 3--" 2 3 1 "" 1 _ _ 3 5 3 3 4 5 . .
35 5 .C
- 26650 .21 2 ' ""' 3 8 36 5
236"392
46 59 131 74 291 J286' 360 . - 4386
/55 416 '
45 19 "221 410
AA
" 2 9 5 ' 3 6 5 4Z.-
7 47
384'
59 10 9 6 403
,30. 424A1 11 4
6 3 8 , '
1773
1 26 2 138 134 " ..
, "BL .L A' 4R O
176 259 32 " 387 3,40,
FIUR B-2 A, BAE DIPLY - ADALAPOC
B3
B-3
fo O " 1 9 I" " ' "

23102 166 s 469
r~3 4 .. - ! ..
233 244 2 - - . ... O -_
23A I0 1 1266 39 6
-*., 36} 46 23 263 07 ," 2
41 i "- 231 .- 1---.-. 36-----O, 2
30 2 2 ,8 39..
3 392359 131 74 2912 360 -----
384 i "
'5 5 41645 19 .- , N
/
4? 53 1 62 . , 158 295 365 :4'2
60 9 26 384 45 .
36 . ,8',1 o
I5 ,416 ."
5
m 3S0' 3 -83 36-1-
32586" 12 6 156 i9 23 A4 '.'0.'
too 380' 478
1511
176 "6S1
,f S
176 259 t 32 387 34"4
FIGURE B-3. RADAR - LANDFALL APPROACH
B-4

5 69123 I102 166 S At
118 244 3 so6
41 213
1 13162
48 2545 , 4 r 1 151 166 026616
-42, 3 28 27 _- -/ _" 46 7. .
51 231 345_43 1--
35 A 54
A 39.266'50 9 " 5 2938 365
,59 31294 286 360 1 --- - 4
441
3 '/55
At9 1580 X " 295 365 4D
47 536 t
4~
0 26 3 35
66
473
lo380' 47 8lk9 J 1 206286
7! 44
17 59 32 387 304a 385 3
FIGURE B-4. RADAR/RACON - LANDFALL APPROACH
B-5

5 69I ll i I q !
123 102 166 $ 4
213 244 13
48 254 62 ' 0 / "6
.. .. - ."251 "5 16q
23 281 248• .. -.o ', 231 27 ----46 " 7 / " 27
35 5 S4
, ,266 3'41 50 21 1 !29 .,.3; 8 365
236 392
5 ~ 1 13 74K~ 2 291- 3604
38 6 45 I ..5! 5 '416
455
/7/ 6 "
47 - 53 62 7' 58 " 295 365 , 4".
60 -
59 M 4 '-131 191 244". .."I
3853 1 . /6136
6 473/ I19, " 234 ;3f7 '.51
86206 286 , 8,4 .
1514
.380 424
2. 7S 33 7. ,"-
16259 32 387 340 4
FIGURE B-5. ARPA - LANDFALL APPROACH
B-6

5 I69
t23 23102 166 IV/4
41244 131 ~
N ~~ N - 62 * VM j
33 -, 40 66248.
19K 251 15 6 l21 16
5915 23 281 2 -
237
38 --360----- :?
5
47~ - 3 6
69 6W 3
1
6~8 384 "467
38 8 30 7
47S 53 32 387 79 3 4
FIUR -41AP/AV-LNFLLAPOC
B-7X

5 0. 69123 102. 166 "4
'-4 213 . 13
- 25433 4 6
251 46 252, " " 2 6.9 , 5 , 166 ".. . ...
.- 1 4 -i
.. . ,46 27' t
41 f5" 231 3 /4359 9
97 CA , 3
385 / 31 74* 29(1 ,286 360 ""- "--"" - ,
' 16
/9
47 / 53 2 ,473
59 13 74 .9 8 6
86 5
38 30 7
171384" - - -
95 5 3 0 2"A 473
6 9 2 26 1384,
O0~~~~ -V3eo ?e,.
IQR -9 T O O;RA7IL 20 I L D A C
o1.-"300
178 161 2! 7 " ' 337 363 .....
" "" 3 30 ' ".
FIGURE B-7. TRADITIONAL ORGANIZATION - LAND)FALL APPROACH
B-8
L n i l ' / I ! -- "

-123 102 166 69 /
41 6 213 244 162 :so; '
48 254 g'33 40 /7 f 6
* .* 251151 166 111
36 51281 2 - 248
* 46 27 3 30-"~2
35 3 __ 10- 345
/ 15439
'41 0 6 i ~38 j65
-236 392
38 t 4G /73 291 286 360 :--
/3
495 365- 291 ~ 2
60A
'-4
593-~
I 6- 473
AAl
380' 478
380: 424
176 32 367 340
FIGURE B-8. TEAM ORGANIZATION - LANDFALL APPROACH
B-9

S 69
5 123 102 166 "A$ 64
-41 "-3 24'.131,
4 8 6 254 62 .. "
33 ~46 - 1
5"e 25 51 166 2 16("
1- " 23( 281 -
" ""2',3'846 27
35 154,.w A ... 6' 739
/41 50 08 2 , 29 -. ""' 3 8 36.5.
236 392
5913, 74 29f*2 360 "-
3 8 4 G /' 5416 ,
45 V221'- 294
47 " 158 295 365 452 1
60 6 9 226 384" '
59 4e "3 "A, 43 ' AS
83 3 9 244
6- 3 385 '.7
473/ 26 19 234 317 5
86 16AW 47
111 1(6 206 286 30 478 -
53801 424
178 61 2 25337 363
1 71 w." M S LL ' '
259 f32 387 r 340 44
FIGURE B-9. RADAR BASED DISPLAYS, TRADITIONAL ORGANIZATION -
LANDFALL APPROACH
B-10

5123 102 166 SAP 6 4
41Ia 213 244 13f 0s
4825
251 1p 16.
.."36 23281 27 248
- 46
- 4- 231I ~ 235 :5
.7A ,' * -I I 9/4 021 229266 3
43 8 36559 .236 392
3/46 5 131/ 74 29' 28.6 360 4
/55 416
AeV7 18295 365 , 4 2,47 53 61
595
385 4-V3
6313
1b619234 3178615
bI 6 1 A 206 26 30' 478
-300. 424
1711
25 2387 . 3404
n 385FIGURE B-10. RADAR BASED DISPLAYS, TEAM ORGANIZATION -
LANDFALL APPROACH

5 69123 102 166 1 m
N -ad - ~244 62ecCs
48 254' -'
33 .- ' 40 -1 6 7 ----2-251 1
9151 166 1
'-a , 2 3 ( 2 4 6%3 46 ..... 27 F
3541 1523133534
e~9'~A266,-- 39.'/150 21 29""p2'- 3 8 3651 23 392
59 11 729' j-6 30
38 29.2; 30
/55 -416
45 2 0-4'2§
47 53 162
6045
59 -493
8313
100- 29 86 380' 478
151 424
171
17 5 32 387 / C 340 4
FIGURE B-11. ARPA BASED DISPLAYS, TRADITIONAL ORGANIZATION -
LANDFALL APPROACH
B- 12

69123 102 166 SA 4
.- lN 1d N11 2 4 62 o
"""2 13 AO 'l
"
33 - 4048' 1 3 2 54 623-
--I-. .251 15 1 16
.. .'• , , 9 SI 66 . -
23 281 27 248
!46 41.. . 27
41 , _ 2 3 1 _ _4 5_ _
35 154 C/
.. 266 383639"41 50 229 "3 8 365
- '236 392
5 9 , 3 74 2 9 ' 2 8 6 3 60 4- .4G /--,
6,,..416/55
/ 45 / 4" 19 22 -"2.
47 /53 62 6 07 158 295 365 4 2
60 " .69 22659
' "43 , "4T24
13q 191 244...,
83 ) 13666 .- " "
' 473
- 126 19 23 4 ;3 17 "186 . 156,
129 2380' 478129 I , 206 286
338378 161 2 - - 3 380342
71 " s
176 5 1 3 2 3 8 7 , 3 4 0 4 4
FIGURE B-12. ARPA BASED DISPLAYS, TEAM ORGANIZATION -
LANDFALL APPROACH
B- 13

RA 29f Chart //358 10)~1 A
37 40,q 0RA i.,3
cl 4 as3 1331 0 15 1-,rep)PA -4
/"6 , re/ 41
ms4ec re14
C' e- 40A R*# PA 4e84
29 5 4 / 550 49 * f l
P 5
11 ;044 5,%
Ae91 72 114
116 Nl169
1, 134
22278
-1t 204-54
A6 26 3996
236 3929 0 11291 .286. 360 -. 412
6 3 0
7 22129 K *
7 07 18295 365 ~'452 e 207,) 58 480*
FIGURE B-13. RADAR BASED D1SPLAYS -COASTWISE APPROACH
B- 14

33... "
RA Re Chart //358 3Qt 29 267- - , "
F l 34 41
S315 (m replPA -4
p 1 I/6 ,s rep - 41 44G I .' 40•rp)
F %M 4Q 4 S6RA Rof SA ' r3" 1
- Ad PA 45
_- - - 44 1- - 286 /.
1' t 46 , /5p/ 529 11 g'li - ' , /51 56
ost' ep n 49 51- A
,5(' - 57°N; . •" 5 / -- ,
32 50 - Ad A
9 65
51 167 9 ,w 6.58 63
559Ad 59 ,
69 ,3 72
5A 91
g91 H4
1 134
2 278d 230
C~l j -31G31t 204.154
266 399
3" 8 365 , '265
236 392
9 I 7 29, 286 360 , .." 350
,416 4
7e 19 2 291 , ,
6 42007.' 158 295 365 452 - 48O.." .
- -- I• 47I"9
!:IG;RE B-14. ARPA BASED DISPLAYS- COASTWISE APPROACH
B-15

-33
09 RA Rof Chart 11358 a ~J4R -21,~ 37
4s 't F 14 S.C. 3. -41
P 31 0 to (5 frmreplPA -44 %.3 32
w ('6 frms repj - 41 4
RA Refs PA 48 45
2641 -6 4 Sub,"Obs, fCha
/ -- - I. - -44 --P~d -HO;RNS ep29 U* AO 2
:4 Obsfr rep S~, 1tv *' 51
13? 50 51 57 5
5 Cj 52 5 596551 m 5863
599
43
o99
*~~~~~9 2011486 6 -. - 4
6~
278,
FIGUR 4 -5 RADA -OSWSEAPOC
;-A1

C RA," 2. 9 Chare 11358 PA 2
O , '!! Ge R 93 L
(5 bm reoPA -'
L ('6 -s$ repl 44 -
C, 1 U M 40FI 4 S c . I-i •
45 ,
11 1 S c ctu'l: AO PA 48 5RA Aft /u Ch 926 46 48Sub-ObS, -r
-"- - ; - 2-
29 46 pt j' g HOPN, /5 56
* a 49Wd 51•~~~ 4 ..- Ao.I 5951-- 57 A
32 50 54 5
5 58 6.
4'959,. ,, 72 "599
• "" ' • 91 " 11 "
6I I- 112169
6 34
* 23' 2303 -/ .... .v 278
54
P2 ; 3 8 365 '28
236 /9, 392 7 .. .
29 ',, 28.6 360 -- 4 ,' .... ,,,,, I,,/,
so I
251416 1
266295 365 3492 9,4.-
1 - " 479
' , FIGURE B-16. RADAR/RACON - COASTWISE APPROACH
B-13

0,9 ["ai ~ ,
0.09A Chart 11358 --Z 38y 'I
S15 f3 rep)PAu 41 W A0
(16fmsrep)A 44.1..• p,• U ('6'mis rel - 41
G ' IS, , 40
FA 4 e Uoc obsV 5 j, VPA 48 452RA R-. 46 Sen, O C
41 4844 ( fms rp)-2 P, .. 2- -
5- " 46 45" ghted) HORNS /5 56
* J32 -" "50 , / - "z 44 - -40 551
.65 4
' " ',. 9 5 '33', 72 +
p 595 1, 9(6 . p f 8
2! 169
20- 134cL52281 -
392 "7230-9..627 3-
is -'16 154
• 266/ 399 '
929 365 420"1236 392 373 "- .
77 ,, " .. 3-50 /
&S0 | * L',,,
B- \ ,I ....S.
6 3: ".
w158 295 3 65 #.- 2
I _ &479 "-
FIGURE B-t17. ARPA -COASTWISE APPROACH
6- 18

T •
14,l cm"ur~ ~"IA , llp RA Rat Chart 11358 ' :'' 38
/) Q '' 2"43
q F1 1eiP - 32, 4
t * 6 ,"s rep) - 41 g A -G" v ," so 4fl //- 'Fl1 4 Sect.U ~ -
RA He 1osb , Ad PA 48 c 4546Submn Obs t,' 7
20 Z1 46 48 1. . . . . - - -44 ., 6 s rp),
2 Ad /5 246 Piot- 11 Shied) HOPNS 5I / 56S 4l5l 49 51
•~5 5. AO, .. , /
'05 , 5 55 59 65 7167 60. / 63
.- • 595
. 69 33' 7
2-1 tz 7' 2- p * 112
1695; 1 34
23( 32780 -
5 2i 3 1~ 204
A - 6 6399
09 2 293 8 365 "365
236 392 373
2c 31 74 29( 28 360 - .....350 , '
FIGUE BIS. RPANAV- CATWS9PPOC

44, 33- -
R9 Ro Chart 11358 38 aw'w
q '' F; 1* 4 Boca 41 360 32
31 m f s5 - PAjP 48
F14 Sacs U S, 4Q426A41 46 48 S cbm (h
2 6- z - - -~1 - - - ( 6 ; -8 ' f m , 2p
29 / 45 46'51c-%l~lld 56
Obs'r rep IN Ti 49 6 O 5
3' Is 5 7 2f yA
599
5969 33 7 34
23 a 230A
91 H49 28 6 -- I1416
.9 (340 7( 56 1 29 7 3 6 5 2 3 6
5 ~~ ~ B 20lj~3 24

. .2 33 I
qAy RA Rol2 Chart //358 -- ' 38 ** W.'-'qG - 2 29 3PA 2-637 -1 2- 37RA R.-c 'S 'O 9,,F Sc 34 41
31 w 15 n repiPA - 44 i
S 06 fms repj - 41 4-G ., " sb 40 ,F? 4 Soes I Cea S 4Er!
RA Ref * Cts5r.l Ad PA 148 4526 -. 46 46S Ob G /" d2 - - - -- -44 .....- ) (6,' -5
29 Ad / 45 46 P hfd) HORNS /51-0 49 51Ad
ObS,, rep t-:4 47 6#.. AO, 59"
.5 59- SO-
* 32 - 54 4
55 / 65.5 16 9 " ow 60 O 8 ,3r5. 63... 5 9 59, ,
69 / 57 72, 93 ', 33'
9
91 14
6 112" 16919 !34
WI56
392'
48 2783/
1 5
-A 266 39
29 28 365 1 "2065236 392 373 A S,
9 2 R 31 74 291 286. 360 RG42N IZ TOI I.....RO C
S416- t. P:- .C 19 22t 9 , ','\ .. ' 1 :
,,, All" 4207 7 158 295 365 4 2 .. ''
• .'" ~ ~-."479 -.
FIGURE B5-20. TEAM ORGANIZATION-COASTWISE APPROACH
5-21

+C C +'B33 &:,""f'l , G 'L p. - 38.. -33
AYO19 A ef 29 C.barf //358 38 )r 'W"
RA 34 "41 4 3! 3
• 3 1 5 b " r e p P A - 31 3 :
P" * ('6 ems e 41 44"' ' • • % + 40 I" '
1 4 Sacs 'FIA Rot & Ad PA 48 45'
26 2 46 98 Pr (34- 48 (6; f'lo . -" -
29 51 4 4 Pisj'o- ghled! "ORN, 56
:4 ots 3C4 5147S " ' ;' 59
'32 50 - 95
5 C, 515
55 65 767 60. " 6
6933' 72
169
28 27 489
5 -31 1, 1 204-
154 4'A 266399
2293 8 365 0'4 5 6 5
236 392?7
'3, 4 291 .286 360 42.,6 35 0
416 4569
L, 7C 19 221'9
- . "-,' \ 3 420.07.>'/58 295 365 452 ~K ~ 480 *
* 1/ .27 I
/
FIGURE B-21. RADAR BASED DISPLAYS, TRADITIONAL ORGANIZATION-COASTWISE APPROACH
B-322

72%33 '
29R- Chare 11358 w ", je ,.C "A 2 6 'A2
FAA0 R 3731 5 (5,' re p PA - '3
6 ('6 frns repi - 41 -,0G 6 40n 44p 1, -'° 'F1 4 Sect 1,4 Ad -
Fl4 c 0PA 48 i4-A ef %,,m,,, C ,ha!7 6 - -8 ,46 .; s , ', /C3
29 45 46 ",ghled) HOPNS, 5629 ; "/ '5 -
rr a 49 "51 7 /O bs , ep A* A
' •47 5"9... 5 ""
* 32 50 5 550/ 52 5
j655) " 9/ 60. 58 6367 ' a -s 'i
59 9 0
60 V Sh
21 72 9 l
1 ' 6/ ':- -- .' 6112 1
169' 5 ; 34
230
3 1-L - 204-
-A 2 6 _ . 3992. ? 29 3 8 36.5 p " 6
2 392 373 -
2 31 7 4 29 1 286 360 - .350
416 454-\. ,,,, p576 19 221 291 < " " " /,.W
. 7. / 158 295 365 ,, 5 2 4_ L 80 , .. ...
FIGURE B-22. RADAR BASED DISPLAYS, TEAM ORGANIZATION-COASTWISE APPROACH
B- 23

09,; C A .1Chart //3.58 ."13
~~S, 29' 2
Cl ~RAA~ .
10,. ( '6 '-s rep) 41 4
Fl 4 Sect UlR g S vsU *A PA 48 45
44 4- 16 1 p p)1
29 4546 Plati~o,- (,.hied) "OW~N, ~ /j /5a m 49
_ 4 4 7 , k Ai5 9
5 969 ~ 32
*44
21 P477
621?
4d 230
il31 204-
266 399
-E236 392 373
92 C 131' 7 291 28& 360 - 'I,350 "
5 ~416 44
70 19 221 291 .vV
S 424
.0. 18295 365 452 4820.
FIGURE B-23. ARPA BASED DISPLAYS, TRADITIONAL ORGANIZATION -COASTWISE APPROACH
B- 24

t 29 RA Ra Chart 11358 (1 r,. , 38
'X. 37 to/ 31 4 (5m- re31PA - i4\ 32
"G P" * ('6 in s repI -A
Fl 4 Secs 8 0 ,RA Ref a3 st. Ad PA 48 45
26 2- 46 Sub, Obs,!" ~- - - -44 (6 f.S r m ',s rep) 2 -- ---" -2 , o.w
29 4,, 46 Plitp'- ("gled) HOPW /51 56•~~~ * 49 i5 'Obs'1 rep m * ,,.5
6 47, *.... A, 593;]2 'N 50 f/ ly A0,,3? .SO ,/51 - - 5 / 57A
0 52 59.// 55 65 7
51 60 Ae 58 61759 60 ,
596
69 33' 72
9'9
so0. 4of S^21 72 °-
11 1 -11
• 112169
r) 9 134
23 230. . ,wV 278-
15 .. .. ST 310 - --_=__ 204 _
~154/
266 ,39969 24.2 365 "6
392 373
9 C 3 4 291 286 360 - ~ \ ~ '''.,
6 . 350
5/6 454.. f"' P5I ~9 2'21 &9-
,42007 .07 158 295 365 402 -- " 480
_ _l /l" m -- 479
FIGURE : -24. ARPA BASED DISPLAYS, TEAM ORGANIZATION-COASTWISE APPROACH
B-25

RA Ref /
G4ec "T' FI14 Secs /34
06 (tmG "1 PICKUP POINT * u~
246
4 ~Obs tr rep su47(/5 f~i
32 .50
5a 52
167 5911 f - --- -- Piatorms (,c
FIGU RE B-25. RADAR BASED DISPLAYS -
MOORING MASTER PICKUP APPROACH
B- 26

RA Ref yA *P. V F1 Ses 00 28
R A Ref31U L
/ * (/6 rn
26 46
29 475 4[6
32 .50
5a- 52
-- 167 /\V- 59110 AV 1IF7 --------- ms (
FIA;URE B-26. ARPA BASED DISPLAYS -
MOORING MASTER PICKUP APPROACH
B- 27

FIGURE B-27. RADAR - PILOT AREA APPROACH
C ARA Ref
011Y RA Ref0 R -2-29 C
Fl4 Secs Fl14Sc 34
a 0i6tm
26'
41b
44.4 ~ Obs tr rep7Sub-
25 a 52
51 9' sl167 -4-. 59
11 ----- P PIator-s (
FIGURE B-27. RADAR - MOORING MASTER PICKUP APPROACH
B- 28

VV~ ~ 2 F / es9a 2G '3" RA Ref3
R -
29 46e
G. l PICKUP repN Sub
45'4
29 2

k cc RA Ref
'ool G6 A Ref /
G "2"
26(1 fm
sf46
4~ 29 Ir rep Sub-
-647,cf
3? 52~
51 167 \. 59- Platiorms
110 Ai17
FIGURE B-29. ARPA - MOORING MASTER PICKUP APPROACH
B- 30

I4S Sec
'146
0 290
G I .'9/ 4 S sF1 S cs3
167(1 , 5
FIGURE ~ B-0 RA/A ORIMSE PICKUP APPROAC
B-3im

-\ ~ ~ ~ R Ref R efg
I4VVc F1 1 2ISecs 3 2
G "1 P CKU POIN 25u~
"Y o 1 q R A R e f
/6fm.
264, ~f4
32B-50
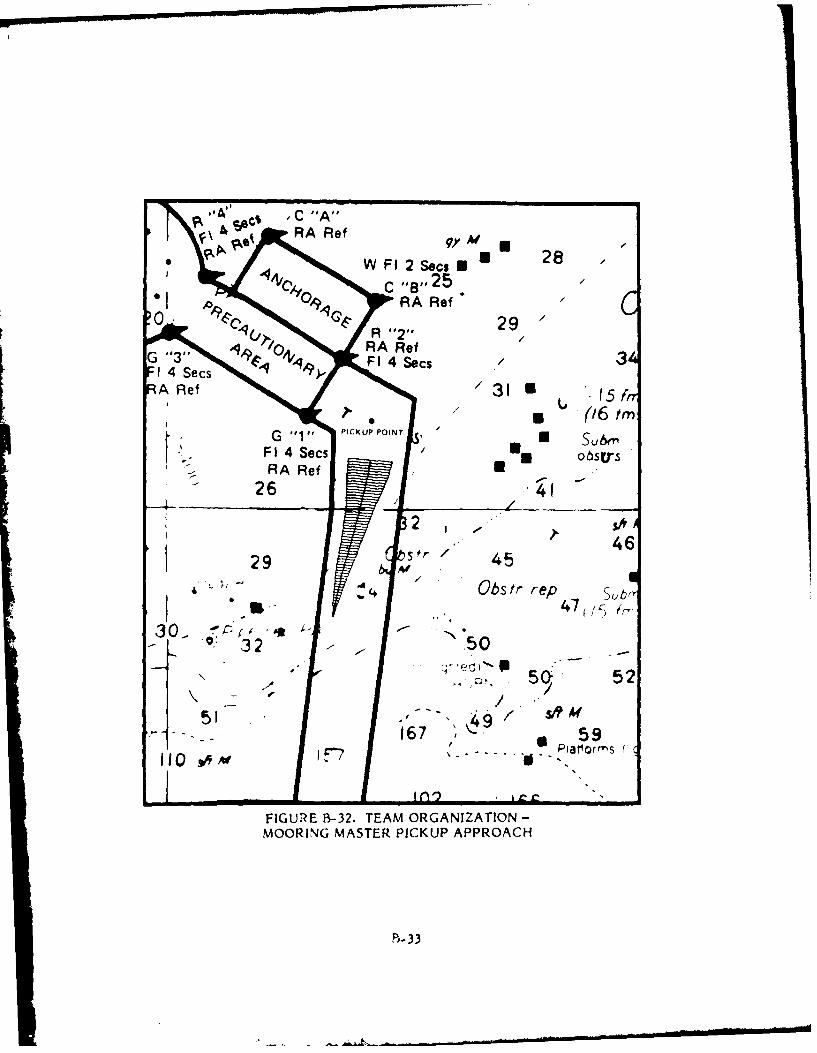
fvt RA Ref 9py'A
G~~~ "3" 294 es
G 1 PICKUP POINT s (6,bm
2 oe 5~s#
1, 46
O's tr rep47(/ ~
30- 0
5a 52
5, 4
FIGURE B-32. TEAM ORGANIZATION -
MOORING MASTER PICKUP APPROACH
,- 33

ARA Ref gyM *VVF ee 28 -
00 cRA Ref co 6,29/
Fl4 Secs Fl7 49 FISees
Ul (56/rG " ' PICKUP POINT SU&7'
26 46
4Obs ir rep sub-47 /5 rr
32 .50
p~ 52
-- 167 1
FIGURE B-33. RADAR BASED DISPLAYS, TRADITIONAL ORGANIZATION -
MOORING MASTER PICKUP APPROACH
B- 34

q 285
0 R 29'
6 m
G '1f PCV " 47uibm
N ~A RcY 5
299
I"
513

ya\ RA Ref
UW 28
'94; RA Ref 2
Gq /o4, RA Ret
R Rf313 .5 f/ (16 trn
F Sc obstrs
2 SA46
/ Obs fr rep j6r
30- - N 0
5a 52
51/167 '1 *4. 59
- a Platiorms110 SAM~ F7---- d S
FIGURE B-35. ARPA BASED DISPLAYS, TRADITIONAL ORGANIZATION-MOORING MASTER PICKUP APPROACH
B- 36

C "A"*RA 2ef
W~ ~ 2 FI2S 006 2
1 4Secs ::;q, F15c/3
F 1 Sac 0 otrs
26
2 SA*
4629v
Obs Ir rep
/ 52
Fl( l PL i -36. ARPA B~ASED DISPLAYS, TEAM ORGANIZATION -MOO'RING MASTER PICKUP APPROACH
ib-37

5 69t23 1 02 166 S 4
--I' ' 213244 131 M0" "" 62 •. . .€
3 i 48 254 -2 6---33 -- ,, 40) - l--251, - 2
298 15 16636 5,28,1 2 / 248
S46 2 - -w. 2'
-4" -- 231
54I 266 ' 39,
4i 50 2;C 29 3 8 365
236 39259 . 31 / 7 ,8 36- +
/6 2 01 131 7 291 286 360 4 -
38 1 6/55
4
66/ 45 . , e #19 _ 22[ 4-2, t
6/// Al
47 - 53 62 07 158 295 365 452
,-, A l.
6C - 452226 384" O -
59 i. --• Al 4113 ,
3 193,9: 244 -
6 385 % %
4731 26 .:" 2 317"
86 15ow
286 380 478
m ..-"380 . 42417e 8,61 2! 7 4( - ,, . - " 3 383 - -
76 " 259 32 387 "34 44
All 385
FIGURE B-37. RADAR - DEGRADED DEAD RECKONING APPROACH
B- 38

' 69123 102 166 S Af 4
-" '13 t31'" A \ " " 62 g ., ,M /
4 8 .25 4. .
233 -~46 - 1 5 5 p1r.. -," .251 152 1-
'"9 151 166 1 166
4623( 5 281 27 244 6. 27
_ _ _ 231 : 53 345
314 ',,
266 '?11 29 -, . 3 8 365
236 392
59 9 2221, 36 --
323
5 41 4/.55
/ 6I,,w, ' 4 2 "" "
K 53 6 158 295 365 452
5 9 3
60 5 58 , 226 384" ' 4 "
66, , A/ . 1 9 1 2 4 4 . " ,B35 6= " 385 -; 7 /
473
86 156', ' 5I'PI
JVA 28 '~ 380' 478129 161 :211 ,1(6 ' 206 2863 0 ,7 .
380.' 42478 It2... 363t7B 2! 7 33"75'- '"'
- , / A." S ' ".. .176 259 A, 132 387 34 44
,." 385 1.'F:V, i1: B-38. RADAR/RACON- DEGRADED DEAD RECKONING APPROACH
B-39

5 .. 695 123 102 166 "S/
/4138 244 131 so g'A o
-1" 2,."-13 tP, ,~
04 "I ' 62 lit-48 254 ...
33 ~. 40 - 76.. .- 251 121 16
96 1 5163 281 27 -"•248
6 2. 27
41- -15S-2- 51 - 2131 3 345
35 5 •,154' bC/
.. . . 266'41 50 211 29 .. ". 3 8 365
9392
38 201 131 7 291 286' 360 . 4,
/551 7"-4
45 / 5 A 7e 19 '221 "29i 4
/ 6 ' 5825'N ""
47 53 62 158I 295 365, 452 .
69""' 226 384"
59Af 403<
6, &A3 191 244 . . -
6 385' , " "/473
16 23 ;31
15115j() 12 9 1 21 J f 6 , 2 0 6 2 6 6 2 8 6 ' 3 8 0 ' 1 4 7 8 , ...
171
17 ..-- 2.o., 337 36
334017 259 32 387l 340--- " 44
385FIGURE B-39. ARPA - DEGRADED DEAD RECKONING APPROACH
B-40

5 69, 123 102 166- . 69
213 0 pr,, ,e62 ~
S40 254 6 7 .33 ,-,, 40 116' .. . { - ....r..€.~ ." 251 12
251 166"'/4"51 "1" S- 19 i" .151 _. 166 /...
• 36 4613281 4 48
31 '2 _ _46 ------,-- 2
41 5, 1 231_- -3, ,.3 39
591 ,'.2 266 '/ ' 29
'2"511'" 3 8 365
f 236 3 392
G59 20 131 74 291. - 360 --- ""38 I6\,.
o i5 "- 61,5 . . ' ', 416
45 70 19 221 294
/ I
6 6f
47 / 53 62 07; 158 295 365 452
so 15 4. 45"69 58 226 384'
59 '-"1-5--
593 ,
oAf 33 191 244 "'
3473
1269 i 234 317
86 56Ai,.() 380: ' 478
129 " I ii Jib ,1 206 286 380 478
' , K....380.6' 424
178 161 2! 763 24/,,5 2 l " ,- "° 33
176 259 3 387 340 . 4
Ono 367_."_- 365 ,' 340 "
FIGURE B-40. TRADITIONAL ORGANIZATION -DEGRADED DEAD RECKONING APPROACH
B-41I

5' 121 102 166 69 1- 213 244 s3 o b" e
* 213
*4 1 6 254 ----- 27
354i521 1
115 19 151 166639
36236391/ 20' 2 7 28 6 -
46 27-
Al 54
47 1 50 53 6 2 ; 28 295 365 42 JJ.
6C 20 13 4 29 86, 3 0438 0e 4
/55 416
4 35 7 2121 '73
47 53 5l0 5 9 6 1
Ail
28 38 4 7852
5
'7'3
38385,
B-473

5 69123 102 166 ,O"
"181 213 24- 13-s -9b'~~"' 62
48 i 53.- 4- '.'"..547 2 ,6
. ."9! . . 16 636 !51," ' ./
.. 23' 281 27 248
.. ' 46 - . " . . ., . 27
21213 392
35 6 154- 6'6 21 2 . 36/3
0 0 172 3636236
- " ,,,, 4 ,6
4 59 2 1. 1 7 29 22 .-... 360 4. .
/ 6 ,
B-5
45 07 158 295 3 52
- 7 ,A41
60 452 1
59 "-
3A5 1 191 246 483
1286
171 -. 6 0 2 61
LE, 340, 44363
FIGUR 16 42 RAATAITOA3RANZTO7DEGADE DAD ECONIG PPRAC
0B- 43

5 69123 102 166 " M 4
"" " '23 I I 213 244 13 so2
. 19 151 6" 6
36 ' /41 27CN .46', 23 .....2
35 /' 9 'w c; f f 9, - 7 , JO A -- I ' " "u/,/266 3
f 50 2 : 29 3,,0 . 8 365
236 392
S59 201 ' 131 74 291' ,8"d 360 ""43 8 4
/55 - ' 416
-45576 '22" '"'291"' "4
753 6- 07 '58 295 365 4 24 - 5362 -'
-
: -A4
6'"- 58 226 384'
59'
1., 3 191 Af 244 41$3
83 136 3856 "473
1 "e 9 2 3 4 ,317 5
86 . 156
.I6129 161 il j6 206 286 360 478
.380.' 6424
178 161 2!7 337 363525~. 6
17 1 I,'176 .'" 259 132 387 , 340 4,
17 .' 385 . '30
FIGURE B-43. RADAR, TEAM ORGANIZATION -
DEGRADED DEAD RECKONING APPROACH
B-44

5 '23 102 166 " /4
-41 213 244 31'11 "1 i " 1 " 62 )... . ~ . .254' 62 . .1- 1
9 . - 15 1 16 6
* 36 11 28 2Z80'.. - g'-pl ' 231
---46 -- --- 27
41-, 5 y 3135 ,, 6v : 1, - ',C/
7 A . 2663
504 2 1 2 9 ,2Q- . 3 8 365j ,3,
236 39259 2 31 291 * ,; '. 360 -.-- 459 6 //
,390/ 4 6 4- 71 4
5 / / .6 701 ' [ ' / " ." 2i' . I - '.. .
7 560 7 > , 1 5 8 2 9 5 ' 3 6 5 4 j 2 : " -47 - 53 16 2
" " ' ~~4 5 - ' " -6 " 58 226 364-69 0.- . t :6C ) / - . ',5-.
5 94 4 4, :-3m.f . 83 1 "9', "2. .. ' .,."4.
F.. 38s . , ! ,'6 , 473Q6i : 234 :317 5'. 7
86 15 6V
1)8" 300' 47829 21 I 2 6286 ,'. -
3 380, 424
- ~ 36308 161 2! 7 32;5 ,-.
171 Ads ' "./ 1 76 325 44 '
S32 387 ,' 340I :L ''" 5 8
FIGURE B-44. RADAR/RACON, TRADITIONAL ORGANIZATION-
DEGRADED DEAD RECKONING APPROACH
B.-45

Appendix C
EXAMPLE OF QUESTIONNAIRES
PRERUN QUESTIONNAIRE
Briefly describe your plan for this run. (Include ETA, CPA to rigs, where willyour begin to slow, etc.)
POSTRUN QUESTIONNAIRE
We are interested in your assessment of the run you have just completed. Thisquestionnaire is designed as a self-evaluation of the transit.
1. How closely did you follow your initial strategy?
__a. no change from initial strategy__b. some change fromn initial strategy__c. significant change from initial strategy__d. completely different strategy
2. Why did you select this track?
3. If your strategy changed, briefly explain why.
4. Did you meet your estimated tim'e of arrival to any way points?
a. yes__b. no
If no, why'!
5. Did you initiate course changes"
a. too soonb. too latec. at an appropriate t irfle
6. Did you maintain consistent speed throughout the run?
a. yesb. noIf no, why?
7. How did the ship traffic affect youir strategy?
__a. waited until the ship passed__b. ship did not affect strategy
c. other (explain)
8. Did you maintain sufficient distance from traffic and fixed objects?
__a. too close__b. within enough distance__c. other (explain)
C-1

9. Did you ever have doubt as to your location? Check the appropriate box.
a. I was lost much of the timeb. I had doubt at one point of the runc. I knew where I was through out the run
10. Was the pilotage conducted safely according to your own criteria?
a. Yesb. No (explain)
11. What one feature of the display was most helpful during this run?
12. If you repeat this run, what one thing would you do differently?
13. Additional comments/observations
TO BE PROVIDED AND ANSWERED AFTERDISORIENTATION RUN
1. When did you first doubt the dead reckoning track?
2. Why did you question ownship's location?
3. Did you resolve the problem as efficiently as you could have with the availableinformation?
4. What did you do when you realized ownship was no along the dead reckoningtrack?
POSTSIMULATION QUESTIONNAIRE
Part A: Enhancements
Answer the following questions by choosing:
a. Radar without raconsb. Radar with raconsc. ARPAd. ARPA with navigation option
1. Rank the enhancements by putting the letter of the navigational tool in theappropriate spot.
1 2 3 4
Most effective Least effectivenavigational tool navigational tool
2. What were your criteria for choosing I?
C-2

3. What were your criteria for choosing 4?
4. Would you use ARPA in the real world?
a. Definitely use ARPAb. Probably use ARPAc. May or may not use ARPAd. Not likely to use ARPAe. Definitely would not use ARPA
5. How much more helpful was the navigation option with ARPA?
a. Added a lot of relevant informationb. Added some relevant informationc. Added information not necessaryd. Do not want added information
6. When compared to radar alone, did the additional racons add:
a. Much significant informationb. Significant informationc. Little significant informationd. No significant information
7. Were the scope representations sufficiently realistic?
a. Yesb. No (explain)
Part B: Scenarios
Answer the following questions by choosing:
a. Inside north/south fairway scenariob. Outside north/south fairway scenarioc. Fairway approach scenario
8. Which scenario was easiest? What made it easy?
9. Which scenario was most difficult? What made it difficult?
10. Would you have conducted all the transits under similar conditions on an actualship?
a. Yesb. No (explain)
11, Did the lack of visibility affect your transits?
a. Yesb. No (explain
Part C: Ownship
12. Have you previously handled a similar ship at sea?
a. Yesb. No
C-3

13. Was the ship maneuvering response realistic for its size, type, and loadingcondition?
a. Yesb. No
If not, how would you have expected it to differ?
Part D: Navigation Conditions
14. Were the charts provided adequate?
a. Yesb. No (explain)
15. Was the navigation information provided during the scenarios adequate?
a. Yesb. No (explain)
16. W hat aids would you change keeping in mind the various operating conditions youmight meet in this area?
17. What changes would you make in the configuration of the channel, anchorage orplatform areas?
Part E: General Simulation
18. Was the bridge equipment adequate?
a. Yesb. No
19. Did it function properly and was its arrangement characteristic of a "typical"merchant ship bridge'
a. Yesb. No (explain)
20. Have you ever been a subject on a simulator before'
a. Yesb. No
1. Did the simulation feel natural to you on the first transit?
a. Yesb. No (how long did it take to become familiar with it?)
22. After two or three runs, did \ou recognize any elements of the situations?
a. Ye sb. No (explain)
23. Were you able to adapt to the simulator so that your responses were the same asthey would be at sea?
a. Yesb. No (explain)
24. Additional comments:

BIBLIOGRAPHY
Bertsche, W.R. and A.J. Pesch. An Automated Standardized Bridge Design for theU.S. Merchant Marine. Report Number EAG-76-38006, U.S. Department ofCommerce, Maritime Administration, January 1977.
Bertsche, W.R., A.J. Pesch, et al. Study of the Performance of Aids to NavigationSystems. Phase I, An Empirical Model Approach. Report Number CG-D-36-78,U.S. Department of Transportation, U.S. Coast Guard, July 19, 1978.
Bertsche, W.R. and .A. Walsh. "impact of Bridge Design on the Navigation ofShips." Presented to the International Association of Lighthouse Authorities,1979.
Eclectech Associates, Inc. Preliminary Observations and Sample Data Analysis for aSimulator Study of Deepwater Port Potential Tanker Problems in Poor Visibility.U.S. Department of Transportation, U.S. Coast Guard, July 1980.
Faragher, W.E., J.T. Pizzo, et al. Deepwater Ports Approach/Exit Hazard and RiskAssessment. Report Number CG-D-79, February 1979.
Myers, J.L. Fundamentals of Experimental Design, 3rd edition. Allyn and Bacon,Inc., 1979.
Pfaffenberger, R.C. and J.H. Patterson. Statistical Methods for Business and Eco-nornics. Homewood, Illinois, Richard D. Irwin, Inc., 1977.
Snedecor, G.\A. and W.G. Cochran. Statistical Methods, 6th edition. Ames, IowaState University, 1967.
U.K. Natial Ports (-ouncil. Navigational Aids in Harbours and Port Approaches.London, Lrr!tnd, i qjary 1972.
.................. N 'V N I hT I N<,;