SIMULATION OF NITROGEN DISTRIBUTION AND ITS EFFECT ON …
15
SIMULATION OF NITROGEN DISTRIBUTION AND ITS EFFECT ON PRODUCTIVITY IN EVEN-AGED LOBLOLLY PINE PLANTATIONS F. W. T. Penning de Vries, C. C. Murphy, Jr., C. G. Wells, and J. R. Jorgensen Contribution No. 156, Eastern Deciduous Forest Biome, US/IBP. pp. IN F. G. Howell, J. B. Gentry, and M. H. Smith (eds.). 1975. Mineral cycling in southeastern ecosystems. ERDA Symposium Series. CONF- 740513. Technical Information Center, Oak Ridge, TN. 898 pp.
Transcript of SIMULATION OF NITROGEN DISTRIBUTION AND ITS EFFECT ON …

SIMULATION OF NITROGEN DISTRIBUTION AND ITS EFFECT ON PRODUCTIVITY IN EVEN-AGED LOBLOLLY PINE PLANTATIONS
F. W. T. Penning de Vries, C. C. Murphy, Jr., C. G. Wells, and J. R. Jorgensen
Contribution No. 156, Eastern Deciduous Forest Biome, US/IBP.
pp. 70~83. IN F. G. Howell, J. B. Gentry, and M. H. Smith (eds.). 1975. Mineral cycling in southeastern ecosystems. ERDA Symposium Series. CONF-740513. Technical Information Center, Oak Ridge, TN. 898 pp.
SIMULATION OF NITROGEN DISTRIBUTION AND ITS EFFECT ON PRODUCTIVITY !N EVEN .. AGED LOBLOLLY PINE PLANTATIONS
F. W. T. PENNING DE VRIES,• C. E. MURPHY, JR.,t C. G. WELLS,* and
J. R. JORGENSEN* •Department of Theoretical Production Ecology, Agricultural University, Wageningen, The Netherlands; tSchool of Forestry, Duke University, Durham, North Carolina, *USDA Forest Service, Research Triangle Park, North Carolina.
ABSTRACT
Nitrogen often limits the productivity of loblolly pine in the southeastern United States. The amount of nitrogen available to roots depends on organic-matter decomposition on the forest floor and in the soil, on influx by rain and fertilization, and on uptake by roots. Nutrient concentrations have been observed in tree parts, forest floor, and mineral soil, and growth rates of stems, branches, needles, and roots are well known. Synthesis of this information has led to a simulation model, which integrates rates of nitrogen transfer between and changes within several compartments in the nitrogen cycle. The model calculates growth of trees from basic processes where nitrogen limits assimilation. Critical areas for further research in relation to plantation productivity are indiCated.
One problem impeding the improvement of forestry practices is the long time delay before the effects of certain management practices can be measured by changes in yield. Except for young stands, yearly weight increments seldom exceed 10% of the standing crop, and the natural variation in tree size severely limits the detectability of small, but nevertheless important, changes in growth rates and yield. The interrelations of physiological, microbiological, and silvicultural a:spects of productivity of plantations add another dimension to the problem. Therefore, little of the knowledge concerning the physiology and the nutrient requirement of forests has been of use in forest-productivity predictions.
Simulation techniques provide a tool to integrate the knowledge of basic processes in a system, such as a plantatiof)., and to study growth and productivity as a function of cultural measures. Simulation methods, which have been applied
70

SIMULATING NITROGEN CYCLING AND PRODUCTIVITY 71
successfully in many fields of scientific research, have been used to describe the behavior of the total system from knowledge of individual basic processes which could not be derived otherwise (De Wit and Goudriaan, 1974).
To summarize the many individual processes and point out how they may affect productivity over many decades, we have made a simulation model of even-aged pure loblolly pine (Pinus taeda) plantations. Loblolly pine is a major source of timber and pulp in the southeastern United States. In significant areas loblolly pine production is limited by the availability of nitrogen in the soil (Wells, 1970). Such production systems are suitable for simulation because the even-aged stands have a relatively simple growth pattern. Annual nitrogen input by rain is well known. The amount of basic information available for loblolly pine should allow the model to more precisely predict the behavior of this system in response to cultural practices. Another important function of the model is that it indicates more clearly than any other method the most relevant areas for future research.
With our model we try to describe growth in even-aged loblolly pine plantations from seedlings to mature trees on sites where nitrogen availability is limiting. Such sites are characterized by a site index of 50 to 90 (height of dominant trees in feet at 25 years of age) where rotation occurs every 25 to 40 years. Although nitrogen is the growth-limiting factor over a 2- to 3-year period, severe droughts can also limit growth in some years. We define growth as the increase in dry matter in aboveground and belowground parts of the vegetation.
Nitrogen is present in the soil, forest floor, and trees, and a variety of processes are responsible for its flux in the system. Dropping of needles, branches, and stem bark carries nitrogen to the forest floor, as does thinning and harvesting. Decomposition returns nitrogen to the soil, and artificial fertilization may also be used. The annual influx of nitrogen by rain amounts to 6 to 10 kg ha-1 year-1 in the Piedmont area of North Carolina, while efflux by drainage is 10 to 50 times less. Rates of fixation of gaseous nitrogen and denitrification are small (Wells and Jorgensen, 1973), while burning causes about 7% of the nitrogen in the biomass to move out of the forest.
Only those plantations will be considered in which the number of trees and shrubs in the understory is kept low. In such forests normal practices include thinning and prescribed burning; artificial fertilization is currently under consideration. Duration of a rotation and the intensity and frequency of the above-mentioned measures can be manipulated by the forester in accordan~e with various production policies.
Two standard situations will be used in the modeling effort. These include plantations managed as described above with a 25- or 40-year rotation. Trees 25 years old are harvested mainly for pulpwood, and trees 40 years old, for timber. The growth rate of a forest with a stocking density that is optimized for timber production and the density of trees (Fig. 1) was taken from Wahlenberg (1960).

72 DE VRIES, MURPHY, WELLS, AND JORGENSEN
z 2.0 0-i= ~ u Q)
::::> > 0 -0 lu 0:: .r:: c.. ,_ (/) Q)
(/) t: < C'O
~ E Q ~ 1.0 CD '0
..J til < .:./.
~'!, z .-<
Qb---_.----~----~----~--_. ____ _. __ ~ 0 40 80
AGE, years 120
;; ~ ~ (/) w w 0:: 1-1.1.. 0 a: w CD ~ ::::> z
Fig. 1 The annual biomass production and the number of surviving trees at different ages in an optirrW.ly stocked plantation. (Adapted from Wahlenberg, 1960.)
THE MODEL
Mineral soil, forest floor, and the loblolly pine trees are the major components of the system. The rooted layer of the mineral soils of pine forests is often shallow (0.5 to 1 m) and contains 40 to 100% of the nitrogen in the forest (800 to 3000 kg/ha). Most of the nitrogen is in organic compounds, which need decomposition before becoming available to the root system (roots plus mycorrhiza). About 4% of the total nitrogen annually becomes available to the trees (Wells· and Jorgensen, 1973). The amount of this fraction is affected by the physical structure and the water content of the soil, probably via its aeration. In areas with well-distributed rainfall, as in the Piedmont, this fraction is relatively -<:onstant. Rapid root turnover (Harris, Kinerson, and Edwards, 1973) and <:hemical absorption to lignin (Beek and Fiissel, 1973) annually fix 30% of the available nitrogen into dead roots and humus.
Nitrogen in rain and fertilizer is predominantly in the form of N03 and NH3
-and should be available for uptake within 1 year. Nitrogen moving from the forest floor into the soil is predominantly unavailable to the trees and requires alteration before uptake -occurs. Little nitrogen is present in stemflow and throughfall. Unlike nitrogen in rain, stemflow and throughfall cause only a redistribution of nitrogen in the system.

SIMULATING NITROGEN CYCLING AND PRODUCTIVITY 73
Beek and Frissel ( 197 3) constructed a model from basic principles to simulate decomposition processes in soils. This model simulates decomposition processes over periods of months, but its authors already indicate that the knowledge is still lacking for extrapolation to longer periods or greatly different soil or .climatic conditions.
The forest floor consists of dead needles, branches, and stem bark normally less than 15 years old. The forest floor contains 0 to 15% of the total nitrogen in the plantation. Its decomposition results largely from microbial activity. Conifer litter has a very low nitrogen content (a carbon/nitrogen ratio up to 100), which supposedly limits microbial activity. The rate of decomposition of total biomass is greater than the nitrogen release; so its carbon/nitrogen ratio decreases. The carbon/nitrogen ratio is assumed to be the key factor that controls the rate of decomposition and nitrogen release. In addition to what is expected on the basis of its carbon/nitrogen ratio, 5 to 15% of the freshly fallen litter decomposes in the first year on the forest floor. This is probably due to degradation of easily accessible material, such as protoplasm.
Wells and Jorgensen (197 3) observed forest-floor decomposition and nitrogen contents of soil and tree fractions in experiments carried out over more than a decade in Duke Forest and more recently in the Eastern Deciduous Forest Biome-lnternational Biological Program at the forest stand at Saxapahaw (Murphy et al., 1973); both sites are in the Piedmont region of North Carolina. Our study draws heavily from their results, most of which are annual observations. The rate of decomposition and nitrogen release of the forest floor is simulated by treating 20-year classes of litter separately. In each class the amount of biomass and nitrogen is simulated. Decomposition rates are calculated from the ratio of total carbon and nitrogen per layer, rather than treating needles and branches separately. To avoid the detailed calculation of the water status of the litter, we ignored the effect on decomposition of increasing humidity in lower layers. In a stable climate, errors· resulting from this simplification are small over the time scale used. With these simplifications, decomposition and forest-floor buildup are simulated quite well in the Piedmont area, but the model eventually needs to include effects of temperature and humidity on decomposition for application in other climatic regions.
Trees were subdivided into roots, stem wood, stem bark, branches, and firstand second-year needles. Total dry weight and nitrogen content are simulated for each of these fractions. Needles have a life span of 11/z years. Before needles fall, 30 to 50% of the nitrogen of second-year needles is stored in the tree for next spring's growth. Branches in the hottom of the crown grow only a few needles and soon die. It was assumed that 50% of the branches older than 5 years a~e removed by self-pruning. The self-pruning rate of branches decreases somewhat if the individual tree grows faster than the average. It is assumed that, once the bark for 1 year is laid down, it begins to slough off at a rate that results in a 25% loss of the bark at age 10, 50% by age 20, 75% by age 30, and the loss of the remainder of the 1-year bark increment by age 40.

74 DE VRIES, MURPHY I WELLS, AND JORGENSEN
We obtained the growth rate of the simulated plantation by subtracting the respiration for maintenance of cell integrity from the total-stand assimilation. Annual forest assimilation is thought to be dependent on the total amount of nitrogen in the needles, thus accounting for changes in assimilation by changes in biomass and nitrogen content of the needles. A simple description of annual maintenance respiration relates its rate to the nitrogen content of the living tree parts. The biochemical composition of the biomass produced annually changes little with age or site so that growth respiration is a constant fraction of growth rate (Penning de Vries, 1974). At the present stage of knowledge of tree assimilation and dissimilation and the general level of detail in this model, it is not appropriate to make more refined calculations of tree growth ..
In our model the limiting effect of nitrogen is on assimilation, rather than on growth as such. Some observations support this assumption (Kozlowski and Keller, 1966), but this very important relationship requires further investigation. The rate of photosynthesis per unit of surface of loblolly pine needles is low. However, photosynthesis per gram of nitrogen in needles is high (Higginbotham, 1974), which also suggests that nitrogen limits photosynthesis.
Observations by Wahlenberg (1960), Ralston (1974), and others provide an estimate of the distribution of the total biomass increment over the tree fractions (Fig. 2). In young trees most of the annual growth goes to branches and needles, whereas in mature trees stem wood gets the largest share of growth.
Stem wood u. 0 z 0.6 0 f= (.) <( cr: u. w 0.4 Branches >. f= <( ....J Roots ::> :2 a 0.2
Needles
0.0 0 40 80 120
AGE, years
Fig. 2 Distribution of annual biomass production to the various tree fractions for the standard case as a function of age.

SIMULATING NITROGEN CYCLING AND PRODUCTIVITY 75
The difference in the distribution of biomass among tree organs and the relationship of this distribution to tree density suggest that growth per tree is an important variable. Tree growth pattern can be simulated by dividing actual tree growth by the growth per tree in the optimally stocked situation. If the resulting ratio is greater than 1, stern and branch growth are stimulated more than other factors, but, if the ratio is less than 1, these fractions are reduced the most (Fig. 3 ). For the calculated growth rate to be met in conditions where the relative growth per tree is not equal to unity, the growth of needles and roots is. given first priority, and the remainder of tree growth is distributed over stem wood, stem bark, and branches. Because a larger share of the assimilates in young trees is used for needle formation than in older ones, the relationships between relative growth of stem wood, stem bark, and branches depend on the age of the trees.
The concentration of nitrogen in the annual increment of each of the tree fractions is related to the relative availability of nitrogen in the soil (Fig. 4). The relative availability of nitrogen is expressed as the amount of soil nitrogen
available for uptake divided by the amount taken up in a well-stocked stand of the same age. It is assumed that the effect of nitrogen availability on nitrogen content does not change with age. Data to construct Figs. 3 and 4 come mainly from careful, but subjective, observations of forest growth since existing data
:I:
~ 0 a: (!)
u. 0 z 0 ~ ~ 1.0 a: 1-CJ)
Ci
Age
1.0 2.0 RELATIVE GROWTH PER TREE
Fig. 3 The relationships for distributing growth over tree fractions for nonstandard cases as a function of available assimilates, expressed as ~lative growth per tree. Both axes are normalized with respect to the standard case.

76 DE VRIES, MURPHY, WELLS, AND JORGENSEN
.... Q)
::: m E c:-
"0 0'> z 0'>
0.015
... : 0.009 z w 1-z 0 (.)
z w (.!j
0 a: 1-z 0.003
2 3 4 5
AVAILABILITY OF NITROGEN
Fig. 4 The relationships between the relative availability of soil r\itrogen with respect to the standard case and the nitrogen concentration of the tree fractions.
usually concern growth alterations due to change of these factors simultaneously.
Simulation of the number of trees per hectare includes removal by thinning; a natural death rate of 2% per year for the first 10 years and 0.8% thereafter.
The present model can be adapted easily to simulate distribution of other nutrients and growth when these nutrients limit tree assimilation. Also, simulation of these processes on plantations containing other:· tree species will change little of the model's basic structure. For these changes, ~owever, we must have adequate knowledge about the species and nutrients.
SIMULATION PROGRAM
The model describes the physiological, microbiological, and mechanical processes relevant to nitrogen distribution and forest growth. Its computer program is formulated in the simulation language Continuous Simulations Modeling Program (CSMP; IBM, 1972). This user-oriented language provides many input and output facilities and allows a deductive style of program writing which improves its readability. A preprocessor is used, which expands a shorthand notation of repetitive features into CSMP (De Wit and Goudriaan, 1974). This program integrates the rates of change over 1 year and reports

SIMULATING NITROGEN CYCLING AND PRODUCTIVITY 77
resulting amounts of nitrogen and biomass in the various parts of the system. Further integration occurs from the recalculation of the rates of processes resulting from the amounts of biomass and nitrogen in the various parts of the system. The cycle is repeated until the required time span has elapsed. Sudden modifications of distdbution caused by cultural practices are taken into account. Rates are calculated on an annual basis to avoid more detail in input and output than is useful. A listing of the program is available on request.
MODEL BEHAVIOR IN SITUATIONS WITH AND WITHOUT OBSERVATIONS
When the parameters of the model are set to simulate growth in the standard situation, the predicted values correspond well with observed rates (Wahlenberg, 1960), and the distribution of biomass over tree organs agrees well with reality (Ralston, 1974). Since many of the basic inputs were taken from the standard situation, agreement is to be expected. Thus the consistency of the model is emphasized. Weights of the tree fractions change over time in the standard situation, where growth was permitted to continue for 100 years (Fig. 5). Few observations are reported on growth rates of needles, branches, and roots in plantations; so even in the standard situation a thorough evaluation of model behavior is impossible. Decomposition of litter and buildup of the forest floor
6 12
5 10 <1l .s:::
<1l c:n .:.!.
<E (/)' ~4 8 z c) 0 0 ;:: 0 u :.?; 3 6
~ a:
~ u.. w a: 1- w (/) r
2 4 1-0
2
0 40 80 120
AGE, years
I
Fig. S Simulated growth of biomass of tree fractions in a standard situation with thinnings at age 15 and 2 S years.

78 DE VRIES, MURPHY, WELLS, AND JORGENSEN
corresponds closely to that reported by Wells and Jorgensen (1973). Nitrogen content of needles increases significantly after thinning (Boggess, 1959), and the simulation program calculates a similar pattern in response to the smaller number of trees that take up nitrogen.
The model was tested under more extreme conditions. The tests included growth in rotations as short as 10 years with whole-tree harvests and as long as 100 years; plantations on soils with two and one-half times as much 'nitrogen as the standard plantations and with five times less; and four times as many trees per hectare initially as in the standard case and four times less. Various short-term perturbations, for example, heavy thinning, heavy fertilization, and a hot fire each 5 tb year in plantations older than 15 years were imposed to check model stability. The constancy of the total amount of nitrogen in the system, corrected for the nitrogen added by rain and fertilization or lost by fire and harvesting, was checked after each integration. Many of the results of such tests cannot be validated objectively be,cause of the lack of observations. In such situations the experience of a forester is very valuable in judging the simulated results. The behavior of the model in these situations seemed realistic, although growth after age 60 was often too high. At soil-nitrogen-contents of 600 kg/ha or less, the calculated annual nitrogen uptake can approach or even exceed the amount of available nitrogen present. Thus the assumption that rates can be calculated for one growing season using data from the last growing season is not correct. A time interval of about a month should be used to account for feedback of nitrogen on growth rates within 1 year. The present version of the simulation program is not adaptable to change in the time-step i~terval.
Assuming that the structure of the model is a legitimate simplification of the real world, we made sensitivity analyses of those parameters for which numeric values were estimated. These analyses indicate that parameters of major importance are:
(1) The amount of energy consumed in biochemical maintenance processes. A consumption rate of 50 kg of carbohydrates for maintenance for 1 year of 0.5 kg of nitrogen in needles, 1 kg of nitrogen in bark and branches, 1. 7 kg of nitrogen in roots, or 3 kg of nitrogen in stem wood has been used in most simulations. The resulting maintenance respiration rate resembles that in actual plantations. Predicted forest growth is sensitive to this parameter, and the partitioning, which has little fundamental basis, is important. Only physiotogical and biochemical research will result in better estimates and improved model structure.
(2) The fractions of soil nitrogen that are transferred between the available and unavailable pool. The numeric value used is an educated guess, but it is an important number to relate absolute soil-nitrogen contents to nitrogen uptake and growth rates. Its constancy at all nitrogen contents may be questioned. Microbiological and physiological research can provide better data for the description of these processes.
SIMULATING NITROGEN CYCLING AND PRODUCTIVITY 79
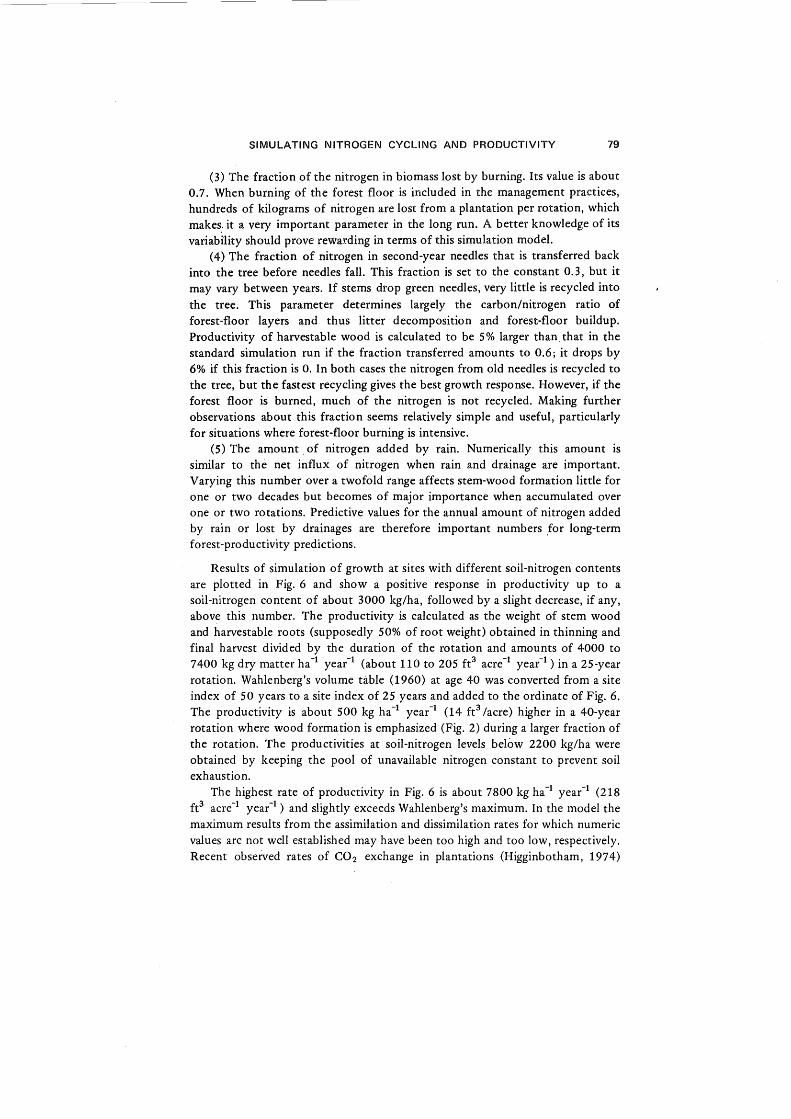
(3) The fraction of the nitrogen in biomass lost by burning. Its value is about 0. 7. When burning of the forest floor is included in the management practices, hundreds of kilograms of nitrogen are lost from a plantation per rotation, which makes. it a very important parameter in the long run. A better knowledge of its variability should prove rewarding in terms of this simulation model.
(4) The fraction of nitrogen in second-year needles that is transferred back into the tree before needles fall. This fraction is set to the constant 0. 3, but it may vary between years. If stems drop green needles, very little is recycled into the tree; This parameter determines largely the carbon/nitrogen ratio of forest-floor layers and thus litter decomposition and forest-floor buildup. Productivity of harvestable wood is calculated to be 5% larger than. that in the standard simulation run if the fraction transferred amounts to 0.6; it drops by 6% if this fraction is 0. In both cases the nitrogen from old needles is recycled to the tree, but the fastest recycling gives the best growth response. However, if the forest floor is burned, much of the nitrogen is not recycled. Making further observations about this fraction seems relatively simple and useful, particularly for situations where forest-floor burning is intensive.
(5) The amount of nitrogen added by rain. Numerically this amount is similar to the net influx of nitrogen when rain and drainage are important. Varying this number over a twofold range affects stem-wood formation little for one or two decades but becomes of major importance when accumulated over one or two rotations. Predictive values for the annual amount of nitrogen added by rain or lost by drainages are therefore important numbers .for long-term forest-productivity predictions.
Results of simulation of growth at sites with different soil-nitrogen contents are plotted in Fig. 6 and show a positive response in productivity up to a soil-nitrogen content of about 3000 kg/ha, followed by a slight decrease, if any, above this number. The productivity is calculated as the weight of stem wood and harvestable roots (supposedly 50% of root weight) obtained in thinning and final harvest divided by the duration of the rotation and amounts of 4000 to 7400 kg dry matter ha-1 year-1 (about 110 to 205 ft 3 acre-1 year-1 ) in a 25-year rotation. Wahlenberg's volume table (1960) at age 40 was converted from a site index of 50 years to a site index of 25 years and added to the ordinate of Fig. 6. The productivity is about 500 kg ha-l year-1 (14 ft 3 /acre) higher in a 40-year rotation where wood formation is emphasized (Fig. 2) during a larger fraction of the rotation. The productivities at soil-nitrogen levels below 2200 kg/ha were obtained by keeping the pool of unavailable nitrogen constant to prevent soil exhaustion.
The highest rate of productivity in Fig. 6 is about 7800 kg ha-1 year-1 (218 ft3 acre-1 year-1
) and slightly exceeds Wahlenberg's maximum. In the model the maximum results from the assimilation and dissimilation rates for which numeric values are not well established may have been too high and too low, respectively. Recent observed rates of C02 exchange in plantations (Higginbotham, 1974)

80 DE VRIES, MURPHY, WELLS, AND JORGENSEN
l co
(i) Cl) 8 > a:
'T < co 90 ~ .r::.
m ~ 1.0
~ ('I
6 80 ~ ....
t-' ci(
J: 1-~ 70 c( w 4 1-3: w 1- 60 ~ en w
50~ > a: 1 0 ci( 2
~ 40 ~ J:
w 1-Ci)
0 0 2 3 4 5
SOIL NITROGEN, 103 kg/ha
Fig. 6 The effect of soil nitrogen on the mean annual harvest for rotations of 2 5 and 40 years. The arrows indicate the effect on soil nitrogen of three treatments carried out during four rotations of 25 years& (1) complete removal of trees from thinnings and harvests (-1860 kg/ha); (2) removal of stems with harvests followed by slash burning (-1770 kglha); (3) removal of stems only at thinnings and harvests (-1610 kg/ha); (4) represents nitrogen in~ux by rain (+800 kg/ha).
will provide a basis for improvement of this part of the model. The small. decrease in stand productivity at the highest soil-nitrogen levels in Fig. 6 results from high maintenance cost of the biomass, which is a response to the nitrogen concentrations in these situations (Fig. 3). A plantation with a site index of about 70 has a nitrogen level of about 1400 kg/ha in a 0- to 60-cm layer of the forest floor. This point is below the curve in Fig. 6, suggesting that more nitrogen per year becomes available from the unavailable pool than was assumed. The response of simulated productivity to fertilization, however, agrees very well with observed stem growth (volume inside bark) in loblolly pine plantations at poor sites. The growth in a 5-year period was increased up t~ 10,000 kg dry matter at a fertilization rate of 400 lb of nitrogen per acre and decreasing beyond this rate (Wells et al., 1974). In Wells' model less than 0. 3 of the nitrogen added to the soil ends up in stem wood within 5 years, but in our model the effect of fertilization persists for 6 to 10 years. A small backlash in productivity was calculated after heavy fertilization owing to the increased load of maintenance respiration and diminishing assimilation.
In Fig. 6 the amount of nitrogen removed in fo~r rotations of 25 years is shown with three alternative management practices: the standard situation

SIMULATING NITROGEN CYCLING AND PRODUCTIVITY 81
where slash is left at the forest floor to decompose, burning of the slash at the plantation, and removal of whole trees from the plantations. In each case the nitrogen influx by rain is smaller than that of nitrogen removal, and the soil-nitrogen content drops significantly.
Figure 6 could have been constructed without a computer program. However, accounting for effects of a multitude of factors in a dynamic situation is possible only with the use of a predictive computer model. Some examples of productivity and the amount of nitrogen removed from plantations with various harvesting procedures or stocking densities are summarized in Table 1. Burning in particular causes large amounts of nitrogen to be lost. Frequent burning of the forest floor removes only slightly more nitrogen than burning once before a new rotation (standard case). Although burning removes much nitrogen in the long run, its effects are small in terms of the change of productivity within one rotation. The increased rate of cycling of a part of the nitrogen opposes the decrease of the total nitrogen in the system, leading to a small and temporary productivity increase. Frequent burning of the forest floor in actual loblolly pine plantations for 10 or 20 years has not shown any clear effect on tree growth (Ralston, 1974). Slash burning or whole-tree harvests remove slightly more nitrogen from a plantation than forest-floor burning. Fertilization increases the nitrogen content of the biomass, thus increasing nitrogen losses at harvest. Productivity (in kilograms per hectare) at high stocking densities without thinning is almost equal to that in the standard case, and the rates of nitrogen removal are similar. Although the weight of the standing crop is larger just before the final harvest in these stands, no intermediate yields have been obtained by thinning. This makes plantations less productive at lower stocking densities without thinning.
Woodmansee and Innis (1973) simulated growth of a lodgepole pine forest for sites where productivity is limited by potassium. Their study has much in common with the present model. They describe the growth rate of the forest as a function of age and potassium availability. Less attention is paid to the distribution of biomass of tree organs. Their conclusions about the rate of removal of nutrients from a plantation are numerically smaller but essentially similar to the ones reported here.
ACKNOWlEDGMENTS
The visit of Penning .de Vries to Duke University was made possible by a stipendium from the Dutch Niels Stensen Stichting. Support of the studies reported here was supplied in part by the U. S. International Biological Program, Eastern Deciduous Forest Biome Project, funded by the National Science Foundation under interagency agreement AG-199, BMS69-01147-A09, with the U. S. Atomic Energy Commission-Oak Ridge National Laboratory, Contribution 156.
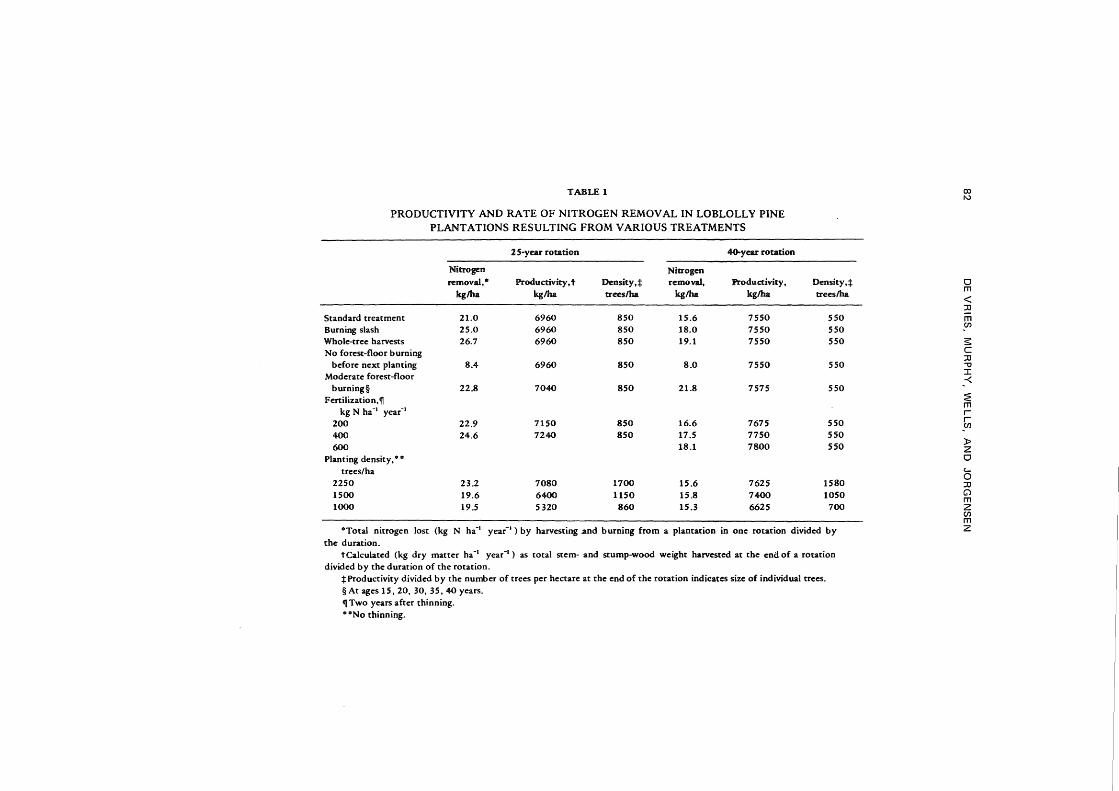
TABLE 1
PRODUCTIVITY AND RATE OF NITROGEN REMOVAL IN LOBLOLLY PINE PLANTATIONS RESULTING FROM VARIOUS TREATMENTS
2 S-year rotation 40.year rotation
Nitrogen Nitrogen removal,• Productivity, t Density,+ removal, Productivity,
kglha kglha trees/ha kglha kglha
Standard treatment 21.0 6960 850 15.6 7550 Burning slash 25.0 6960 850 18.0 7550 Whole-tree harvests 26.7 6960 850 19.1 7550 No forest-floor burning
before next planting 8.4 6960 850 8.0 7550 Moderate forest-floor
burning§ 22.8 7040 850 21.8 7575 Fertilization,1f
kg N ha-1 year-1
200 22.9 7150 850 16.6 7675 400 24.6 7240 850 17.5 7750 600 18.1 7800
Planting density, • • trees/ha
2250 23.2 7080 1700 15.6 7625 1500 19.6 6400 1150 15.8 7400 1000 19.5 5320 860 15.3 6625
Density,:!: trees/ha
550 550 550
550
550
550 550 550
1580 1050 700
'"Total nitrogen lost (kg N h£1 year-1) by harvesting .and burning from a plantation in one rotation divided by
the duration. tCalcul~ted (kg dry matter ha -1 year -1
) as total stem- and stump-wood weight harvested at the end of a rotation divided by the duration of the rotation.
+Productivity divided by the number of trees per hectare at the end of the rotation indicates size of individual trees. §At ages 15, 20, 30, 35,40 years. 1f Two years after thinning. • '"No thinning.
CXl rv
0 m < :::0 m _cn
s c :::0 -o ::::c -< ~ m r r _cn ):> z 0 c... 0 :::0 G) m z (/) m z

SIMULATING NITROGEN CYCLING AND PRODUCTIVITY 83
REFERENCES
Beek, H., and M. J. Frissel, 1973, Simulation of Nitrogen Behavior in Soils, Simu:ation Monographs, Pudoc, Wageningen, The Netherlands.
Boggess, W. R., 1959, Foliar Nitrogen Content of Shortleaf Pine as Influenced by Thinning, Agricultural Experiment Station Forestry Note No. 80, Department of Forestry, University of Illinois, Urbana. ·
De Wit, C. T., and J. Goudriaan, 1974, Simulation of Ecological Processes, Simulation Monographs, Pudoc, Wageningen, The Netherlands.
Harris, W. F., R. S. Kinerson, and N. T. Edwards, 1973, Comparison of Belowground Biomass in Natural Deciduous and Loblolly Pine Plantations, in The Belowground Ecosystem: A Synthesis of Plant-Associated Processes, U.S. International Biological Program Interbiome Symposium (in press).
Higginbotham, K. 0., 1974, The Influence of Canopy Pos~tion and Tissue Age on Growth and Photosynthesis in Loblolly Pine, personal communication.
IBM, 1-972, System/360 Continuous System Modeling Program, User's Manual, International Business Machine Corporation, White Plains, New York.
Kozlowski, T. T., and T. Keller, 1966, Food Relations in Woody Plants, Bot. Rev., 32: 293-383.
Murphy, C. E., T. R. Sinclair, R. S. Kinerson, K. 0. Higginbotham, K. R. Knoerr, and B. R. Strain, 1973, Modeling the Primary Productivity Process-a Coordinated Effort at an Intensive Research Site, in Summer Computer Simulation Conference, pp. 684-690, Simulation Councils Inc., La Jolla, Calif.
Penning de Vries, F. W. T., 1974, Substrate Utilization and Respiration in Relation to Growth and Maintenance in Higher Plants, Neth. ]. Agr. Sci. (in press).
Ralston, C. W., 1974, Annual Primary Productivity in a Loblolly Pine Plantation, in Biomass Studies, H. E. Young (Ed.), pp. 106-117, International Union of Forest Research Organizations, Working Party on the Mensuration of the Forest Biome', College of Life Sciences and Agriculture, University of Maine, Orono.
Wahlenberg, W. G., 1960, Loblolly Pine; Its Use, Ecology, Regeneration, Protection, Growth, and Management, School of Forestry, Duke University, Durham, N.C.
Wells, C. G., 1970, Nitrogen and Potassium Fertilization of Loblolly Pine on a South Carolina Piedmont Soil, Forest Sci., 16: 172-176.
--,D. M. Crutchfield, and I. H. Trew, 1974, Five-Year Volume Increment of Pole Size Loblolly Pine from Nitrogen Fertilization, Southeastern Forestry Experiment Station, U.S. Department of Agriculture Research Paper, personal communication.
--,and J. R. Jorgensen, 197 3, Nutrient Cycling -in Loblolly Pine Plantations, Eastern Deciduous Forest Biome, Memo Report No. 73-81, U.S. International Biological Program, Oak Ridge National Laboratory.
Woodmansee, R. G., and G. S. Innis, 1973, A Simulation Model of Forest Growth and Nutrient Cycling, in Summer Computer Simulation Conference, pp. 697-721, Simulation Councils Inc., La Jolla, Calif.


![Fast Fluid Simulation Using Residual Distribution Schemesgamma.cs.unc.edu/FFRDS/ffrds_paper.pdf · Fast Fluid Simulation Using Residual Distribution ... [Computer Graphics]: Types](https://static.fdocuments.net/doc/165x107/5b5d28297f8b9ad21d8d935e/fast-fluid-simulation-using-residual-distribution-fast-fluid-simulation-using.jpg)