Simulation of gel permeation (size exclusion) chromatography Jetse Reijenga 1, Wieb Kingma 1, Dušan...
12
simulation of gel permeation (size exclusion) chromatography Jetse Reijenga 1 , Wieb Kingma 1 , Dušan Berek 2 , Milan Hutta 3 1 Eindhoven University of Technology 2 Slovak Academy of Science, Bratislava 3 Comenius University Bratislava
-
Upload
claude-mcbride -
Category
Documents
-
view
223 -
download
0
Transcript of Simulation of gel permeation (size exclusion) chromatography Jetse Reijenga 1, Wieb Kingma 1, Dušan...
simulation of gel permeation (size exclusion) chromatography
Jetse Reijenga1, Wieb Kingma1, Dušan Berek2, Milan Hutta3
1Eindhoven University of Technology2Slovak Academy of Science, Bratislava
3Comenius University Bratislava
ISSS-2006 Lipica 27-29 september 2006
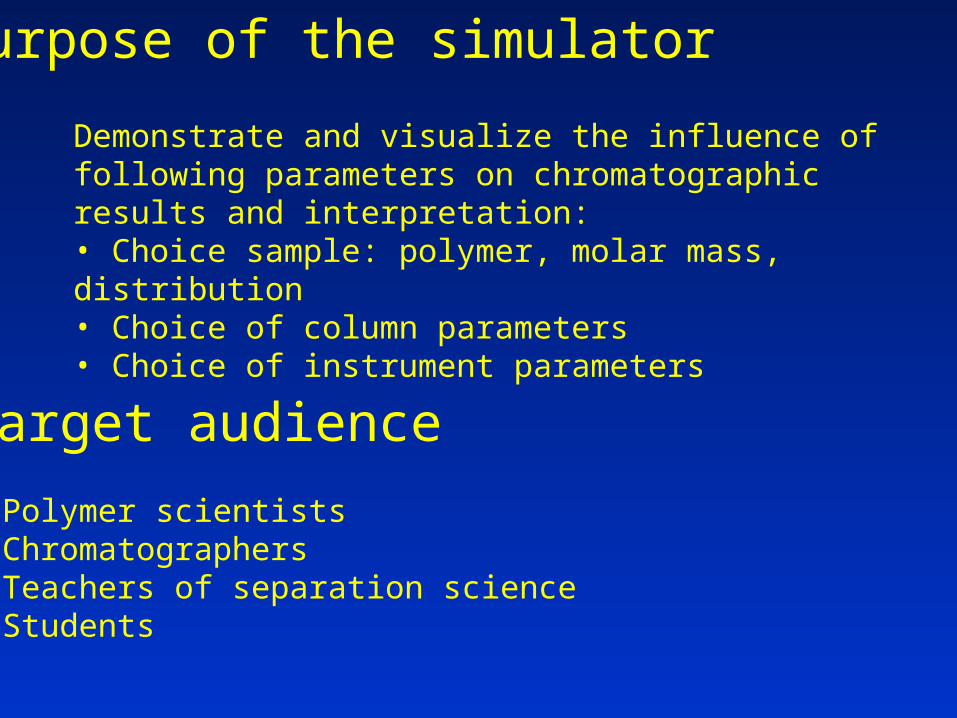
Demonstrate and visualize the influence of following parameters on chromatographic results and interpretation:• Choice sample: polymer, molar mass, distribution• Choice of column parameters• Choice of instrument parameters
target audience
• Polymer scientists• Chromatographers• Teachers of separation science• Students
purpose of the simulator
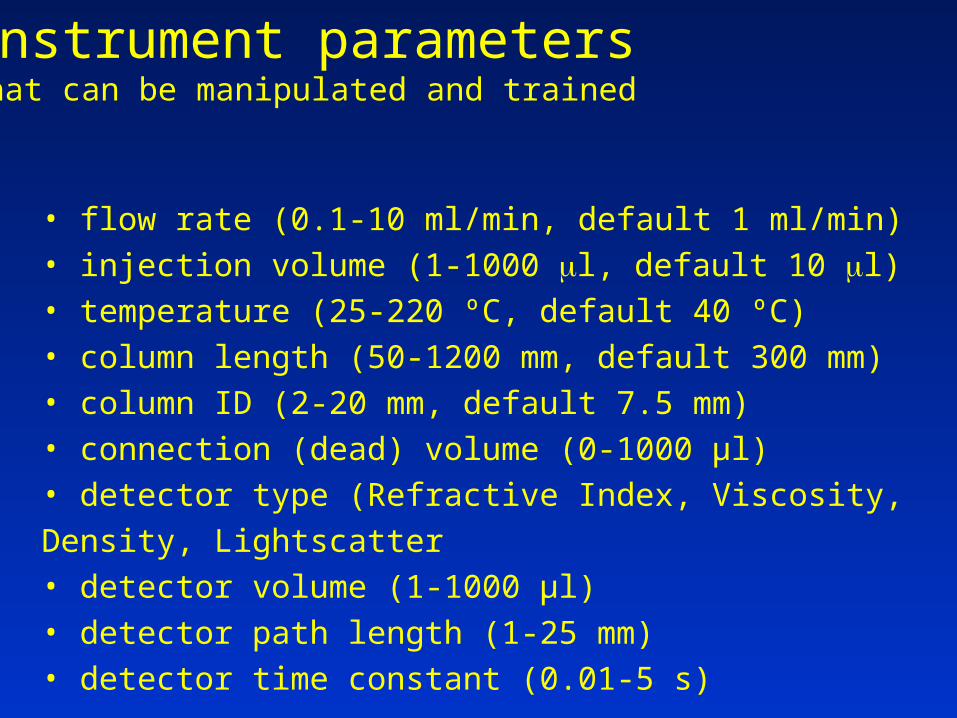
• flow rate (0.1-10 ml/min, default 1 ml/min)• injection volume (1-1000 l, default 10 l)• temperature (25-220 ºC, default 40 ºC)• column length (50-1200 mm, default 300 mm)• column ID (2-20 mm, default 7.5 mm)• connection (dead) volume (0-1000 µl)• detector type (Refractive Index, Viscosity, Density, Lightscatter• detector volume (1-1000 µl)• detector path length (1-25 mm)• detector time constant (0.01-5 s)
instrument parameters that can be manipulated and trained
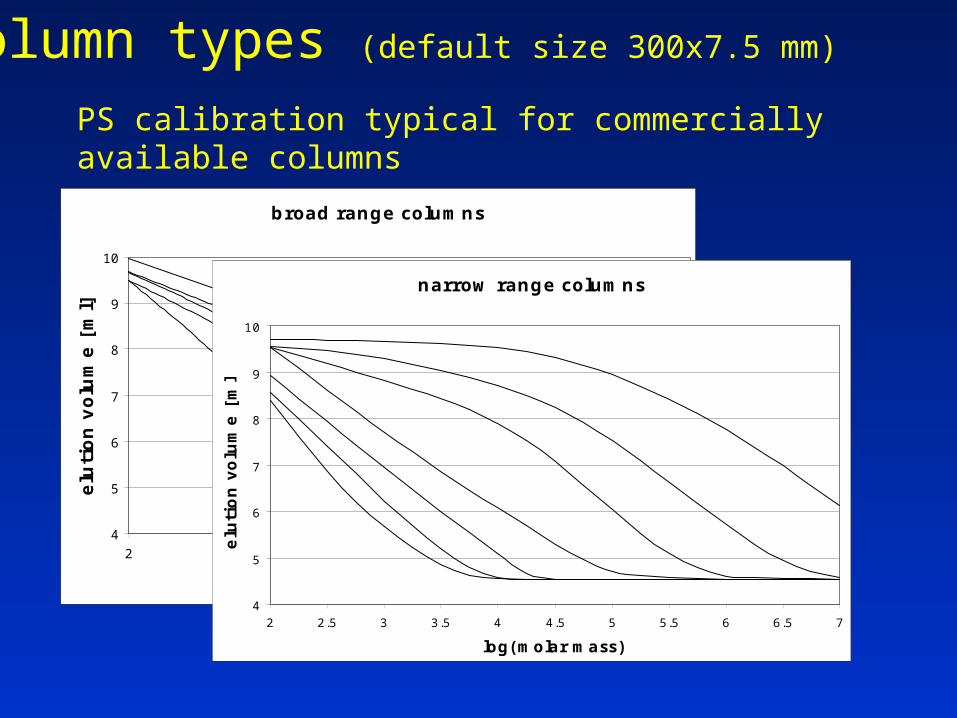
PS calibration typical for commercially available columns
broad range columns
4
5
6
7
8
9
10
2 3 4 5 6 7
log(molar mass)
elu
tion
volu
me [
ml]
narrow range columns
4
5
6
7
8
9
10
2 2.5 3 3.5 4 4.5 5 5.5 6 6.5 7
log(molar mass)
elu
tion v
olu
me [
ml]
column types (default size 300x7.5 mm)
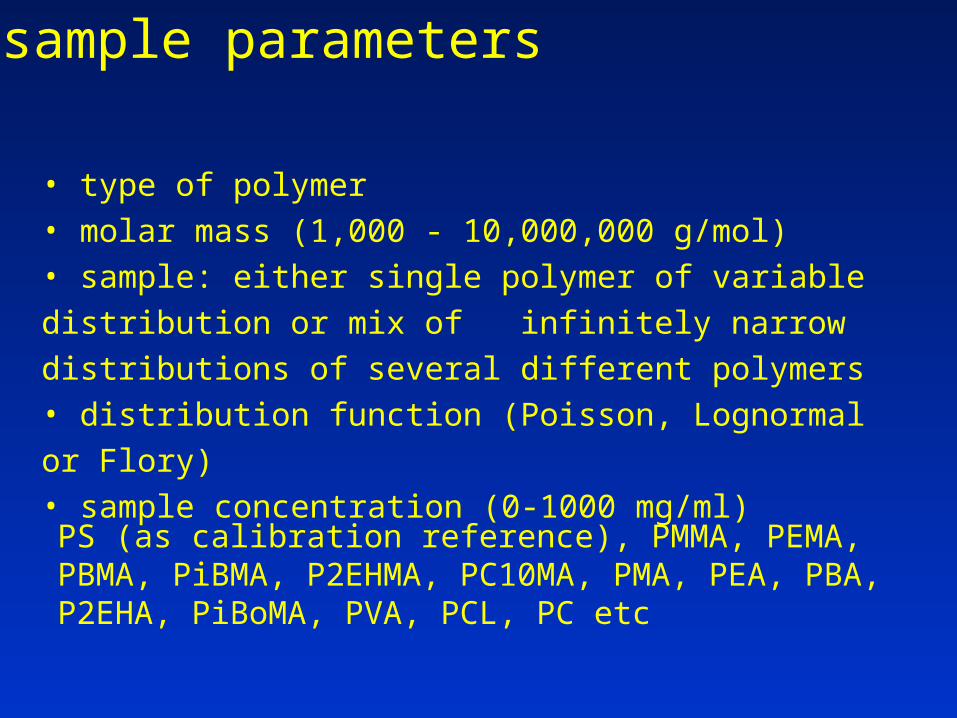
• type of polymer• molar mass (1,000 - 10,000,000 g/mol)• sample: either single polymer of variable distribution or mix of
infinitely narrow distributions of several different polymers• distribution function (Poisson, Lognormal or Flory)• sample concentration (0-1000 mg/ml)
PS (as calibration reference), PMMA, PEMA, PBMA, PiBMA, P2EHMA, PC10MA, PMA, PEA, PBA, P2EHA, PiBoMA, PVA, PCL, PC etc
sample parameters
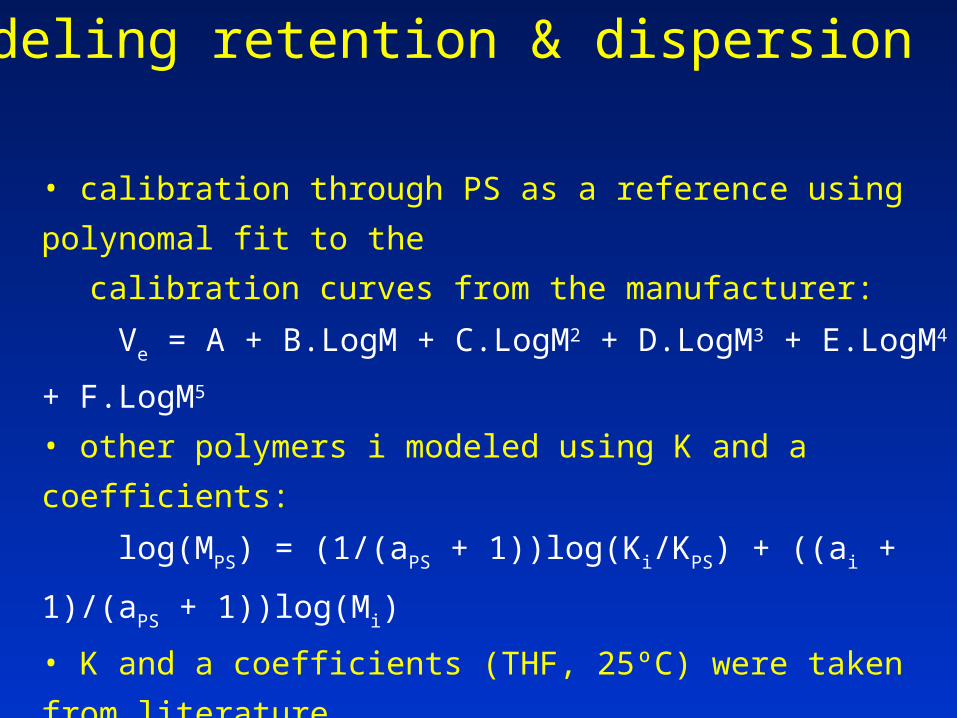
• calibration through PS as a reference using polynomal fit to the
calibration curves from the manufacturer:
Ve = A + B.LogM + C.LogM2 + D.LogM3 + E.LogM4 + F.LogM5
• other polymers i modeled using K and a coefficients:
log(MPS) = (1/(aPS + 1))log(Ki/KPS) + ((ai + 1)/(aPS + 1))log(Mi)
• K and a coefficients (THF, 25ºC) were taken from literature
• detailed modeling of chromatographic peak broadening
• simulation of influence of extra-column broadening (injection,
connections, detection)
modeling retention & dispersion
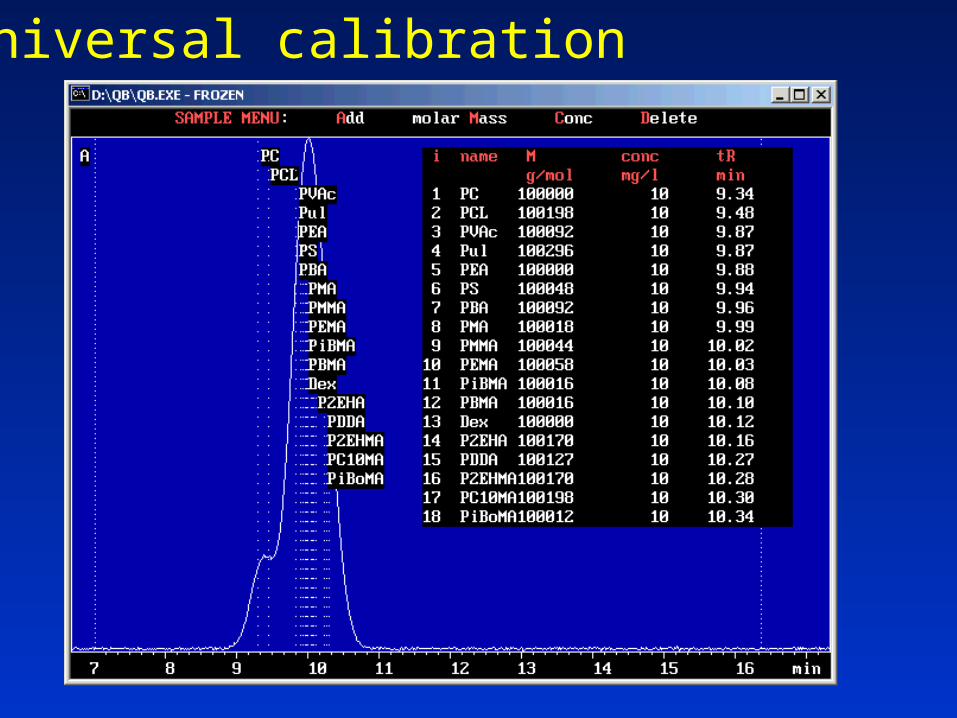
universal calibration

choose column….

choose detector

bandbroadening details
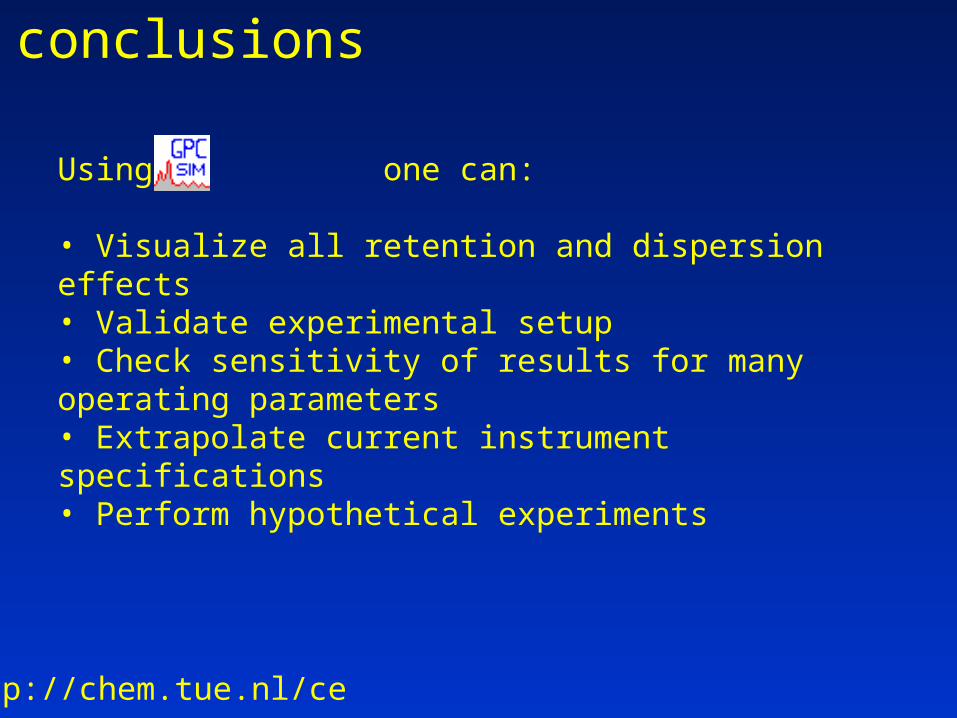
conclusions
Using one can:
• Visualize all retention and dispersion effects• Validate experimental setup• Check sensitivity of results for many operating parameters• Extrapolate current instrument specifications• Perform hypothetical experiments
http://chem.tue.nl/ce
Thank you
Thank you