Simulation of gas dynamics and radiation in volcanic...
16
Simulation of gas dynamics and radiation in volcanic plumes on Io J. Zhang, a, * D.B. Goldstein, a P.L. Varghese, a N.E. Gimelshein, b S.F. Gimelshein, b and D.A. Levin b a The University of Texas at Austin, Austin, TX 78712, USA b Pennsylvania State University, University Park, PA 16802, USA Received 13 May 2002; revised 19 December 2002 Abstract Modeling results of volcanic plumes on Jupiter’s moon Io are presented. Two types of low density axisymmetric SO 2 plume flows are modeled using the direct simulation Monte Carlo (DSMC) method. Thermal radiation from all three vibrational bands and overall rotational lines of SO 2 molecules is modeled. A high resolution computation of the flow in the vicinity of the vent was obtained by multidomain sequential calculation to improve the modeling of the radiation signature. The radiation features are examined both by calculating infrared emission spectra along different lines-of-sight through the plume and with the DSMC modeled emission images of the whole flow field. It is found that most of the radiation originates in the vicinity of the vent, and non-LTE (non-local-thermodynamic equilibrium) cooling by SO 2 rotation lines exceeds cooling in the v 2 vibrational band at high altitude. In addition to the general shape of the plumes, the calculated average SO 2 column density (10 16 cm 2 ) over a Pele-type plume and the related frost-deposition ring structure (at R 500 km from the vent) are in agreement with observations. These comparisons partially validate the modeling. It is suggested that an observation with spatial resolution of less than 30 km is needed to measure the large spatial variation of SO 2 near a Pele-type plume center. It is also found that an influx of 1.1 10 29 SO 2 s 1 (or 1.1 10 4 kg s 1 ) is sufficient to reproduce the observed SO 2 column density at Pele. The simulation results also show some interesting features such as a multiple bounce shock structure around Prometheus-type plumes and the frost depletion by plume-induced erosion on the sunlit side of Io. The model predicts the existence of a canopy shock, a ballistic region inside the Pele-type plume, and the negligible effect of surface heating by plume emission. © 2003 Elsevier Science (USA). All rights reserved. Keywords: Satellites of Jupiter; Io; Atmospheres; Dynamics; Volcanism; Radiative transfer; Surfaces; Satellite 1. Introduction Since its discovery more than 25 years ago, the atmo- sphere of Io remains poorly understood. One of the most startling discoveries of the Voyager flybys of Jupiter was the existence of spectacular umbrella-like plumes over nine points on Io’s surface (Strom and Schneider 1982). Numer- ical studies of Io’s atmosphere began with the work of Ingersoll et al. (1985) who first suggested that the sublima- tion of SO 2 gas from frost on the sunlit face and its con- densation on the night side could produce supersonic winds which decelerate through a standing shock wave. Ingersoll (1989) later investigated the effects of the patchy nature of the SO 2 frost and found that the only appreciable atmo- sphere on the dark side is in the plumes of active volcanoes. Moreno et al. (1991) used computational fluid dynamics modeling of the volcanic plumes to characterize the nature of the near-vent features as well as the spread of the down- falling gas over the planet. Lellouch et al. (1992) examined models of one dimensional atmospheric profiles subject to different assumptions about heating from a plasma bom- bardment of the exosphere. Strobel et al. (1994) developed a radiative-thermal conduction model for the vertical struc- ture of Io’s atmosphere with different heating mechanisms and near-IR (infrared) and non-LTE (non-local-thermody- namic equilibrium) cooling by SO 2 v 1 , v 2 , and v 3 and rota- tional lines. They found that Joule heating is the dominant * Corresponding author. Fax: 1-512-471-3788. E-mail address: [email protected] (J. Zhang). R Available online at www.sciencedirect.com Icarus 163 (2003) 182–197 www.elsevier.com/locate/icarus 0019-1035/03/$ – see front matter © 2003 Elsevier Science (USA). All rights reserved. doi:10.1016/S0019-1035(03)00050-2
Transcript of Simulation of gas dynamics and radiation in volcanic...
Simulation of gas dynamics and radiation in volcanic plumes on Io
J. Zhang,a,* D.B. Goldstein,a P.L. Varghese,a N.E. Gimelshein,b
S.F. Gimelshein,b and D.A. Levinb
a The University of Texas at Austin, Austin, TX 78712, USAb Pennsylvania State University, University Park, PA 16802, USA
Received 13 May 2002; revised 19 December 2002
Abstract
Modeling results of volcanic plumes on Jupiter’s moon Io are presented. Two types of low density axisymmetric SO2 plume flows aremodeled using the direct simulation Monte Carlo (DSMC) method. Thermal radiation from all three vibrational bands and overall rotationallines of SO2 molecules is modeled. A high resolution computation of the flow in the vicinity of the vent was obtained by multidomainsequential calculation to improve the modeling of the radiation signature. The radiation features are examined both by calculating infraredemission spectra along different lines-of-sight through the plume and with the DSMC modeled emission images of the whole flow field. Itis found that most of the radiation originates in the vicinity of the vent, and non-LTE (non-local-thermodynamic equilibrium) cooling bySO2 rotation lines exceeds cooling in thev2 vibrational band at high altitude.
In addition to the general shape of the plumes, the calculated average SO2 column density (�1016 cm�2) over a Pele-type plume andthe related frost-deposition ring structure (atR � 500 km from the vent) are in agreement with observations. These comparisons partiallyvalidate the modeling. It is suggested that an observation with spatial resolution of less than 30 km is needed to measure the large spatialvariation of SO2 near a Pele-type plume center. It is also found that an influx of 1.1� 1029 SO2 s�1 (or 1.1� 104 kg s�1) is sufficientto reproduce the observed SO2 column density at Pele. The simulation results also show some interesting features such as a multiple bounceshock structure around Prometheus-type plumes and the frost depletion by plume-induced erosion on the sunlit side of Io. The modelpredicts the existence of a canopy shock, a ballistic region inside the Pele-type plume, and the negligible effect of surface heating by plumeemission.© 2003 Elsevier Science (USA). All rights reserved.
Keywords: Satellites of Jupiter; Io; Atmospheres; Dynamics; Volcanism; Radiative transfer; Surfaces; Satellite
1. Introduction
Since its discovery more than 25 years ago, the atmo-sphere of Io remains poorly understood. One of the moststartling discoveries of the Voyager flybys of Jupiter wasthe existence of spectacular umbrella-like plumes over ninepoints on Io’s surface (Strom and Schneider 1982). Numer-ical studies of Io’s atmosphere began with the work ofIngersoll et al. (1985) who first suggested that the sublima-tion of SO2 gas from frost on the sunlit face and its con-densation on the night side could produce supersonic windswhich decelerate through a standing shock wave. Ingersoll
(1989) later investigated the effects of the patchy nature ofthe SO2 frost and found that the only appreciable atmo-sphere on the dark side is in the plumes of active volcanoes.Moreno et al. (1991) used computational fluid dynamicsmodeling of the volcanic plumes to characterize the natureof the near-vent features as well as the spread of the down-falling gas over the planet. Lellouch et al. (1992) examinedmodels of one dimensional atmospheric profiles subject todifferent assumptions about heating from a plasma bom-bardment of the exosphere. Strobel et al. (1994) developeda radiative-thermal conduction model for the vertical struc-ture of Io’s atmosphere with different heating mechanismsand near-IR (infrared) and non-LTE (non-local-thermody-namic equilibrium) cooling by SO2 v1, v2, andv3 and rota-tional lines. They found that Joule heating is the dominant
* Corresponding author. Fax:�1-512-471-3788.E-mail address: [email protected] (J. Zhang).
R
Available online at www.sciencedirect.com
Icarus 163 (2003) 182–197 www.elsevier.com/locate/icarus
0019-1035/03/$ – see front matter © 2003 Elsevier Science (USA). All rights reserved.doi:10.1016/S0019-1035(03)00050-2
heating mechanism in the subnanobar regions of Io’s atmo-sphere. The effect of plasma bombardment, UV heating, andIR cooling on a sublimation-driven Ionian atmosphere wasstudied by Wong and Johnson (1995) who later extendedtheir work to a 3-D study of Joule heating and non-LTEcooling effects on Io’s atmosphere (Wong and Johnson,1996). Recently, Wong and Smyth (2000) improved themodel by Wong and Johnson (1996) to examine the effectof the increased plasma heating.
These studies have mostly concentrated on the examina-tion of the sublimation-driven atmospheric flow. However,many observations are associated with volcanic plumes onIo. Geissler et al. (1999) examined the Galileo imaging ofatmospheric emission from Io and tested the association ofblue equatorial glows with specific volcanic plumes. Feld-man et al. (2000) found preferential absorption of reflectedsolar Lyman-� emissions by SO2 at Io’s equator in HubbleSpace Telescope (HST) images. They also showed that theSO2 distribution in the equatorial regions is relativelysmooth on length scales of �200 km or greater. Strobel andWolven (2001) determined that only a few volcanic plumesources near the equator are sufficient to explain the HSTLyman-� observations.
The complexities of modeling volcanic plume atmo-spheres on Io are discussed by Kieffer (1982), who con-cluded that a given volcanic reservoir can produce a widevariety of surface manifestations and the observational con-
straints on Ionian plume characteristics allow a wide varietyof postulated reservoir conditions. There are various ap-proaches to study the dynamics of these volcanic plumes assummarized by Doute et al. (2002). Rarefied gas dynamicsmodeling developed for aerospace engineering applicationsis one of the possible approaches. Some regions of thevolcanic atmosphere resemble nozzle flow and hypersonicjets—typical aerospace engineering applications. The directsimulation Monte Carlo (DSMC) approach pioneered byBird (1994) is a suitable way to model the transitional torarefied flows of these atmospheres and incorporate a widerange of detailed physics. Austin and Goldstein (1995)presented preliminary results for DSMC models of Ionianplumes as early as 1995. They examined the nature of theshocks which develop in the plumes and how the plumesexpand in the presence of a background noncondensible gas.Austin and Goldstein (1998) also presented the first DSMCsimulations of a sublimation–condensation driven cir-cumplanetary flow as well as high spatial resolution mod-eling of a volcanic plume. A simple form of non-LTEinfrared radiation from the SO2 rotational levels was incor-porated. Austin and Goldstein (2000) presented detailedcalculations of sublimation–condensation driven flows in-cluding parametric studies of surface temperatures, theamount of noncondensible background gas, and energy in-put from the bombardment of the upper atmosphere by 57km/s sulfur and oxygen atoms in Jupiter’s corotating plasma
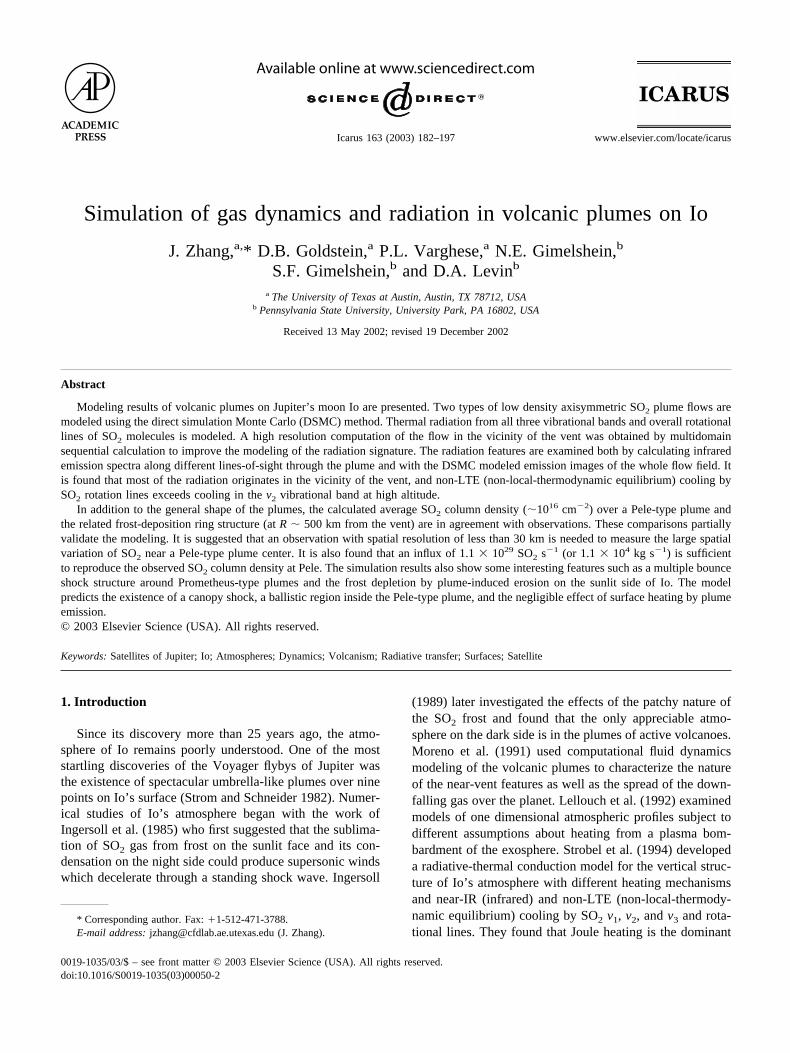
Fig. 1. Schematic diagram of the computational features modeled in the plume flow.
183J. Zhang et al. / Icarus 163 (2003) 182–197

torus (Spencer and Schneider, 1996). The emphasis of thatwork is on the atmospheric structure and the effect ofdifferent parameters on the observable frost deposition. Wehave recently extended the previous work by Austin andGoldstein to detail the gas dynamics, radiation, and trans-port of fine particulates in volcanic plume flows (Zhang etal., 2001, 2003a, 2003b).
The first volcanic plume discovered (Strom and Schnei-der, 1982), Pele, rises more than 300 km above the surface.Such momentum driven plumes are huge compared to thosefound on Earth. One of our goals is to reproduce the heightand the shape of the plumes in the simulations. Anotherremarkable feature associated with most volcanic plumes onIo is the ring deposits. Many Voyager and Galileo pictureshave shown the ring deposition around Pele. As will beshown in the results, the ring features are also reproduced inour simulations.
Most of the observations of planetary atmospheres, andall of those for Io, are via remote sensing of the radiationproduced by, or transmitted through, the gas. Thus, there isreason to develop advanced techniques to model, in anintegrated way, the gas dynamics of hypersonic volcanic jetflow along with the radiated signature that may be observed.
In the present work we concentrate on modeling thehypersonic plume flow of Io’s volcanoes. The unique fea-tures of the problem distinct from related engineering ap-plications are the significance of gravity (which causes theplume to fall back upon itself), the gas species (SO2), thelow collision frequencies (seconds-to-minutes between col-lisions), and the large mean free paths (centimeters to kilo-meters). Below, we first describe some background on thebasic DSMC approach. We then describe innovations in-corporated in our DSMC method, including SO2 vibrationalenergy exchange and radiation. Multi-domain sequentialcalculation is introduced and discussed. Next, modelingresults and the comparison with the observation data arepresented. Finally, we present spectrally resolved images ofthe radiated output integrated along lines of sight through aplume. These calculations were performed with theGENSPECT code (Quine and Drummond, 2002). In gen-
Fig. 2. Schematic diagram of multidomain sequential calculation.
Fig. 3. Temperature (left) and Mach number (right) contours with stream-lines overlapped for night-side Pele-type plume. The black dashed boxindicates the nonequilibrium low density region A.
Fig. 4. Mass deposition rate profiles at several different surface tempera-tures for a Pele-type plume.
Fig. 5. SO2 number density (molecule/m3) contours with streamlines over-layed for night-side Pele-type plume. The black dashed box indicates thenonequilibrium low density region A. Also plotted on the right is thevertical column density profile.
184 J. Zhang et al. / Icarus 163 (2003) 182–197

eral, our work emphasizes the relation between the complexgas dynamics and observable, or potentially observable,phenomena.
2. Numerical method
An important feature of these volcanic plume flows is thewide range of flow regimes present, from a virtually con-tinuum regime near the volcano vent (number density of theorder of 1017 molecule/m3 with a vent diameter-basedKnudsen number1 on the order of 10�4) to the free molec-ular regime at high altitude, with transitional flow in be-tween. The DSMC method (Bird, 1994) is the most suitablechoice to model such flows. In the DSMC approach, theflow is modeled with a large number of simulated particleswhich are moved and collided; the flow properties such astemperature and density are then extracted by sampling andaveraging over all the molecules. The collision model usedin our DSMC method is the variable hard sphere (VHS)model with necessary parameters chosen for SO2 moleculesfrom Bird (1994).
Use of the DSMC method has the advantage that it isrelatively easy to include internal molecular energy modesand a wide variety of physical mechanisms such as chemicalreaction and thermal radiation, without substantially chang-ing the computational algorithm. This advantage will bedemonstrated below. However, computational challengesmay arise too. The time steps required, for instance, some-times change dramatically from process to process. In thepresent work, the computational domain is split into subdo-mains with different time steps and cell sizes. Radial cell-based weights are used in each subdomain for our axisym-metric problems.
2.1. Flow conditions
The flow conditions and DSMC procedure used in thesimulation of the plume flow are shown schematically inFig. 1. The flow is assumed to be axisymmetric and emerg-ing at a uniform velocity from a circular vent centered at theorigin of the symmetry axis. A uniform velocity profile isreasonable at these relatively high Reynolds numbers (�5� 104) if one assumes pipe-like flow out of a relativelystraight subsurface conduit. The gas jet is assumed to bepure SO2 since SO2 has been the most frequently identifiedmolecular species in Io’s atmosphere and is thought to bethe primary atmospheric component and the driving gas formost of the volcanic plumes (Ballester et al., 1994; Lel-louch, 1996; Pearl et al., 1979). The gas is subject to Io’sgravitational field after it erupts from the vent so the free-flying molecules follow parabolic trajectories. The mole-
cules escape into space if they cross the upper boundary ofthe computational domain (rare) and are reflected by theouter specular wall when they collide with the circumfer-ential boundary. The assumption of a specular wall at theouter boundary is not accurate. However, we have shownthat when the outer wall is placed at a sufficient distancefrom the vent it has no effect on the flow in the regions ofinterest. The surface of Io is assumed to be very rough andhave a sticking coefficient of � � 1 so the moleculescondense as they contact the surface. On the other hand, thesurface sublimates vapor and the sublimation rate is speci-fied by the equilibrium vapor pressure at the surface tem-perature (Austin and Goldstein, 1995). Note that althoughother combinations of sticking coefficient and sublimationoutflux are possible, our treatment of the sublimation–con-densation model is greatly simplified by assuming a stickingcoefficient of 1 regardless of surface temperature. This as-sumption is quite realistic at surface temperature of less than110 K (Sandford and Allamandola, 1993). Moreover, itproduces the correct equilibrium vapor pressure and a suit-able gas outflux from the ice into a near-vacuum when theoutflux should be independent of the influx. It is understoodthat in reality � depends on internal and translational energyof the incident molecule, impact angle, surface temperature,and surface structure. Similarly, the distribution of subli-mated molecules may depend on the incident stream as wellas surface details. However, detailed knowledge of thesedependences is lacking, and hence we would have to makeassumptions about these variations if they were to be in-cluded in the model. Moreover, engineering simulations inother contexts have shown that details of this nature gener-ally do not alter the mean flow appreciably.
In the next sections we present the modeling of internalenergy exchange and radiation in the gas. Then, three plumemodels are presented with either different vent conditions ordifferent surface conditions.
2.2. Internal energy exchange and radiation modeling
The modeling of IR radiation requires knowledge of thespatial distribution of the vibrational and rotational popula-tions of SO2. Translational–internal energy transfer as wellas spontaneous emission processes must be modeled. Dur-ing the gas dynamic computations, it is assumed that thedensities are sufficiently low that the effects of reabsorptionof plume emission on the vibrational and rotational popu-lation may be ignored. This assumption is confirmed for thethree vibrational bands by the absorption calculation withGENSPECT in Section 3.3. The results there show that atleast one order of magnitude higher gas density is neededbefore the effects of reabsorption of vibrational bands emis-sion need to be considered. However, this optically thinassumption for rotational lines is rather crude in the vicinityof the vent since Lellouch et al. (1992) observed rotationalline saturation at 222 GHz and inferred line opacity on theorder of �1–10 for several nanobar SO2 pressure in the
1 Kn � �/d, where � � a gas molecule mean free path and d � thecharacteristic linear dimension.
185J. Zhang et al. / Icarus 163 (2003) 182–197

temperature range 200–800 K. Our vent pressure is 45nanobar. Also notice that we currently do not consider theradiative heating of the gas by surrounding hot lava.
The modeling of rotation–translation (RT) energy trans-fer during collisions between SO2 molecules is performedusing the Larsen–Borgnakke method, and a discrete versionof the method is used for vibration–translation (VT) energytransfer (Larsen and Borgnakke, 1974; Bergemann andBoyd, 1994). The Larsen–Borgnakke method is a phenom-enological method and the most frequently used approach tothe modeling of internal energy transfer. In this methodpostcollision internal energies are assumed to be distributedaccording to the local equilibrium distribution functions. Itcan also be shown (Bird, 1994) that it is not necessary forthe total collision energy to include the energy of all modesthat are to be subject to redistribution in the collision in theLarsen–Borgnakke method. A succession of redistributions,each of which involves only a single internal mode and thetranslational mode, can be used. Since SO2 molecules havethree vibrational modes, advantage has been taken of thisserial consideration of each mode in our DSMC model. Thereason for treating the vibrational energy in a quantumfashion is that the vibrational levels are widely spaced, and
at the relatively low temperatures of present interest thevibrational modes can not be regarded as being fully ex-cited.
Special effort has been placed on modeling the uniqueVT relaxation process of SO2 molecules. Those relaxationprocesses are discussed extensively in (Bass et al., 1971;Lambert, 1977; Lambert and Salter, 1957). Experimentalultrasonic dispersion data in gaseous sulfur dioxide (Lam-bert and Salter, 1957) show a double relaxation process.One process corresponds to the combination of the v1 (1151cm�1) and v3 (1361 cm�1) vibrational modes, hereinaftercalled process one, and the other (process two) correspondsto the lowest mode v2 (for the band centered at 518 cm�1).We assume that energy flows into both the v1 and the v3
modes via the v1 mode. It has been suggested (Bass et al.,1971) that the collision relaxation number for process one,Z1,3, follows the Landau–Teller temperature dependence ofcollision number, which predicts log(Z) � T�1/3 for gastemperature T. We assume a constant value Z1,3 � 1000 forthe VT relaxation of the v1 and v3 modes: this assumption israther crude at the moment and is expected to be improvedin the future. In contrast, Z2 does not follow the Landau–Teller temperature dependence but reaches a maximumaround T � 350 K due to preferential orientation require-
Fig. 6. Schematic diagram of flows in the boxed nonequilibrium region A.
Fig. 7. Velocity distribution profile in a 10 km � 10 km region centered at(R,Z) � (350 km, 100 km). The large peak corresponds to the velocitydistribution of the falling molecules in Fig. 6, while the smaller peakrepresents those radially expanding molecules in that figure.
Fig. 8. Contours of photon emission rate (photons/m3/s) of �1 (1151 cm�1),�2 (518 cm�1), and �3 (1362 cm�1) (from left to right) vibrational states ofSO2 near the plume core for night-side Pele-type plume.
Fig. 9. Contours of photon emission rate (photons/m3/s) for �2 (518 cm�1)vibrational state of SO2 for night-side Pele-type plume.
186 J. Zhang et al. / Icarus 163 (2003) 182–197

ments in low-temperature collisions. In the temperaturerange of interest (100–650 K), the experimental data (Basset al., 1971) for Z2 cluster around Z2 � 300, and we use thisconstant value in the simulations. This simple assumption isjustified because the uncertainty in the experimental relax-ation data for process two (Z2) does not warrant a compli-cated curve fit and the variation of Z2 over this temperaturerange is small.
There is also non-LTE cooling by spontaneous emissionfrom these three vibrational bands of SO2. Thermal radia-tion occurs as a result of radiative transitions between theinternal energy levels of molecules, and the probability fora molecule to undergo a spontaneous emission is specifiedby the Einstein coefficient, Anm, for the transition n 3 m.These coefficients have been found for the 13 0 transitionof the v1, v2, and v3 bands to be 3.5, 0.88, and 44 s�1,respectively (Radzig and Smirnov, 1980). As discussedabove, we assume that the densities of the gas are suffi-ciently low that the effects of reabsorption of emitted pho-tons on the vibrational populations may be ignored.
For spontaneous IR cooling from the rotational levels ofSO2, we retain the approach of Austin and Goldstein (1998)in which the cooling is based on a simplified model ofLellouch et al. (1992), which assumes an optically thin gas,and the cooling rate R per molecule is given by R� 4��jBvjSj as an a priori function of temperature, whereBv is the Planck function and Sj is the line strength of the jthrotational line. We then remove the energy from each mol-ecule’s continuous rotational energy according to this cal-culated radiative cooling rate.
The SO2 vibrational spectra were computed from theflowfields calculated by DSMC as follows. First, numberdensity and vibrational and translational temperatures wereextracted along the axis of the plume. The data were alsoextracted along the 45° line that starts at the center of thevent. Then, those one-dimensional data were processed us-ing the GENSPECT code (Quine and Drummond, 2002).This code is a line-by-line radiative transfer code to calcu-
late gas absorption and emissivity, emission, and transmis-sion for a wide range of atmospheric gases from the nearUV to the far IR. Given information including gas types, gasamounts, temperature, pressure, path length, and frequencyrange for an atmosphere or laboratory cell, the GENSPECTcode computes the spectral characteristics of the gas.GENSPECT employs a new computation algorithm thatmaintains a specified accuracy for the calculation as a wholeby precomputing where a line function may be interpolatedwithout a reduction in accuracy. The approach employs abinary division of the spectral range, and calculations areperformed on a cascaded series of wavelength grids, eachwith approximately twice the spectral resolution of the pre-vious one.
Line-by-line calculations were performed in this workusing the Voigt profile, which is the convolution of theLorentz and Doppler profiles. The relative weighting of theconvolution is controlled by collision widths of spectrallines, gas pressure, and temperature (Quine and Drummond,2002). Near the vent collision broadening is more signifi-cant, while the line profiles are very close to Doppler at lowpressures.
2.3. Multi-domain sequential calculation
As pointed out above, numerical challenges arise whentrying to include various mechanisms such as non-LTEthermal radiation into the DSMC calculations. For instance,the lifetime of the excited v3 vibrational state of SO2 mol-ecules is about 23 ms, so the time step in the calculation ofthe radiation from this band should be smaller than 23 ms.This time step, however, is too small for efficient calcula-tion of v2 radiation, which has a lifetime of about 1 s. On theother hand, as pointed out earlier, the plume flow experi-ences a wide range of flow regimes from near-continuum tofree molecular. In the near-continuum regime, we need veryfine spatial and temporal resolution, while in the transitionaland free molecular regimes we do not.
These challenges are common in DSMC and varioussolutions have been proposed to overcome them (Roveda etal., 1997; Gimelshein et al., 2001). A multidomain sequen-
Fig. 10. Contours of emission (W/m3) from overall rotational lines of SO2
for night-side Pele-type plume.
Fig. 11. Close in look at the temperature contours (left) and number density(molecule/m3) contours (right). The white dashed lines show the interfacesbetween regions of different resolutions.
187J. Zhang et al. / Icarus 163 (2003) 182–197

tial calculation is used in our simulation. This approach isapplicable because the flow is supersonic near the vent so itis not affected by downstream conditions. The whole do-main is split into multiple subdomains and sequential cal-culations are performed from the inner to the outer domains.The majority of radiation events in the v1 and v3 bands aretherefore captured with both very fine spatial and temporalresolution, and those in the v2 band with relatively coarserresolution. After most of the radiation features are capturedat the core of the plume, an even coarser resolution issufficient to calculate the downstream flow field. Fig. 2shows a schematic diagram of this flow-field decomposi-tion. The calculation parameters (domain size, grids, andtime step dt) and the key observables that drive their choicein each region are also shown in Fig. 2. The flow field is firstobtained for tiny innermost region 1 with very fine spatialand temporal resolution to capture the signature of v3 bandradiation. Molecules that cross the upper and right bound-aries after steady state has been reached are stored as asource of input molecules for the calculation of region 2.During the calculation of region 2, molecules are read in togive the correct number flux. The process of storing andrereading molecules between concentric regions is carriedon until the whole flow field has been obtained. In our case,four steps are necessary.
The calculations were checked for grid and time stepconvergence. The sizes and grid structures of each domainshown in Fig. 2 are for the simulation of a nightside Pele-type plume discussed in the following section. These pa-rameters vary and are chosen appropriately for differentplumes, but the storing and rereading procedures for mole-cules are the same for all simulations. Other computationaldetails appear in our earlier conference paper (Zhang et al.,2001).
An additional advantage of this sequential calculation isthe good quality of the solution obtained near the ventwhere the Knudsen numbers are very low, while obviatingthe expense of carrying the very fine resolution through thewhole domain.
3. Results
3.1. Night-side Pele-type plume
A simulation of a night-side Pele-type volcanic plume onIo is discussed first because the resulting gas dynamics issimplest. We have chosen a uniform vent velocity of 1000m/s for Pele estimated by Strom and Schneider (1982).Several vent temperatures were tried and 650 K was chosensince it gives results that are a best fit to the general shapeand deposition pattern of the plume observed by Voyager 1.Even though recent measurements suggest that the rocktemperature near a vent could be higher than 650 K, the venttemperature used in the simulations represents the temper-ature of the gas as it leaves a slightly expanding rough-
walled conduit. The details of the radiation-absorbing gasdynamics problems are ignored and it is assumed that thegas has accelerated to roughly Mach 3 while remainingwarm through radiative heat transfer from the hot conduitwall (Zhang et al., 2003b). The source number density (5.0� 1017 m�3, or pressure of 45 nanobar) was defined by thelower limit of the gas source rate (�1029 SO2 s�1) estimatedby Moreno et al. (1991). The night-side surface temperaturewas selected to be 90 K in agreement with observation(Johnson and Matson, 1989). This value is also in theobserved night-side surface temperature range recently re-ported by Rathbun et al. (2002), who suggested a maximumof 95 K at equator. Also, following Moreno et al. (1991), thevent has been assumed to be circular, with diameter of 16.76km. This relatively outdated value seems to be unreasonablylarge and thus questionable. The effect of vent size will bediscussed in Section 4 and further investigated in the future.
Io’s night-side surface temperature of 90 K is very low,and nearly all the gas that falls to the surface will condense;the sublimation atmosphere under such conditions is negli-gible. Fig. 3 shows the calculated Mach number and trans-lational temperature contours with streamlines overlayed. Itcan be seen that as the gas erupts from the vent at aroundMach 3, it expands and cools. A canopy-shaped shock isformed at a height of about 300 km. An interesting aspect ofthis canopy shock is that it is formed as a result of thepresence of the gravity field rather than an atmosphereback-pressure or a deflection introduced by a solid surfaceas in most engineering applications. It is also seen that oncethe gas expands to high above or far away from the vent(roughly at Z � 100 km or R � 60 km), it becomes almostcollisionless and freezes at �50 K until it reaches the shock.This frozen temperature region is where one could use asimple ballistic model to represent the flow. After beingcompressed and heated while crossing the shock, the flowturns outward and expands and cools again as it acceleratesdownward. The gas finally falls to the cold ground andcondenses to form a ring of frost. The corresponding massdeposition rate profile along the surface is shown in Fig. 4.It is seen that most of the frost deposit is concentrated in arange from 400 to 600 km. The resurfacing rate is found tobe 0.06 cm/year at the maximum deposition rate assuminga frost density of 1.5 g/cm3.
Fig. 5 shows the SO2 number density contours of theflowfield. The vertical column density profile is also plottedin the figure and the average column density over the plumeout to R � 700 km is calculated to be �1.1 � 1016 cm�2.Both the column density near the plume center (�1018
cm�2) and the average column density over the plume are ofthe same order of magnitude as those obtained by Lellouch(1996). The average column density is about three timeslower than that for Pele obtained by McGrath et al. (2000),but close to that obtained by Strobel and Wolven (2001) forthe entire surface of Io, based on the analysis of Feldman etal. (2000).
There is a region indicated by a dashed rectangle (called
188 J. Zhang et al. / Icarus 163 (2003) 182–197
region A) in both Figs. 3 and 5 around (R, Z) � (350 km,100 km) where the number density of the flow field is verylow but the temperature seems to be unreasonably high(�1000 K); the temperature at the vent is only 650 K. Sincethe number densities in the boxed region A are very low, thegas is a nearly collisionless mixture of molecules that haveexpanded radially outward and those that are falling back tothe surface under the influence of gravity (Fig. 6). Gravityalso turns the radially expanding molecules toward the sur-face and the mean flow streamlines turn toward the surfacearound R � 300 km. In boxed area A, the velocity distri-bution is bimodal with two “cold” spikes of very differentradial and vertical velocities. The two modes in the velocitydistribution of the molecules at a point near (R,Z) � (350km, 100 km) can be clearly seen in Fig. 7. One set of themolecules have velocities concentrated around (Vr, Vz) �(280 m/s, �700 m/s) and the other set are around (Vr, Vz)� (1100 m/s, �50 m/s). Representing this bimodal distri-bution by a single kinetic temperature based on the meanvelocity results in the high temperature.
The contours of photon emission rate are shown in Figs.8 and 9. Fig. 8 shows rate contours in the v1 (1151 cm�1),v2 (518 cm�1), and v3 (1362 cm�1) bands of SO2 near theplume core. Fig. 9 shows the contours of photon emissionrate for the v2 (518 cm�1) band for the whole flow field. Itis seen that most v1 and v3 band emissions come from a tinyregion around the core of the plume and the gas rapidlyloses its vibrational energy by emission in the v1 and v3
bands but relatively more slowly in the v2 band. The vibra-tional energy of the gas is not strongly replenished fromtranslational energy through intermolecular collisions, sincethe collision excitation rate is low. Taking the v3 band forexample, the radiative lifetime of the v3 vibrational state is�23 ms but the collision relaxation time at the vent for v3
vibrational–translational energy transfer is �10 s. The gas isthus in a highly nonequilibrium state and the vibrationaltemperatures for the three vibrational modes become verylow by an altitude of �50, �35, and �30 km, for v2, v1, andv3 bands, respectively.
When the flow reaches the canopy shock, it is againcompressed and heated. The intermolecular collisions be-come sufficiently frequent and of sufficient relative velocitythat the v2 mode is reexcited and emission from the v2 bandreappears at the shock. However, emission in the other twobands does not reappear principally because of the lowervibrational excitation rates (larger collision numbers Zv) forthe v1 and v3 bands (see Section 2.2). No emission appearsin the nonequilibrium region A discussed above because thetwo components of the flow have a low level of internalexcitation and there are not enough intermolecular colli-sions to cause vibrational excitation.
Fig. 10 shows that the emission pattern of overall rota-tional lines is different from the emission from vibrationalbands: the gas does not lose its rotational energy as quicklyas it does its vibrational energy. Rotational energy is re-plenished relatively rapidly by collisions since the rotational
collision number (Zr � 5) is much smaller than the vibra-tional collision numbers. The overall emission from rota-tional lines increases at the canopy shock for the samereasons as discussed above for vibrational bands.
Based on these results we can now examine the effect ofplume core and canopy radiation on the ground surroundingthe vent. That is, we can ask whether the plume radiationfrom vibration and rotation bands is sufficient to apprecia-bly heat the underlying surface. By ray-tracing integrationfrom each pixel in the plume to the surface, it is found thatthe rate at which energy is received by the surface of Io is�0.01 W/m2 at a distance of a few tens of kilometers fromthe edge of the vent. The rate is higher (�1 W/m2) closer tothe hot column of gas directly over the vent. Hence, theresults suggest that the additional heating of the surface byplume emissions is not important at tens of kilometers awayfrom the edge of the vent.
A close-up look at temperature and number density con-tours in Fig. 11 also shows that the decrease of translationaltemperature immediately above the vent is caused to a largeextent by vibrational band emission rather than by gasexpansion. It is seen that, at the core of the plume, thenumber density does not change much to an altitude ofabout 20 km, where the expansion wave from the edge ofthe vent reaches the axis, but the translational temperaturedrops appreciably. The streamlines and the interfaces be-tween subdomains are also plotted in the figure. The prop-erties are satisfactorily smooth across the computationalinterfaces.
3.2. Day-side Pele-type plume: the impact of asublimation atmosphere on the plume
A day-side Pele-type plume is considered next. The ventconditions are the same as those for the night-side plume.The surrounding surface temperature was set to 115 K,which is in the range of the day-side Io surface temperature(�110–130 K). There will be appreciable sublimation fromthe surface of Io at this temperature and the atmosphere2
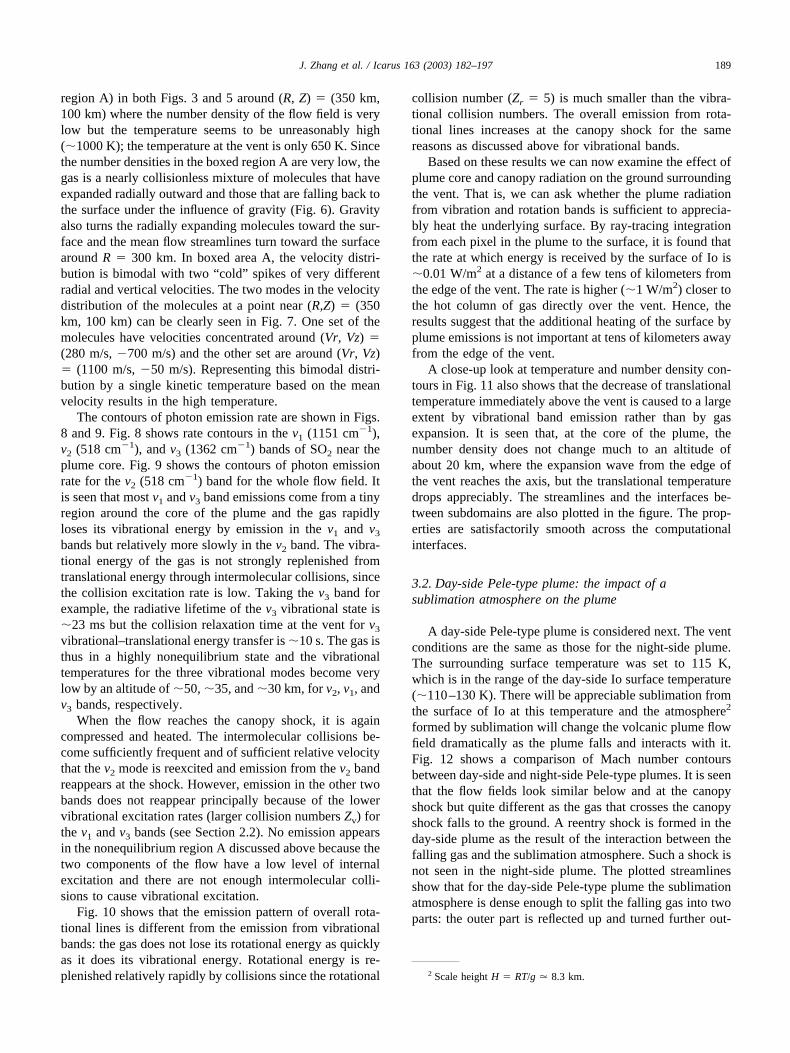
formed by sublimation will change the volcanic plume flowfield dramatically as the plume falls and interacts with it.Fig. 12 shows a comparison of Mach number contoursbetween day-side and night-side Pele-type plumes. It is seenthat the flow fields look similar below and at the canopyshock but quite different as the gas that crosses the canopyshock falls to the ground. A reentry shock is formed in theday-side plume as the result of the interaction between thefalling gas and the sublimation atmosphere. Such a shock isnot seen in the night-side plume. The plotted streamlinesshow that for the day-side Pele-type plume the sublimationatmosphere is dense enough to split the falling gas into twoparts: the outer part is reflected up and turned further out-
2 Scale height H � RT/g � 8.3 km.
189J. Zhang et al. / Icarus 163 (2003) 182–197
ward while the inner part is turned inward toward thesymmetry axis.
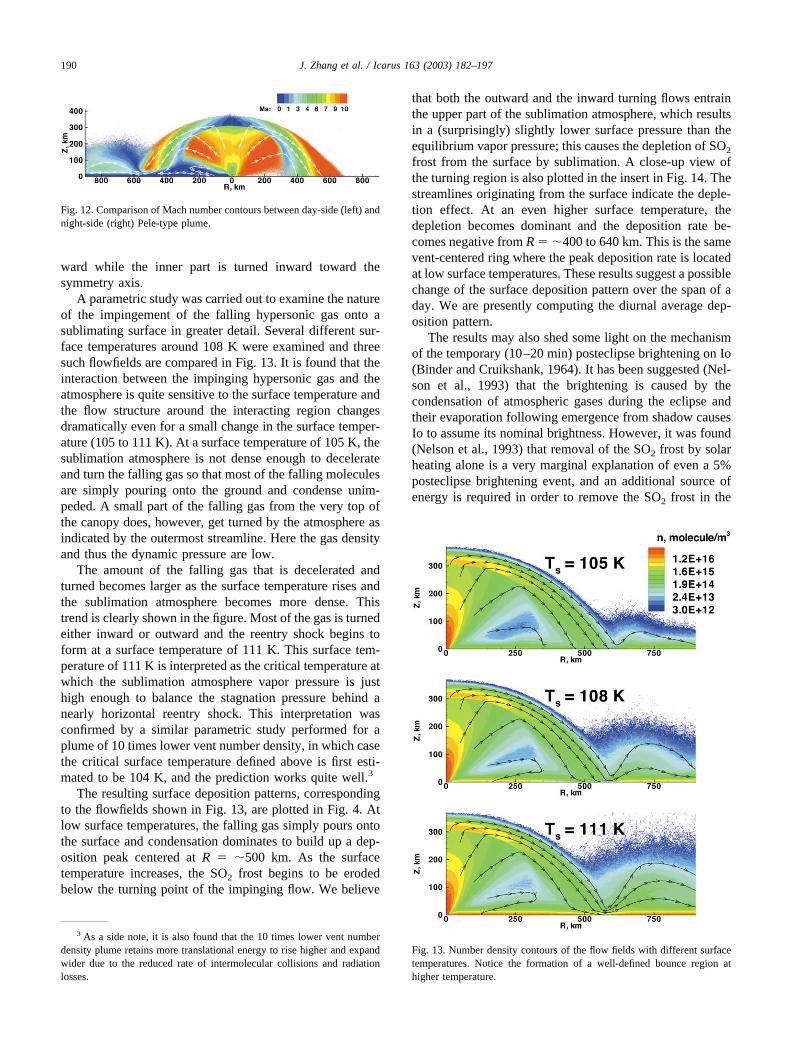
A parametric study was carried out to examine the natureof the impingement of the falling hypersonic gas onto asublimating surface in greater detail. Several different sur-face temperatures around 108 K were examined and threesuch flowfields are compared in Fig. 13. It is found that theinteraction between the impinging hypersonic gas and theatmosphere is quite sensitive to the surface temperature andthe flow structure around the interacting region changesdramatically even for a small change in the surface temper-ature (105 to 111 K). At a surface temperature of 105 K, thesublimation atmosphere is not dense enough to decelerateand turn the falling gas so that most of the falling moleculesare simply pouring onto the ground and condense unim-peded. A small part of the falling gas from the very top ofthe canopy does, however, get turned by the atmosphere asindicated by the outermost streamline. Here the gas densityand thus the dynamic pressure are low.
The amount of the falling gas that is decelerated andturned becomes larger as the surface temperature rises andthe sublimation atmosphere becomes more dense. Thistrend is clearly shown in the figure. Most of the gas is turnedeither inward or outward and the reentry shock begins toform at a surface temperature of 111 K. This surface tem-perature of 111 K is interpreted as the critical temperature atwhich the sublimation atmosphere vapor pressure is justhigh enough to balance the stagnation pressure behind anearly horizontal reentry shock. This interpretation wasconfirmed by a similar parametric study performed for aplume of 10 times lower vent number density, in which casethe critical surface temperature defined above is first esti-mated to be 104 K, and the prediction works quite well.3
The resulting surface deposition patterns, correspondingto the flowfields shown in Fig. 13, are plotted in Fig. 4. Atlow surface temperatures, the falling gas simply pours ontothe surface and condensation dominates to build up a dep-osition peak centered at R � �500 km. As the surfacetemperature increases, the SO2 frost begins to be erodedbelow the turning point of the impinging flow. We believe
that both the outward and the inward turning flows entrainthe upper part of the sublimation atmosphere, which resultsin a (surprisingly) slightly lower surface pressure than theequilibrium vapor pressure; this causes the depletion of SO2
frost from the surface by sublimation. A close-up view ofthe turning region is also plotted in the insert in Fig. 14. Thestreamlines originating from the surface indicate the deple-tion effect. At an even higher surface temperature, thedepletion becomes dominant and the deposition rate be-comes negative from R � �400 to 640 km. This is the samevent-centered ring where the peak deposition rate is locatedat low surface temperatures. These results suggest a possiblechange of the surface deposition pattern over the span of aday. We are presently computing the diurnal average dep-osition pattern.
The results may also shed some light on the mechanismof the temporary (10–20 min) posteclipse brightening on Io(Binder and Cruikshank, 1964). It has been suggested (Nel-son et al., 1993) that the brightening is caused by thecondensation of atmospheric gases during the eclipse andtheir evaporation following emergence from shadow causesIo to assume its nominal brightness. However, it was found(Nelson et al., 1993) that removal of the SO2 frost by solarheating alone is a very marginal explanation of even a 5%posteclipse brightening event, and an additional source ofenergy is required in order to remove the SO2 frost in the
3 As a side note, it is also found that the 10 times lower vent numberdensity plume retains more translational energy to rise higher and expandwider due to the reduced rate of intermolecular collisions and radiationlosses.
Fig. 12. Comparison of Mach number contours between day-side (left) andnight-side (right) Pele-type plume.
Fig. 13. Number density contours of the flow fields with different surfacetemperatures. Notice the formation of a well-defined bounce region athigher temperature.
190 J. Zhang et al. / Icarus 163 (2003) 182–197
requisite amount of time. Our results above indicate that avolcanic plume does indeed have the ability to remove localregions of the SO2 frost. As discussed above, the falling gasworks as a “pump” and keeps blowing away the sublimationatmosphere established by solar heating. This pump main-tains a locally lower surface pressure than the equilibriumvapor pressure. One could also see that the rate of frostremoval for our simulated Pele-type volcanic plume is, infact, much larger than that for solar heating under certainconditions. For example, the rate of frost removal in the ringabout our plume with surface temperature �110 K is aboutan order of magnitude larger than that near the subsolarregion over a sheet of frost at a subsolar temperature of�110 K (Austin and Goldstein, 2000). It has been suggested(Fanale et al., 1981; Nash et al., 1980) that the posteclipsebrightening effect occurs only during periods of intensevolcanic activity. So we suggest that, instead of being anadditional source of energy only, local erosion by volcanicplumes may be a significant cause of the frost removalduring the posteclipse period.
The contours of photon emission rate for a day-sidePele-type plume are very similar to those of a night-sideplume, especially around the plume core and the canopyshock, and thus are not presented in detail. However, an-other relatively bright spot is seen below the reentry shockin emission rate contours. This feature is illustrated in Fig.15, which shows the emission contours from overall rota-tional lines. As at the canopy shock, the temperature andnumber density are both high at the reentry shock andintermolecular collisions become so frequent that rotationaland vibrational temperatures of the gas increase again so thegas reemits.
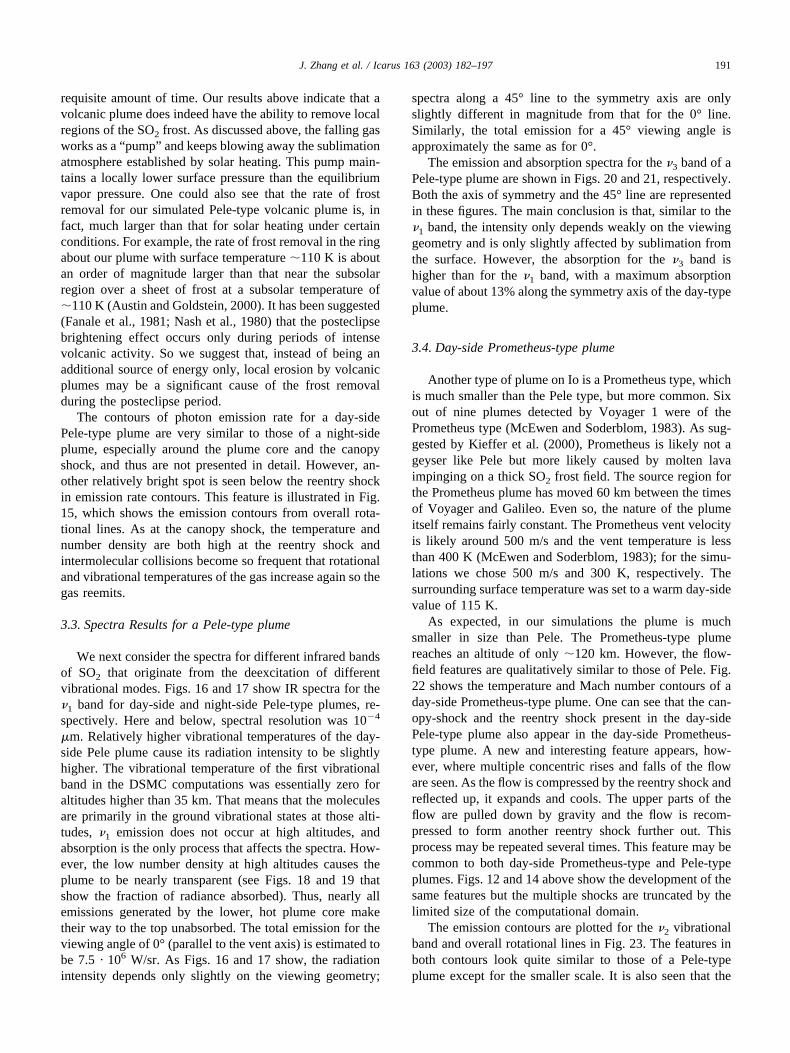
3.3. Spectra Results for a Pele-type plume
We next consider the spectra for different infrared bandsof SO2 that originate from the deexcitation of differentvibrational modes. Figs. 16 and 17 show IR spectra for the�1 band for day-side and night-side Pele-type plumes, re-spectively. Here and below, spectral resolution was 10�4
�m. Relatively higher vibrational temperatures of the day-side Pele plume cause its radiation intensity to be slightlyhigher. The vibrational temperature of the first vibrationalband in the DSMC computations was essentially zero foraltitudes higher than 35 km. That means that the moleculesare primarily in the ground vibrational states at those alti-tudes, �1 emission does not occur at high altitudes, andabsorption is the only process that affects the spectra. How-ever, the low number density at high altitudes causes theplume to be nearly transparent (see Figs. 18 and 19 thatshow the fraction of radiance absorbed). Thus, nearly allemissions generated by the lower, hot plume core maketheir way to the top unabsorbed. The total emission for theviewing angle of 0° (parallel to the vent axis) is estimated tobe 7.5 · 106 W/sr. As Figs. 16 and 17 show, the radiationintensity depends only slightly on the viewing geometry;
spectra along a 45° line to the symmetry axis are onlyslightly different in magnitude from that for the 0° line.Similarly, the total emission for a 45° viewing angle isapproximately the same as for 0°.
The emission and absorption spectra for the �3 band of aPele-type plume are shown in Figs. 20 and 21, respectively.Both the axis of symmetry and the 45° line are representedin these figures. The main conclusion is that, similar to the�1 band, the intensity only depends weakly on the viewinggeometry and is only slightly affected by sublimation fromthe surface. However, the absorption for the �3 band ishigher than for the �1 band, with a maximum absorptionvalue of about 13% along the symmetry axis of the day-typeplume.
3.4. Day-side Prometheus-type plume
Another type of plume on Io is a Prometheus type, whichis much smaller than the Pele type, but more common. Sixout of nine plumes detected by Voyager 1 were of thePrometheus type (McEwen and Soderblom, 1983). As sug-gested by Kieffer et al. (2000), Prometheus is likely not ageyser like Pele but more likely caused by molten lavaimpinging on a thick SO2 frost field. The source region forthe Prometheus plume has moved 60 km between the timesof Voyager and Galileo. Even so, the nature of the plumeitself remains fairly constant. The Prometheus vent velocityis likely around 500 m/s and the vent temperature is lessthan 400 K (McEwen and Soderblom, 1983); for the simu-lations we chose 500 m/s and 300 K, respectively. Thesurrounding surface temperature was set to a warm day-sidevalue of 115 K.
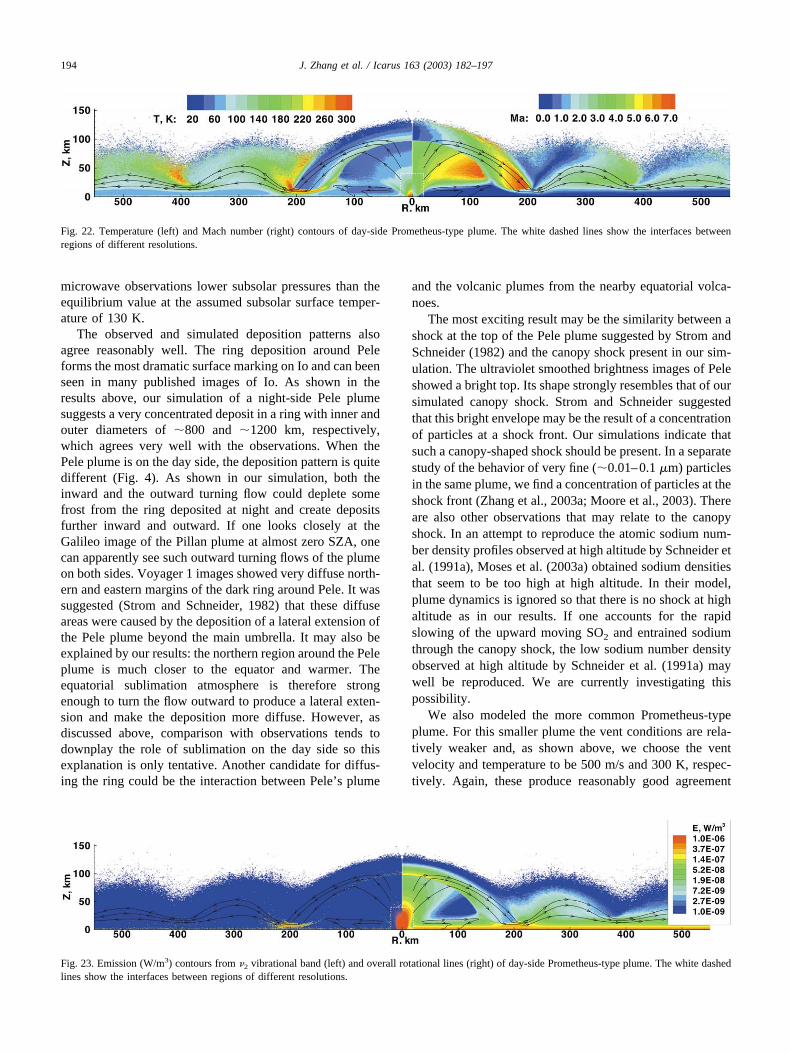
As expected, in our simulations the plume is muchsmaller in size than Pele. The Prometheus-type plumereaches an altitude of only �120 km. However, the flow-field features are qualitatively similar to those of Pele. Fig.22 shows the temperature and Mach number contours of aday-side Prometheus-type plume. One can see that the can-opy-shock and the reentry shock present in the day-sidePele-type plume also appear in the day-side Prometheus-type plume. A new and interesting feature appears, how-ever, where multiple concentric rises and falls of the floware seen. As the flow is compressed by the reentry shock andreflected up, it expands and cools. The upper parts of theflow are pulled down by gravity and the flow is recom-pressed to form another reentry shock further out. Thisprocess may be repeated several times. This feature may becommon to both day-side Prometheus-type and Pele-typeplumes. Figs. 12 and 14 above show the development of thesame features but the multiple shocks are truncated by thelimited size of the computational domain.
The emission contours are plotted for the �2 vibrationalband and overall rotational lines in Fig. 23. The features inboth contours look quite similar to those of a Pele-typeplume except for the smaller scale. It is also seen that the
191J. Zhang et al. / Icarus 163 (2003) 182–197

multiple rises and falls of the flow discussed above arevisible in the overall emission from the rotational lines.
3.5. Further comparisons with observation data
Pele is a plume of a very large size that can even beobserved from the Earth, so it has been observed exten-sively. Voyager 1 measured the canopy height of Pele at�300 km, and the measured deposition ring diameter isabout 1200 km. With the vent parameters chosen, we obtainreasonably good agreement with the Voyager observationsof Pele both in the height and the diameter of the plume.
Both the column density near the plume center and theaverage column density over a night-side Pele-type plumeare of the same order of magnitude (�1018 and �1016
cm�2, respectively) as those obtained by Lellouch (1996)from SO2 microwave observations. The column densitydrops from its peak value at the plume center to one orderof magnitude lower within �30 km, so observation resolu-tion has to be smaller than 30 km to measure the large
spatial SO2 variation around plume center. The agreementin column density also justifies our chosen influx (1.1 �1029 SO2 s�1 or 1.1 � 104 kg s�1) at the vent becausegas-dynamic similarity exists, which means that the numberdensity contours are expected to simply be scaled up byroughly two orders of magnitude if we use a two orders ofmagnitude higher influx (�106 kg s�1) as Moreno et al.(1991) did. That is, our plumes are already sufficientlydense such that rarefaction effects would little alter thecentral density contours. Therefore, if we ignore radiativecoupling to the gas-dynamics in the plume core when the
Fig. 14. Pressure contours of day-side Pele: whole flow field (below) andturning region (inset).
Fig. 15. Contours of emission (W/m3) from overall rotational lines forday-side Pele-type plume.
Fig. 16. Spectral radiance of �1 SO2 band of day-side Pele-type plume fordifferent lines of sight.
Fig. 17. Spectral radiance of �1 SO2 band of night-side Pele-type plume fordifferent lines of sight.
192 J. Zhang et al. / Icarus 163 (2003) 182–197

gas density increases, the column density profile will prob-ably also be scaled up by two orders of magnitude.
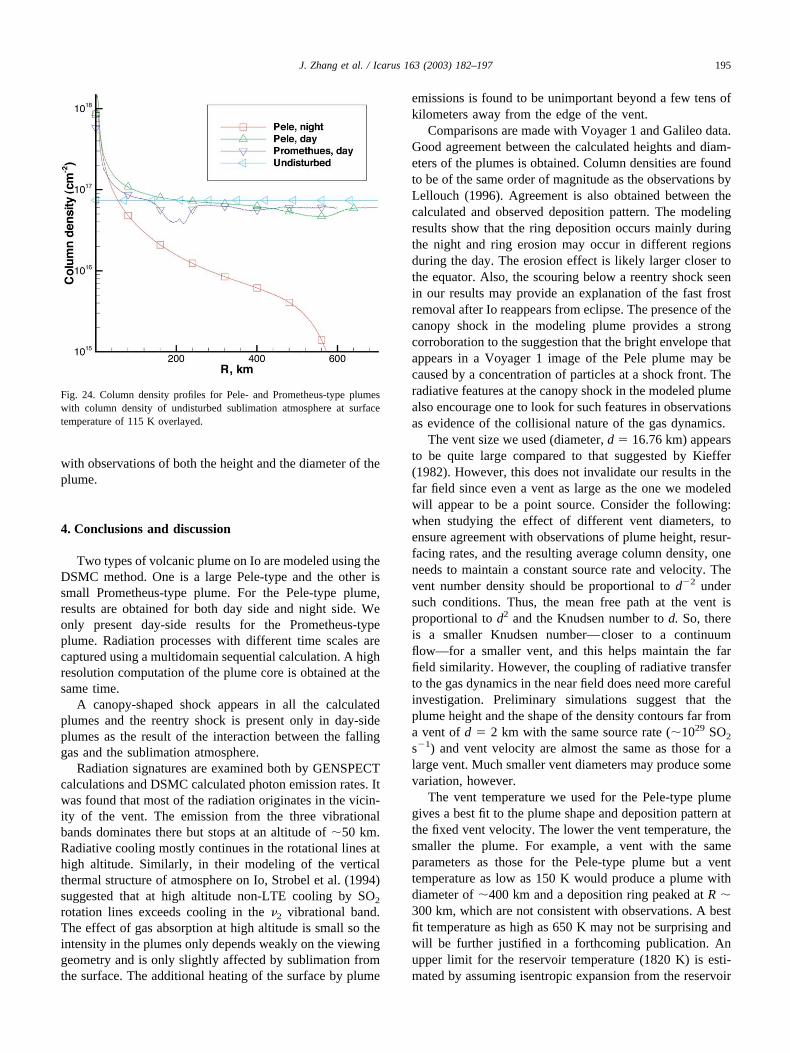
The column density profiles for day-side Pele- andPrometheus-type plumes are plotted in Fig. 24 for compar-ison with the night-side profile. The column density profilefor an undisturbed sublimation atmosphere at a surfacetemperature of 115 K is also plotted. It is seen that thesublimation atmosphere at a surface temperature of 115 Kcontributes appreciably to the column density and domi-nates at locations �100 km away from the vent. The aver-age column densities for our modeled day-side Pele andPrometheus plumes are 7.61 � 1016 and 7.55 � 1016 cm�2,
respectively, which appear to be a little high compared tothe three subsolar column densities (�1–4.5 � 1016 cm�2)obtained by Feldman et al. (2000) for three observations.This probably suggests that the modest subsolar surfacetemperature of 115 K we assumed may in fact be a littlehigh. A lower subsolar surface temperature is sufficient toreproduce the subsolar column densities obtained by Feld-man et al. (2000) since the average column density for thenight-side plume is already close to their values. So, theseresults tend to downplay the role of sublimation on the dayside and favor our focus on modeling the volcanic atmo-sphere. Similarly, Lellouch et al. (1992) inferred from SO2
Fig. 18. Absorption spectra of �1 SO2 band of day-side Pele-type plume fordifferent lines of sight.
Fig. 19. Absorption spectra of �1 SO2 band of night-side Pele-type plumefor different lines of sight.
Fig. 20. Spectral radiance of �3 SO2 band of Pele-type plume for differentlines of sight.
Fig. 21. Absorption spectra of �3 SO2 band of Pele-type plume for differentlines of sight.
193J. Zhang et al. / Icarus 163 (2003) 182–197
microwave observations lower subsolar pressures than theequilibrium value at the assumed subsolar surface temper-ature of 130 K.
The observed and simulated deposition patterns alsoagree reasonably well. The ring deposition around Peleforms the most dramatic surface marking on Io and can beenseen in many published images of Io. As shown in theresults above, our simulation of a night-side Pele plumesuggests a very concentrated deposit in a ring with inner andouter diameters of �800 and �1200 km, respectively,which agrees very well with the observations. When thePele plume is on the day side, the deposition pattern is quitedifferent (Fig. 4). As shown in our simulation, both theinward and the outward turning flow could deplete somefrost from the ring deposited at night and create depositsfurther inward and outward. If one looks closely at theGalileo image of the Pillan plume at almost zero SZA, onecan apparently see such outward turning flows of the plumeon both sides. Voyager 1 images showed very diffuse north-ern and eastern margins of the dark ring around Pele. It wassuggested (Strom and Schneider, 1982) that these diffuseareas were caused by the deposition of a lateral extension ofthe Pele plume beyond the main umbrella. It may also beexplained by our results: the northern region around the Peleplume is much closer to the equator and warmer. Theequatorial sublimation atmosphere is therefore strongenough to turn the flow outward to produce a lateral exten-sion and make the deposition more diffuse. However, asdiscussed above, comparison with observations tends todownplay the role of sublimation on the day side so thisexplanation is only tentative. Another candidate for diffus-ing the ring could be the interaction between Pele’s plume
and the volcanic plumes from the nearby equatorial volca-noes.
The most exciting result may be the similarity between ashock at the top of the Pele plume suggested by Strom andSchneider (1982) and the canopy shock present in our sim-ulation. The ultraviolet smoothed brightness images of Peleshowed a bright top. Its shape strongly resembles that of oursimulated canopy shock. Strom and Schneider suggestedthat this bright envelope may be the result of a concentrationof particles at a shock front. Our simulations indicate thatsuch a canopy-shaped shock should be present. In a separatestudy of the behavior of very fine (�0.01–0.1 �m) particlesin the same plume, we find a concentration of particles at theshock front (Zhang et al., 2003a; Moore et al., 2003). Thereare also other observations that may relate to the canopyshock. In an attempt to reproduce the atomic sodium num-ber density profiles observed at high altitude by Schneider etal. (1991a), Moses et al. (2003a) obtained sodium densitiesthat seem to be too high at high altitude. In their model,plume dynamics is ignored so that there is no shock at highaltitude as in our results. If one accounts for the rapidslowing of the upward moving SO2 and entrained sodiumthrough the canopy shock, the low sodium number densityobserved at high altitude by Schneider et al. (1991a) maywell be reproduced. We are currently investigating thispossibility.
We also modeled the more common Prometheus-typeplume. For this smaller plume the vent conditions are rela-tively weaker and, as shown above, we choose the ventvelocity and temperature to be 500 m/s and 300 K, respec-tively. Again, these produce reasonably good agreement
Fig. 22. Temperature (left) and Mach number (right) contours of day-side Prometheus-type plume. The white dashed lines show the interfaces betweenregions of different resolutions.
Fig. 23. Emission (W/m3) contours from �2 vibrational band (left) and overall rotational lines (right) of day-side Prometheus-type plume. The white dashedlines show the interfaces between regions of different resolutions.
194 J. Zhang et al. / Icarus 163 (2003) 182–197
with observations of both the height and the diameter of theplume.
4. Conclusions and discussion
Two types of volcanic plume on Io are modeled using theDSMC method. One is a large Pele-type and the other issmall Prometheus-type plume. For the Pele-type plume,results are obtained for both day side and night side. Weonly present day-side results for the Prometheus-typeplume. Radiation processes with different time scales arecaptured using a multidomain sequential calculation. A highresolution computation of the plume core is obtained at thesame time.
A canopy-shaped shock appears in all the calculatedplumes and the reentry shock is present only in day-sideplumes as the result of the interaction between the fallinggas and the sublimation atmosphere.
Radiation signatures are examined both by GENSPECTcalculations and DSMC calculated photon emission rates. Itwas found that most of the radiation originates in the vicin-ity of the vent. The emission from the three vibrationalbands dominates there but stops at an altitude of �50 km.Radiative cooling mostly continues in the rotational lines athigh altitude. Similarly, in their modeling of the verticalthermal structure of atmosphere on Io, Strobel et al. (1994)suggested that at high altitude non-LTE cooling by SO2
rotation lines exceeds cooling in the �2 vibrational band.The effect of gas absorption at high altitude is small so theintensity in the plumes only depends weakly on the viewinggeometry and is only slightly affected by sublimation fromthe surface. The additional heating of the surface by plume
emissions is found to be unimportant beyond a few tens ofkilometers away from the edge of the vent.
Comparisons are made with Voyager 1 and Galileo data.Good agreement between the calculated heights and diam-eters of the plumes is obtained. Column densities are foundto be of the same order of magnitude as the observations byLellouch (1996). Agreement is also obtained between thecalculated and observed deposition pattern. The modelingresults show that the ring deposition occurs mainly duringthe night and ring erosion may occur in different regionsduring the day. The erosion effect is likely larger closer tothe equator. Also, the scouring below a reentry shock seenin our results may provide an explanation of the fast frostremoval after Io reappears from eclipse. The presence of thecanopy shock in the modeling plume provides a strongcorroboration to the suggestion that the bright envelope thatappears in a Voyager 1 image of the Pele plume may becaused by a concentration of particles at a shock front. Theradiative features at the canopy shock in the modeled plumealso encourage one to look for such features in observationsas evidence of the collisional nature of the gas dynamics.
The vent size we used (diameter, d � 16.76 km) appearsto be quite large compared to that suggested by Kieffer(1982). However, this does not invalidate our results in thefar field since even a vent as large as the one we modeledwill appear to be a point source. Consider the following:when studying the effect of different vent diameters, toensure agreement with observations of plume height, resur-facing rates, and the resulting average column density, oneneeds to maintain a constant source rate and velocity. Thevent number density should be proportional to d�2 undersuch conditions. Thus, the mean free path at the vent isproportional to d2 and the Knudsen number to d. So, thereis a smaller Knudsen number—closer to a continuumflow—for a smaller vent, and this helps maintain the farfield similarity. However, the coupling of radiative transferto the gas dynamics in the near field does need more carefulinvestigation. Preliminary simulations suggest that theplume height and the shape of the density contours far froma vent of d � 2 km with the same source rate (�1029 SO2
s�1) and vent velocity are almost the same as those for alarge vent. Much smaller vent diameters may produce somevariation, however.
The vent temperature we used for the Pele-type plumegives a best fit to the plume shape and deposition pattern atthe fixed vent velocity. The lower the vent temperature, thesmaller the plume. For example, a vent with the sameparameters as those for the Pele-type plume but a venttemperature as low as 150 K would produce a plume withdiameter of �400 km and a deposition ring peaked at R �300 km, which are not consistent with observations. A bestfit temperature as high as 650 K may not be surprising andwill be further justified in a forthcoming publication. Anupper limit for the reservoir temperature (1820 K) is esti-mated by assuming isentropic expansion from the reservoir
Fig. 24. Column density profiles for Pele- and Prometheus-type plumeswith column density of undisturbed sublimation atmosphere at surfacetemperature of 115 K overlayed.
195J. Zhang et al. / Icarus 163 (2003) 182–197

to the vent at Mach �3. A lower limit of 650 K is obtainedby assuming isothermal expansion below the vent.
Spencer et al. (2000) found that the Pele plume maycontain as much as 30% S2. The inclusion of S2 in themodeled Pele-type plume at this concentration may affectthe magnitude of the radiation but hardly alters the gasdynamics. Our preliminary multispecies plume results con-firm this.
Our future efforts will focus on the effects of a nonunitysticking coefficient, the examination of vent size sensitivity,the consideration of plasma bombardment, and fine partic-ulates and condensation within the plumes.
Acknowledgments
This research was based in part on and developed fromprevious work by J.V. Austin and D.B. Goldstein. The workat the University of Texas at Austin was supported by theNASA Planetary Atmospheres Program, Grant NASANAG5-8143. We also acknowledge support for the workperformed at George Washington University and at Penn-sylvania State University to a grant from the NASA Plan-etary Atmospheres Program, Grant NASA NA5-8068.Computational resources at the University of Texas at Aus-tin were mostly provided by the computational fluid dynam-ics lab. We also thank our referees, L. Trafton and K.Retherford, for their helpful comments.
References
Austin, J.V., Goldstein, D.B., 1995. Direct numerical simulation of low-density atmospheric flow on Io. In: Capitelli, M. (Ed.), MolecularPhysics and Hypersonic Flows. Kluwer Academic, Dordrecht, pp.749–758.
Austin, J.V., Goldstein, D.B., 1998. Simulation of supersonic rarefiedatmospheric flows on Io. in: Brun, R., Campargue, R., Gatignol, R.,Lengrand, J.C. (Eds.), Rarefied Gas Dynamics, Vol. 2. Cepadues-Editions, Toulouse, France, pp. 681–688.
Austin, J.V., Goldstein, D.B., 2000. Rarefied gas model of Io’s sublimationdriven atmosphere. Icarus 148, 370–383.
Ballester, G.E., McGrath, M.A., Strobel, D.F., Zhu, X., Feldman, P.D.,Moos, H.W., 1994. Detection of the SO2 atmosphere on Io with theHubble Space Telescope. Icarus 111, 2–17.
Bass, H.E., Winter, T.G., Evans, L.B., 1971. Vibrational and rotationalrelaxation in sulfur dioxide. J. Chem. Phys. 54, 644.
Bergemann, F., Boyd, I.D., 1994. Dsmc simulation of inelastic collisionsusing the Borgnakke-Larsen method extended to discrete distributionsof vibrational energy, in: Shizgal, B.D., Weaver, D.P. (Eds.), RarefiedGas Dynamics: Theory and Simulations. Progress in Astronautics andAeronautics, pp. 174–183. American Institute of Aeronautics and As-tronautics, Reston, Virginia.
Binder, A.P., Cruikshank, D.P., 1964. Evidence for an atmosphere on Io.Icarus 3, 299–305.
Bird, G.A., 1994. Molecular Gas Dynamics and the Direct Simulation ofGas Flows. Oxford University Press, Oxford.
Doute, S., Lopes, R., Kamp, L.W., Carlson, R., Schmitt, B., The GalileoNIMS Team, 2002. Dynamics and evolution of SO2 gas condensation
around prometheus-like volcanic plumes on Io as seen by the nearinfrared mapping spectrometer. Icarus 158, 460–482.
Fanale, F.P., Banerdt, W.B., Cruikshank, D.P., 1981. Io: could SO2 con-densation/sublimation cause the sometimes reported post-eclipsebrightening? Geophys. Res. Lett. 8, 625–628.
Feldman, P.D., Strobel, D.F., Moos, H.W., Retherford, K.D., Wolven,B.C., McGrath, M.A., Roesler, F.L., Woodward, R.C., Oliverson, R.J.,Ballester, G.L., 2000. Lyman-alpha imaging of the SO2 distribution onIo. Geophys. Res. Lett. 27, 1787–1790.
Geissler, P.E., McEwen, A.S., Ip, W., Belton, M.J.S., Johnson, T.V.,Smyth, W.H., Ingersoll, A.P., 1999. Galileo imaging of atmosphericemissions from Io. Science 285, 870–874.
Gimelshein, S.F., Alexeenko, A.A., and Levin, D.A., 2001. Modeling ofthe interaction of a side jet with a rarefied atmosphere. AIAA paper2001-0503.
Ingersoll, A.P., 1989. Io meteorology: how atmospheric pressure is con-trolled locally by volcanos and surface frosts. Icarus 81, 298–313.
Ingersoll, A.P., Summers, M.E., Schlipf, S.G., 1985. Supersonic meteorol-ogy of Io: sublimation-driven flow of SO2. Icarus 64, 375–390.
Johnson, T.V., Matson, D.L., 1989, Io’s tenuous atmosphere, in: Atreya,S.K., Pollack, J.B., Matthews, M.S. (Eds.), Origin and Evolution ofPlanetary and Satellite Atmospheres, Univ. of Arizona Press, Tucson,pp. 666–681.
Kieffer, S.W., 1982. Dynamics and thermodynamics of volcanic eruptions:implications for the plumes of Io, in: Morrison, D. (Ed.), Satellites ofJupiter, Univ. of Arizona Press, Tucson, pp. 647–723.
Kieffer, S.W., Lopes-Gautier, R., McEwen, A., Smythe, W., Keszthelyi,L., Carlson, R., 2000. Prometheus: Io’s wandering plume. Science 288,1204–1208.
Lambert, J.D., 1977. Vibrational and Rotational Relaxation in Gases.Oxford University Press, Oxford.
Lambert, J.D., Salter, R., 1957. Ultrasonic dispersion in gaseous sulphurdioxide. Proc. Roy. Soc. 243, 78–83.
Larsen, P.S., Borgnakke, C., 1974. Statistical collision model for simulat-ing polyatomic gas with restricted energy exchange, in: Becker, M.,Capitelli, M.F. (Eds.), Rarefied Gas Dynamics, CFVLR Press, Porz-Wahn, Germany.
Lellouch, E., 1996. Io’s atmosphere: not yet understood. Icarus 124, 1–21.Lellouch, E., Belton, M., de Pater, I., Paubert, G., Gulkis, S., Encrenaz, T.,
1992. The structure, stability, and global distribution of Io’s atmo-sphere. Icarus 98, 271–295.
McEwen, A.S., Soderblom, L.A., 1983. Two classes of volcanic plumes onIo. Icarus 58, 197–226.
McGrath, M.A., Belton, M.J.S., Spencer, J.R., Satroretti, P., 2000. Spa-tially resolved spectroscopy of Io’s Pele plume and SO2 atmosphere.Icarus 146, 476–493.
Moore, C., Zhang, J., Goldstein, D.B., Varghese, P.L., Trafton, L.M., 2003.Modeling of particulates and condensates in Io’s Pele-type Volcanicplumes, Lunar and Planet. Sci. XXXIV, Abstract 2102.
Moreno, M.A., Schubert, G., Baumgardner, J., Kivelson, M.G., Paige,D.A., 1991. Io’s volcanic and sublimation atmospheres. Icarus 93,63–81.
Moses, J.I., Zolotov, M.Y., Fegley, J.B., 2002. Alkali and chlorine photo-chemistry in a volcanically driven atomosphere on Io. Icarus 156,107–135.
Nash, D.B., Fanale, F.P., Nelson, R.M., 1980. SO2 frost: UV-visiblereflectivity and Io surface coverage. Geophys. Res. Lett. 7, 665–668.
Nelson, R.M., Lane, A.L., Morrill, M.E., Wallis, B.D., Gibson, J., Smythe,W.D., Horn, L.J., Buratti, B.J., 1993. The brightness of Jupiter’s sat-ellite Io following emergence from eclipse: selected observations,1981–1989. Icarus 101, 223–233.
Pearl, J.C., Hanle, R., Kunde, V., Maguire, W., Fox, K., Gupta, S., Pon-namperuma, C., Raulin, F., 1979. Identification of gaseous SO2 andnew uppel limits for other gases on Io. Nature 288, 757–758.
196 J. Zhang et al. / Icarus 163 (2003) 182–197
Quine, B.M., and Drummond, J.R., 2002. Genspect: a line-by-line codewith selectable interpolation error tolerance. J. Quant. Spectrosc. Ra-diative Transfer 74(2), 147–165.
Radzig, A.A., Smirnov, B.M., 1980. Reference data on atoms, molecules,and ions. Springer-Verlag, Berlin/New York.
Rathbun, J.A., Spencer, J.R., Tamppari, L.K., Martin, T.Z., Barnard, L.,and Travis, L.D., 2002. Recent results from Galileo PPR at Io: OrbitsI31 and I32. Lunar Planet. Sci. XXXIII, Abstract 1371.
Roveda, R., Goldstein, D.B., and Varghese, P.L., 1997. A combineddiscrete velocity/particle based numerical approach for continuum/rarefied flows. AIAA paper 97-1006.
Sandford, S.A., Allamandola, L.J., 1993. The condensation and vaporiza-tion behavior of ices containing SO2, H2S, and CO2: implications for Io.Icarus 106, 478–488.
Schneider, N.M., Hunten, D.M., Wells, W.K., Schultz, A.B., Fink, U.,1991a. The structure of Io’s corona. Astrophys. J. 368, 298–315.
Spencer, J.R., Jessup, K.L., McGrath, M.A., Ballester, G.E., Yelle, R.,2000. Discovery of gaseous S2 in Io’s Pele plume. Science 288, 1208–1210.
Spencer, J.R., Schneider, N.M., 1996. Io on the eve of the galileo mission.Ann. Rev. Earth Planet. Sci. 24, 125–190.
Strobel, D.F., Wolven, B.C., 2001. The atmosphere of Io: abundances andsources of sulfur dioxide and atomic hydrogen. Astrophys. Space Sci.277, 271–287.
Strobel, D.F., Zhu, X., Summers, M.E., 1994. On the vertical thermalstructure of Io’s atmosphere. Icarus 111, 18–30.
Strom, R.G., Schneider, N.M., 1982. Volcanic eruption plumes on Io, in:Morrison, D. (Ed.), Satellites of Jupiter, Univ. of Arizona Press, Tuc-son, pp. 598–633.
Wong, M.C., Johnson, R.E., 1995. The effect of plasma heating on subli-mation-driven flow in Io’s atmosphere. Icarus 115, 109–118.
Wong, M.C., and Johnson R.E. 1996. A three-dimensional azimuthallysymmetric model atmosphere for Io, 1. Photochemistry and the accu-mulation of a nightside atmosphere. J. Geophys. Res. 101, 23243–23254.
Wong, M.C., Smyth, W.H., 2000. Model calculations for Io’s atmosphereat eastern and western elongations. Icarus 146, 60–74.
Zhang, J., Goldstein, D.B., Gimelshein, N.E., Gimelshein, S.F., Levin,D.A., Varghese, P.L., 2001. Modeling low density sulfur dioxide jets:application to volcanoes on Jupiter’s moon Io. AIAA paper 2001-2767presented at 35th AIAA Thermophysics Conference, Anaheim, CA,June 11–14, 2001.
Zhang, J., Goldstein, D.B., Varghese, P.L., Gimelshein, N.E., Gimelshein,S.F., Levin, D.A., Trafton, L.M., 2003a. Dsmc modeling of gas-dynamics, radiation and fine particulates in Ionian volcanic jets, in:Ketsdever, A., Muntz, E.P. (Eds.), Proceedings of 23rd InternationalSymposium on Rarefied Gas Dynamics, Vol. 663, pp. 704–711. AIP,New York.
Zhang, J., Miki, K., Goldstein, D.B., Varghese, P.L., Trafton, L.M., 2003b.Modeling of radiation above Io’s surface from Pele-type volcanicplumes and underground from the conduit wall. Lunar and Planet. Sci.XXXIV, Abstract 2123.
197J. Zhang et al. / Icarus 163 (2003) 182–197