Lignin-first integrated steam explosion process for green ...
10
Simulation of Ex-Vessel Steam Explosion
Matjaž Leskovar Jožef Stefan Institute
Slovenia
1. Introduction
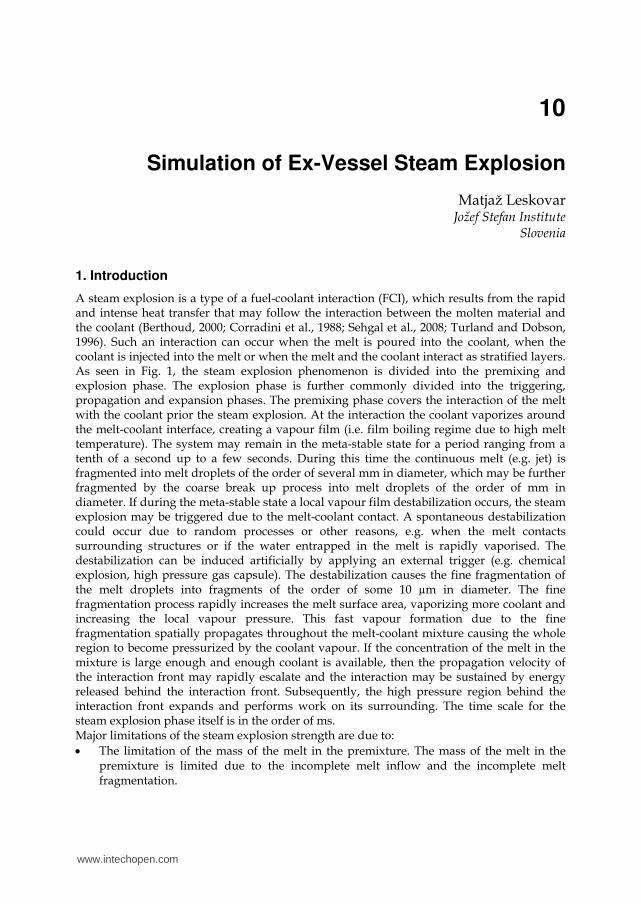
A steam explosion is a type of a fuel-coolant interaction (FCI), which results from the rapid and intense heat transfer that may follow the interaction between the molten material and the coolant (Berthoud, 2000; Corradini et al., 1988; Sehgal et al., 2008; Turland and Dobson, 1996). Such an interaction can occur when the melt is poured into the coolant, when the coolant is injected into the melt or when the melt and the coolant interact as stratified layers. As seen in Fig. 1, the steam explosion phenomenon is divided into the premixing and explosion phase. The explosion phase is further commonly divided into the triggering, propagation and expansion phases. The premixing phase covers the interaction of the melt with the coolant prior the steam explosion. At the interaction the coolant vaporizes around the melt-coolant interface, creating a vapour film (i.e. film boiling regime due to high melt temperature). The system may remain in the meta-stable state for a period ranging from a tenth of a second up to a few seconds. During this time the continuous melt (e.g. jet) is fragmented into melt droplets of the order of several mm in diameter, which may be further fragmented by the coarse break up process into melt droplets of the order of mm in diameter. If during the meta-stable state a local vapour film destabilization occurs, the steam explosion may be triggered due to the melt-coolant contact. A spontaneous destabilization could occur due to random processes or other reasons, e.g. when the melt contacts surrounding structures or if the water entrapped in the melt is rapidly vaporised. The destabilization can be induced artificially by applying an external trigger (e.g. chemical explosion, high pressure gas capsule). The destabilization causes the fine fragmentation of the melt droplets into fragments of the order of some 10 µm in diameter. The fine fragmentation process rapidly increases the melt surface area, vaporizing more coolant and increasing the local vapour pressure. This fast vapour formation due to the fine fragmentation spatially propagates throughout the melt-coolant mixture causing the whole region to become pressurized by the coolant vapour. If the concentration of the melt in the mixture is large enough and enough coolant is available, then the propagation velocity of the interaction front may rapidly escalate and the interaction may be sustained by energy released behind the interaction front. Subsequently, the high pressure region behind the interaction front expands and performs work on its surrounding. The time scale for the steam explosion phase itself is in the order of ms. Major limitations of the steam explosion strength are due to:
The limitation of the mass of the melt in the premixture. The mass of the melt in the premixture is limited due to the incomplete melt inflow and the incomplete melt fragmentation.
www.intechopen.com
Nuclear Power – Operation, Safety and Environment
208
The void production in the premixing phase. The presence of void hinders the steam explosion propagation and escalation due to the void compressibility and due to water depletion.
The melt solidification during the premixing phase. The fine fragmentation during the explosion phase is limited due to the solidification of melt droplets.
Fig. 1. Schematic illustration of the processes during the steam explosion phenomenon, starting with the melt pour into the coolant.
1.1 Steam explosion issue and nuclear safety A steam explosion may occur during a hypothetical core melt accident in a light water reactor (LWR) nuclear power plant, when the molten corium interacts with the water (Corradini et al., 1988; Sehgal, 2006; Sehgal et al., 2008; Theofanous, 1995). Potentially severe
www.intechopen.com
Simulation of Ex-Vessel Steam Explosion
209
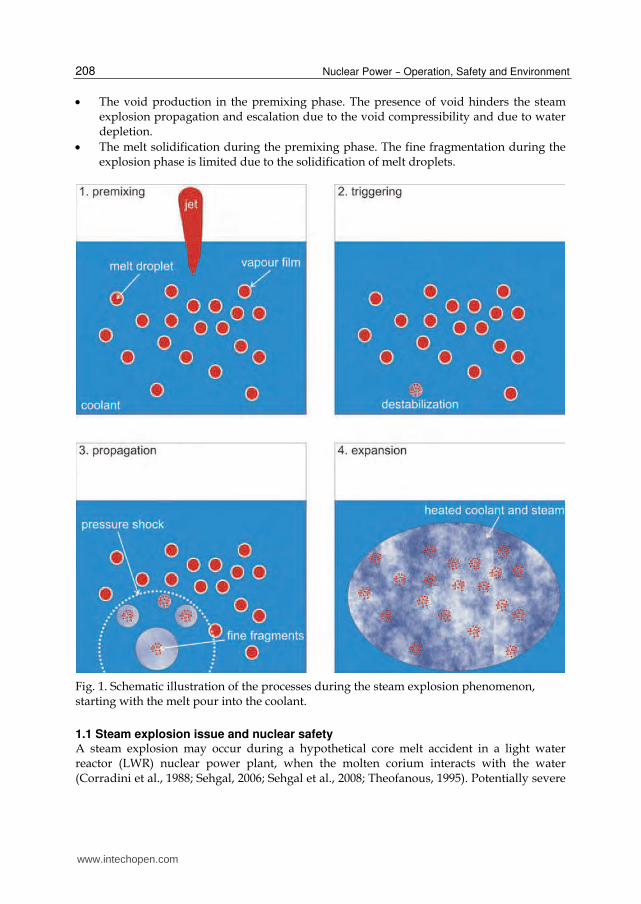
dynamic loadings on surrounding systems, structures and components could be induced by pressure peaks in the order of 100 MPa and duration in the order of ms. Steam explosions can therefore jeopardize the reactor vessel and the containment integrity (Esmaili and Khatib-Rahbar, 2005). Direct or by-passed loss of the containment integrity can lead to radioactive material release into the environment, threatening the safety of the general public. Consequently, the understanding of the steam explosion phenomenon is very important for nuclear safety. As seen in Fig.2, several FCI situations in LWR were identified in which a steam explosion could occur (Sehgal et al., 2008). An in-vessel FCI could occur when the molten corium is poured into water in the lower head of the reactor pressure vessel (poured FCI) or when the relocated melt in the lower head is flooded (stratified FCI). In-vessel FCI may result in a steam explosion which causes the failure of the upper or lower head of the pressure vessel. When the molten corium melts through the vessel, the melt is poured into the cavity. An ex-vessel steam explosion can occur if the cavity is already filled with water (poured FCI) or if the cavity is flooded after the relocation of the melt in the cavity (stratified FCI).
Fig. 2. Various FCI scenarios in LWR reactors.
In the past, the issue of in-vessel steam explosions causing the upper head failure of the reactor vessel was mainly concerned in LWR (WASH-1400, 1975). In this so called alpha mode containment failure it is considered that the ejected upper head could endanger the containment integrity. International reviews of the alpha mode failure probability and experimental investigations have indicated that the upper head and bolts can withstand the in-vessel steam explosion (Corradini et al., 1988; Krieg et al., 2003; Sehgal et al., 2008). The importance of the poured in-vessel and ex-vessel steam explosions was recognized also by the OECD (Organisation for Economic Co-operation and Development), which started the SERENA (Steam Explosion Resolution for Nuclear Applications) Phase 1 research programme in the year 2002 (OECD/NEA, 2007). The objective of the SERENA programme was to evaluate the capabilities of FCI codes in predicting steam explosion induced loads, reaching consensus on the understanding of important FCI processes relevant to the reactor simulations, and to propose confirmatory research to bring the predictability of steam explosion energetics to required levels for risk management. Two main outcomes were obtained. First, the calculated loads are far below the capacity of a typical intact reactor vessel in case of an in-vessel steam explosion. However, for ex-vessel poured steam explosions the programme outcome was that the calculated loads are partly above the
www.intechopen.com
Nuclear Power – Operation, Safety and Environment
210
capacity of typical reactor cavity walls. But due to the large scatter of the simulation results, which reflects the deficiency in the steam explosion phenomenon understanding and uncertainties on modelling and scaling, the safety margins for ex-vessel steam explosions could not be quantified reliably. To resolve the remaining open issues on the FCI processes and their effect on ex-vessel steam explosion energetics, the SERENA Phase 2 was launched at the end of the year 2007 (OECD/NEA, 2008). The main objective is to reduce the uncertainties on the coolant void and the material effect in FCI. The second phase comprises an experimental and an analytical program. The aim of the experimental program is to clarify the nature of prototypic material having mild steam explosion characteristics and to provide innovative experimental data for code validation, aiming to reduce the scatter of code predictions and to enhance the geometrical extrapolation capabilities of FCI codes to cover reactor situations. The aim of the comprehensive analytical program is to increase the capability of FCI models and codes for use in reactor analyses. Due to the high risk significance of the steam explosion phenomenon for the containment
integrity, the ex-vessel FCI issue is one of the six high priority safety issues, which were
identified in the EU (European Union) network of excellence SARNET (Severe Accident
Research NETwork of Excellence) Phase 1 (Albiol et al., 2008; Schwinges et al., 2010). The
purpose of the SARNET network of excellence, which was founded in the year 2004, is to
integrate European research capabilities on severe accidents in order to enhance the safety
for the existing and future nuclear power plants. In the beginning of the year 2009 the
follow-up SARNET Phase 2 was started. The purpose of the second phase is to focus on
those safety issues, which were classified with high priority in the first phase. Beside the
issue of ex-vessel FCI also the issues of the corium and debris coolability, the molten
corium-concrete interaction, the hydrogen mixing and combustion in the containment and
the source term are investigated. The issue of stratified steam explosions is not considered being as important as steam explosions occurring after the pouring of the melt into water. Namely, the mass of the melt which can participate in the mixing process is limited in stratified cases if compared with the premixture melt mass in pouring cases (Sehgal et al., 2008). The final goal of the FCI research related to nuclear safety is to bring the predictability of the
steam explosion strength to required levels for the risk assessment in LWR. This is necessary
for the risk management to be able to implement the optimal severe accident management
approaches (e.g. flooding of reactor cavity, in-vessel retention, core catcher).
This chapter focuses on the simulation of poured ex-vessel steam explosions, which are of
greatest interest. With the FCI code MC3D (Meignen and Picchi, 2005) different scenarios of
ex-vessel steam explosions in a typical pressurized water reactor cavity were analyzed to get
additional insight in the ex-vessel steam explosion behaviour and the resulting pressure
loads. A parametric study was performed varying the location of the melt release (central,
right and left side melt pour), the cavity water subcooling, the primary system overpressure
at vessel failure and the triggering time for explosion calculations. The main purpose of the
study was to establish the influence of the varied parameters on the FCI behaviour, to
determine the most challenging cases and to estimate the expected pressure loadings on the
cavity walls. For the most challenging central, right side and left side melt pour scenarios,
according to the performed simulations, a detailed analysis of the explosion simulation
results was performed. In addition, the influence of the jet breakup modelling and the melt
droplets solidification on the FCI process was analyzed.
www.intechopen.com
Simulation of Ex-Vessel Steam Explosion
211
First, the applied FCI modelling approach is described and the analyzed ex-vessel FCI scenarios are given. Then the various premixing and explosion phase simulation results are presented and the most challenging cases established. For the most challenging cases a more detailed analysis is provided. Finally, for the most challenging central melt pour case the influence of the jet breakup modelling and the melt droplets solidification on the simulation results is analyzed and discussed.
2. Modelling
The simulations were performed with the MC3D computer code, which is being developed by IRSN, France (Meignen and Picchi, 2005). MC3D is a multidimensional Eulerian code devoted to study multiphase and multi-constituent flows in the field of nuclear safety. It has been built with the FCI calculations in mind. It is, however, able to calculate very different situations and has a rather wide field of potential applications. MC3D is a set of two FCI codes with a common numeric solver, one for the premixing phase and one for the explosion phase (i.e. triggering phase, propagation phase and initial stage of expansion phase). In general, the steam explosion simulation with MC3D is being carried out in two steps. In the first step, the distributions of the melt, water and vapour phases at steam explosion triggering are calculated with the premixing module. And in the succeeding second step, the escalation and propagation of the steam explosion through the premixture are calculated with the explosion module, using the premixing simulation results as initial conditions and applying a trigger. The MC3D premixing module focuses on the modelling of the molten fuel jet, its fragmentation into large drops, the coarse fragmentation of these drops and the heat transfer between the melt and the coolant (Meignen, 2005). The fuel is described by two fields, the “continuous” fuel field (e.g. fuel jet or molten pool) and the “droplets” fuel field (melt droplets), considering the possible continuous or dispersed state of the fuel. The fuel is transferred between both fields during jet breakup and coalescence. In MC3D two jet breakup models are provided, a global model and a local model. In the global model the jet fragmentation rate is deduced from the comparison to a standard case (i.e. typical conditions in FARO experiments (Magallon and Huhtiniemi, 2001)) and the size of the created droplets is a user parameter. In the local model the jet fragmentation rate and the size of the created droplets are calculated based on local velocities applying the Kelvin Helmholtz instability model. Since the local model is very sensitive and in the process of being improved, the reference calculations were performed using the global jet breakup model. The diameter of the created droplets was set to 4 mm, what is the typical size of the melt droplets in the FARO experiments (Magallon and Huhtiniemi, 2001). The explosion module focuses on the fine fragmentation of the melt droplets, generated during premixing, and the heat exchange between the produced fragments and the coolant (Meignen, 2005). In this module the “continuous” fuel field is not present, but there are two fields related to the dispersed fuel, i.e. the “droplets” fuel field and the “fragments” fuel field. During the fine fragmentation process the fuel is transferred from the “droplets” field to the “fragments” field. Both fine fragmentation processes, i.e. thermal fragmentation, resulting from the destabilization of the vapour film around the melt droplets, and hydrodynamic fragmentation, resulting from the velocity differences between the melt droplets and the surrounding medium, are considered. The diameter of the created fragments, which is a user parameter, was set to the code standard value 100 µm, which is
www.intechopen.com
Nuclear Power – Operation, Safety and Environment
212
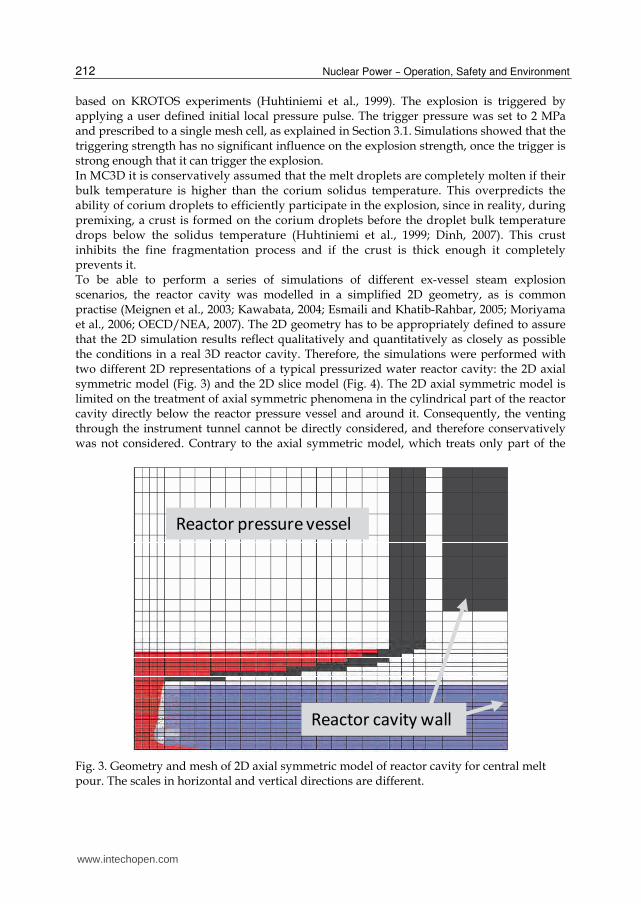
based on KROTOS experiments (Huhtiniemi et al., 1999). The explosion is triggered by applying a user defined initial local pressure pulse. The trigger pressure was set to 2 MPa and prescribed to a single mesh cell, as explained in Section 3.1. Simulations showed that the triggering strength has no significant influence on the explosion strength, once the trigger is strong enough that it can trigger the explosion. In MC3D it is conservatively assumed that the melt droplets are completely molten if their bulk temperature is higher than the corium solidus temperature. This overpredicts the ability of corium droplets to efficiently participate in the explosion, since in reality, during premixing, a crust is formed on the corium droplets before the droplet bulk temperature drops below the solidus temperature (Huhtiniemi et al., 1999; Dinh, 2007). This crust inhibits the fine fragmentation process and if the crust is thick enough it completely prevents it. To be able to perform a series of simulations of different ex-vessel steam explosion scenarios, the reactor cavity was modelled in a simplified 2D geometry, as is common practise (Meignen et al., 2003; Kawabata, 2004; Esmaili and Khatib-Rahbar, 2005; Moriyama et al., 2006; OECD/NEA, 2007). The 2D geometry has to be appropriately defined to assure that the 2D simulation results reflect qualitatively and quantitatively as closely as possible the conditions in a real 3D reactor cavity. Therefore, the simulations were performed with two different 2D representations of a typical pressurized water reactor cavity: the 2D axial symmetric model (Fig. 3) and the 2D slice model (Fig. 4). The 2D axial symmetric model is limited on the treatment of axial symmetric phenomena in the cylindrical part of the reactor cavity directly below the reactor pressure vessel and around it. Consequently, the venting through the instrument tunnel cannot be directly considered, and therefore conservatively was not considered. Contrary to the axial symmetric model, which treats only part of the
Reactor pressure vessel
Reactor cavity wall
Fig. 3. Geometry and mesh of 2D axial symmetric model of reactor cavity for central melt pour. The scales in horizontal and vertical directions are different.
www.intechopen.com
Simulation of Ex-Vessel Steam Explosion
213
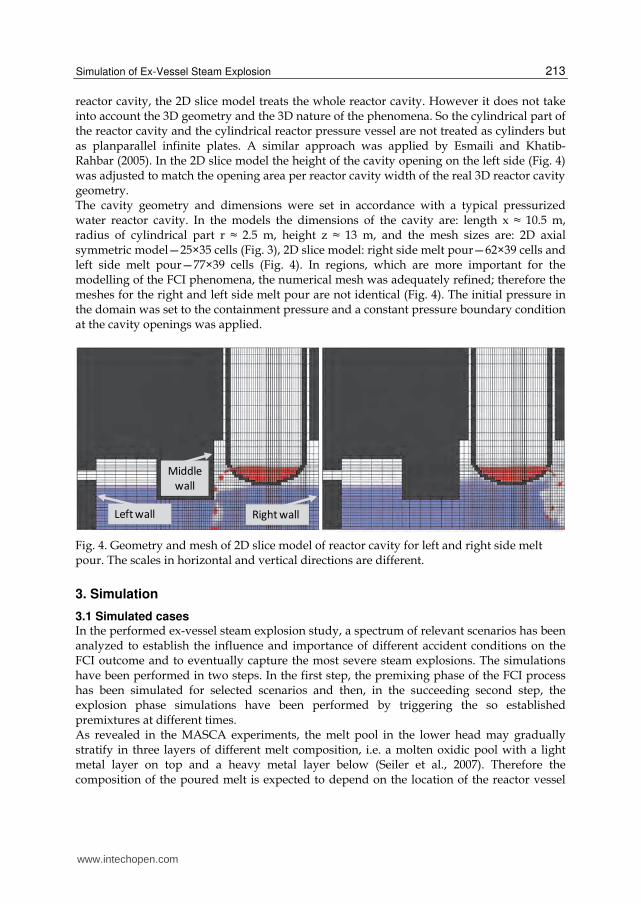
reactor cavity, the 2D slice model treats the whole reactor cavity. However it does not take into account the 3D geometry and the 3D nature of the phenomena. So the cylindrical part of the reactor cavity and the cylindrical reactor pressure vessel are not treated as cylinders but as planparallel infinite plates. A similar approach was applied by Esmaili and Khatib-Rahbar (2005). In the 2D slice model the height of the cavity opening on the left side (Fig. 4) was adjusted to match the opening area per reactor cavity width of the real 3D reactor cavity geometry. The cavity geometry and dimensions were set in accordance with a typical pressurized water reactor cavity. In the models the dimensions of the cavity are: length x ≈ 10.5 m, radius of cylindrical part r ≈ 2.5 m, height z ≈ 13 m, and the mesh sizes are: 2D axial symmetric model—25×35 cells (Fig. 3), 2D slice model: right side melt pour—62×39 cells and left side melt pour—77×39 cells (Fig. 4). In regions, which are more important for the modelling of the FCI phenomena, the numerical mesh was adequately refined; therefore the meshes for the right and left side melt pour are not identical (Fig. 4). The initial pressure in the domain was set to the containment pressure and a constant pressure boundary condition at the cavity openings was applied.
Rightwall
Middle
wall
Leftwall
Fig. 4. Geometry and mesh of 2D slice model of reactor cavity for left and right side melt pour. The scales in horizontal and vertical directions are different.
3. Simulation
3.1 Simulated cases In the performed ex-vessel steam explosion study, a spectrum of relevant scenarios has been analyzed to establish the influence and importance of different accident conditions on the FCI outcome and to eventually capture the most severe steam explosions. The simulations have been performed in two steps. In the first step, the premixing phase of the FCI process has been simulated for selected scenarios and then, in the succeeding second step, the explosion phase simulations have been performed by triggering the so established premixtures at different times. As revealed in the MASCA experiments, the melt pool in the lower head may gradually stratify in three layers of different melt composition, i.e. a molten oxidic pool with a light metal layer on top and a heavy metal layer below (Seiler et al., 2007). Therefore the composition of the poured melt is expected to depend on the location of the reactor vessel
www.intechopen.com
Nuclear Power – Operation, Safety and Environment
214
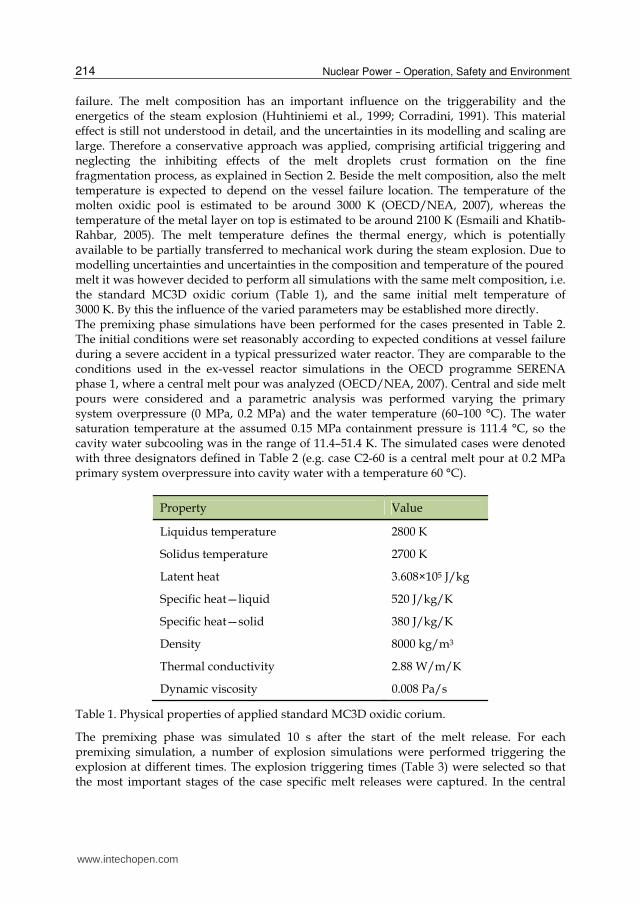
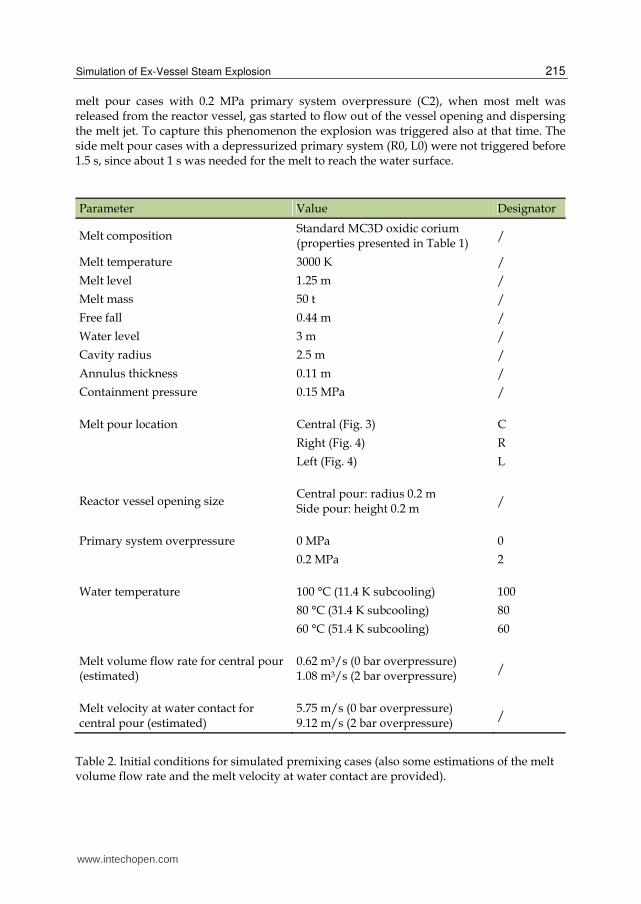
failure. The melt composition has an important influence on the triggerability and the energetics of the steam explosion (Huhtiniemi et al., 1999; Corradini, 1991). This material effect is still not understood in detail, and the uncertainties in its modelling and scaling are large. Therefore a conservative approach was applied, comprising artificial triggering and neglecting the inhibiting effects of the melt droplets crust formation on the fine fragmentation process, as explained in Section 2. Beside the melt composition, also the melt temperature is expected to depend on the vessel failure location. The temperature of the molten oxidic pool is estimated to be around 3000 K (OECD/NEA, 2007), whereas the temperature of the metal layer on top is estimated to be around 2100 K (Esmaili and Khatib-Rahbar, 2005). The melt temperature defines the thermal energy, which is potentially available to be partially transferred to mechanical work during the steam explosion. Due to modelling uncertainties and uncertainties in the composition and temperature of the poured melt it was however decided to perform all simulations with the same melt composition, i.e. the standard MC3D oxidic corium (Table 1), and the same initial melt temperature of 3000 K. By this the influence of the varied parameters may be established more directly. The premixing phase simulations have been performed for the cases presented in Table 2. The initial conditions were set reasonably according to expected conditions at vessel failure during a severe accident in a typical pressurized water reactor. They are comparable to the conditions used in the ex-vessel reactor simulations in the OECD programme SERENA phase 1, where a central melt pour was analyzed (OECD/NEA, 2007). Central and side melt pours were considered and a parametric analysis was performed varying the primary system overpressure (0 MPa, 0.2 MPa) and the water temperature (60–100 °C). The water saturation temperature at the assumed 0.15 MPa containment pressure is 111.4 °C, so the cavity water subcooling was in the range of 11.4–51.4 K. The simulated cases were denoted with three designators defined in Table 2 (e.g. case C2-60 is a central melt pour at 0.2 MPa primary system overpressure into cavity water with a temperature 60 °C).
Property Value
Liquidus temperature 2800 K
Solidus temperature 2700 K
Latent heat 3.608×10⁵ J/kg
Specific heat—liquid 520 J/kg/K
Specific heat—solid 380 J/kg/K
Density 8000 kg/m3
Thermal conductivity 2.88 W/m/K
Dynamic viscosity 0.008 Pa/s
Table 1. Physical properties of applied standard MC3D oxidic corium.
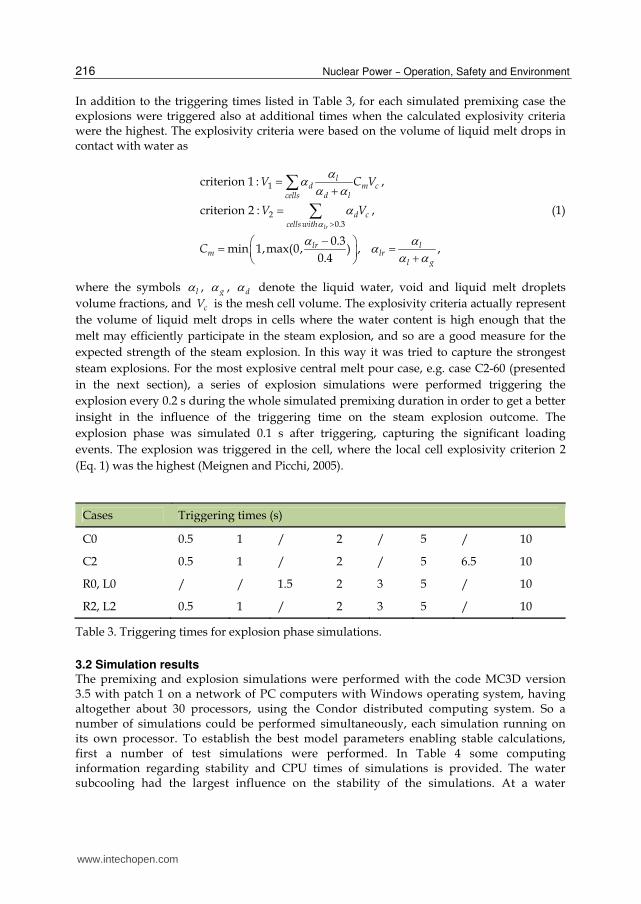
The premixing phase was simulated 10 s after the start of the melt release. For each premixing simulation, a number of explosion simulations were performed triggering the explosion at different times. The explosion triggering times (Table 3) were selected so that the most important stages of the case specific melt releases were captured. In the central
www.intechopen.com
Simulation of Ex-Vessel Steam Explosion
215
melt pour cases with 0.2 MPa primary system overpressure (C2), when most melt was released from the reactor vessel, gas started to flow out of the vessel opening and dispersing the melt jet. To capture this phenomenon the explosion was triggered also at that time. The side melt pour cases with a depressurized primary system (R0, L0) were not triggered before 1.5 s, since about 1 s was needed for the melt to reach the water surface.
Parameter Value Designator
Melt composition Standard MC3D oxidic corium (properties presented in Table 1)
/
Melt temperature 3000 K /
Melt level 1.25 m /
Melt mass 50 t /
Free fall 0.44 m /
Water level 3 m /
Cavity radius 2.5 m /
Annulus thickness 0.11 m /
Containment pressure 0.15 MPa /
Melt pour location Central (Fig. 3) C
Right (Fig. 4) R
Left (Fig. 4) L
Reactor vessel opening size Central pour: radius 0.2 m Side pour: height 0.2 m
/
Primary system overpressure 0 MPa 0
0.2 MPa 2
Water temperature 100 °C (11.4 K subcooling) 100
80 °C (31.4 K subcooling) 80
60 °C (51.4 K subcooling) 60
Melt volume flow rate for central pour (estimated)
0.62 m3/s (0 bar overpressure) 1.08 m3/s (2 bar overpressure)
/
Melt velocity at water contact for central pour (estimated)
5.75 m/s (0 bar overpressure) 9.12 m/s (2 bar overpressure)
/
Table 2. Initial conditions for simulated premixing cases (also some estimations of the melt volume flow rate and the melt velocity at water contact are provided).
www.intechopen.com
Nuclear Power – Operation, Safety and Environment
216
In addition to the triggering times listed in Table 3, for each simulated premixing case the explosions were triggered also at additional times when the calculated explosivity criteria were the highest. The explosivity criteria were based on the volume of liquid melt drops in contact with water as
1
20.3
criterion 1 : ,
criterion 2 : ,
0.3min 1,max(0, ) , ,
0.4
lr
ld m c
d lcells
d ccells with
lr lm lr
l g
V C V
V V
C
(1)
where the symbols l , g , d denote the liquid water, void and liquid melt droplets
volume fractions, and cV is the mesh cell volume. The explosivity criteria actually represent
the volume of liquid melt drops in cells where the water content is high enough that the
melt may efficiently participate in the steam explosion, and so are a good measure for the
expected strength of the steam explosion. In this way it was tried to capture the strongest
steam explosions. For the most explosive central melt pour case, e.g. case C2-60 (presented
in the next section), a series of explosion simulations were performed triggering the
explosion every 0.2 s during the whole simulated premixing duration in order to get a better
insight in the influence of the triggering time on the steam explosion outcome. The
explosion phase was simulated 0.1 s after triggering, capturing the significant loading
events. The explosion was triggered in the cell, where the local cell explosivity criterion 2
(Eq. 1) was the highest (Meignen and Picchi, 2005).
Cases Triggering times (s)
C0 0.5 1 / 2 / 5 / 10
C2 0.5 1 / 2 / 5 6.5 10
R0, L0 / / 1.5 2 3 5 / 10
R2, L2 0.5 1 / 2 3 5 / 10
Table 3. Triggering times for explosion phase simulations.
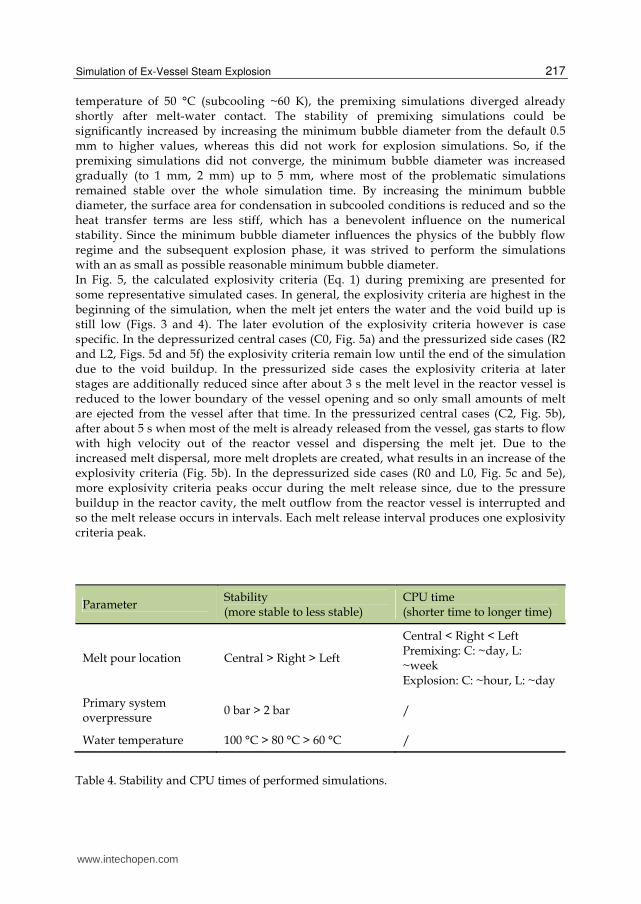
3.2 Simulation results The premixing and explosion simulations were performed with the code MC3D version 3.5 with patch 1 on a network of PC computers with Windows operating system, having altogether about 30 processors, using the Condor distributed computing system. So a number of simulations could be performed simultaneously, each simulation running on its own processor. To establish the best model parameters enabling stable calculations, first a number of test simulations were performed. In Table 4 some computing information regarding stability and CPU times of simulations is provided. The water subcooling had the largest influence on the stability of the simulations. At a water
www.intechopen.com
Simulation of Ex-Vessel Steam Explosion
217
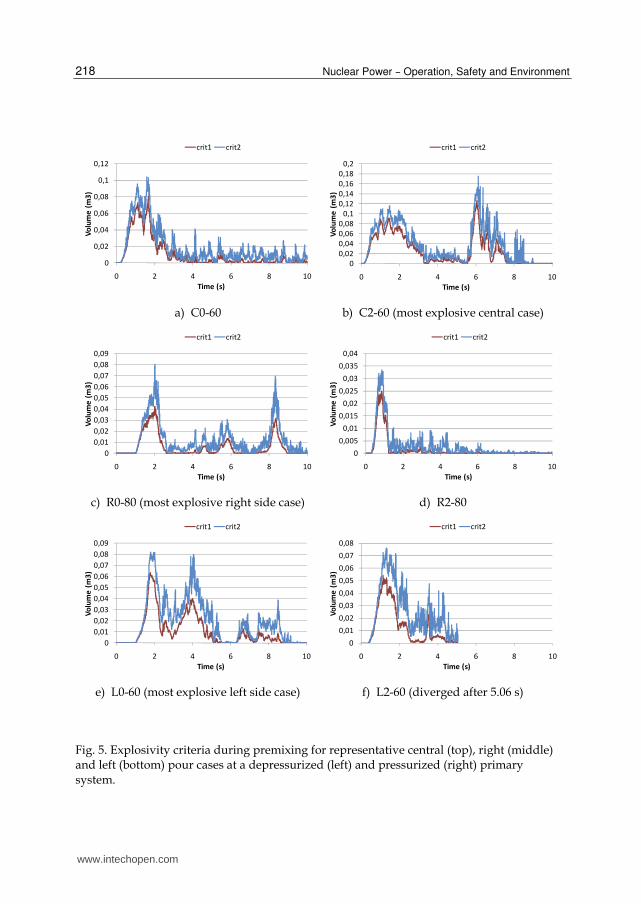
temperature of 50 °C (subcooling ~60 K), the premixing simulations diverged already shortly after melt-water contact. The stability of premixing simulations could be significantly increased by increasing the minimum bubble diameter from the default 0.5 mm to higher values, whereas this did not work for explosion simulations. So, if the premixing simulations did not converge, the minimum bubble diameter was increased gradually (to 1 mm, 2 mm) up to 5 mm, where most of the problematic simulations remained stable over the whole simulation time. By increasing the minimum bubble diameter, the surface area for condensation in subcooled conditions is reduced and so the heat transfer terms are less stiff, which has a benevolent influence on the numerical stability. Since the minimum bubble diameter influences the physics of the bubbly flow regime and the subsequent explosion phase, it was strived to perform the simulations with an as small as possible reasonable minimum bubble diameter. In Fig. 5, the calculated explosivity criteria (Eq. 1) during premixing are presented for some representative simulated cases. In general, the explosivity criteria are highest in the beginning of the simulation, when the melt jet enters the water and the void build up is still low (Figs. 3 and 4). The later evolution of the explosivity criteria however is case specific. In the depressurized central cases (C0, Fig. 5a) and the pressurized side cases (R2 and L2, Figs. 5d and 5f) the explosivity criteria remain low until the end of the simulation due to the void buildup. In the pressurized side cases the explosivity criteria at later stages are additionally reduced since after about 3 s the melt level in the reactor vessel is reduced to the lower boundary of the vessel opening and so only small amounts of melt are ejected from the vessel after that time. In the pressurized central cases (C2, Fig. 5b), after about 5 s when most of the melt is already released from the vessel, gas starts to flow with high velocity out of the reactor vessel and dispersing the melt jet. Due to the increased melt dispersal, more melt droplets are created, what results in an increase of the explosivity criteria (Fig. 5b). In the depressurized side cases (R0 and L0, Fig. 5c and 5e), more explosivity criteria peaks occur during the melt release since, due to the pressure buildup in the reactor cavity, the melt outflow from the reactor vessel is interrupted and so the melt release occurs in intervals. Each melt release interval produces one explosivity criteria peak.
Parameter Stability (more stable to less stable)
CPU time (shorter time to longer time)
Melt pour location Central > Right > Left
Central < Right < Left Premixing: C: ~day, L: ~week Explosion: C: ~hour, L: ~day
Primary system overpressure
0 bar > 2 bar /
Water temperature 100 °C > 80 °C > 60 °C /
Table 4. Stability and CPU times of performed simulations.
www.intechopen.com
Nuclear Power – Operation, Safety and Environment
218
0
0,02
0,04
0,06
0,08
0,1
0,12
0 2 4 6 8 10
Vo
lum
e (
m3
)
Time (s)
crit1 crit2
0
0,02
0,04
0,06
0,08
0,1
0,12
0,14
0,16
0,18
0,2
0 2 4 6 8 10
Vo
lum
e (
m3
)
Time (s)
crit1 crit2
a) C0-60 b) C2-60 (most explosive central case)
0
0,01
0,02
0,03
0,04
0,05
0,06
0,07
0,08
0,09
0 2 4 6 8 10
Vo
lum
e (
m3
)
Time (s)
crit1 crit2
0
0,005
0,01
0,015
0,02
0,025
0,03
0,035
0,04
0 2 4 6 8 10
Vo
lum
e (
m3
)
Time (s)
crit1 crit2
c) R0-80 (most explosive right side case) d) R2-80
0
0,01
0,02
0,03
0,04
0,05
0,06
0,07
0,08
0,09
0 2 4 6 8 10
Vo
lum
e (
m3
)
Time (s)
crit1 crit2
0
0,01
0,02
0,03
0,04
0,05
0,06
0,07
0,08
0 2 4 6 8 10
Vo
lum
e (
m3
)
Time (s)
crit1 crit2
e) L0-60 (most explosive left side case) f) L2-60 (diverged after 5.06 s)
Fig. 5. Explosivity criteria during premixing for representative central (top), right (middle) and left (bottom) pour cases at a depressurized (left) and pressurized (right) primary system.
www.intechopen.com
Simulation of Ex-Vessel Steam Explosion
219
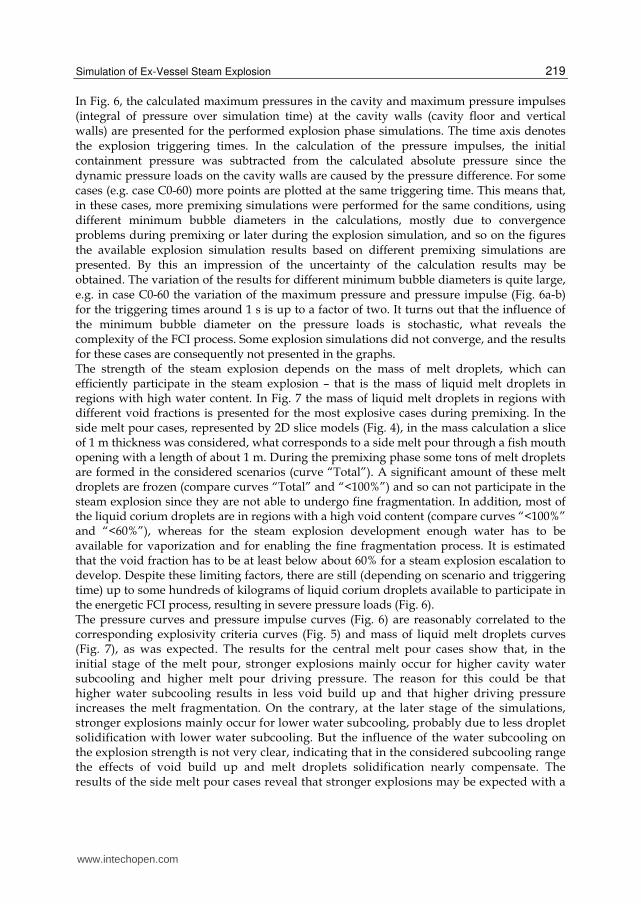
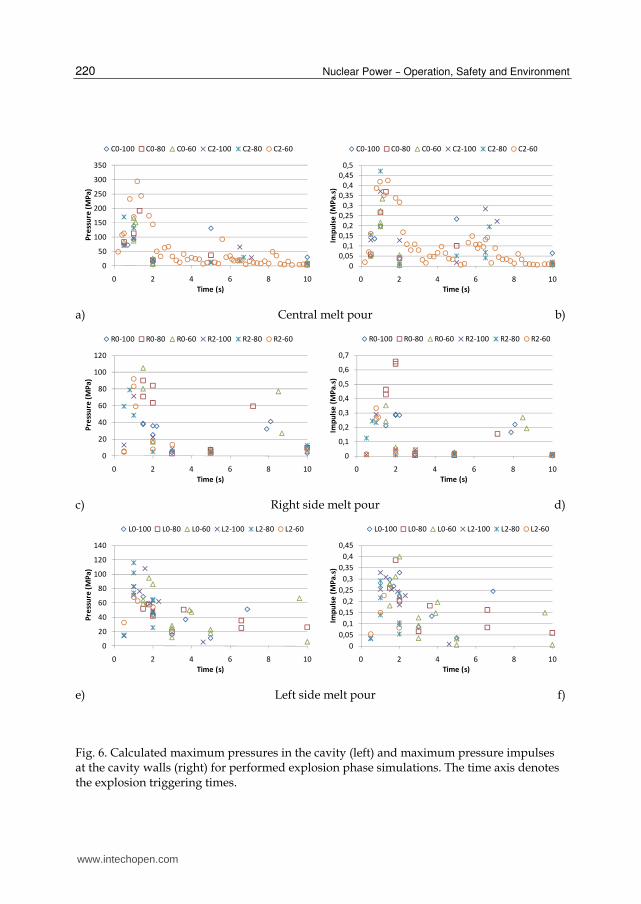
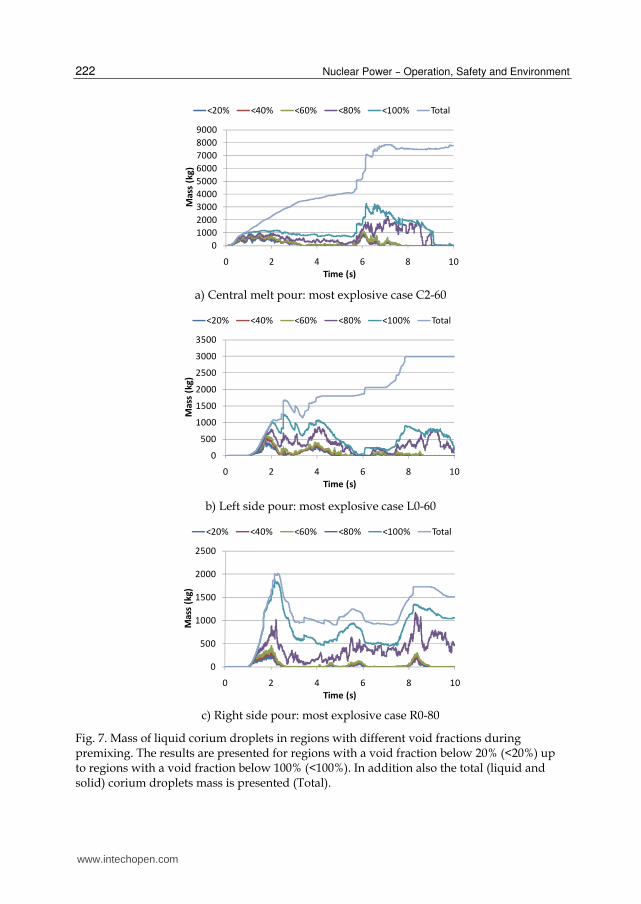
In Fig. 6, the calculated maximum pressures in the cavity and maximum pressure impulses (integral of pressure over simulation time) at the cavity walls (cavity floor and vertical walls) are presented for the performed explosion phase simulations. The time axis denotes the explosion triggering times. In the calculation of the pressure impulses, the initial containment pressure was subtracted from the calculated absolute pressure since the dynamic pressure loads on the cavity walls are caused by the pressure difference. For some cases (e.g. case C0-60) more points are plotted at the same triggering time. This means that, in these cases, more premixing simulations were performed for the same conditions, using different minimum bubble diameters in the calculations, mostly due to convergence problems during premixing or later during the explosion simulation, and so on the figures the available explosion simulation results based on different premixing simulations are presented. By this an impression of the uncertainty of the calculation results may be obtained. The variation of the results for different minimum bubble diameters is quite large, e.g. in case C0-60 the variation of the maximum pressure and pressure impulse (Fig. 6a-b) for the triggering times around 1 s is up to a factor of two. It turns out that the influence of the minimum bubble diameter on the pressure loads is stochastic, what reveals the complexity of the FCI process. Some explosion simulations did not converge, and the results for these cases are consequently not presented in the graphs. The strength of the steam explosion depends on the mass of melt droplets, which can efficiently participate in the steam explosion – that is the mass of liquid melt droplets in regions with high water content. In Fig. 7 the mass of liquid melt droplets in regions with different void fractions is presented for the most explosive cases during premixing. In the side melt pour cases, represented by 2D slice models (Fig. 4), in the mass calculation a slice of 1 m thickness was considered, what corresponds to a side melt pour through a fish mouth opening with a length of about 1 m. During the premixing phase some tons of melt droplets are formed in the considered scenarios (curve “Total”). A significant amount of these melt droplets are frozen (compare curves “Total” and “<100%”) and so can not participate in the steam explosion since they are not able to undergo fine fragmentation. In addition, most of the liquid corium droplets are in regions with a high void content (compare curves “<100%” and “<60%”), whereas for the steam explosion development enough water has to be available for vaporization and for enabling the fine fragmentation process. It is estimated that the void fraction has to be at least below about 60% for a steam explosion escalation to develop. Despite these limiting factors, there are still (depending on scenario and triggering time) up to some hundreds of kilograms of liquid corium droplets available to participate in the energetic FCI process, resulting in severe pressure loads (Fig. 6). The pressure curves and pressure impulse curves (Fig. 6) are reasonably correlated to the corresponding explosivity criteria curves (Fig. 5) and mass of liquid melt droplets curves (Fig. 7), as was expected. The results for the central melt pour cases show that, in the initial stage of the melt pour, stronger explosions mainly occur for higher cavity water subcooling and higher melt pour driving pressure. The reason for this could be that higher water subcooling results in less void build up and that higher driving pressure increases the melt fragmentation. On the contrary, at the later stage of the simulations, stronger explosions mainly occur for lower water subcooling, probably due to less droplet solidification with lower water subcooling. But the influence of the water subcooling on the explosion strength is not very clear, indicating that in the considered subcooling range the effects of void build up and melt droplets solidification nearly compensate. The results of the side melt pour cases reveal that stronger explosions may be expected with a
www.intechopen.com
Nuclear Power – Operation, Safety and Environment
220
0
50
100
150
200
250
300
350
0 2 4 6 8 10
Pre
ssu
re (
MP
a)
Time (s)
C0-100 C0-80 C0-60 C2-100 C2-80 C2-60
0
0,05
0,1
0,15
0,2
0,25
0,3
0,35
0,4
0,45
0,5
0 2 4 6 8 10
Imp
uls
e (
MP
a.s
)
Time (s)
C0-100 C0-80 C0-60 C2-100 C2-80 C2-60
a) Central melt pour b)
0
20
40
60
80
100
120
0 2 4 6 8 10
Pre
ssu
re (
MP
a)
Time (s)
R0-100 R0-80 R0-60 R2-100 R2-80 R2-60
0
0,1
0,2
0,3
0,4
0,5
0,6
0,7
0 2 4 6 8 10
Imp
uls
e (
MP
a.s
)
Time (s)
R0-100 R0-80 R0-60 R2-100 R2-80 R2-60
c) Right side melt pour d)
0
20
40
60
80
100
120
140
0 2 4 6 8 10
Pre
ssu
re (
MP
a)
Time (s)
L0-100 L0-80 L0-60 L2-100 L2-80 L2-60
0
0,05
0,1
0,15
0,2
0,25
0,3
0,35
0,4
0,45
0 2 4 6 8 10
Imp
uls
e (
MP
a.s
)
Time (s)
L0-100 L0-80 L0-60 L2-100 L2-80 L2-60
e) Left side melt pour f)
Fig. 6. Calculated maximum pressures in the cavity (left) and maximum pressure impulses at the cavity walls (right) for performed explosion phase simulations. The time axis denotes the explosion triggering times.
www.intechopen.com
Simulation of Ex-Vessel Steam Explosion
221
depressurized primary system. The reason for this could be that with a pressurized primary system the melt is ejected sidewards on the cavity wall, sliding then into water at the wall, which hinders the formation of an extensive premixture. Moreover, with a pressurized system, already a tenth of a second after the start of the melt release gas starts to flow through the vessel opening into the cavity and pushes the water through the instrument tunnel out of the cavity, creating a highly voided region below the reactor vessel. For the side melt pour cases the influence of the water subcooling on the steam explosion strength seems to be somewhat stochastic, probably due to compensation effects of void buildup and melt droplets solidification in combination with the complex melt release dynamics. In general, the highest pressures and pressure impulses were reached in the initial stage of
the melt release (Fig. 6, Table 5). The highest pressure was obtained in case C2-60 (nearly
300 MPa) and the highest pressure impulse in case R0-80 (nearly 0.7 MPa·s). The maximum
pressure and the maximum pressure impulse present only a rough measure of the steam
explosion strength. To reveal the real damage potential of a steam explosion, the space and
time development of the pressure field has to be analysed. Therefore for the most explosive
central and side melt pour cases a detailed analysis was performed. As the criteria for
establishing the most explosive cases, the maximum pressure impulse was taken (Table 5).
For the central melt pour case the highest maximum pressure impulse was predicted for
case C2-80, but since in case C2-60 the maximum pressure impulse is only slightly lower and
remains high over a wide triggering time window (Fig. 6b), the latter was chosen for the
detailed analysis.
Pour location Maximum pressure Maximum impulse
p (MPa) Case I (MPa·s) Case
C 293.7 C2-60 0.47 C2-80
R 105.1 R0-60 0.66 R0-80
L 116.1 L2-80 0.40 L0-60
Table 5. Maximum pressures in the cavity and maximum pressure impulses at the cavity walls (cavity floor included) for different melt pour locations.
3.3 Detailed analysis The detailed analysis of the explosion simulation results was performed for the most
explosive central (C2-60), right side (R0-80) and left side (L0-60) melt pour cases. For each
melt pour case the pressure field, the corium fraction and the liquid water fraction during
the explosion were investigated in detail and the pressure development with corresponding
pressure impulses at different wall locations was analyzed. Here only the main results are
briefly presented.
In the central melt pour case C2-60, soon after the triggering of the explosion a high pressure peak occurs in the centre of the cavity floor. This high pressure peak of short duration is created due to geometrical reasons, since the pressure field build up in the outer premixture region is focused in the central part of the cavity due to the applied 2D cylindrical geometry. Consequently this high pressure peak can not be considered as realistic for a 3D explosion.
www.intechopen.com
Nuclear Power – Operation, Safety and Environment
222
0
1000
2000
3000
4000
5000
6000
7000
8000
9000
0 2 4 6 8 10
Ma
ss (
kg
)
Time (s)
<20% <40% <60% <80% <100% Total
a) Central melt pour: most explosive case C2-60
0
500
1000
1500
2000
2500
3000
3500
0 2 4 6 8 10
Ma
ss (
kg
)
Time (s)
<20% <40% <60% <80% <100% Total
b) Left side pour: most explosive case L0-60
0
500
1000
1500
2000
2500
0 2 4 6 8 10
Ma
ss (
kg
)
Time (s)
<20% <40% <60% <80% <100% Total
c) Right side pour: most explosive case R0-80
Fig. 7. Mass of liquid corium droplets in regions with different void fractions during premixing. The results are presented for regions with a void fraction below 20% (<20%) up to regions with a void fraction below 100% (<100%). In addition also the total (liquid and solid) corium droplets mass is presented (Total).
www.intechopen.com
Simulation of Ex-Vessel Steam Explosion
223
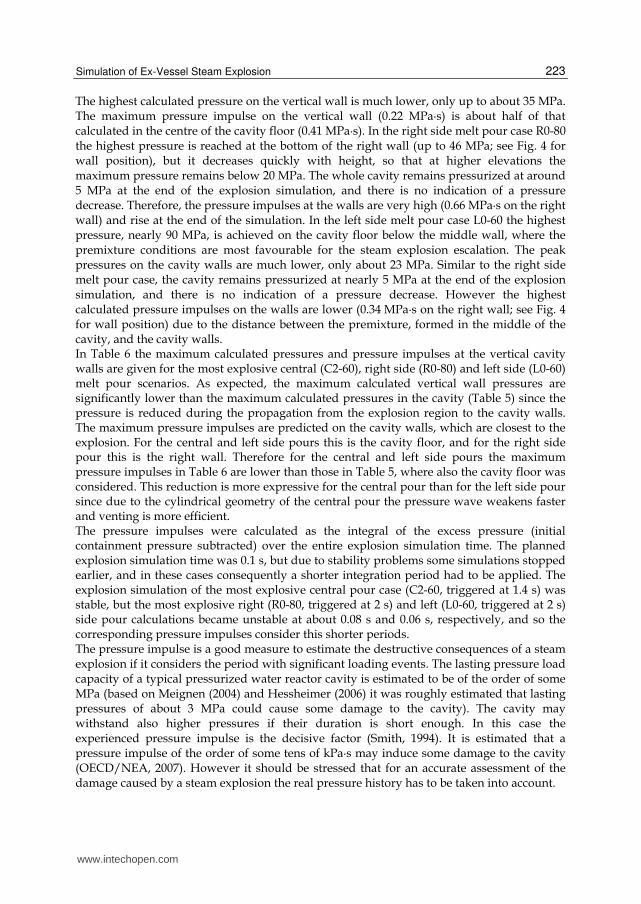
The highest calculated pressure on the vertical wall is much lower, only up to about 35 MPa. The maximum pressure impulse on the vertical wall (0.22 MPa·s) is about half of that calculated in the centre of the cavity floor (0.41 MPa·s). In the right side melt pour case R0-80 the highest pressure is reached at the bottom of the right wall (up to 46 MPa; see Fig. 4 for wall position), but it decreases quickly with height, so that at higher elevations the maximum pressure remains below 20 MPa. The whole cavity remains pressurized at around 5 MPa at the end of the explosion simulation, and there is no indication of a pressure decrease. Therefore, the pressure impulses at the walls are very high (0.66 MPa·s on the right wall) and rise at the end of the simulation. In the left side melt pour case L0-60 the highest pressure, nearly 90 MPa, is achieved on the cavity floor below the middle wall, where the premixture conditions are most favourable for the steam explosion escalation. The peak pressures on the cavity walls are much lower, only about 23 MPa. Similar to the right side melt pour case, the cavity remains pressurized at nearly 5 MPa at the end of the explosion simulation, and there is no indication of a pressure decrease. However the highest calculated pressure impulses on the walls are lower (0.34 MPa·s on the right wall; see Fig. 4 for wall position) due to the distance between the premixture, formed in the middle of the cavity, and the cavity walls. In Table 6 the maximum calculated pressures and pressure impulses at the vertical cavity walls are given for the most explosive central (C2-60), right side (R0-80) and left side (L0-60) melt pour scenarios. As expected, the maximum calculated vertical wall pressures are significantly lower than the maximum calculated pressures in the cavity (Table 5) since the pressure is reduced during the propagation from the explosion region to the cavity walls. The maximum pressure impulses are predicted on the cavity walls, which are closest to the explosion. For the central and left side pours this is the cavity floor, and for the right side pour this is the right wall. Therefore for the central and left side pours the maximum pressure impulses in Table 6 are lower than those in Table 5, where also the cavity floor was considered. This reduction is more expressive for the central pour than for the left side pour since due to the cylindrical geometry of the central pour the pressure wave weakens faster and venting is more efficient. The pressure impulses were calculated as the integral of the excess pressure (initial containment pressure subtracted) over the entire explosion simulation time. The planned explosion simulation time was 0.1 s, but due to stability problems some simulations stopped earlier, and in these cases consequently a shorter integration period had to be applied. The explosion simulation of the most explosive central pour case (C2-60, triggered at 1.4 s) was stable, but the most explosive right (R0-80, triggered at 2 s) and left (L0-60, triggered at 2 s) side pour calculations became unstable at about 0.08 s and 0.06 s, respectively, and so the corresponding pressure impulses consider this shorter periods. The pressure impulse is a good measure to estimate the destructive consequences of a steam explosion if it considers the period with significant loading events. The lasting pressure load capacity of a typical pressurized water reactor cavity is estimated to be of the order of some MPa (based on Meignen (2004) and Hessheimer (2006) it was roughly estimated that lasting pressures of about 3 MPa could cause some damage to the cavity). The cavity may withstand also higher pressures if their duration is short enough. In this case the experienced pressure impulse is the decisive factor (Smith, 1994). It is estimated that a pressure impulse of the order of some tens of kPa·s may induce some damage to the cavity (OECD/NEA, 2007). However it should be stressed that for an accurate assessment of the damage caused by a steam explosion the real pressure history has to be taken into account.
www.intechopen.com
Nuclear Power – Operation, Safety and Environment
224
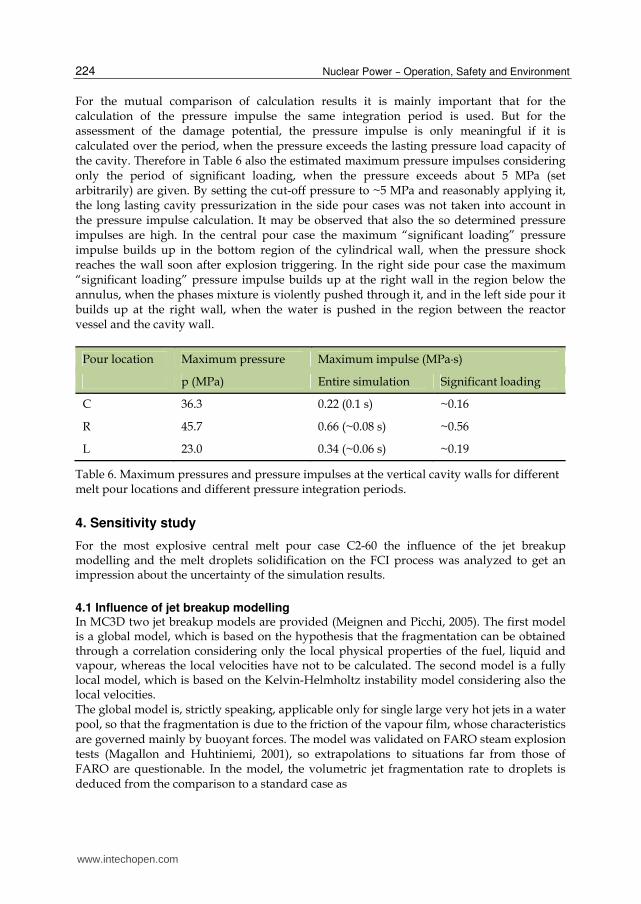
For the mutual comparison of calculation results it is mainly important that for the calculation of the pressure impulse the same integration period is used. But for the assessment of the damage potential, the pressure impulse is only meaningful if it is calculated over the period, when the pressure exceeds the lasting pressure load capacity of the cavity. Therefore in Table 6 also the estimated maximum pressure impulses considering only the period of significant loading, when the pressure exceeds about 5 MPa (set arbitrarily) are given. By setting the cut-off pressure to ~5 MPa and reasonably applying it, the long lasting cavity pressurization in the side pour cases was not taken into account in the pressure impulse calculation. It may be observed that also the so determined pressure impulses are high. In the central pour case the maximum “significant loading” pressure impulse builds up in the bottom region of the cylindrical wall, when the pressure shock reaches the wall soon after explosion triggering. In the right side pour case the maximum “significant loading” pressure impulse builds up at the right wall in the region below the annulus, when the phases mixture is violently pushed through it, and in the left side pour it builds up at the right wall, when the water is pushed in the region between the reactor vessel and the cavity wall.
Pour location Maximum pressure Maximum impulse (MPa·s)
p (MPa) Entire simulation Significant loading
C 36.3 0.22 (0.1 s) ~0.16
R 45.7 0.66 (~0.08 s) ~0.56
L 23.0 0.34 (~0.06 s) ~0.19
Table 6. Maximum pressures and pressure impulses at the vertical cavity walls for different melt pour locations and different pressure integration periods.
4. Sensitivity study
For the most explosive central melt pour case C2-60 the influence of the jet breakup modelling and the melt droplets solidification on the FCI process was analyzed to get an impression about the uncertainty of the simulation results.
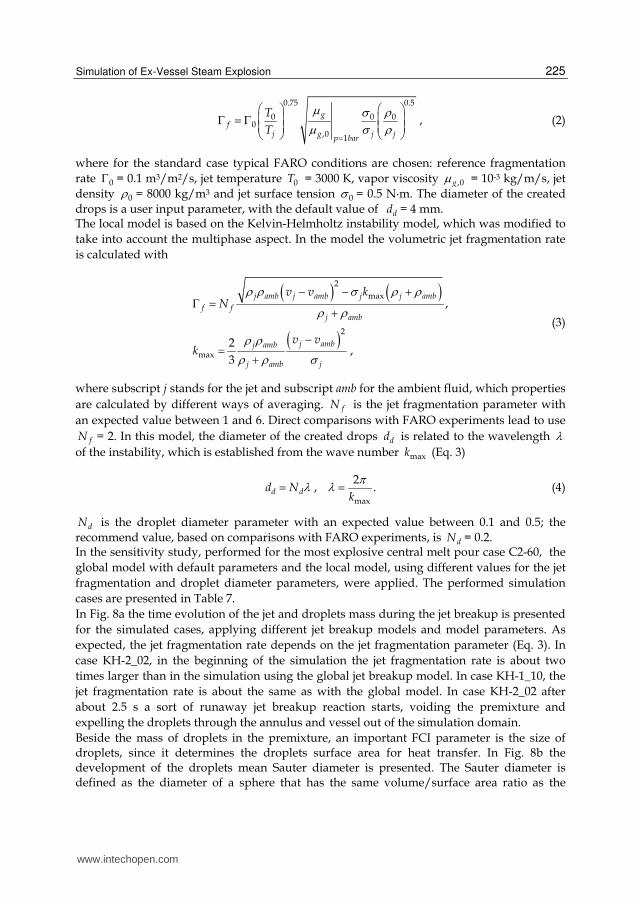
4.1 Influence of jet breakup modelling In MC3D two jet breakup models are provided (Meignen and Picchi, 2005). The first model is a global model, which is based on the hypothesis that the fragmentation can be obtained through a correlation considering only the local physical properties of the fuel, liquid and vapour, whereas the local velocities have not to be calculated. The second model is a fully local model, which is based on the Kelvin-Helmholtz instability model considering also the local velocities. The global model is, strictly speaking, applicable only for single large very hot jets in a water pool, so that the fragmentation is due to the friction of the vapour film, whose characteristics are governed mainly by buoyant forces. The model was validated on FARO steam explosion tests (Magallon and Huhtiniemi, 2001), so extrapolations to situations far from those of FARO are questionable. In the model, the volumetric jet fragmentation rate to droplets is deduced from the comparison to a standard case as
www.intechopen.com
Simulation of Ex-Vessel Steam Explosion
225
0.75 0.5
0 0 00
,0 1
,g
fj g j jp bar
T
T
(2)
where for the standard case typical FARO conditions are chosen: reference fragmentation
rate 0 = 0.1 m3/m2/s, jet temperature 0T = 3000 K, vapor viscosity ,0g = 10-3 kg/m/s, jet
density 0 = 8000 kg/m3 and jet surface tension 0 = 0.5 N·m. The diameter of the created
drops is a user input parameter, with the default value of dd = 4 mm. The local model is based on the Kelvin-Helmholtz instability model, which was modified to
take into account the multiphase aspect. In the model the volumetric jet fragmentation rate
is calculated with
2
max
2
max
,
2,
3
j amb j amb j j amb
f fj amb
j ambj amb
j amb j
v v kN
v vk
(3)
where subscript j stands for the jet and subscript amb for the ambient fluid, which properties
are calculated by different ways of averaging. fN is the jet fragmentation parameter with
an expected value between 1 and 6. Direct comparisons with FARO experiments lead to use
fN = 2. In this model, the diameter of the created drops dd is related to the wavelength
of the instability, which is established from the wave number maxk (Eq. 3)
max
2, .d dd N
k
(4)
dN is the droplet diameter parameter with an expected value between 0.1 and 0.5; the
recommend value, based on comparisons with FARO experiments, is dN = 0.2. In the sensitivity study, performed for the most explosive central melt pour case C2-60, the
global model with default parameters and the local model, using different values for the jet
fragmentation and droplet diameter parameters, were applied. The performed simulation
cases are presented in Table 7.
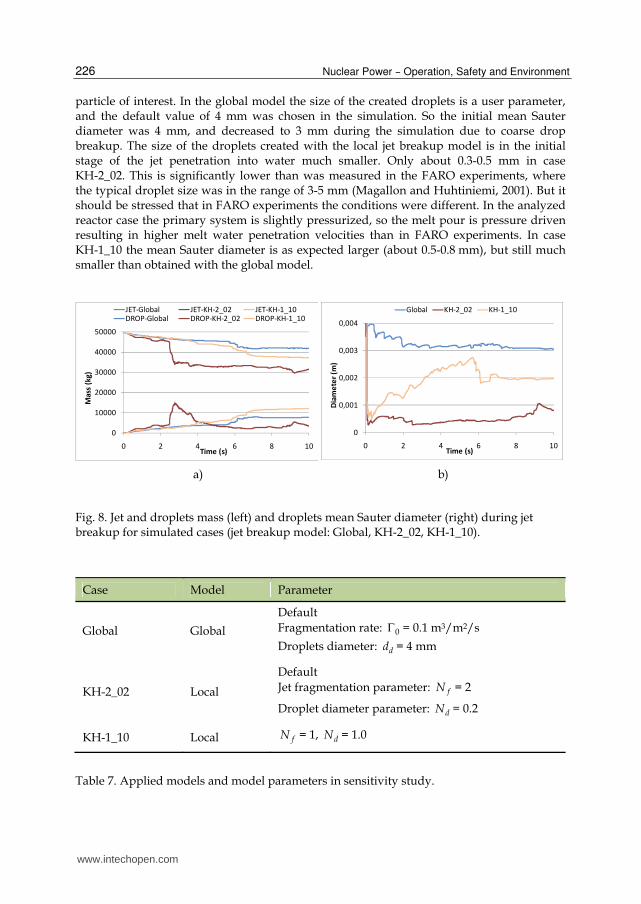
In Fig. 8a the time evolution of the jet and droplets mass during the jet breakup is presented
for the simulated cases, applying different jet breakup models and model parameters. As
expected, the jet fragmentation rate depends on the jet fragmentation parameter (Eq. 3). In
case KH-2_02, in the beginning of the simulation the jet fragmentation rate is about two
times larger than in the simulation using the global jet breakup model. In case KH-1_10, the
jet fragmentation rate is about the same as with the global model. In case KH-2_02 after
about 2.5 s a sort of runaway jet breakup reaction starts, voiding the premixture and
expelling the droplets through the annulus and vessel out of the simulation domain.
Beside the mass of droplets in the premixture, an important FCI parameter is the size of droplets, since it determines the droplets surface area for heat transfer. In Fig. 8b the development of the droplets mean Sauter diameter is presented. The Sauter diameter is defined as the diameter of a sphere that has the same volume/surface area ratio as the
www.intechopen.com
Nuclear Power – Operation, Safety and Environment
226
particle of interest. In the global model the size of the created droplets is a user parameter, and the default value of 4 mm was chosen in the simulation. So the initial mean Sauter diameter was 4 mm, and decreased to 3 mm during the simulation due to coarse drop breakup. The size of the droplets created with the local jet breakup model is in the initial stage of the jet penetration into water much smaller. Only about 0.3-0.5 mm in case KH-2_02. This is significantly lower than was measured in the FARO experiments, where the typical droplet size was in the range of 3-5 mm (Magallon and Huhtiniemi, 2001). But it should be stressed that in FARO experiments the conditions were different. In the analyzed reactor case the primary system is slightly pressurized, so the melt pour is pressure driven resulting in higher melt water penetration velocities than in FARO experiments. In case KH-1_10 the mean Sauter diameter is as expected larger (about 0.5-0.8 mm), but still much smaller than obtained with the global model.
0
10000
20000
30000
40000
50000
0 2 4 6 8 10
Ma
ss (
kg
)
Time (s)
JET-Global JET-KH-2_02 JET-KH-1_10
DROP-Global DROP-KH-2_02 DROP-KH-1_10
0
0,001
0,002
0,003
0,004
0 2 4 6 8 10
Dia
me
ter
(m)
Time (s)
Global KH-2_02 KH-1_10
a) b)
Fig. 8. Jet and droplets mass (left) and droplets mean Sauter diameter (right) during jet breakup for simulated cases (jet breakup model: Global, KH-2_02, KH-1_10).
Case Model Parameter
Global Global
Default
Fragmentation rate: 0 = 0.1 m3/m2/s
Droplets diameter: dd = 4 mm
KH-2_02 Local
Default
Jet fragmentation parameter: fN = 2
Droplet diameter parameter: dN = 0.2
KH-1_10 Local fN = 1, dN = 1.0
Table 7. Applied models and model parameters in sensitivity study.
www.intechopen.com
Simulation of Ex-Vessel Steam Explosion
227
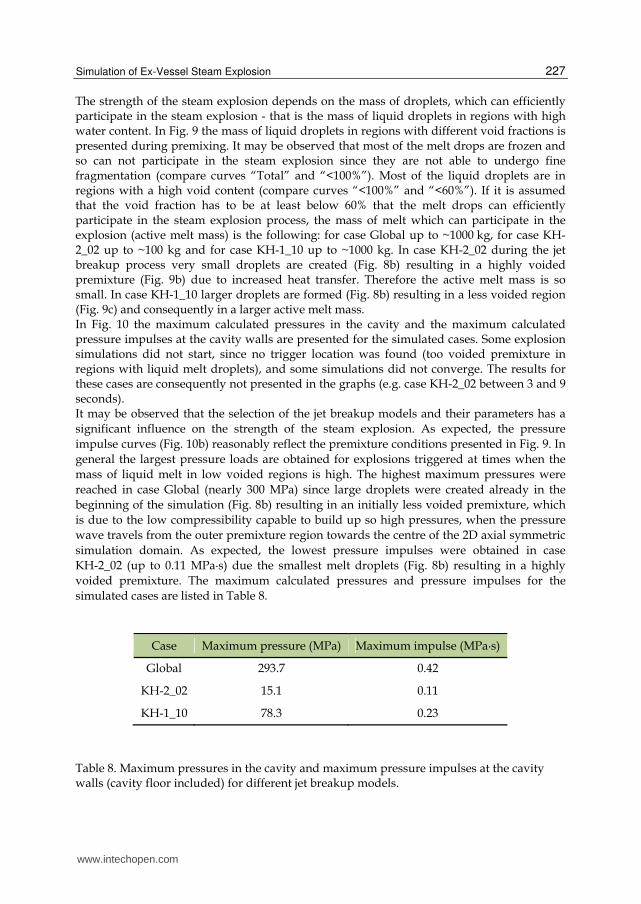
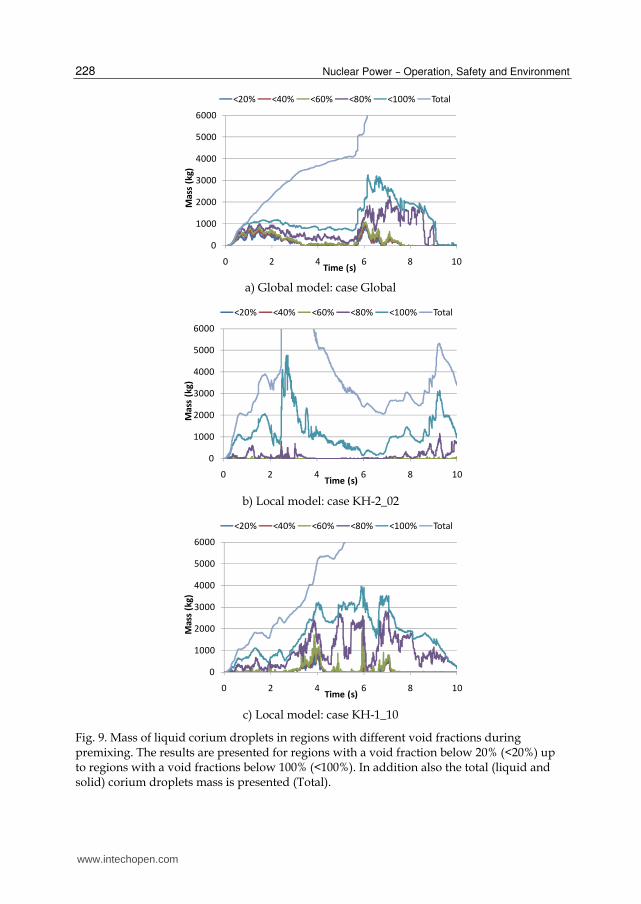
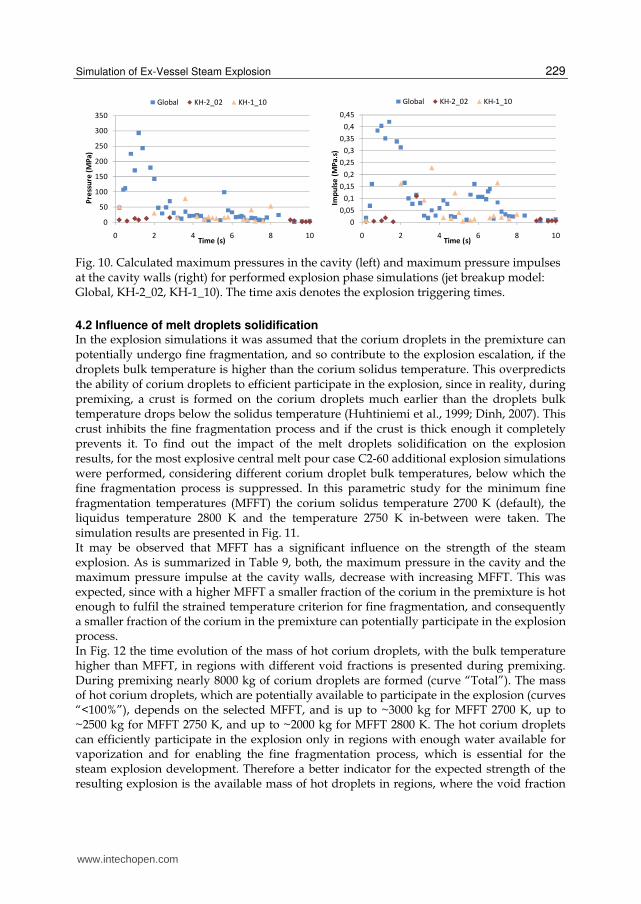
The strength of the steam explosion depends on the mass of droplets, which can efficiently participate in the steam explosion - that is the mass of liquid droplets in regions with high water content. In Fig. 9 the mass of liquid droplets in regions with different void fractions is presented during premixing. It may be observed that most of the melt drops are frozen and so can not participate in the steam explosion since they are not able to undergo fine fragmentation (compare curves “Total” and “<100%”). Most of the liquid droplets are in regions with a high void content (compare curves “<100%” and “<60%”). If it is assumed that the void fraction has to be at least below 60% that the melt drops can efficiently participate in the steam explosion process, the mass of melt which can participate in the explosion (active melt mass) is the following: for case Global up to ~1000 kg, for case KH-2_02 up to ~100 kg and for case KH-1_10 up to ~1000 kg. In case KH-2_02 during the jet breakup process very small droplets are created (Fig. 8b) resulting in a highly voided premixture (Fig. 9b) due to increased heat transfer. Therefore the active melt mass is so small. In case KH-1_10 larger droplets are formed (Fig. 8b) resulting in a less voided region (Fig. 9c) and consequently in a larger active melt mass. In Fig. 10 the maximum calculated pressures in the cavity and the maximum calculated pressure impulses at the cavity walls are presented for the simulated cases. Some explosion simulations did not start, since no trigger location was found (too voided premixture in regions with liquid melt droplets), and some simulations did not converge. The results for these cases are consequently not presented in the graphs (e.g. case KH-2_02 between 3 and 9 seconds). It may be observed that the selection of the jet breakup models and their parameters has a
significant influence on the strength of the steam explosion. As expected, the pressure
impulse curves (Fig. 10b) reasonably reflect the premixture conditions presented in Fig. 9. In
general the largest pressure loads are obtained for explosions triggered at times when the
mass of liquid melt in low voided regions is high. The highest maximum pressures were
reached in case Global (nearly 300 MPa) since large droplets were created already in the
beginning of the simulation (Fig. 8b) resulting in an initially less voided premixture, which
is due to the low compressibility capable to build up so high pressures, when the pressure
wave travels from the outer premixture region towards the centre of the 2D axial symmetric
simulation domain. As expected, the lowest pressure impulses were obtained in case
KH-2_02 (up to 0.11 MPa·s) due the smallest melt droplets (Fig. 8b) resulting in a highly
voided premixture. The maximum calculated pressures and pressure impulses for the
simulated cases are listed in Table 8.
Case Maximum pressure (MPa) Maximum impulse (MPa·s)
Global 293.7 0.42
KH-2_02 15.1 0.11
KH-1_10 78.3 0.23
Table 8. Maximum pressures in the cavity and maximum pressure impulses at the cavity walls (cavity floor included) for different jet breakup models.
www.intechopen.com
Nuclear Power – Operation, Safety and Environment
228
0
1000
2000
3000
4000
5000
6000
0 2 4 6 8 10
Ma
ss (
kg
)
Time (s)
<20% <40% <60% <80% <100% Total
a) Global model: case Global
0
1000
2000
3000
4000
5000
6000
0 2 4 6 8 10
Ma
ss (
kg
)
Time (s)
<20% <40% <60% <80% <100% Total
b) Local model: case KH-2_02
0
1000
2000
3000
4000
5000
6000
0 2 4 6 8 10
Ma
ss (
kg
)
Time (s)
<20% <40% <60% <80% <100% Total
c) Local model: case KH-1_10
Fig. 9. Mass of liquid corium droplets in regions with different void fractions during premixing. The results are presented for regions with a void fraction below 20% (<20%) up to regions with a void fractions below 100% (<100%). In addition also the total (liquid and solid) corium droplets mass is presented (Total).
www.intechopen.com
Simulation of Ex-Vessel Steam Explosion
229
0
50
100
150
200
250
300
350
0 2 4 6 8 10
Pre
ssu
re (
MP
a)
Time (s)
Global KH-2_02 KH-1_10
0
0,05
0,1
0,15
0,2
0,25
0,3
0,35
0,4
0,45
0 2 4 6 8 10
Imp
uls
e (
MP
a.s
)
Time (s)
Global KH-2_02 KH-1_10
Fig. 10. Calculated maximum pressures in the cavity (left) and maximum pressure impulses at the cavity walls (right) for performed explosion phase simulations (jet breakup model: Global, KH-2_02, KH-1_10). The time axis denotes the explosion triggering times.
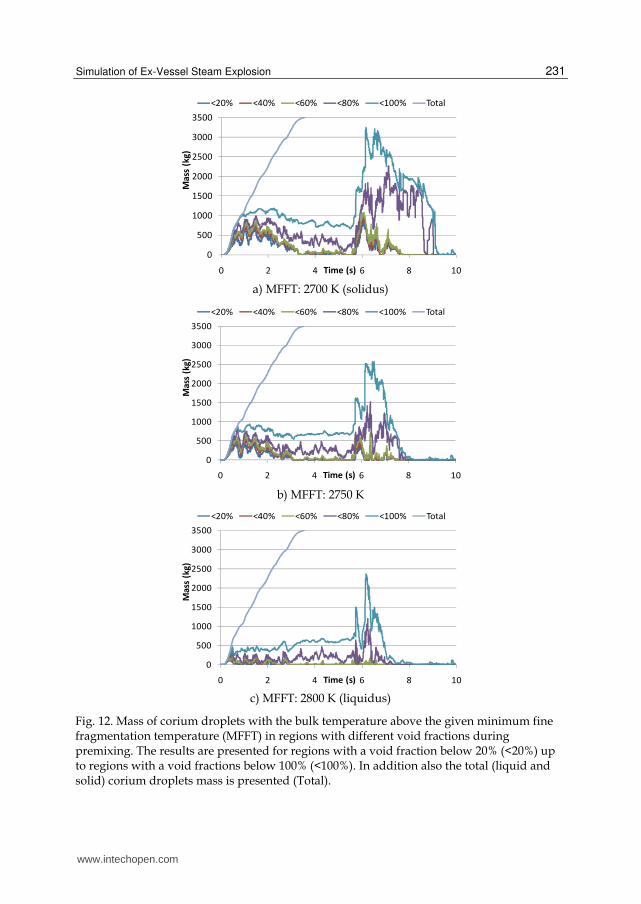
4.2 Influence of melt droplets solidification In the explosion simulations it was assumed that the corium droplets in the premixture can potentially undergo fine fragmentation, and so contribute to the explosion escalation, if the droplets bulk temperature is higher than the corium solidus temperature. This overpredicts the ability of corium droplets to efficient participate in the explosion, since in reality, during premixing, a crust is formed on the corium droplets much earlier than the droplets bulk temperature drops below the solidus temperature (Huhtiniemi et al., 1999; Dinh, 2007). This crust inhibits the fine fragmentation process and if the crust is thick enough it completely prevents it. To find out the impact of the melt droplets solidification on the explosion results, for the most explosive central melt pour case C2-60 additional explosion simulations were performed, considering different corium droplet bulk temperatures, below which the fine fragmentation process is suppressed. In this parametric study for the minimum fine fragmentation temperatures (MFFT) the corium solidus temperature 2700 K (default), the liquidus temperature 2800 K and the temperature 2750 K in-between were taken. The simulation results are presented in Fig. 11. It may be observed that MFFT has a significant influence on the strength of the steam explosion. As is summarized in Table 9, both, the maximum pressure in the cavity and the maximum pressure impulse at the cavity walls, decrease with increasing MFFT. This was expected, since with a higher MFFT a smaller fraction of the corium in the premixture is hot enough to fulfil the strained temperature criterion for fine fragmentation, and consequently a smaller fraction of the corium in the premixture can potentially participate in the explosion process. In Fig. 12 the time evolution of the mass of hot corium droplets, with the bulk temperature higher than MFFT, in regions with different void fractions is presented during premixing. During premixing nearly 8000 kg of corium droplets are formed (curve “Total”). The mass of hot corium droplets, which are potentially available to participate in the explosion (curves “<100%”), depends on the selected MFFT, and is up to ~3000 kg for MFFT 2700 K, up to ~2500 kg for MFFT 2750 K, and up to ~2000 kg for MFFT 2800 K. The hot corium droplets can efficiently participate in the explosion only in regions with enough water available for vaporization and for enabling the fine fragmentation process, which is essential for the steam explosion development. Therefore a better indicator for the expected strength of the resulting explosion is the available mass of hot droplets in regions, where the void fraction
www.intechopen.com

Nuclear Power – Operation, Safety and Environment
230
is not too large, that is in regions, where the vapour fraction is below 60% (active melt mass). The so established corium droplet masses are much lower, up to ~900 kg for MFFT 2700 K, up to ~600 kg for MFFT 2750 K and up to ~300 kg for MFFT 2800 K. These differences in the active melt masses are reasonable reflected in the calculated pressure loads presented in Fig.11 and Table 9.
0
50
100
150
200
250
300
350
0 2 4 6 8 10
Pre
ssu
re (
MP
a)
Time (s)
2700 2750 2800
0
0,05
0,1
0,15
0,2
0,25
0,3
0,35
0,4
0,45
0 2 4 6 8 10
Imp
uls
e (
MP
a.s
)
Time (s)
2700 2750 2800
Fig. 11. Calculated maximum pressures in the cavity (left) and maximum pressure impulses at the cavity walls (right) for performed explosion phase simulations (minimum fine fragmentation temperature: 2700 K, 2750 K, 2800 K). The time axis denotes the explosion triggering times.
Minimum fine fragmentation temperature (K)
Maximum pressure (MPa)
Maximum impulse (MPa·s)
2700 293.7 0.42
2750 235.0 0.21
2800 114.7 0.11
Table 9. Maximum pressures in the cavity and maximum pressure impulses at the cavity walls (cavity floor included) for different minimum fine fragmentation temperatures.
www.intechopen.com
Simulation of Ex-Vessel Steam Explosion
231
0
500
1000
1500
2000
2500
3000
3500
0 2 4 6 8 10
Ma
ss (
kg
)
Time (s)
<20% <40% <60% <80% <100% Total
a) MFFT: 2700 K (solidus)
0
500
1000
1500
2000
2500
3000
3500
0 2 4 6 8 10
Ma
ss (
kg
)
Time (s)
<20% <40% <60% <80% <100% Total
b) MFFT: 2750 K
0
500
1000
1500
2000
2500
3000
3500
0 2 4 6 8 10
Ma
ss (
kg
)
Time (s)
<20% <40% <60% <80% <100% Total
c) MFFT: 2800 K (liquidus)
Fig. 12. Mass of corium droplets with the bulk temperature above the given minimum fine fragmentation temperature (MFFT) in regions with different void fractions during premixing. The results are presented for regions with a void fraction below 20% (<20%) up to regions with a void fractions below 100% (<100%). In addition also the total (liquid and solid) corium droplets mass is presented (Total).
www.intechopen.com
Nuclear Power – Operation, Safety and Environment
232
5. Conclusions
An assessment of ex-vessel steam explosion pressure loads in a typical pressurized water reactor cavity was performed with the FCI code MC3D. To be able to perform a series of simulations, the reactor cavity was modelled in a simplified 2D geometry, trying to assure that the 2D simulation results reflect qualitatively and quantitatively as closely as possible the conditions in a real reactor cavity. A spectrum of relevant scenarios has been analyzed and a sensitivity study has been performed addressing the influence of the jet breakup modelling and the melt droplets solidification on the FCI process. The simulation results revealed that the strongest steam explosions may be expected in the initial stage of the melt release, when the void build up is not so extensive. The results for the central melt pour cases showed that, in the initial stage of the melt pour, stronger explosions mainly occur for higher water subcooling and higher primary system overpressure. An explanation for this could be that higher water subcooling results in less void build up and that higher driving pressure increases the melt fragmentation. At the later stage of the simulations, stronger explosions mainly occur for lower subcooling, probably due to less droplet solidification with lower water subcooling. However the influence of the water subcooling on the explosion strength is not very clear, indicating that in the considered subcooling range the effects of void build up and melt droplets solidification nearly compensate. The results of the side melt pour cases revealed that stronger explosions may be expected with a depressurized primary system, since with a pressurized primary system the melt is ejected sideward on the cavity wall hindering the formation of an extensive premixture; moreover gas flows through the vessel opening into the cavity forming a highly voided region below the reactor vessel. The high calculated pressure loads in the side pour cases could be attributed to the used 2D slice modelling of the reactor cavity, where the melt is released in the form of an infinite wide curtain and the explosion is triggered through the whole width of that curtain. This is quite conservative since, due to the 2D treatment, venting and pressure relief is underpredicted and the explosion development is overpredicted. So the performed side pour simulations should be regarded more as providing some basic qualitative insight in the FCI behaviour for side pour scenarios. For a more reliable estimation of the expected pressure loads in side pour scenarios a 3D modelling approach would be needed. The central pour cases are closer to the reality since for a central melt pour the 2D axial symmetric representation is quite suitable. So the reliability of central pour simulation results is higher than the reliability of side pour simulation results. The sensitivity study revealed that the jet breakup and the melt droplets solidification have a significant influence on the strength of the steam explosion, and consequently have to be adequately modelled. Especially the correct establishment of the size of the created melt droplets during jet breakup is crucial, since the droplets size defines the melt surface area for heat transfer, which governs the melt droplets solidification and the void build. Both, the melt droplets solidification and the void build up may significantly reduce the strength of the steam explosion, as demonstrated by the preformed simulations. The nature of FCI is very complex and already small modelling changes can have a significant influence on the simulation results. Therefore additional experimental and analytical work is needed, as being carried out in the OECD programme SERENA phase 2 and in the network of excellence SARNET-2 within the 7th EU framework program, to be able to reliably extrapolate the various experimental findings to reactor conditions and to perform reliable reactor simulations.
www.intechopen.com
Simulation of Ex-Vessel Steam Explosion
233
6. Acknowledgments
The author acknowledges the financial support of the Slovenian Research Agency within the research program P2-0026, the research project J2-2158, and the cooperative CEA-JSI research project (contract number 1000-0810-38400013). The Jožef Stefan Institute is a member of the Severe Accident Research Network of Excellence (SARNET2) within the 7th EU Framework Program.
7. References
Albiol, T., Haste, T., van Dorsselaere, J.P., Journeau, C., Meyer, L., Chaumont, B., Sehgal, B.R., Schwinges, B., Beraha, D., Annunziato, A., Zeyen, R., (2008). Summary of SARNET achievements. ERMSAR conference, 23–25 September 2008, Nesseber, Bulgaria
Berthoud, G. (2000). Vapor explosions. Annu Rev Fluid Mech 32, pp. 573-611, ISSN 0066-4189 Corradini, M.L., Kim, B.J., Oh, M.D. (1988). Vapor Explosions in Light Water-Reactors – a
Review of Theory and Modeling. Prog Nucl Energ 22, pp. 1-117, ISSN 0149-1970 Corradini, M.L. (1991). Vapor explosions: a review of experiments for accident analysis.
Nuclear Safety 32 (3), pp. 337–362, ISSN 0029-5604 Dinh, T.N. (2007). Material Property Effect in Steam Explosion Energetics: Revisited,
NURETH-12, Pittsburgh, Pennsylvania, USA, pp. 1–19 Esmaili, H., Khatib-Rahbar, M. (2005). Analysis of likelihood of lower head failure and ex-
vessel fuel coolant interaction energetics for AP1000. Nucl Eng Des 235, pp. 1583-1605, ISSN 0029-5493
Hessheimer, M.F., Dameron, R.A. (2006). Containment Integrity Research at Sandia National Laboratories—An Overview. NUREG/CR-6906, SAND2006-2274P
Huhtiniemi, I., Magallon, D., Hohmann, H. (1999). Results of recent KROTOS FCI tests: aluminia versus corium melts. Nucl Eng Des 189, pp. 379–389, ISSN 0029-5493
Kawabata, O. (2004). Analyses of Ex-Vessel Steam Explosion and its Structural Dynamic Response for a Typical PWR Plant. ICONE-12, Arlington, VA, USA, pp. 1–9
Krieg, R., Dolensky, B., Goller, B., Hailfinger, G., Jordan, T., Messemer, G., Prothmann, N., Stratmanns, E. (2003). Load carrying capacity of a reactor vessel head under molten core slug impact - Final report including recent experimental findings. Nucl Eng Des 223, pp. 237-253, ISSN 0029-5493
Magallon, D., Huhtiniemi, I. (2001). Corium melt quenching tests at low pressure and subcooled water in FARO. Nucl Eng Des 204, pp. 369–376, ISSN 0029-5493
Meignen, R., Dupas, J., Chaumont, B. (2003). First evaluations of Ex-Vessel Fuel-Coolant Interaction with MC3D. NURETH-10, Seoul, Korea, pp. 1–18
Meignen, R., Dupas, J. (2004). Analysis of Ex-Vessel Fuel Coolant Interaction Issue with MC3D. CSARP 2004, Arlington, VA, USA
Meignen, R. (2005). Status of the Qualification Program of the Multiphase Flow Code MC3D, Proceedings of ICAPP ‘05, Seoul, Korea, pp. 1–12
Meignen, R., Picchi, S. (2005). MC3D Version 3.5: User’s Guide. IRSN Report, NT/DSR/SAGR/05-84
Moriyama, K., Takagi, S., Muramatsu, K., Nakamura, H., Maruyama, Y. (2006). Evaluation of containment failure probability by ex-vessel steam explosion in Japanese LWR plants. Journal of Nuclear Science and Technology 43 (7), pp. 774–784, ISSN 0022-3131
www.intechopen.com

Nuclear Power – Operation, Safety and Environment
234
OECD/NEA (2007). OECD Research Programme on Fuel-Coolant Interaction; Steam Explosion Resolution for Nuclear Applications – SERENA; Final Report. NEA/CSNI/R(2007)11.
OECD/NEA (2008). Agreement on the OECD/NEA SERENA Project – To address remaining issues on fuel-coolant interaction mechanisms and their effect on ex-vessel steam explosion energetics
Sehgal, B.R. (2006). Stabilization and termination of severe accidents in LWRs. Nucl Eng Des 236, pp. 1941-1952, ISSN 0029-5493
Sehgal, B.R., Piluso, P., Trambauer, K., Adroguer, B., Fichot, F., Müller, C., Meyer, L., Breitung, W., Magallon, D., Journeau, C., Alsmeyer, H., Housiadas, C., Clement, B., L., A.M., Chaumont, B., Ivanov, I., Marguet, S., Van Dorsselaere, J.P., Fleurot, J., Giordano, G., Cranga, M. (2008). SARNET lecture notes on nuclear reactor severe accident phenomenology. CEA, France, p. 415
Seiler, J.M., Tourniaire, B., Defoort, F., Froment, K. (2007). Consequences of material effects on in-vessel retention. Nucl Eng Des 237, 1752–1758, ISSN 0029-5493
Schwinges, B., Journeau, C., Haste, T., Meyer, L., Tromm, W., Trambauer, K., Members, S. (2010). Ranking of severe accident research priorities. Prog Nucl Energ 52, pp. 11-18, ISSN 0149-1970
Smith, P.D., Hetherington, J.G. (1994). Blast and Ballistic Loadings of Structures. Butterworth-Heinemann Ltd., Oxford, ISBN 0 7506 2024 2
Theofanous, T.G. (1995). The Study of Steam Explosions in Nuclear Systems. Nucl Eng Des 155, pp. 1-26, ISSN 0029-5493
Turland, B.D., Dobson, G.P. (1996). Nuclear science and technology, Molten fuel coolant interactions: a state of the art report
WASH-1400 (1975). Reactor safety study: An assessment of accident risks in U.S. commercial nuclear power plants. U.S. Nuclear Regulatory Commission
www.intechopen.com
Nuclear Power - Operation, Safety and EnvironmentEdited by Dr. Pavel Tsvetkov
ISBN 978-953-307-507-5Hard cover, 368 pagesPublisher InTechPublished online 06, September, 2011Published in print edition September, 2011
InTech EuropeUniversity Campus STeP Ri Slavka Krautzeka 83/A 51000 Rijeka, Croatia Phone: +385 (51) 770 447 Fax: +385 (51) 686 166
InTech ChinaUnit 405, Office Block, Hotel Equatorial Shanghai No.65, Yan An Road (West), Shanghai, 200040, China
Phone: +86-21-62489820 Fax: +86-21-62489821
Today’s nuclear reactors are safe and highly efficient energy systems that offer electricity and a multitudeof co-generation energy products ranging from potable water to heat for industrial applications. At the sametime, catastrophic earthquake and tsunami events in Japan resulted in the nuclear accident that forced us torethink our approach to nuclear safety, design requirements and facilitated growing interests in advancednuclear energy systems, next generation nuclear reactors, which are inherently capable to withstand naturaldisasters and avoid catastrophic consequences without any environmental impact. This book is one in a seriesof books on nuclear power published by InTech. Under the single-volume cover, we put together such topicsas operation, safety, environment and radiation effects. The book is not offering a comprehensive coverage ofthe material in each area. Instead, selected themes are highlighted by authors of individual chaptersrepresenting contemporary interests worldwide. With all diversity of topics in 16 chapters, the integratedsystem analysis approach of nuclear power operation, safety and environment is the common thread. Thegoal of the book is to bring nuclear power to our readers as one of the promising energy sources that has aunique potential to meet energy demands with minimized environmental impact, near-zero carbon footprint,and competitive economics via robust potential applications. The book targets everyone as its potentialreadership groups - students, researchers and practitioners - who are interested to learn about nuclear power.
How to referenceIn order to correctly reference this scholarly work, feel free to copy and paste the following:
Matjaz ̌ Leskovar (2011). Simulation of Ex-Vessel Steam Explosion, Nuclear Power - Operation, Safety andEnvironment, Dr. Pavel Tsvetkov (Ed.), ISBN: 978-953-307-507-5, InTech, Available from:http://www.intechopen.com/books/nuclear-power-operation-safety-and-environment/simulation-of-ex-vessel-steam-explosion
www.intechopen.com

www.intechopen.com