SIMULATION OF COLD DIE COMPACTION ALUMINA POWDER … paper JtME… · SIMULATION OF COLD DIE...
21
Trends in Mechanical Engineering& Technology Volume 1, Issue 1, February, 2011, Pages 1-21. _____________________________________________________________________________________________ © STM Journals 2011. All Rights Reserved. 1 SIMULATION OF COLD DIE COMPACTION ALUMINA POWDER K. Mohammed Jasim Kadhim 1 *, Adil A. Alwan 2 , Iman J. Abed 3 1 Department of Production Engineering and Metallurgy, University of Technology, Baghdad, Iraq 2 College of Engineering, University of Bayblon, Baibal, Iraq 3 College of Engineering, University of Kufa, Najaf, Iraq *Author for Correspondence email: [email protected] 1. Introduction Powder compaction is a commonly used technique in numerous fields, including the powder technology, geologic, pharmaceutical, and thermal battery industries (Portal, Euvrarde, Tailhades and Rousset, 1993). Uniaxial pressing consists of compacting the pressing powder contained in a rigid cavity, by applying a pressure in a single axial direction with one or more rigid punches. The various pressing techniques differ in the movement of the basic mould elements: top punch, bottom punch and die. In a single action, a uniaxial pressing pressure is applied through the top punch, which enters the cavity holding the pressing powder. After the compacting, the green piece and the top punch withdraw and the movement of the lower punch ejects the piece from the mould (Wagle, Engel, Liu and German, 2000). The compaction mechanism of different material powders is different from each other and the formation ABSTRACT Compaction process was analyzed mathematically by predicting a steady-state mathematical model in order to give more description and understanding for the mechanism of this process. Numerical investigation has been carried out on axisymmetric cylindrical parts using the finite difference method with relaxation technique to examine the physical significance of constitutive model to produce the pressure gradients during compaction. The pressure distribution model is then typically coupled with empirical functions relating pressure and density to obtain a green density distribution at all nodes in the green compacts. The model has addressed the influence of frictional forces acting at the powder and die walls interfaces which dissipate the applied pressure throughout the compact. The effect of the compact geometry has a similar effect on the uniformity of green pressure and density distributions through the compact. It was found that a small aspect ratio resulted in a more uniform distribution than a higher aspect ratio. Therefore, the model seems to work better for the lower aspect ratio. The constitutive model predicts accurately the pressure and density distributions during compaction process. Keywords: Finite difference method; Die compaction; Green density distribution; Aspect ratio; Alumina powder; Relaxation technique
-
Upload
vuongxuyen -
Category
Documents
-
view
216 -
download
1
Transcript of SIMULATION OF COLD DIE COMPACTION ALUMINA POWDER … paper JtME… · SIMULATION OF COLD DIE...
Trends in Mechanical Engineering& Technology
Volume 1, Issue 1, February, 2011, Pages 1-21.
_____________________________________________________________________________________________
© STM Journals 2011. All Rights Reserved. 1
SIMULATION OF COLD DIE COMPACTION ALUMINA POWDER
K. Mohammed Jasim Kadhim1*, Adil A. Alwan
2, Iman J. Abed
3
1Department of Production Engineering and Metallurgy, University of Technology, Baghdad, Iraq
2College of Engineering, University of Bayblon, Baibal, Iraq
3College of Engineering, University of Kufa, Najaf, Iraq
*Author for Correspondence email: [email protected]
1. Introduction
Powder compaction is a commonly used
technique in numerous fields, including the
powder technology, geologic,
pharmaceutical, and thermal battery
industries (Portal, Euvrarde, Tailhades and
Rousset, 1993). Uniaxial pressing consists
of compacting the pressing powder
contained in a rigid cavity, by applying a
pressure in a single axial direction with one
or more rigid punches. The various pressing
techniques differ in the movement of the
basic mould elements: top punch, bottom
punch and die. In a single action, a uniaxial
pressing pressure is applied through the top
punch, which enters the cavity holding the
pressing powder. After the compacting, the
green piece and the top punch withdraw and
the movement of the lower punch ejects the
piece from the mould (Wagle, Engel, Liu
and German, 2000). The compaction
mechanism of different material powders is
different from each other and the formation
ABSTRACT
Compaction process was analyzed mathematically by predicting a steady-state mathematical
model in order to give more description and understanding for the mechanism of this process.
Numerical investigation has been carried out on axisymmetric cylindrical parts using the finite
difference method with relaxation technique to examine the physical significance of
constitutive model to produce the pressure gradients during compaction. The pressure
distribution model is then typically coupled with empirical functions relating pressure and
density to obtain a green density distribution at all nodes in the green compacts. The model
has addressed the influence of frictional forces acting at the powder and die walls interfaces
which dissipate the applied pressure throughout the compact. The effect of the compact
geometry has a similar effect on the uniformity of green pressure and density distributions
through the compact. It was found that a small aspect ratio resulted in a more uniform
distribution than a higher aspect ratio. Therefore, the model seems to work better for the lower
aspect ratio. The constitutive model predicts accurately the pressure and density distributions
during compaction process.
Keywords: Finite difference method; Die compaction; Green density distribution; Aspect
ratio; Alumina powder; Relaxation technique
Trends in Mechanical Engineering& Technology
Volume 1, Issue 1, February, 2011, Pages 1-21.
_____________________________________________________________________________________________
© STM Journals 2011. All Rights Reserved. 2
of coherent compact is governed by a
number of mechanisms (Mani, Tabil and
Sokhansanj, 2004). The compaction of a
given powder is conventionally divided into
many stages and each stage is considered to
be interrelated in terms of the physical and
mechanical properties of powder particles.
The early stages of compaction are
characterized by particle rearrangement
(Morales, Aune, Seetharaman and Grinder,
2003; Lui, 2000) During this stage, particles
rearrange themselves to form packed mass.
The original particles retain most of their
properties, although energy is dissipated due
to interparticle and particle-to-die walls
friction. The shape and initial porosity of
powder particles are important material
characteristics at the first stage, where
sliding and plastic deformation or fractures
play an important role. Generally, at the
initial stage of compaction, the powder is
moved inside the die reducing the porosity
(Park, Han, Oh and Song, 1999). At high
pressures, the particles are forced against
each other even more and undergo elastic
and plastic deformation, thereby increasing
interparticle contact. Further densification
during compaction takes place due to the
mechanical interactions at the contact
between neighboring particles. The final
stage is considered to be almost entirely due
to cold working of the bulk material and is
affected by deformation and work hardening
of particles Aydin, Briscoe and Sanliturk,
1996; Bejarano, Rieva and Prado, 2003;
Chtourou, Guillot and Gakwaya, 2002;
Chtourou, Guillot and Gakwaya, 2002; Lee
and Kim, 2002; Lewis and Khoei, 1998;
Michrafy, Ringebacher and Tchoreloff,
2002; Pivinskii, Dyakin and Dyakin, 2006;
Shinohara, Okumiya, Hotta, Nakahira, Naito
and Uematsu, 1999; Grigor’ev, Maiboroda,
Panfilov and Shtern, 2003; Portal, Euvrard,
Tailhades and Rousset, 1999; Mujahid,
Gureshi and Islam and Khan, 1998). Many
studies have been made to determine the
mechanisms involved during compaction
process. The finite element method has been
widely used to simulate powder compaction
(Secondi, 2002) and Gaboriault, 2003).
Therefore, the present research is an attempt
to understand the compaction phenomenon
through developing a mathematical model.
An axisymmetric finite difference steady
state mathematical model has been
developed to simulate the complete pressure
response of the system.
2.Constitutive models for powder
technology
Various approaches to model the
compaction processes using finite element
methods were available in literature. Many
kinds of powder compaction equations have
been proposed. Biba, Keife and Stahlberg
(1993) studied theoretically for plane-strain
conditions for uniaxial compaction of
powders. The analysis is being focused
upon the material flow into the holes
between the powder particles. The original
powder material is assumed to be building
up of close packed cylinders of equal size.
The investigation is carried by means of
step-wise calculation. It is based upon a
finite element approach. The agreement
between the material flows as determined
from plasticine experiments and that from
the finite element analysis, which latter
incorporates the plasticine constitutive
equation is good. Theory and experiment are
in acceptable agreement also in respect of
the step-wise change of shape of the
boundary surface defining the holes. It has
been found that, the material flows are very
sensitive to the mechanical properties of the
Trends in Mechanical Engineering& Technology
Volume 1, Issue 1, February, 2011, Pages 1-21.
_____________________________________________________________________________________________
© STM Journals 2011. All Rights Reserved. 3
material, such as the flow stress and its
dependence of the strain rate.
It has been shown that, during pulse loading,
high densities close to corresponding to the
nonporous state can be attained due to
inertia effects (Boltachev, Volkov, Ivanov
and Paranin; 2008). The influence of the
initial radial dimensions of the rod-powder-
medium system on the compaction process
was analyzed. The problem was found to be
scale invariant under various constrains
imposed on the ratio of the characteristic
dimensions. In addition, cold die
compaction has been theoretically modeled
of powder materials based on the
axisymmetric solution of the large
deformation (Al-Qureshi, Galiotto and
Klein; 2005). The model produces an
expression relating the green density of the
collect to the applied pressure. The analysis
takes into account the internal (restricted
movements) coefficient of friction between
the particles and the container-compacted
powder interface friction. The yield stress
of the materials plays a major and
fundamental role in the final strength and
density of the final compact part. Internal
imperfections, especially internal cracks are
probably the greatest and most expensive
quality problems experienced by the powder
metallurgy industry (Krezalek and
Sivakumar; 1995). Majority of these
imperfections arise, due to poor or
insufficient powder flow in some regions of
the compact and is introduced to the product
during compacting of powder to green stage.
Analysis of possibilities of introduction of
imperfections requires the powder
movement to be quantified. The application
of finite element method may take design of
powder metallurgy parts of complex
geometries easier by evaluating different
designing options and possibility of internal
cracks introduced during compaction
operation which can be analyzed and
eliminated.
An expression related the green density and
porosity of the compact during cold die
compaction of powder as a function of
process parameters have been analyzed (Al-
Qureshi, Soares, Hotza, Alves and Klein;
2008). The analysis takes into account the
internal coefficient of friction between the
particles and the powder/container interface
friction and the work hardening effect of the
particles. Compression between
experimental and theoretical distributions
demonstrated remarkable agreement for all
the tested conditions for different work
hardening behavior of the particles. The
finite element method has been used to
study the effect of sand shell size on
compaction and shape change during
compaction of billets formed from the hot
products of self-propagation high-
temperature synthesis (Amosov, Rodchenko,
Fedotov and Ermolenko; 2004). The
extreme nature has also been established for
the change in billet density in relation to
shell thickness which governs its reserve of
compressibility.
Appropriate structural model of powder
compaction may suggest that the contact
nature of plastic deformation of a powder
body takes account. It has been shown that
in averaging local stresses and strain rates,
the volume of averaging can be presented as
combination of straight cylinders constructed
at all contact areas of a particle and having a
common nucleus formed by the intersection
of cylindrical bodies (Fedotov and
Krasnoshchekov; 2005). The contact-rod
model satisfies boundary conditions for the
poured state of powder and it is good
agreement with experimental data for
isostatistically compacted metal powders.
The shock compacted powders modeling of
Trends in Mechanical Engineering& Technology
Volume 1, Issue 1, February, 2011, Pages 1-21.
_____________________________________________________________________________________________
© STM Journals 2011. All Rights Reserved. 4
the compaction mechanism has studied by
Mamalis, Vottea and Manolakos (2001). It
has been calculated this has shown that there
is a great interest for explaining and
understanding the densification mechanisms.
Static and dynamic compaction techniques
are useful for fabrication of components of
various geometries, the description of the
mechanisms of the process is very important.
Thus, the finite element method is found as a
powerful tool for predicting the compaction
process and the deformation behavior of
porous materials. A new mechanical model
has been developed by Zhou, Chen, Zhao,
Shao and Xia; 2002) for powder metallurgy
compaction.Various amount of voids can be
introduced into a continuous solid, therefore,
the porosity can be conventionally controlled.
The elastic-plastic finite element method was
used to analyze the sintered powder material.
A developed model has been applied to
simulate compressing of a sintered cylinder.
The plastic deformation of a metallic material
is mostly caused by the slipping of the crystal
lattice.
An algorithm for simulating the isostatic
compaction of powders with dispersed
spherical particles has also been studied (He
and Ekere; 1998). The simulation results
show that both the packing density and the
average contact number are highly
dependent on the particle dispersion. A
double-surface plasticity model, based on a
combination of a convex yield surface
consisting of a failure envelope, such as a
Mohr-Coulomb yield surface and, a
hardening cap mode has been developed
(Lewis and Khoei; 2001) for the nonlinear
behavior of powder materials in the compact
of a generalized plasticity formulation for
the description of cyclic loading. A new
expression for calculating the effective
pressure acting on contacts between
particles in powder aggregates underuniaxial
compression has been proposed by Montes,
Cintas, Rodriguez and Herrera (2003). The
developed equation is a function of both the
degree of porosity and the minimum packing
porosity. The latter is roughly identical with
the tap porosity and describes with some
accuracy the pore structure in the powder or
compact. It has also recognized that kinetics
were important for compaction during hot
pressing in a rigid die, and the change in
density distribution (Grigor’ev, Maiboroda,
Panfilov and Shtern; 2003). Irreversible
solid phase strain accumulations, and
equivalent stresses were very important to
be studied by means of the finite element
method. The die compaction of powders
evaluated using spatially fixed finite element
has been proved that the material
constitutive behavior can be described by
the theory of elastoplasticity (Brekelmans;
1990).
The basic equations of plasticity have been
established to be very effective to derive a
general algorithm for the implementation of
a set of well-known constitutive models for
porous materials (Justino, Alves, Llein and
Al-Qureshi; 2006). The set of models were
modified successfully to incorporate not
only an isotropic work hardening, but also
the coupling of the constitutive equations
with the porosity at the material. It has been
found that, the comparative analysis,
performed with the given set of porous
material models, shows a large difference in
the response of the different models. A new
experimental and theoretical investigation of
the granular-medium shock-wave
compaction process has been investigated by
Boltachev, Volkov, Ivanove and Kargordov
(2009). The mathematical model described
the energy dissipation, which is stipulated
by the work made to compact the powder,
considering the loss for the non-ideal
reflection of the shock wave from the
Trends in Mechanical Engineering& Technology
Volume 1, Issue 1, February, 2011, Pages 1-21.
_____________________________________________________________________________________________
© STM Journals 2011. All Rights Reserved. 5
discontinuity surface on the borders of the
body being compacted. A one-parameter
equation that describes pressing of ceramic
powders in the dimensionless coordinates
relative pressing pressure-relative density of
the compact was suggested by Khasanov,
Dvilis and Sokolov (2001). It was shown
that the boundary conditions are correctly
obeyed for such an equation. The
correctness of the initial conditions is
provided by the developed method for
plotting compaction curves. The finite
element based plasticity model on porous
material for metal powder forming processes
may also be implemented (Biswas; 2005). It
has been used to analyze stress state and
kinematical constraint imposed on the test
specimens with simple geometries. The
overall picture of the powder pressing
process seems to be very captured with the
present computational model over a wide
range of applied load.
It has been shown that from above
investigations that several relationships
between compaction pressure and green
density have been proposed. The high
number of relationships presented in
literature reflects the complexity of the
process. It is believed that the compaction
process is difficult to generalize because it
depends on a large number of parameters
which are hardly to be completely
adjustable. Some models took into account
the powder characteristics, which include
particle size, shape, and surface finish, while
others incorporate material properties such
as hardness or plasticity Secondi; (2002).
A fundamental understanding of the
physical mechanisms that govern the
powder compaction is central to the
economics of powder technology. Hence,
compactions modeling have received
significant attentions over the last years
(Gaboriault; 2003). There are two main
approaches for compaction modeling
namely micro-mechanical or discrete
element method (DEM) and macro-
mechanical method which considers the
discrete nature of the powder particles.
These “particulate” models describe how the
basic physical laws affect the movement of
individual powder particles. Micro-
mechanical modeling describes the particle-
particle and particle-wall interactions that
take place when powder is compacted.
Information pertinent to such modeling may
include the average number of contacts,
volume fraction of particles, contact area
and center-to-center distances of adjacent
particles. On the other hand, the macro-
mechanical model treats the powder volume
as a continuum. These continuum models
describe how the pressure and density
distributions within the compacting powder
bed depend on the relevant powder
properties and geometry during the
compaction.
The macro-mechanical approach is the
predominant modeling technique applies for
powder compaction. The macro-mechanical
model provides useful engineering
information such as density distribution and
post-compaction shape. Mathematically,
macro-mechanical model involves the
solution of a boundary value problem with
partial differential equations for equilibrium
(Gaboriault; 2003 and Mahoney and
Readey; 1995). The micro-mechanical
model provides information about the local
behavior of the powder. The steady state
pressure distribution is governed by the
Laplace’s equation:-
02
z
P2
r
P
r
α2
h
2r
P2
α2
h
(1)
Trends in Mechanical Engineering& Technology
Volume 1, Issue 1, February, 2011, Pages 1-21.
_____________________________________________________________________________________________
© STM Journals 2011. All Rights Reserved. 6
The term steady state problems pertain to
problems that describe steady state of
systems that do not vary with time. The die
wall was modeled as a rigid surface made of
elastic material. During compaction at room
temperature, the punches move at a slow rate,
dynamic effects were neglected and no
thermal effect was considered.
Two dimensional steady state model is in the
radial and depth direction. For this model,
P = (r, z) as represented in equation (1). This
equation was solved using the following
initial and boundary conditions:
Initial condition
P(r, z, 0) = 0 at time = 0 (2)
Boundary condition when time > 0
P(0, 0) = Pa (3)
The pressure at point P (0, 0) is equal to
applied pressure (Pa)
P(r, 0) = applied pressure, at top of the
compact (4)
Djzpzp a /***4exp*,0 (5)
At the central axis, the axial compacting
pressure at any depth in the compact is given
by:
aj pDjzpzRp **/***4exp*, ,1
(6)
At the die Wall, during single action
pressing (only from the top), the upper part
of the green compact slides on the die. It is
submitted to a normal load from the punch
and simultaneously to a shear stress due to
friction at the die wall effect Ready,
Mahoney and Ewsuk; 1995 and Crawford
and Sprevak; 1984).
irDpLrp a */**4exp*%, (7)
The pressure is dissipated from the top of
the compact to the bottom. It depends on
aspect ratio and coefficient of friction, the
value is variable between 20 - 90%, this is
reported by references (Pease III; 2005,
Collins II; 2003 and Brewin, Coube,
Doremus and Tweed; 2008). Boundary
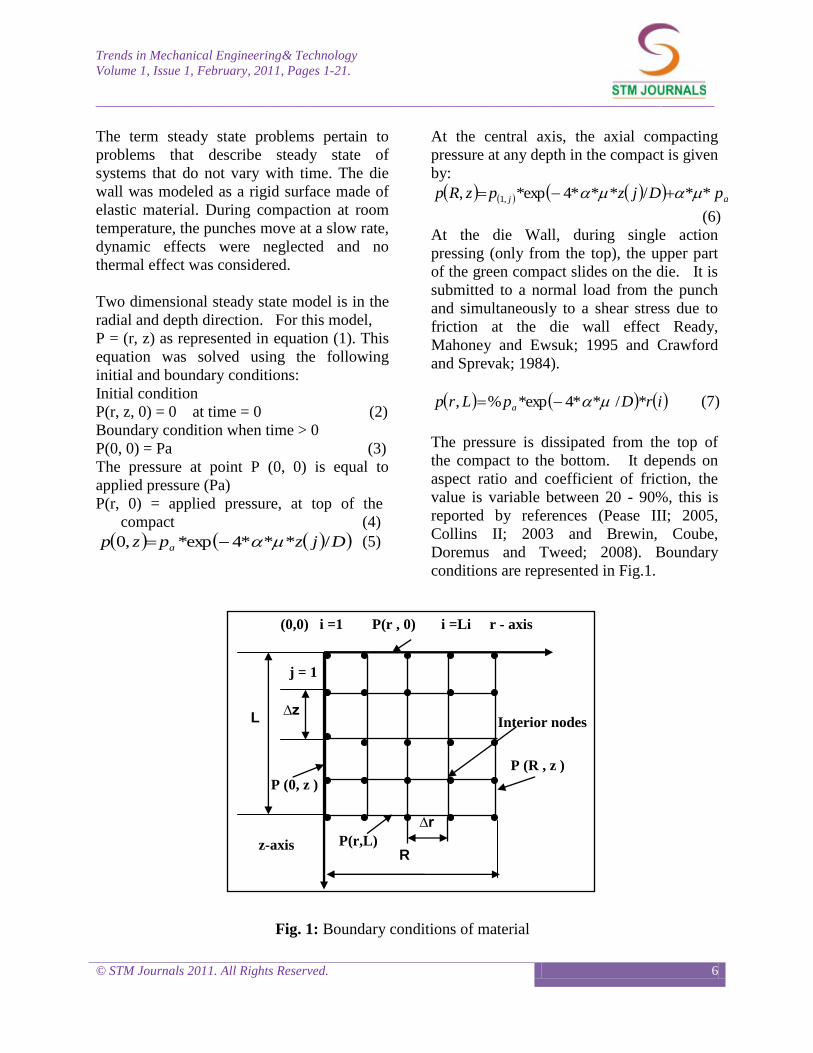
conditions are represented in Fig.1.
Fig. 1: Boundary conditions of material
(0,0) i =1 P(r , 0) i =Li r - axis
j = 1
∆z
∆r
P(r,L)
L
R z-axis
Interior nodes
P (R , z )
P (0, z )
Trends in Mechanical Engineering& Technology
Volume 1, Issue 1, February, 2011, Pages 1-21.
_____________________________________________________________________________________________
© STM Journals 2011. All Rights Reserved. 7
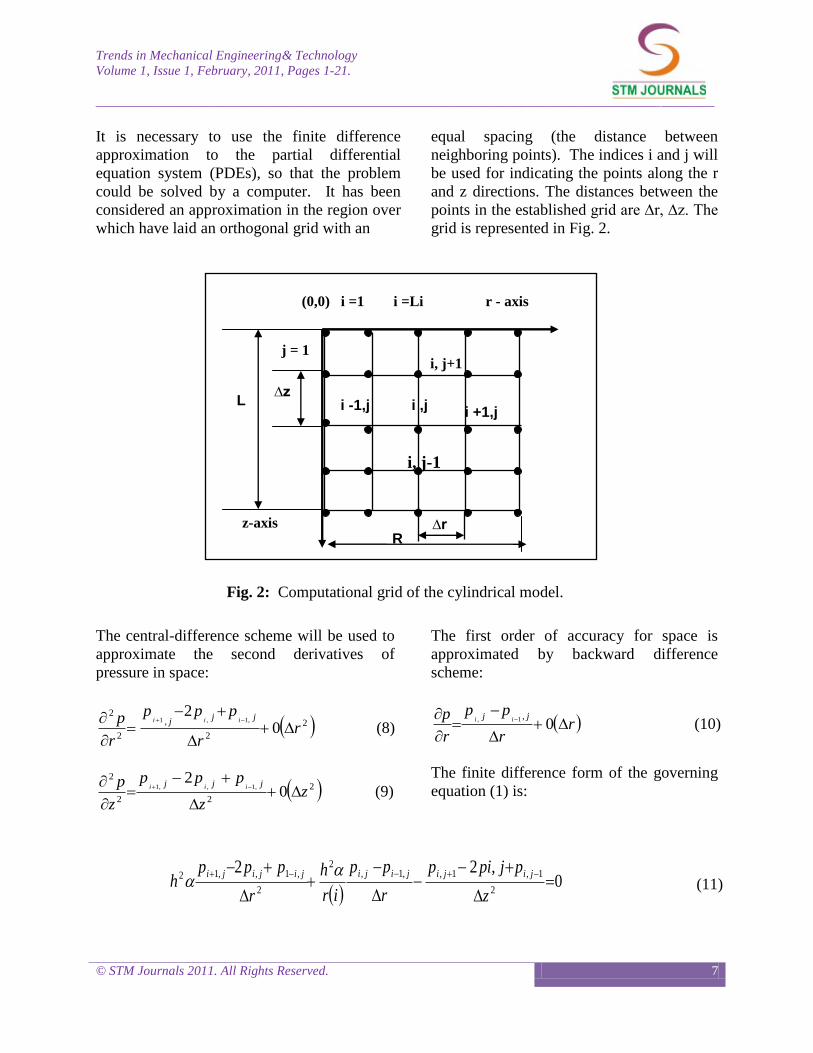
It is necessary to use the finite difference
approximation to the partial differential
equation system (PDEs), so that the problem
could be solved by a computer. It has been
considered an approximation in the region over
which have laid an orthogonal grid with an
equal spacing (the distance between
neighboring points). The indices i and j will
be used for indicating the points along the r
and z directions. The distances between the
points in the established grid are ∆r, ∆z. The
grid is represented in Fig. 2.
The central-difference scheme will be used to
approximate the second derivatives of
pressure in space:
2
2
,
2
2
02
,1,1
rr
ppp
r
p jjj iii
(8)
2
22
2
02
,1,,1
zz
ppp
z
p jjj iii
(9)
The first order of accuracy for space is
approximated by backward difference
scheme:
rr
pp
r
p jj ii
0,1,
(10)
The finite difference form of the governing
equation (1) is:
0,22
2
1,1,,1,2
2
,1,,12
z
pjpip
r
pp
ir
h
r
ppph
jijijijijijiji (11)
(0,0) i =1 i =Li r - axis
j = 1
∆z
∆r
L
R z-axis
i, j+1
i ,j i -1,j
i, j-1
i +1,j
Fig. 2: Computational grid of the cylindrical model.
Trends in Mechanical Engineering& Technology
Volume 1, Issue 1, February, 2011, Pages 1-21.
_____________________________________________________________________________________________
© STM Journals 2011. All Rights Reserved. 8
Assuming that r = z , then equation (11)
becomes:
022 1,,1,,1,
2
,1,,1
2
jijijijijijijiji pppppir
rhppph
(12)
jijijijiji p
ir
rhhp
ir
rhhppph ,
22
,1
22
1,1,,1
2 22
(13)
.
222
2
,1
22
1,1,,1
2
,
ir
rhh
pir
rhhppph
p
jijijiji
ji
(14)
Finite difference method is devoted to basic
techniques for solving elliptic PDEs. The
principles of stability analysis with numerical
schemes are discussed by Fu, Jiang,
Lannutti, Wagoner and Daehn (2002).
3.Numerical solution of finite difference
equations
Most numerical solutions of the Laplace
equations systems have been studied. For
example in the present work equation (1) has
20-by-5 grids which involve 100 linear
algebraic equations. Solution techniques to
these types of equations were discussed by
other investigators Shima and Saleh; 1993).
Because they are prone to round off error,
elimination methods are not usually
employed for such systems. In addition, it is
noticed that there is a maximum of five
unknown terms per line in equation (1). For
larger–sized grids, this means that a
significant number of terms will be zero.
When applied to such sparse systems,
elimination methods waste great amounts of
computer memory storing these zeros.
For the aforementioned reasons, Elliptic
PDEs are usually solved with approximate
method. The most commonly employed
approach is Gauss–Seidel iteration (Shima
and Saleh; 1993). The finite difference
equation is applied at each node, node by
node. With each calculation, the updated
value from the previous node is used. The
calculation may also incorporate the method
of relaxation. The calculations are continued
until repeated iterations fail to change the
pressure distribution within a specified
amount. This procedure will eventually
converge on a stable solution. Over
relaxation is often employed to accelerate the
rate of convergence by applying the
following formula for each iteration:
oldnew jiji
new
ji pwpwp,,, 1. (15)
Trends in Mechanical Engineering& Technology
Volume 1, Issue 1, February, 2011, Pages 1-21.
_____________________________________________________________________________________________
© STM Journals 2011. All Rights Reserved. 9
where jip , and oldjip
,are the values of Pi,j
from the present and the previous iterations
respectively and w is a weighting factor
which is set between 1 and 2. As with the
conventional Gauss-Seidel method, the
iterations are repeated until the absolute
values of all the percent relative errors, εai,j,
fall below a prespecified stopping
criterion, s . These percent relative errors
are estimated by:
.100
,
,,
new
oldnew
ji
jiji
ap
pp (16)
At in present work, the over relaxation is
employed with a value of 2 for the
weighting factor and iterate to s = 1
4.Prediction density gradients
In spite of high degrees of surface finish on
the tool set, friction exists between the
powder and the tool components. Axial
forces applied by the compaction load cause
radial forces to be generated at the die walls.
A differential pressure distribution during
compaction produces a density gradient in
the green parts. To predict the relative green
density of the compact, the following
equation was used:- 31. lpk (17)
where is a relative density, o is an initial
relative density, P is an applied pressure and
k is a constant reflect variations in material
properties such as hardness and plasticity. k
appears to be a material constant. Soft and
ductile powders have higher k values than
hard and brittle powders. This descriptive
property of the constant k for deformation
behavior of the material leads to the
following correlation between k and the yield
strength (σy) Bejarano, Riera and Pracb;
2003):
σy=1/3k (18)
The reciprocal of the slope k has been found
to reflect the yield pressure Py of a material.
This means that the yield pressure Py of a
material is equal to 3σy J. Scott and Kenkre;
1998 and Mahoney and Readey; 1995). For a
compaction of alumina, this occurs between
approximately 0.1 and 10 MPa (Shackelford
and Alexander; 2001). At this stress, the
granules comprising the powder begin to
permanently deform by plastic strain and/or
fracture. This corresponds to the beginning of
stage III compaction. In modeling of
prediction density is the value of σy = 5 MPa
depending on data for Sandia National
Laboratories Collins II; 2003).
5.Results and discussion
Numerous analysis and models have been
found in the literature for investigating and
predicting the compaction behavior of
ceramic powders. It is important to note that
such diagrams pertain only to the average
properties of powder compacts. To better
understand the significant issue of density
variations within pressed powder compacts,
models of pressure distribution which are
obtained from an applied compacting
pressure have been developed and
implemented into a finite difference method.
The processing of an axisymmetric
component has been simulated. Coupling
pressure distribution functions with
pressure-density relationship allows the
development of model to predict density
distribution. The intermediate stage model
and the data for alumina of 94% purity are
taken from industry teams with Sandia
National Laboratories to develop a
predictive model for a powder pressing and
die design Ready, Mahoney and Ewsuk;
1995 and Mahoney and Readey; 1995).
Trends in Mechanical Engineering& Technology
Volume 1, Issue 1, February, 2011, Pages 1-21.
_____________________________________________________________________________________________
© STM Journals 2011. All Rights Reserved. 10
0 1 2 4 5Axial distance from top to
the bottom of the green compact, mm
0
100
200
300
400
500
Axia
l com
pa
ctin
g p
ressu
re,
MP
a
69 MPa
138 MPa
306 MPa
500 MPa
Cylindrical dies were used in modeling due
to their simplicity in operation. Four
different aspect ratios (compact thickness-
to-die diameter) were chosen: 0.38, 0.75,1
and 2 which reflected a wide range of
typical operating conditions for spray dried
alumina powder containing several percent
of a methylcellulose binder. This gives
approximately the initial compaction relative
density 28% percent from the theoretical
density. This allows comparing the results
with the available experimental results for
same powder. It is initial density is 1.036
g/cm3; its maximum theoretical density is
3.97 g/cm3 Shackelford and Alexander;
2001).
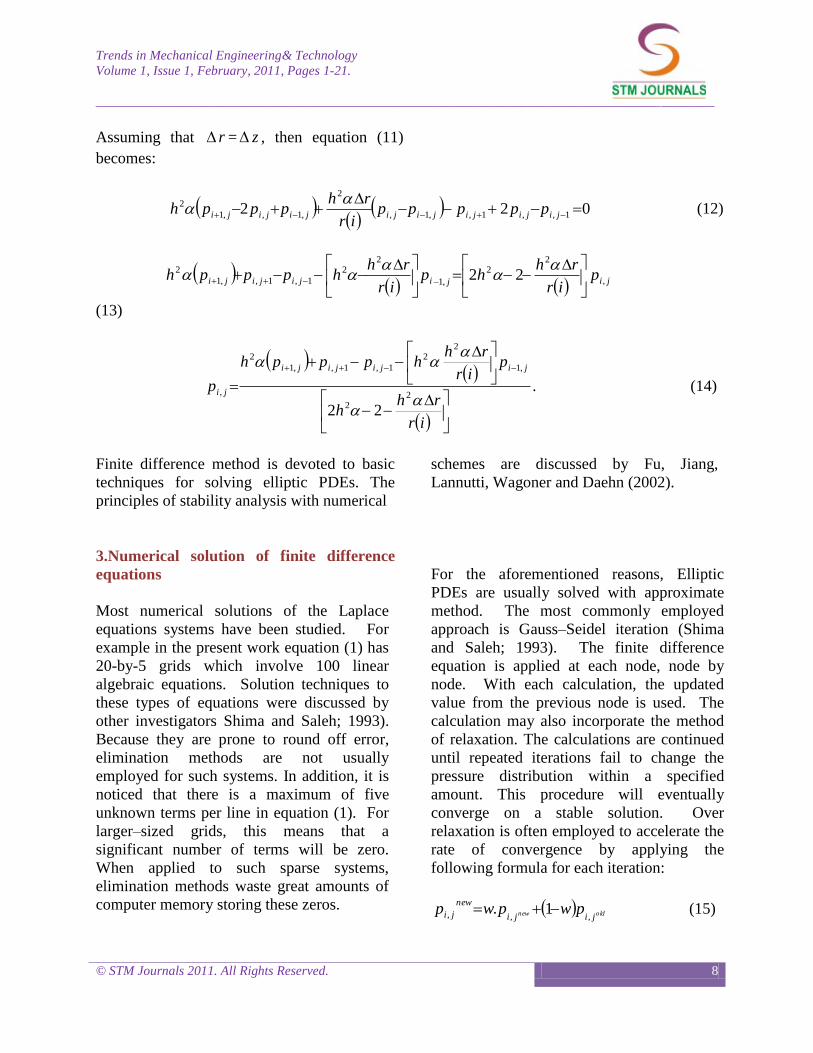
5.1. Effect of coefficient of friction
Fig. 3: The variations in axial compacting pressure with axial distance in alumina green
compacts at aspect ratio, h = 0.38, α = 0.5 and μ = 0.1 with different pressing pressures
Figure 3 postulates the variations in pressure
distribution predicted through the compact,
along the top surface of the pressure
distribution as a function of a radius; it
exhibits a minimum at the centerline and
increase toward the edge of the compact.
Note that the corners near the moving portion
of the die, where the pressure builds up are
the highest. The pressure at the edges
decreases with depth from the surface to the
bottom of compact.
Trends in Mechanical Engineering& Technology
Volume 1, Issue 1, February, 2011, Pages 1-21.
_____________________________________________________________________________________________
© STM Journals 2011. All Rights Reserved. 11
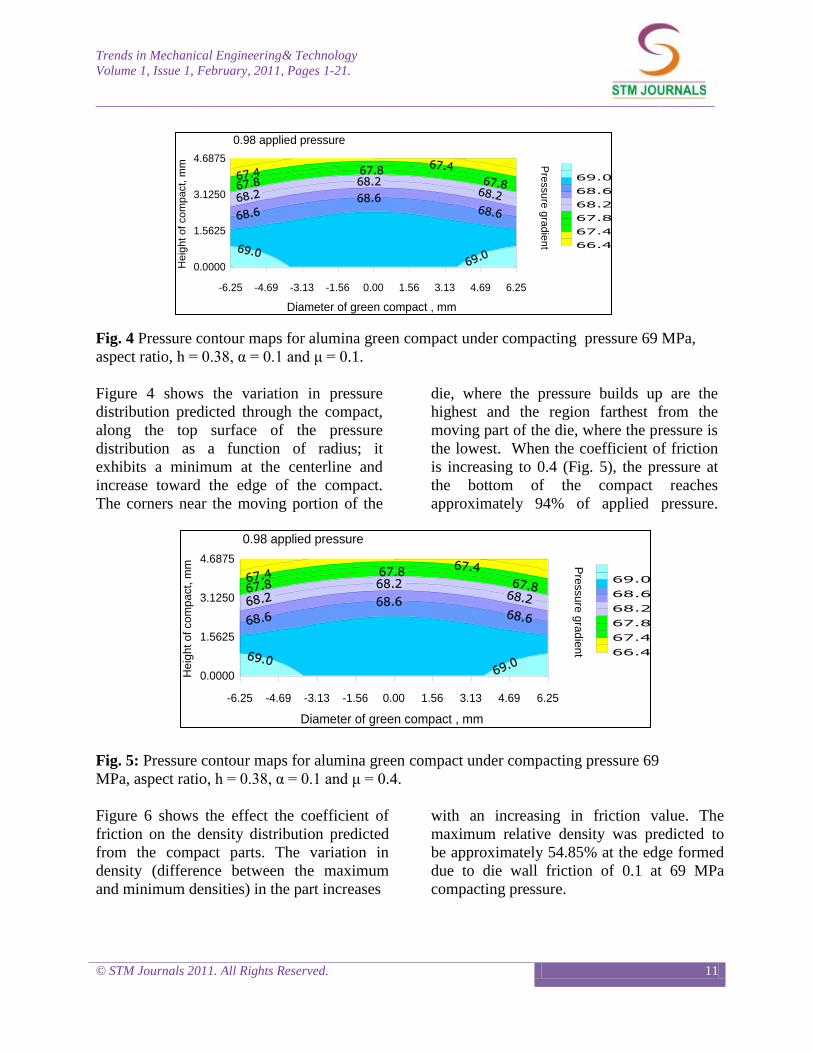
Fig. 4 Pressure contour maps for alumina green compact under compacting pressure 69 MPa,
aspect ratio, h = 0.38, α = 0.1 and μ = 0.1.
Figure 4 shows the variation in pressure
distribution predicted through the compact,
along the top surface of the pressure
distribution as a function of radius; it
exhibits a minimum at the centerline and
increase toward the edge of the compact.
The corners near the moving portion of the
die, where the pressure builds up are the
highest and the region farthest from the
moving part of the die, where the pressure is
the lowest. When the coefficient of friction
is increasing to 0.4 (Fig. 5), the pressure at
the bottom of the compact reaches
approximately 94% of applied pressure.
Fig. 5: Pressure contour maps for alumina green compact under compacting pressure 69
MPa, aspect ratio, h = 0.38, α = 0.1 and μ = 0.4.
Figure 6 shows the effect the coefficient of
friction on the density distribution predicted
from the compact parts. The variation in
density (difference between the maximum
and minimum densities) in the part increases
with an increasing in friction value. The
maximum relative density was predicted to
be approximately 54.85% at the edge formed
due to die wall friction of 0.1 at 69 MPa
compacting pressure.
-6.25 -4.69 -3.13 -1.56 0.00 1.56 3.13 4.69 6.25
Diameter of green compact , mm
0.0000
1.5625
3.1250
4.6875
He
igh
t o
f co
mp
act,
mm
Pre
ssu
re g
rad
ien
t 66.4
67.4
67.8
68.2
68.6
69.0
0.98 applied pressure
-6.25 -4.69 -3.13 -1.56 0.00 1.56 3.13 4.69 6.25
Diameter of green compact , mm
0.0000
1.5625
3.1250
4.6875
He
igh
t o
f co
mp
act,
mm
Pre
ssu
re g
rad
ien
t 66.4
67.4
67.8
68.2
68.6
69.0
0.98 applied pressure
Trends in Mechanical Engineering& Technology
Volume 1, Issue 1, February, 2011, Pages 1-21.
_____________________________________________________________________________________________
© STM Journals 2011. All Rights Reserved. 12
0 1 2 4 5Axial distance from top to
the bottom of the green compact , mm
0
100
200
300
400
500
Axia
l co
mp
actin
g p
ressu
re , M
Pa
69 MPa
138 MPa
306 MPa
500 MPa
Fig. 6: Density contour maps for alumina green compact under compacting
pressure 69 MPa, aspect ratio, h = 0.38, α = 0.1 and μ = 0.1.
5.2. Effect of aspect ratio
If pressure decreases exponentially through
the compact, then the aspect ratio of the
compact must also have a significant
influence. To show this effect, it is assumed
that the coefficient of friction, μ and radial
to axial pressure ratio, α are constants during
the simulation of the compaction process
and consider only the effect aspect ratio.
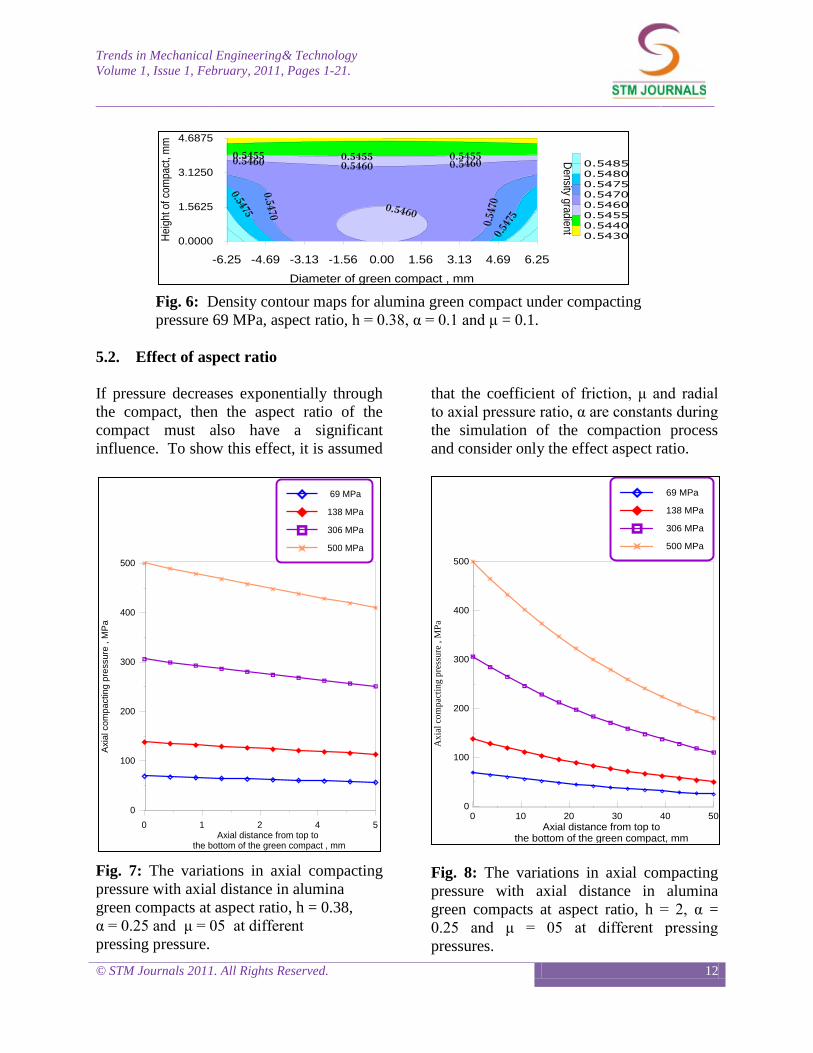
Fig. 7: The variations in axial compacting
pressure with axial distance in alumina
green compacts at aspect ratio, h = 0.38,
α = 0.25 and μ = 05 at different
pressing pressure.
Fig. 8: The variations in axial compacting
pressure with axial distance in alumina
green compacts at aspect ratio, h = 2, α =
0.25 and μ = 05 at different pressing
pressures.
0 10 20 30 40 50
Axial distance from top to the bottom of the green compact, mm
0
100
200
300
400
500
Ax
ial
com
pac
tin
g p
ress
ure
, M
Pa
69 MPa
138 MPa
306 MPa
500 MPa
-6.25 -4.69 -3.13 -1.56 0.00 1.56 3.13 4.69 6.25
Diameter of green compact , mm
0.0000
1.5625
3.1250
4.6875
He
igh
t o
f co
mpact
, m
m
Density g
radie
nt
0.5430
0.5440
0.5455
0.5460
0.5470
0.5475
0.5480
0.5485
Trends in Mechanical Engineering& Technology
Volume 1, Issue 1, February, 2011, Pages 1-21.
_____________________________________________________________________________________________
© STM Journals 2011. All Rights Reserved. 13
Figures 7 and 8 show the effect of compact
geometry on axial compacting pressure with
axial distance in alumina green compact as a
function of aspect ratio with a radial to axial
pressure ratio equal to 0.25, the coefficient
of friction at die walls is equal to 0.5 at
different compacting pressure 69, 138, 306
and 500 MPa. At an aspect ratio equal to
0.38, the pressure at the bottom of the
compact is nearly 82% of the applied
compacting pressure which transmitted to
the bottom of the compact as shown in
figure7. For aspect ratio h = 2, only 36% of
applied pressure is transmitted to the bottom
of the compact as shown in figure 8.
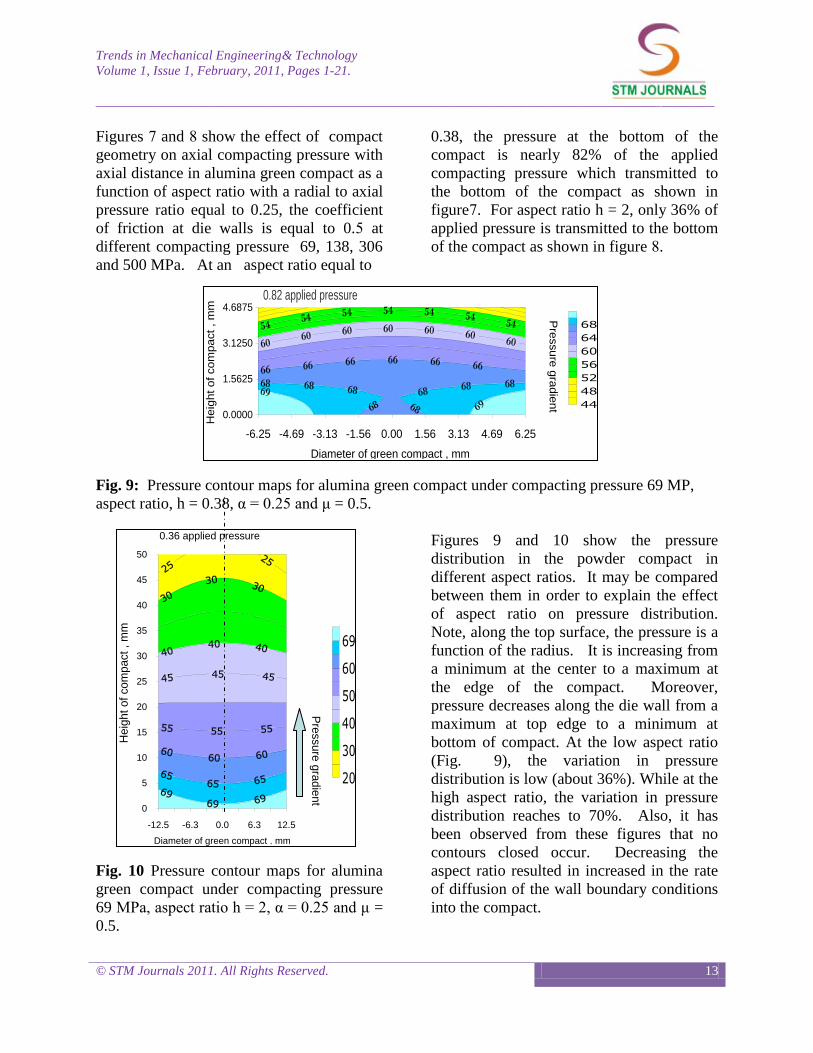
Fig. 9: Pressure contour maps for alumina green compact under compacting pressure 69 MP,
aspect ratio, h = 0.38, α = 0.25 and μ = 0.5.
Fig. 10 Pressure contour maps for alumina
green compact under compacting pressure
69 MPa, aspect ratio h = 2, α = 0.25 and μ =
0.5.
Figures 9 and 10 show the pressure
distribution in the powder compact in
different aspect ratios. It may be compared
between them in order to explain the effect
of aspect ratio on pressure distribution.
Note, along the top surface, the pressure is a
function of the radius. It is increasing from
a minimum at the center to a maximum at
the edge of the compact. Moreover,
pressure decreases along the die wall from a
maximum at top edge to a minimum at
bottom of compact. At the low aspect ratio
(Fig. 9), the variation in pressure
distribution is low (about 36%). While at the
high aspect ratio, the variation in pressure
distribution reaches to 70%. Also, it has
been observed from these figures that no
contours closed occur. Decreasing the
aspect ratio resulted in increased in the rate
of diffusion of the wall boundary conditions
into the compact.
0.82 applied pressure
-6.25 -4.69 -3.13 -1.56 0.00 1.56 3.13 4.69 6.25
Diameter of green compact , mm
0.0000
1.5625
3.1250
4.6875
Heig
ht of com
pact , m
m
Pre
ssure
gra
die
nt 44
48
52
56
60
64
68
-12.5 -6.3 0.0 6.3 12.5
Diameter of green compact . mm
0
5
10
15
20
25
30
35
40
45
50
He
igh
t of
co
mp
act , m
m
Pre
ssu
re g
radie
nt
20
30
40
50
60
69
0.36 applied pressure
Trends in Mechanical Engineering& Technology
Volume 1, Issue 1, February, 2011, Pages 1-21.
_____________________________________________________________________________________________
© STM Journals 2011. All Rights Reserved. 14
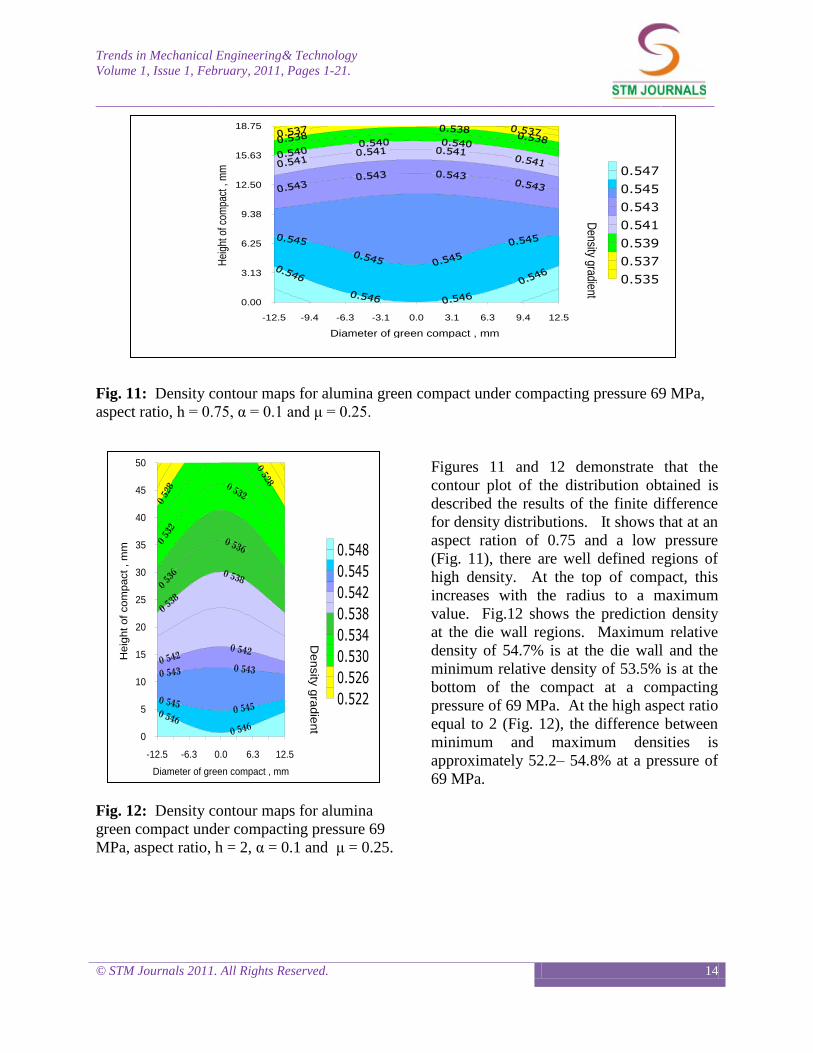
Fig. 11: Density contour maps for alumina green compact under compacting pressure 69 MPa,
aspect ratio, h = 0.75, α = 0.1 and μ = 0.25.
Fig. 12: Density contour maps for alumina
green compact under compacting pressure 69
MPa, aspect ratio, h = 2, α = 0.1 and μ = 0.25.
Figures 11 and 12 demonstrate that the
contour plot of the distribution obtained is
described the results of the finite difference
for density distributions. It shows that at an
aspect ration of 0.75 and a low pressure
(Fig. 11), there are well defined regions of
high density. At the top of compact, this
increases with the radius to a maximum
value. Fig.12 shows the prediction density
at the die wall regions. Maximum relative
density of 54.7% is at the die wall and the
minimum relative density of 53.5% is at the
bottom of the compact at a compacting
pressure of 69 MPa. At the high aspect ratio
equal to 2 (Fig. 12), the difference between
minimum and maximum densities is
approximately 52.2– 54.8% at a pressure of
69 MPa.
-12.5 -9.4 -6.3 -3.1 0.0 3.1 6.3 9.4 12.5
Diameter of green compact , mm
0.00
3.13
6.25
9.38
12.50
15.63
18.75
Hei
ght o
f com
pact
, m
m
Density gradient
0.535
0.537
0.539
0.541
0.543
0.545
0.547
-12.5 -6.3 0.0 6.3 12.5
Diameter of green compact , mm
0
5
10
15
20
25
30
35
40
45
50
Heig
ht of com
pact , m
m
De
nsity
gra
die
nt
0.522
0.526
0.530
0.534
0.538
0.542
0.545
0.548
Trends in Mechanical Engineering& Technology
Volume 1, Issue 1, February, 2011, Pages 1-21.
_____________________________________________________________________________________________
© STM Journals 2011. All Rights Reserved. 15
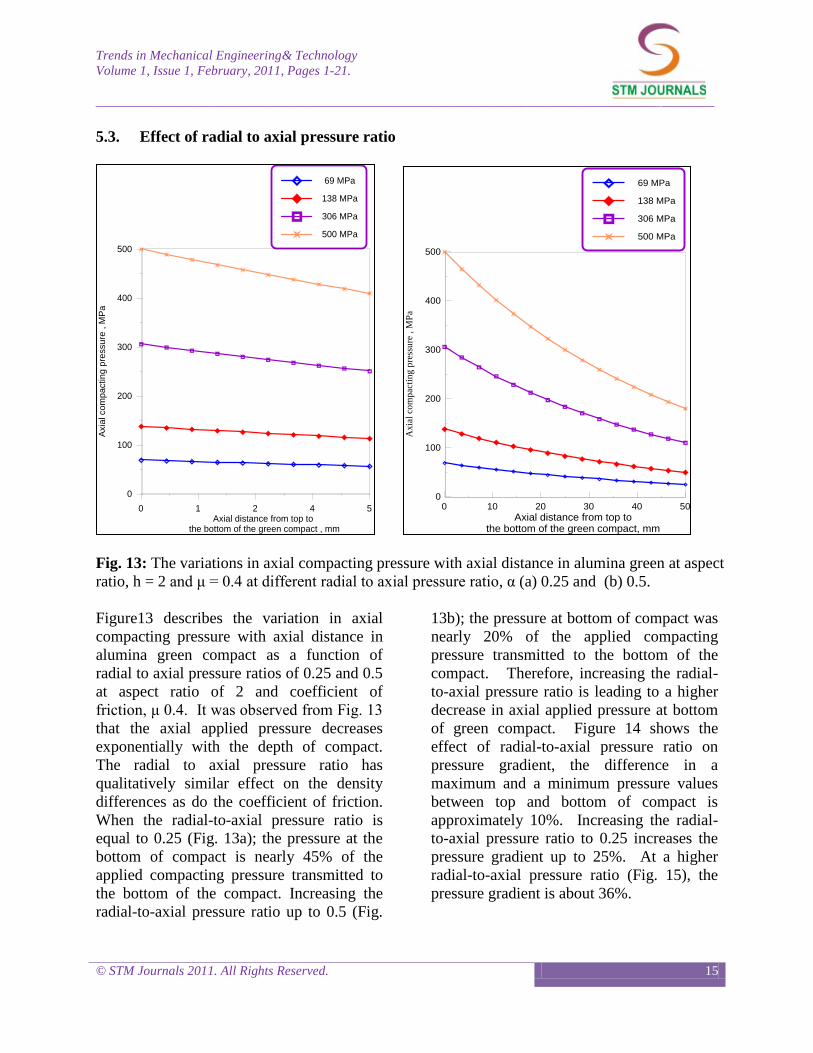
5.3. Effect of radial to axial pressure ratio
Fig. 13: The variations in axial compacting pressure with axial distance in alumina green at aspect
ratio, h = 2 and μ = 0.4 at different radial to axial pressure ratio, α (a) 0.25 and (b) 0.5.
Figure13 describes the variation in axial
compacting pressure with axial distance in
alumina green compact as a function of
radial to axial pressure ratios of 0.25 and 0.5
at aspect ratio of 2 and coefficient of
friction, μ 0.4. It was observed from Fig. 13
that the axial applied pressure decreases
exponentially with the depth of compact.
The radial to axial pressure ratio has
qualitatively similar effect on the density
differences as do the coefficient of friction.
When the radial-to-axial pressure ratio is
equal to 0.25 (Fig. 13a); the pressure at the
bottom of compact is nearly 45% of the
applied compacting pressure transmitted to
the bottom of the compact. Increasing the
radial-to-axial pressure ratio up to 0.5 (Fig.
13b); the pressure at bottom of compact was
nearly 20% of the applied compacting
pressure transmitted to the bottom of the
compact. Therefore, increasing the radial-
to-axial pressure ratio is leading to a higher
decrease in axial applied pressure at bottom
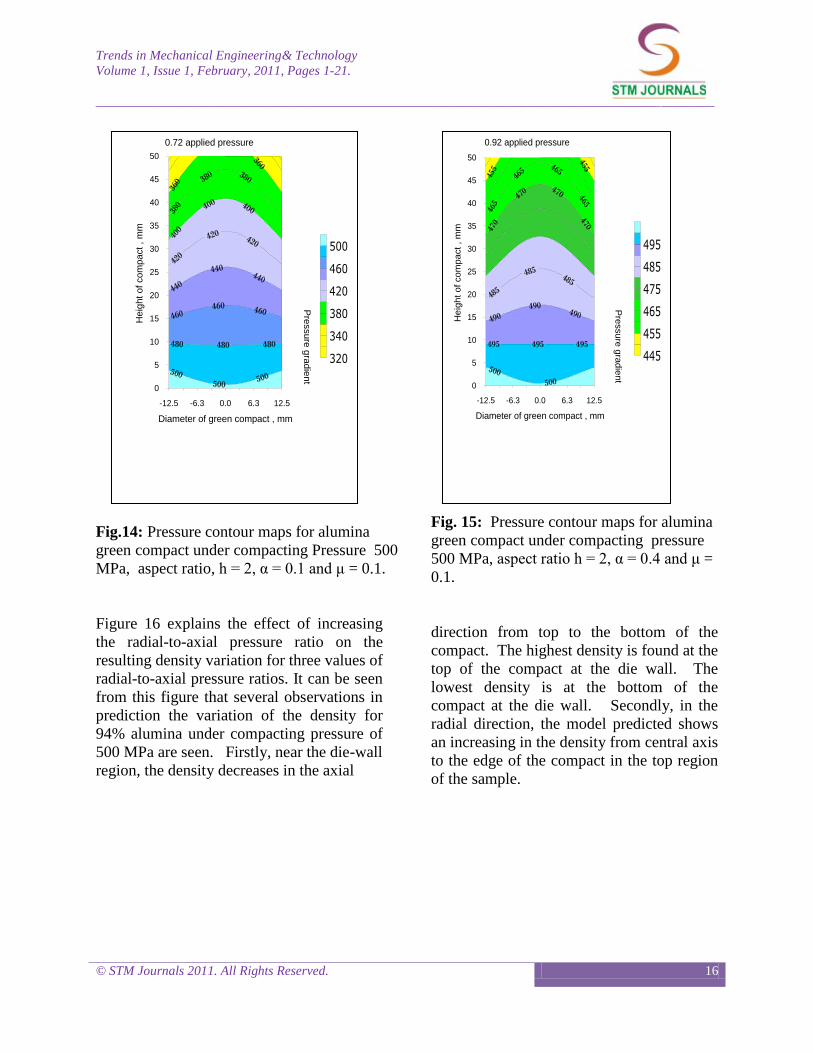
of green compact. Figure 14 shows the
effect of radial-to-axial pressure ratio on
pressure gradient, the difference in a
maximum and a minimum pressure values
between top and bottom of compact is
approximately 10%. Increasing the radial-
to-axial pressure ratio to 0.25 increases the
pressure gradient up to 25%. At a higher
radial-to-axial pressure ratio (Fig. 15), the
pressure gradient is about 36%.
0 10 20 30 40 50
Axial distance from top to the bottom of the green compact, mm
0
100
200
300
400
500
Ax
ial
com
pac
tin
g p
ress
ure
, M
Pa
69 MPa
138 MPa
306 MPa
500 MPa
0 1 2 4 5Axial distance from top to
the bottom of the green compact , mm
0
100
200
300
400
500
Axia
l co
mp
actin
g p
ressu
re , M
Pa
69 MPa
138 MPa
306 MPa
500 MPa
Trends in Mechanical Engineering& Technology
Volume 1, Issue 1, February, 2011, Pages 1-21.
_____________________________________________________________________________________________
© STM Journals 2011. All Rights Reserved. 16
Fig.14: Pressure contour maps for alumina
green compact under compacting Pressure 500
MPa, aspect ratio, h = 2, α = 0.1 and μ = 0.1.
Figure 16 explains the effect of increasing
the radial-to-axial pressure ratio on the
resulting density variation for three values of
radial-to-axial pressure ratios. It can be seen
from this figure that several observations in
prediction the variation of the density for
94% alumina under compacting pressure of
500 MPa are seen. Firstly, near the die-wall
region, the density decreases in the axial
Fig. 15: Pressure contour maps for alumina
green compact under compacting pressure
500 MPa, aspect ratio h = 2, α = 0.4 and μ =
0.1.
direction from top to the bottom of the
compact. The highest density is found at the
top of the compact at the die wall. The
lowest density is at the bottom of the
compact at the die wall. Secondly, in the
radial direction, the model predicted shows
an increasing in the density from central axis
to the edge of the compact in the top region
of the sample.
-12.5 -6.3 0.0 6.3 12.5
Diameter of green compact , mm
0
5
10
15
20
25
30
35
40
45
50
Heig
ht of com
pact , m
m
Pre
ssure
gra
die
nt
320
340
380
420
460
500
0.72 applied pressure
-12.5 -6.3 0.0 6.3 12.5
Diameter of green compact , mm
0
5
10
15
20
25
30
35
40
45
50
Heig
ht of com
pact , m
m
Pre
ssure
gra
die
nt
445
455
465
475
485
495
0.92 applied pressure
Trends in Mechanical Engineering& Technology
Volume 1, Issue 1, February, 2011, Pages 1-21.
_____________________________________________________________________________________________
© STM Journals 2011. All Rights Reserved. 17
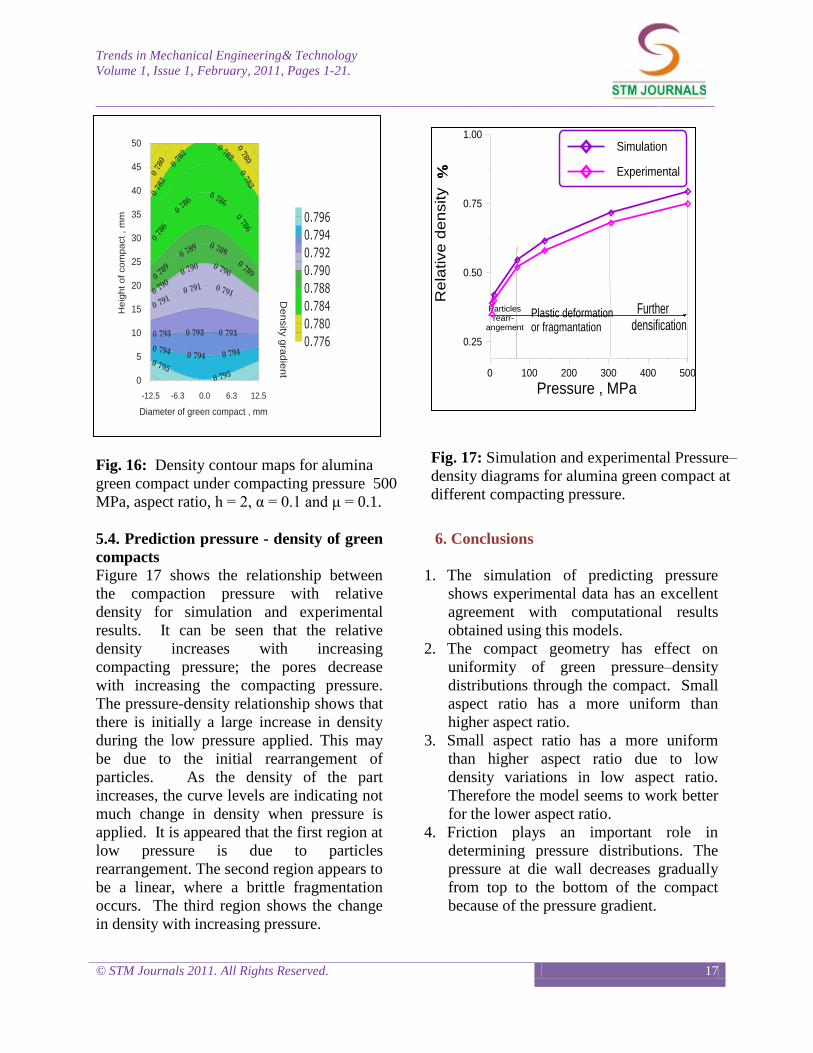
Fig. 16: Density contour maps for alumina
green compact under compacting pressure 500
MPa, aspect ratio, h = 2, α = 0.1 and μ = 0.1.
Fig. 17: Simulation and experimental Pressure–
density diagrams for alumina green compact at
different compacting pressure.
5.4. Prediction pressure - density of green
compacts Figure 17 shows the relationship between
the compaction pressure with relative
density for simulation and experimental
results. It can be seen that the relative
density increases with increasing
compacting pressure; the pores decrease
with increasing the compacting pressure.
The pressure-density relationship shows that
there is initially a large increase in density
during the low pressure applied. This may
be due to the initial rearrangement of
particles. As the density of the part
increases, the curve levels are indicating not
much change in density when pressure is
applied. It is appeared that the first region at
low pressure is due to particles
rearrangement. The second region appears to
be a linear, where a brittle fragmentation
occurs. The third region shows the change
in density with increasing pressure.
6. Conclusions
1. The simulation of predicting pressure
shows experimental data has an excellent
agreement with computational results
obtained using this models.
2. The compact geometry has effect on
uniformity of green pressure–density
distributions through the compact. Small
aspect ratio has a more uniform than
higher aspect ratio.
3. Small aspect ratio has a more uniform
than higher aspect ratio due to low
density variations in low aspect ratio.
Therefore the model seems to work better
for the lower aspect ratio.
4. Friction plays an important role in
determining pressure distributions. The
pressure at die wall decreases gradually
from top to the bottom of the compact
because of the pressure gradient.
0 100 200 300 400 500
Pressure , MPa
0.25
0.50
0.75
1.00
Re
lative
de
nsity
Particles rearr- angement
Plastic deformation or fragmantation
Further densification
Simulation
Experimental
-12.5 -6.3 0.0 6.3 12.5
Diameter of green compact , mm
0
5
10
15
20
25
30
35
40
45
50
Heig
ht of com
pact , m
m
De
nsity
gra
die
nt
0.776
0.780
0.784
0.788
0.790
0.792
0.794
0.796
Trends in Mechanical Engineering& Technology
Volume 1, Issue 1, February, 2011, Pages 1-21.
_____________________________________________________________________________________________
© STM Journals 2011. All Rights Reserved. 18
5. The variations in axial compacting
pressure with axial distance increasing
with increasing the coefficient of friction.
Increasing in radial pressures gives rise to
increased friction forces at die wall,
therefore the difference in maximum and
minimum in pressure values between top
and bottom of compact increase.
7.Acknowledgments
One of the authors (MJK) acknowledges
Prof. A.R. Boccaccini, Imperial College of
Science, London, Scholar Rescue Fund
(SRF) USA and CARA, Uk for interest and
helpful during his fellowship.
8.References
1. Al-Qureshi H. A. et al. Journal of
Materials Processing Technology
2005. 166. 135-153p.
2. Arris J. E. et al. Society for the
Advancement of Materials and
Process Engineering (SAMPE)
Covina, CA, USA. 622-634p.
3. Aydin I. et al. Powder Technology
1996. 89. 239-254p.
4. Al-Qureshi H. A. et al. Journal of
Materials Processing Technology
2008. 199. 417-424p.
5. Amosov A. P. et al. Powder
Metallurgy and Metal Ceramics
2004. 43. 229-235p.
6. Brewin P. R. et al. Modeling of
powder die compaction Published by
Springer, First Edition. 2008.
7. Bejarano A et al. Journal of
Materials Processing Technology
2003. 143-144:34-50.
8. Biswas K. Journal of Materials
Processing Technology 2005. 166.
107-115p.
9. Biba N. V. et al. Journal of
Materials Processing Technology
1993. 36. 141-145p.
10. Boltachev G. S. et al. Journal of
Applied Mechanics and Technical
Physics 2008. 49. 336-339p.
11. Boltachev G. S. et al. Acta
Mechanica 2009. 204. 37-50p.
12. Brekelmans WAM “Journal of
Materials Processing Technology
1990. 24. 33-42p.
13. Chtourou H. et al. International
Journal of Solids and Structures
2002. 39. 1059-1075p.
14. Chtourou H. et al. International
Journal of Solids and Structures
2002. 39. 1077-1096p.
15. Crawford R. J. and Sprevak D.
European Polymer Journal 1984. 5.
441-446p.
16. Fedotov A. F. and Krasnoshchekov
P. I. Powder Metallurgy and Metal
Ceramics 2005. 44. 420-425p.
17. Fu Y. et al. Metallurgical and
Materials Transactions 2002. A33.
183-191p.
Trends in Mechanical Engineering& Technology
Volume 1, Issue 1, February, 2011, Pages 1-21.
_____________________________________________________________________________________________
© STM Journals 2011. All Rights Reserved. 19
18. Collins II G. W. “Fundamental
numerical methods and data
analysis” NASA Astrophysics Data
System (ADS) USA. 2003. 25-50p.
19. Grigor’ev O. N. et al. Powder
Metallurgy and Metal Ceramics
2003. 42. 217-224p.
20. Gaboriault E. M. The effects of fill-
nonuniformities on the densified
states of cylindrical green P/M
compacts MSc Thesis. Department
of Mechanical Engineering,
Worchester Polytechnic Institute,
USA. 2003.
21. Grigor’ev O. N. et al. Powder
Metallurgy and Metal Ceramics
2003. 42. 217-224p.
22. He D. and Ekere N. Journal of
Materials Science Letters 1998. 17.
1723-1725p.
23. Justino J. G. et al. Journal of
Materials Processing Technology
2006. 179. 44-49p.
24. Khasanov O. L. et al. Refractories
and Industrial Ceramics 2001. 42.
37-40p.
25. Krezalek I. C and K. Sivakumar K.
Journal of Materials Processing
Technology 1995. 48. 421-427p.
26. Lui D. Compaction studies of a
particulate solid MSc Thesis. The
University of Queensland,
Department of Chemical
Engineering, Australia. 2000.
27. Lee S. C and Kim K. T.
International Journal of Mechanical
Sciences 2002. 044. 1295-1308p.
28. Lewis R. W. and Khoei A. R.
International Journal of Plasticity
2001. 17. 1659-1692p.
29. Lewis R. W. and Khoei A. R.
Computer Methods in Applied
Mechanics and Engineering 1998.
159. 291-328p.
30. Mahoney F. M. and Readey M. J.
Applied mechanics modeling of
granulated ceramic powder
compaction. Conference: 27
International Society for the
Advancement of Materials and
Process Engineering (SAMPE)
Technical conference, Albuquerque,
NM, USA. 10-12 Sep. 1995.
31. Mani S. et al. Biosystems
Engineering 2004. 46. 355-361p.
32. Morales R. et al. JOM: The Member
Journal of TMS (The Minerals,
Metals & Materials Society) 2003.
55. 20-24p.
33. Michrafy A. et al. Powder
Technology 2002. 127. 257-266p.
34. Mujahid M. et al. Journal of
Materials Engineering and
Performance 1998. 8. 496-500p.
35. Montes J. M. et al. Journal of
Materials Science Letters 2003. 22.
1669-1671p.
Trends in Mechanical Engineering& Technology
Volume 1, Issue 1, February, 2011, Pages 1-21.
_____________________________________________________________________________________________
© STM Journals 2011. All Rights Reserved. 20
36. Mahoney F. M. and Readey M. J.
Ceramic compaction models useful
design tools or simple trend
indicators Conference: 97 Annual
meeting of the American Ceramic
Society, Cincinnati, OH, USA. 30
Apr - 1 May 1995.
37. Mamalis A. G. et al. Journal of
Materials Processing Technology
2001. 108. 165-178p.
38. Pivinskii Y. E. et al. Refractories
and Industrial Ceramics 2006. 47.
132-138p.
39. Park C. H. et al. Powder Metallurgy
1999. 42. 269–274p.
40. Portal G et al. Powder Metallurgy
1999. 1. 34-40p.
41. Pease III L. F. Advanced Materials
and Processes 2005. 163:36-38.
42. Ready M. J. et al. “Compaction of
spray-dried ceramic powders: an
experimental study of the factors that
control green density” International
(SAMPE) Technical conference
series. Edited R. J. Martinez, H.
1995. 27.
43. Secondi J. Powder Metallurgy 2002.
45. 213-217p.
44. Shinohara N. et al. Journal of
Materials Science 1999. 34. 4271-
4277p.
45. Shima S. and Saleh M. (1993)
Variation of density distribution in
compacts in lose die compaction
with powder characteristics,
Advanced in powder metallurgy and
Particulate materials, modeling
design and computational methods
Nashville, Tennessee, USA. 16-19
May, 1993. 175-188p.
46. Scott J. V. and Kenkre V. Physics
Review E 1998. 57. 5850-5857p.
47. Shackelford J. F. and Alexander W.
CRC Materials science and
Engineering Handbook Taylor and
Francis Group. Third Edition. 2001.
103p.
48. Wagle G. S. et al. International
Conference on powder metallurgy
and particulate materials (PM2TEC
2000) New York city, NY, USA.
May 30-June 3, 2000.
49. Zhou Z. Y. et al. Journal of
Materials Processing Technology
2002. 129. 385-388p.
Trends in Mechanical Engineering& Technology
Volume 1, Issue 1, February, 2011, Pages 1-21.
_____________________________________________________________________________________________
© STM Journals 2011. All Rights Reserved. 21
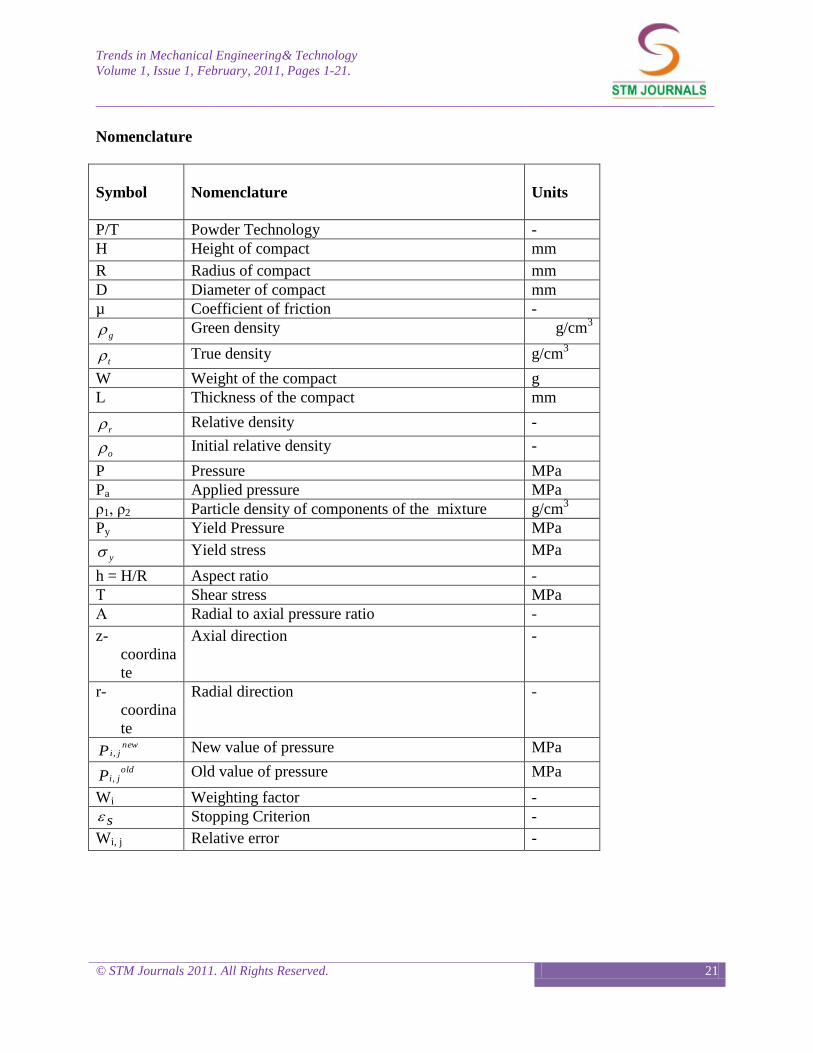
Nomenclature
Symbol
Nomenclature
Units
P/T Powder Technology -
H Height of compact mm
R Radius of compact mm
D Diameter of compact mm
µ Coefficient of friction -
g Green density g/cm3
t True density g/cm3
W Weight of the compact g
L Thickness of the compact mm
r Relative density -
o Initial relative density -
P Pressure MPa
Pa Applied pressure MPa
ρ1, ρ2 Particle density of components of the mixture g/cm3
Py Yield Pressure MPa
y Yield stress MPa
h = H/R Aspect ratio -
Τ Shear stress MPa
Α Radial to axial pressure ratio -
z-
coordina
te
Axial direction -
r-
coordina
te
Radial direction -
newjiP , New value of pressure MPa
oldjiP , Old value of pressure MPa
Wi Weighting factor -
s Stopping Criterion -
Wi, j Relative error -