SIMULATION OF A RADIO FREQUENCY...
76
SIMULATION OF A RADIO FREQUENCY IDENTIFICATION SYSTEM UTILIZING DIRECT SEQUENCE SPREAD SPECTRUM AND ADDITIONAL IMPROVEMENT TECHNIQUES by BRIAN GREGORY BOSTICK A THESIS Submitted in partial fulfillment of the requirements for the degree of Master of Science in the Department of Electrical Engineering in the Graduate School of The University of Alabama TUSCALOOSA, AL 2010
Transcript of SIMULATION OF A RADIO FREQUENCY...

SIMULATION OF A RADIO FREQUENCY IDENTIFICATION SYSTEM UTILIZING
DIRECT SEQUENCE SPREAD SPECTRUM AND ADDITIONAL
IMPROVEMENT TECHNIQUES
by
BRIAN GREGORY BOSTICK
A THESIS
Submitted in partial fulfillment of the requirements for the degree of Master of Science in the
Department of Electrical Engineering in the Graduate School of
The University of Alabama
TUSCALOOSA, AL
2010

Copyright Brian Gregory Bostick 2010 ALL RIGHTS RESERVED

ii
ABSTRACT
Radio Frequency Identification (RFID) is a technology that has been in use since World
War II and has evolved from the means by which an army was able to identify approaching
aircraft to a versatile data gathering tool which is used in a variety of applications. Paramount
concerns to any RFID system include accuracy, data security, system capacity and efficiency as
well as system architectures to take into consideration the unique aspects of particular
applications. In this work, a generalized RFID system is developed to allow multiple passive
RFID tags to simultaneously communicate with a single reader. Applications include inventory,
retail checkout, industrial process tracking, and security. The system uses direct sequence spread
spectrum (DSSS) as its multiple access technique, and several unique system modifications are
proposed to improve the accuracy and capacity of the generalized system. Simulation results
show the performance of the generalized system and show that the proposed modifications to the
system do in fact improve the system’s accuracy and capacity, both in a noiseless environment
and in an environment with additive white Gaussian noise. A comparison of the proposed
modifications is performed and suggestions for their implementation are discussed.

iii
DEDICATION
This thesis is dedicated to everyone who helped me find my way to finishing it. In
particular, my family and professors who gave time, effort and support in helping me reach the
end.
iv
LIST OF ABBREVIATIONS AND SYMBOLS
A Peak amplitude of a line of sight signal
AWGN Additive white Gaussian noise
BWSS Bandwidth of a communications system
CDM Code division multiplexing
CDMA Code division multiple access
CRC Cyclic redundancy check
dB Decibel
DSSS Direct sequence spread spectrum
ECC Error correcting coding
FDM Frequency division multiplexing
GP Processing gain
I0 Modified Bessel function of the first kind and zero order
IEEE Institute of Electrical and Electronics Engineers
ITF Interrogator Talks-First
ISO The International Organization for Standardization
EPC Electronic product code
FHSS Frequency hopping spread spectrum
LOS Line of sight
M Number of users of a communications system
v
NO/2 Two sided average normalized power spectral density
P Average normalized power of a spread message
PN Pseudorandom noise
rb Bit rate of the data being transmitted
rSS Bit rate following spreading process
RF Radio frequency
RFID Radio frequency identification
SNR Signal to noise ratio
TDM Time division multiplexing
V Vehicle speed
XOR Exclusive OR logic function
σ Rms value of a received signal
λ Wavelength of a carrier signal

vi
ACKNOWLEDGEMENTS
It is with pleasure that I thank all of the people who have helped me with this research
project. I would most like to thank Harold Stern for his guidance and knowledge he lent to the
project which ultimately made the research worthwhile. Furthermore, I would like to thank all
my committee members, Harold Stern, William Stapleton, Jeff Jackson, and Kenneth Ricks for
their invaluable input and support of my academic progress. I would also like to the University
of Alabama’s Graduate School and the College of Engineering for providing a world class
education. Finally, I would like to thank my friends and family, particularly my wife, for their
support and motivation.

vii
CONTENTS
ABSTRACT .................................................................................................................................... ii
DEDICATION ............................................................................................................................... iii
LIST OF ABBREVIATIONS AND SYMBOLS .......................................................................... iv
ACKNOWLEDGEMENTS ........................................................................................................... vi
LIST OF TABLES ...........................................................................................................................x
LIST OF FIGURES ....................................................................................................................... xi
CHAPTER 1 ....................................................................................................................................1
The Need for the Capability to Simultaneously Read Multiple RF Tags ....................................... 1
Scope ............................................................................................................................................... 3
CHAPTER 2 ....................................................................................................................................5
RF Tags ........................................................................................................................................... 5
Multiplexing Techniques in a Communications System ................................................................ 7
Phenomena Affecting Wireless Communications System ........................................................... 12
Multipath ........................................................................................................................................13
Ricean Fading ................................................................................................................................14
Raleigh Fading ...............................................................................................................................14
Ambient Noise ...............................................................................................................................15
RFID System Using DSSS............................................................................................................ 16
Practical and Mathematical Limitations of the System Capacity of a DSSS RFID System ......... 18
CHAPTER 3 ..................................................................................................................................26
viii
Technique #1 (Subtraction of correctly received RFIDs) ............................................................. 26
Technique #2 (Staggering Tag’s Transmission) ........................................................................... 28
Comparable Techniques Already Implemented ............................................................................ 29
CHAPTER 4 ..................................................................................................................................32
Description of a Simulated DSSS RFID System in MATLAB .................................................... 32
Adding Technique #1 (Tag Subtraction) to the DSSS RFID System Simulation .........................34
Adding Technique #2 (Tag Staggering) to the DSSS RFID System Simulation ..........................35
Combining Technique #1 (Tag Subtraction) and Technique #2 (Tag Staggering) in the DSSS
RFID System Simulation ...........................................................................................................36
Results of the DSSS RFID System Simulation............................................................................. 36
Baseline for the DSSS RFID System Simulation ..........................................................................36
DSSS RFID System Simulation Using Technique #1 (Tag Subtraction) ......................................37
DSSS RFID System Simulation Using Technique #2 (Tag Staggering) .......................................40
DSSS RFID System Simulation Using a Combination of the Optimized Technique #1 (Tag
Subtraction) and Technique #2 (Tag Staggering) ......................................................................43
DSSS RFID System Simulation with the Addition of White Gaussian Noise in the Transmission
Channel ......................................................................................................................................44
CHAPTER 5 ..................................................................................................................................53
Conclusion .................................................................................................................................... 53
Suggestions for Future Research .................................................................................................. 56
REFERENCES ..............................................................................................................................59
APPENDIX A: PROGRAM USED TO SIMULATE DSSS RFID SYSTEM .............................60

ix
APPENDIX B: PROGRAM USED TO PERFORM MULTIPLE ITERATIONS OF THE DSSS
SPREAD SPECTRUM SIMULATION ........................................................................................62

x
LIST OF TABLES
xi
LIST OF FIGURES
2.1. Four Shift Register PN Code Generator Example Circuit ..................................................... 21
4.1. Average bit error and average RFID tags received correctly verses number of subtraction
iterations. ................................................................................................................................... 41
4.2. Average bit error and average RFID tags received correctly verses number of groups. ....... 42
4.3. Average bit error and average RFID tags received correctly verses number of groups in a
simulation incorporating eight subtraction cycles of correctly received RFID tags. ................ 45
4.4. Average bit error and average RFID tags received correctly verses number of subtraction
iterations in the RFID system simulation with AWGN incorporated into the transmission
channel. Signal-to-noise ratio = 8 dB. ..................................................................................... 47
4.5. Comparison of the average bit error and average RFID tags received correctly verses number
of subtraction iterations in the RFID system simulation with and without AWGN incorporated
into the transmission channel. SNR for AWGN in system = 8 dB. ......................................... 48
4.6. Comparison of the average bit error and average RFID tags received correctly verses number
of groups in the RFID system simulation with and without AWGN incorporated into the
transmission channel. SNR = 8 dB for single grouping. ......................................................... 49
4.7. Comparison of the average bit error and average RFID tags received correctly verses number
of groups in the RFID system simulation with and without AWGN incorporated into the
transmission channel also using 8 iterations of technique #1 (tag subtraction). SNR = 8 dB for
single grouping.......................................................................................................................... 50

xii
4.8. A comparison of the Average bit error and average RFID tags received correctly verses
number of groups in the RFID system simulation with 8, 12, and 16 dB SNR across the
transmission channel. ................................................................................................................ 51
1
CHAPTER 1
The Need for the Capability to Simultaneously Read Multiple RF Tags
Radio frequency identification, RFID, is a data collection method/technology that uses
the radio frequency, RF, portion of the electromagnetic spectrum to transmit wirelessly data to
identify an object. RFID differs from other data collection technologies such as bar-coding in
that a barcode must be read by a scanner in a close line-of-sight proximity (several inches), while
RFID systems do not need line of sight and can be read as far away as the radio signal will travel
without attenuation and noise overpowering it. RFID technology was created during World War
II when British defenses needed a method to distinguish friendly aircraft from enemies. The
British attached a transponder to friendly planes that would respond to an interrogating signal
given by ground forces. If a response was given the aircraft was known to be friendly, otherwise
the British would have warning that enemy aircraft were approaching (The History of RFID
Technology). Technology has significantly advanced since World War II, but the basic concept
still applies to present day RFID systems.
Similar to the original British system today a transceiver (scanner), transponder (tag), and
antennas are still needed to make a basic RFID system. In a RFID system the scanner will
transmit a specific signal and all RFID tags within range set to hear that signal will respond with
the information that is embedded in them. This ability, where multiple tags are able to
communicate during one scan (i.e., a multiple access RFID system) provides a distinct advantage
to radio frequency based systems over line of sight (LOS) data collection methods. Numerous
2
potential applications would benefit from the capabilities of a multiple access RFID system.
Stock room management, retail checkout, industrial process tracking, and security access are
only a few potential examples where a multiple-access RFID system would be greatly beneficial.
In addition to the multiple access abilities of a RFID system, a radio frequency system
does not require the scanner and tag to be within LOS of each other. As long as the scanner’s
signal and the tag’s return signal are able to be interpreted by each other correctly withstanding
ambient noise and attenuation factors the scanner and tag could be located almost anywhere.
Having this ability eliminates the cumbersome task of physically locating the item that is to be
read and having the scanner in its line of sight and within range according to the design
parameters of the system to accurately capture the data. This advantage of a RFID system would
maximize efficiency allowing a scanner to communicate with multiple tags without the need to
physically have unobstructed views of each other.
A further benefit a RFID system has is the potential to transmit data streams which would
provide more information than current LOS data collection systems. The most widely used
current LOS data collection system is bar coding. The major limitation of this LOS system is the
amount of data a bar code can contain as it is limited by physical dimensions. A RFID contains
data which would be held in a memory device integrated into the tag. Although the amount of
memory would still be limited by several factors (most notably tag size and power) the data that
could be stored on the tag would still be significantly more than a standard bar code. Date/lot
codes, expiration dates, unique serial number, part number, and vendor ID are several examples
of data that could be stored on an individual tag using the extra memory capabilities of a RFID
tag. This increased capability allows for an expansion in the amount of services a data collection
system could provide and the quality and usefulness of the data that could be stored on a single
3
tag. In addition to the added data that could be included on each tag because the tag contains
some type of memory device, the data stored on each tag could be customized for each
individual system’s requirements.
There are many challenges associated with developing an accurate and efficient multiple-
access RFID system. The RFID system not only must find a way to effectively allow multiple
tags to accurately communicate with the scanner simultaneously without interfering with each
other, it must also have mitigation techniques in place to minimize the effects of reading multiple
tags in random and many times hidden positions with respect to the scanner in order to
accurately read the tag’s data. Although the challenges associated with developing a multiple
access RFID system are daunting, the benefits of a multiple access system would allow for
numerous gains in the efficiency and accuracy of many tasks which rely on LOS data collection
technology and would be transferable to a multitude of real world applications.
Scope
The purpose of this thesis is to propose, develop, and provide a technical description and
simulated analysis of a multiple access RFID system which utilizes direct sequence spread
spectrum (DSSS). Several custom techniques are proposed to supplement conventional DSSS in
the system to achieve a more reliable, efficient, and accurate data collection system.
This thesis is organized as follows: Chapter 2 explores the different technologies used for
RFID tags and selects the appropriate type of tag for the proposed system. Multiplexing
techniques are evaluated and a Code Division Multiple Access (CDMA) technique with DSSS is
selected as optimal. Phenomena affecting wireless systems are then explained and practical and
mathematical limitations are provided for the proposed system. Chapter 3 develops two custom
techniques, Tag Subtraction and Tag Staggering, to improve the performance of the proposed

4
DSSS RFID system. Chapter 4 provides simulation results and analysis for the proposed DSSS
RFID system without the custom techniques, with Tag Subtraction, with Tag Staggering, and
with both techniques combined. Performance is analyzed in a noiseless environment and in an
environment with additive white Gaussian noise (AWGN). Chapter 5 provides conclusions
based on the analyses in Chapter 4 and also suggests a series of topics for future research in the
field of multiple access RFID systems.
5
CHAPTER 2
RF Tags
RF transponders, also known as tags, are electronic devices which use RF
communications techniques to communicate data in a wide variety of applications. In
comparison to many RF based communication electronic systems, which relay complex series of
data between two devices each controlled by an individual user, RF tags are used to hold a
particular type of data until a point in time at which the tag is stimulated by a scanner. Once the
tag is polled by the scanner it then responds to the scanner with the data that it was programmed
to hold. The data stored by RF tags most commonly contains identification information for a
data collection or tracking system. This data can also be much more complex and detailed than a
simple identification code, similar to a barcode, allowing for more valuable information to be
gathered if needed. In general RF tags are meant to be autonomous in that they do not require
any user intervention other than the initialization of a stimulus or polling operation. RF tags can
be produced in many sizes and complexities ranging from postage stamp sizes storing on a few
bytes of data to larger tags which contain their own power source, contain programmable flash
storage, and employ complex signal processing techniques. The storage capacity and complexity
a tag is dependent on the specific parameters of an individual system allowing for flexibility of
the design of a system to meet specific needs.
There are two main types of RF tags, active and passive tags. Active tags have an
internal power source (such as a battery) and can transmit signals without the need for excitation

6
from an external source. Conversely, passive tags have no internal power source and therefore
require an external source to provide energy in order to generate a signal. Many passive tags
harness the electromagnetic energy from the transmitted signal of the scanner that is turned into
current by the tag and used to generate its signal in response. Active tags have several
advantages over passive tags due to active tags having an internal power source. Active tags can
transmit over longer ranges, have larger data storage capacity, and can support advanced usage
models which require more sophisticated processing and memory capabilities. Despite the
advantages active tags have over passive tags they require some type of power supply, usually a
battery, and are more expensive and larger in size than passive tags. As a result of the size and
cost of active tags, passive tags were developed because they can be put almost anywhere and
are not cost prohibitive to deploy in mass quantities, but due to the lack of an internal power
source passive tags have a limited transmission range, usually two millimeters to a few meters,
and a restricted amount of data storage capacity. Active tags are mainly used in systems that
utilize tags over larger distances where complex data processing is needed. Passive tags are the
choice of simple data collection systems, such as a basic inventory system, where cost and size
are paramount system parameters instead of range and complexity.
For the purpose of this research a passive RFID data collection system with many tags
being simultaneously polled has been chosen. Each tag will store and transmit a unique
identification string which is valuable for tracking and collection purposes (more complex
systems, proposed as future research, can provide more detailed information). Passive tags are
most often used in a basic RFID data collection system because of their cost and size. Although
passive tags present design challenges because of their technological disadvantages over active
tags, a basic RFID data collection system in general only needs short transmission ranges and
7
small data transfers with identification information only. The system proposed in this research
has many applications including stockroom or warehouse inventory system, wireless store
checkout, access control for secure locations, monitoring patients’ health statistics in a hospital,
and many other potential applications.
Currently there is no RFID standard adopted by the Institute of Electrical and Electronics
Engineers (IEEE), but the IEEE 802 LAN/MAN Standards Committee has chartered a study
group tasked to start the process by which a new IEEE wireless standard will be created and
approved (IEEE 802.15 WPAN RFID Study Group). The new standard could address issues
directly related to RFID systems and similar devices which will allow for system integration
using components not all based on a custom system. The advantage of a standardized system
will allow vendors to create and sell components based on the standard which will work with
other components designed to meet the IEEE802.15 RFID wireless standard. The International
Organization for Standardization (ISO) has created several standards which deal with aspects of
a RFID system or specific RFID applications but has not created a standard which outlines a
complete and general RFID protocol.
Multiplexing Techniques in a Communications System
Maximizing usage on channel resources is an issue that must be addressed in order for
any band-limited communication system to be useful for multiple users. Multiplexing
techniques are used by system designers in order to make the same communications channel
accessible to the greatest number of independent users. Successful multiplexing requires the use
of techniques which separate the different signals being sent over the same communications
channel. Frequency division multiplexing (FDM), time division multiplexing (TDM), and code
division multiplexing (CDM) are three types of multiplexing techniques used in communications
8
systems. Tradeoffs are associated with each of the multiplexing techniques and these tradeoffs
must be taken into consideration when a multiple user communication system is designed.
FDM achieves multiplexing by using separate frequency bands for every individual
signal being transmitted over the system’s channel. A FDM system is a simple and intuitive
system to implement. Every individual signal only need use a unique frequency band separated
by smaller, unused frequency bands known as guardbands in order to have a channel which is
uninhibited from other signals in the same system. Adding to the simplicity of a FDM system is
the lack of a requirement for tight synchronization among the source and users needed by other
multiplexing techniques. In a FDM system the number of unique signals is only limited by the
number of frequency divisions which are available for the system’s total bandwidth. Although
the system is theoretically simple, the actual implementation of a FDM system can be tedious
and complex for systems needing to maximize the efficiency of the available bandwidth as
complex equipment is needed to ensure frequency bands are maintained and guardband size is
minimized. Also the system has limited flexibility as it is difficult to implement a system which
allows an individual user to dynamically increase or decrease their frequency band based on
throughput needs (Mahmoud, 368-370).
TDM is a multiplexing technique that combines multiple data streams from different
sources into a single stream by dividing the single stream in time slots used by the separate data
streams, in a fixed and predefined order, which can be transmitted over a single channel. In a
TDM system the separate signals alternately use the time slots of the single data stream to
transmit data over the single channel. At the opposite end of the channel the opposite is done to
correctly interpret the multiple data streams sent from the sender (ie separating the single channel
into the same number of unique signals sent by dividing the data in the single received signal

9
based on the time slots common to the system). An advantage a TDM system has over an FDM
system is the flexibility a TDM system can achieve. The transmission speed for each data stream
can be adjusted to realize the need of the stream by changing the number of time slots allocated
to each stream, therefore adding transmission speed to signals which benefit from a higher bit
rate and reducing transmission speed for low bit rate signals. In addition to flexibility the signals
used in a TDM system must be digital in order to be broken into the time slots and transmitted.
A digital system has the advantage of using advanced processing techniques (such as error
control coding) which can be used to improve overall system accuracy and quality. Although
there are advantages of a TDM system, tight synchronization must be maintained throughout the
system in order to have any level of accuracy. Also similar to frequency guardbands in a FDM
system guard times are required in a TDM system to prevent overlap of signals, due to the
nonzero power-up and power-down times of the individual users’ transmitters, essentially
wasting blocks of time slowing the maximum bit rate of the combined signal. A user’s antenna
must be powered on and off for every packet transmitted as the transmitter must power on to
transmit during the user’s particular time interval and must turn off once the time interval is
done. Transmitters must be off during times when they are not designated to transmit in order to
not interfere with other users of the system. Low power systems may have limited transmission
ability using TDM as their multiplexing system based on the number of antenna power cycles
required to transmit data (Rappaport, 453-455).
CDM, also known as spread spectrum, is another multiplexing technique that uses a
unique code, independent of the information being transmitted, paired with each individual
signal transmitted over the communication system to allow multiple signals to be transmitted
simultaneously over a common, large bandwidth. The codes are pseudo-random (PN)

10
orthonormal binary sequences which are used to “spread” the signals transmitted across a
bandwidth which is greater than the minimum necessary to send the individual signals alone.
The PN codes are designed into the system prior to use, allowing the receiver to have advanced
knowledge of them. This knowledge makes it possible for the receiver to decipher an individual
signal from the other signals being transmitted in the same bandwidth during the same time
period. CDM can be accomplished by one of two different methods, direct sequence spread
spectrum (DSSS) or frequency hopping (Mark, 201).
In the case of DSSS, the PN spreading codes are created with a much higher bit rate than
that of the individual signals to which they are paired (Mark, 202). The spreading code’s bit rate
is limited by the amount of total bandwidth available to the system. The process gain of the
system is the ratio of the total bandwidth available by the individuals signal’s bandwidth. At
each transmitter in the system the individual signal’s data is processed by performing an
exclusive or (XOR) between itself and its predetermined spreading code at the bit rate of the
spreading code. During the XOR function the bit rate of the individual signal and spreading
code are held constant. Since the spreading code is designed to be at a higher bit rate than that of
the individual signals, the resulting signal which is output from the XOR function is at a bit rate
equal that of the spreading code. Once at the receiver the process is done in reverse where the
received signal performs an XOR function with the known spreading code for the individual
signal. The resulting output from the XOR is the individual signal’s data spread to the bit rate of
the spreading code. A simple shrinking process can be done to condense the data to the original
signal’s bit rate for correct interpretation by the receiver. Adding multiple signals to a DSSS
system is accomplished by using a unique PN spreading code of the same bit rate for each
11
individual signal. Once the signals have been spread they are able to be transmitted at any
interval over the channel in the system (Mark, 202).
The second type of CDM implementation is frequency hopping spread spectrum (FHSS).
As its name implies FHSS achieves spread spectrum communication by pseudo-randomly
changing a signal’s carrier frequency multiple times during transmission (Goldsmith, 423). As
with DSSS the PN codes in FHSS are used to spread the individual signals in the system across
the available bandwidth. Unlike DSSS which use the PN codes to spread the entire transmission
across the entire bandwidth, FHSS uses the PN codes as a guide to the sequence of frequencies
which are to be used during the transmission. Also as in DSSS each transmitter and receiver set
in the system must use the same PN code to accurately transmit data. The rate of the frequency
hopping is determined by each system. There are two types of frequency hopping. The first
technique (slow hopping) switches frequency after a multiple of a whole symbol period. This
technique would then switch frequency after a complete symbol is sent not switching before at
least one complete symbol is sent. The second type (fast hopping) switches frequency an even
number of times each symbol period. This technique would then break a single symbol into
pieces that can be received over a number of frequencies by the receiver. Slow hopping requires
a less complex system, but fast hopping adds to the robustness of the system.
Although CDM is a more complex process than that of FDM and TDM, it has several
advantages over the other types of multiplexing techniques. PN codes shared by only the
transmitter and receiver add an inherit amount of security to systems using CDM, and additional
users all use different PN codes making all other users transmission in effect noise to each other
(Mahmoud, 374). Noise added by other users joining the system only gradually affects the
accuracy of the system making a tightly controlled CDM system a spectrally efficient system.

12
Although synchronization between the transmitter and receiver is paramount for CDM as well as
it was for TDM, TDM requires a system level synchronization in order to accurately transmit
signals but CDM only requires synchronization between each transmitter and receiver. Along
with synchronization CDM systems do not require extra control processing to assign resources.
Transmission can begin once a transmission and receiver pair agrees on a PN code series.
Bandwidth in a CDM system can be shared with another system using other multiplexing
techniques as the added energy from the other system would only affect the CDM system as
added noise. While CDM has several advantages there are a few disadvantages which must be
taken into account. Transmission power in CDM must be tightly controlled as each additional
user adds energy to the system. The power transmitted from each user must be balanced so no
single user overpowers the rest of the users in the system (Mahmoud, 380). The PN codes
themselves also are a limiting factor to a CDM system. Creating a large set of orthogonal
spreading codes is difficult and without orthogonally as multiple users joined a CDM system the
accuracy and robustness of the system would be jeopardized.
Phenomena Affecting Wireless Communications System
There are several phenomena which affect any RF communications system. Fading,
multipath, and ambient noise all must be taken into account when designing various sections of
the RF system to ensure accuracy, reliability, and usability of the system. Tools and techniques
can be used throughout the communications system to counteract the negative affects all of these
phenomena have on a system, but system complexity verses the performance gains of adding
complexity to a system much be weighed in order to optimize a system based on its needs.

13
Multipath
Multipath is a phenomenon that is used to describe what happens to an RF signal as it is
broadcasted from transmitter to receiver. This phenomenon occurs at the time of transmission
where a transmitted signal is not sent in a single straight line to the receiver but in all directions.
Therefore a receiver does not only receive a single signal but a series of signals that are
comprised of replicated signals that have taken different routes to get to the receiver. The
multiple paths that the transmitted signal takes to the receiver is known as multipath. A problem
caused by multipath is that it causes the received signal to have a combination of several signals
not all necessarily reaching the receiver at the same time, with respect to when the signal was
transmitted. Each extra signal or “echo” received after the first causes interference with the main
signal and subsequently alters it. The signal is altered much like it is with intersymbol
interference. The influence of the echos at the receiver causes the signal to become skewed from
its original leading to errors in a system that is not designed to handle this extra influx. The
problems that multipath creates are only compounded in a dynamic, moving environment. The
first problem that can occur is when the receiver moves, changing its distance from transmitter.
This movement, even though small, can cause significant fluctuations in the received signals,
because when the multiple signals are being received the small change can affect what part of the
signal’s period is received. Slight movements can change whether a signal’s trough or peak is
received. Compounding a single received signal with multiple signals as a result of multipath
will only multiply the amount of fluctuation that a receiver can see. This type of problem is the
result of slight movement, less than a wavelength, but another problem is caused by movement
between the transmitter and receiver of a wireless system is a result of further, rapid movement.
This type of movement causes an increase or decrease of the transmitted signals frequency as

14
perceived at the receiving end. A receiver moving towards the transmitter will experience an
increase in frequency of the received signal. Conversely, a receiver that is moving away from
the transmitter will experience a decrease in frequency of the received signal. This effect is
known as the Doppler Effect.
Ricean Fading
Ricean fading is a phenomenon that is caused because of the multipath issues created in a
wireless communications system. Ricean fading is a fading prediction model designed to be true
under the specification that the line of sight between transmitter and receiver is unobstructed
(Rappaport, 213). A probabilistic function can be made to find the amplitude of the received
signal at any point in time, using the Ricean probability distribution.
(2.1)
Raleigh Fading
Raleigh fading is a phenomenon that is caused because of the multipath issues created in a
wireless communications system (Agrawal, 69-71). Raleigh fading is a fading prediction model
designed to be true under the specification that the line of sight between transmitter and receiver
is obstructed. A probabilistic function can be made to find the amplitude of the received signal
at any point in time, using the Raleigh probability distribution.
(2.2) signal received theof valuerms theis where
r= x} at time Amplitude{x
22
2
2
σσ
σ∫∞
⎟⎟⎠
⎞⎜⎜⎝
⎛−
≥ dretPr
order zero and kindfirst theoffunction Bessel modified theis and signal,sight of line theof amplitudepeak theisA
signals,sight -of-line-non summed theof valuerms theis where
r= x} at time Amplitude{
0
x20
22
2
22
I
drArIetPAr
σσσ
σ∫∞
⎟⎟⎠
⎞⎜⎜⎝
⎛ +−
⎟⎠⎞
⎜⎝⎛≥
15
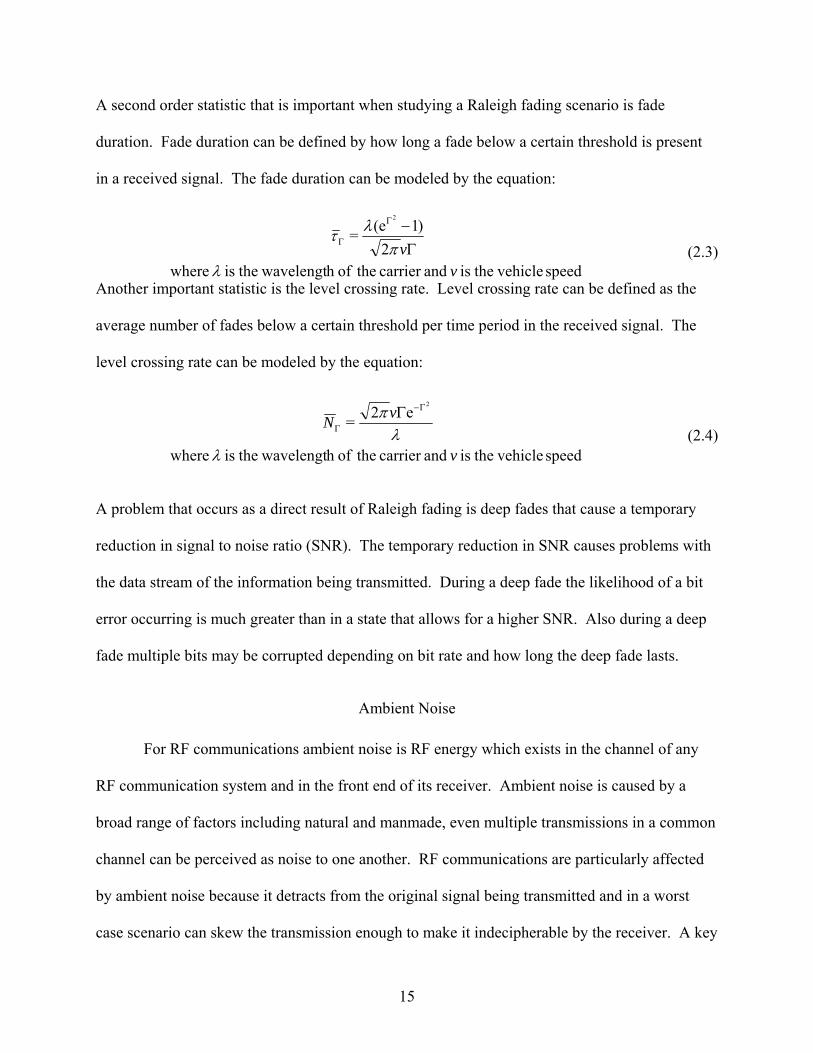
A second order statistic that is important when studying a Raleigh fading scenario is fade
duration. Fade duration can be defined by how long a fade below a certain threshold is present
in a received signal. The fade duration can be modeled by the equation:
(2.3)
Another important statistic is the level crossing rate. Level crossing rate can be defined as the
average number of fades below a certain threshold per time period in the received signal. The
level crossing rate can be modeled by the equation:
(2.4)
A problem that occurs as a direct result of Raleigh fading is deep fades that cause a temporary
reduction in signal to noise ratio (SNR). The temporary reduction in SNR causes problems with
the data stream of the information being transmitted. During a deep fade the likelihood of a bit
error occurring is much greater than in a state that allows for a higher SNR. Also during a deep
fade multiple bits may be corrupted depending on bit rate and how long the deep fade lasts.
Ambient Noise
For RF communications ambient noise is RF energy which exists in the channel of any
RF communication system and in the front end of its receiver. Ambient noise is caused by a
broad range of factors including natural and manmade, even multiple transmissions in a common
channel can be perceived as noise to one another. RF communications are particularly affected
by ambient noise because it detracts from the original signal being transmitted and in a worst
case scenario can skew the transmission enough to make it indecipherable by the receiver. A key
speed vehicle theis andcarrier theofh wavelengt theis where2
)1(e=2
vv
λπ
λτΓ−Γ
Γ
speed vehicle theis andcarrier theofh wavelengt theis where
e2=2
v
vN
λλ
π Γ−
ΓΓ
16
ratio for any system is the SNR which measures the strength of the transmitted signal verses the
measured noise in the bandwidth of the channel which the system is using. As noise increases in
the channel the SNR decreases essentially diluting the signal prior to processing by the receiver.
At the receiver a lowering of the SNR reduces system accuracy. There are techniques to combat
noisy environments, such as urban environments or areas where multiple transmitters are being
used simultaneously. Several techniques include increasing transmitted power, error control
coding, and multiplexing and modulation techniques. Using a combination of techniques offers
the best solution to the detriments of noisy ambient conditions. In the case of a RFID system
ambient noise will be caused by normal outside interference sources (nearby electronics,
industrial settings, multiple transmitting RF tags, electronic noise in the receiver front end, etc)
but a system which utilizes passive tags has limited transmission power. A combination of
design techniques will have to be utilized in order to create an accurate and robust system.
RFID System Using DSSS
As discussed earlier in this chapter the objective of this research requires the
development and simulation of a RFID system. In order for the system to be able to be used by
multiple RF tags the system must utilize some method of multiplexing. Three different
multiplexing techniques (FDM, TDM, and CDM) have been identified with advantages and
disadvantages outlined. In choosing a multiplexing technique that is best suited to be used with a
RFID system several factors were taken into consideration. Since passive tags were chosen as
the RF tag for the simulated system power consumption, simplicity, and robustness of the system
were paramount factors when assessing the multiplexing techniques. The technique chosen
would have to be low power as the passive tags used would have no internal power source. It
would need to be simplistic enough to operate with low power and be placed on a small RF tag,

17
and simple enough to be mass produced for multiple tags. Also the technique chosen would
have to be able to efficiently and accurately manage an unknown number of tags transmitted
simultaneously. Finally the technique would need to be robust as the data transmitted would
have to be accurate or the data collected would be useless for the user, and the system would be
used in many different, possibly noisy, environments with many tags responding simultaneously.
When power was considered a TDM system would not be favorable as the antenna power on and
off cycles required would waste power available to the tag limiting the amount of data that could
be sent or risking the ability of the tag to transmit its complete data. All the multiplexing
techniques require a certain amount of complexity to be accomplished successfully making none
standout as an ideal simple solution. Therefore conceptualizing and producing the electronics
needed to accomplish the multiplexing techniques on the tags will be left to further research
leaving robustness as the other factor in consideration for choosing a multiplexing technique.
Both TDM and FDM require tight system wide synchronization to be kept to ensure system
accuracy where CDM would only require synchronization between the tag and scanner. In
addition to system wide synchronization, the coordination required to handle an unknown
number of tags transmitting simultaneously is much higher using a FDM or TDM system as
opposed to a CDM system which is able to handle a system with this type of uncertainty without
added complexity. Also CDM would be able to handle multiple tags and noisy environments
more spectrally efficient than TDM or FDM. A further dissection into CDM showed that the
processing requirement for FHSS would not be ideal for the chosen passive tags. The final
choice based power consumption and robustness was then DSSS.
18
Practical and Mathematical Limitations of the System Capacity of a DSSS RFID System
A paramount concern for any multiple access communications system is defining the
maximum number of users who may use the system at a single time while not degrading the
quality of the system below a certain threshold. This maximum number of users can be defined
as the system capacity. Similar to other multiple access techniques a system which employs
DSSS for multiple access must pay particular attention to its system capacity. There are several
practical and mathematical limitations which are inherent to a DSSS multiple access system.
As discussed earlier in this chapter DSSS takes the individual users’ signals and spreads
them out via a unique spreading code over a larger bandwidth allowing multiple users to all use
the same bandwidth by having unique spreading codes. As each additional user’s signal is added
to the bandwidth available the amount of relative noise in comparison to each user’s signal
power is lessened. Effectively as each user adds a signal to the system the signals act as additive
noise in the channel of the system. As the noise increases, the SNR of the system decreases
adversely affecting the reliability and accuracy of the system once the SNR drops below a
minimum threshold (Rappaport, 474). Once below the minimum SNR threshold the noise
overpowers the information encoded in the individual signals causing errors at the receiver when
the decoding process is performed. Although a DSSS system would appear to have a relatively
low threshold to additive noise from other users the PN spreading codes allow a much greater
system capacity without as great of sensitivity to additive noise in the channel. In this way a
DSSS system’s capacity has a soft limit by allowing additional users (each one slightly
increasing the amount of interference in the system) while still providing an acceptable quality of
service to the users.
19
The PN spreading codes in a DSSS system allow multiple users to utilize the same
bandwidth with little interference to each other and allow for users’ communications to have
privacy with only those who have access to common PN codes. PN codes are independent of the
information being transmitted and in the case of a DSSS system allow a lower bandwidth data
signal to be spread over a much larger bandwidth shared by other similar signals. Then the same
PN code used to encode the spread the data allows the receiver to decipher the original data
signal transmitted out of the seemly noisy channel. PN code’s properties mimic those of random
noise as they appear to be random, independent and equiprobable, but in a DSSS system they are
anything but random. In a DSSS system PN codes are deterministic and therefore pseudo
random. PN codes must also be uncorrelated meaning the codes have no dependence on each
other and are approximately orthogonal to each other. PN codes must be approximately
orthogonal so that as they are transmitted across a channel their power spectral density is similar
to that of white Gaussian noise spreading evenly across the bandwidth of the channel. PN codes
which are not orthogonal create an uneven distribution across the bandwidth decreasing system
robustness and accuracy (Mahmoud, 371-383).
PN codes are precisely designed such that they maximize desired system performance by
specifying the characteristics of the codes and producing them accordingly. There are three main
characteristics of PN codes which are universal to DSSS systems. The first characteristic is
balance of the code. The total number of “0”s and “1”s contain in the PN code should differ by
no more than one. The second characteristic is the amount and number of the bit run lengths in
the PN codes. Half of the respective groupings of “1”s and “0”s should only be one bit long, a
fourth of the groups should be two bits long, an eighth of the groups should be three bits long,
and so forth. The final key characteristic is ensuring correlation of the PN code. Comparing a

20
PN code with itself only shifted by any number greater than zero and less than its length should
produce a balanced sequence (Mahmoud, 375). A set of PN codes with the characteristics
described ensures the codes appear to be random and independent allowing for some of the
benefits of a DSSS system to be realized, multiple access of users and privacy, but creating the
PN codes can prove to be a limiting factor of the system based on the availability of processing
power.
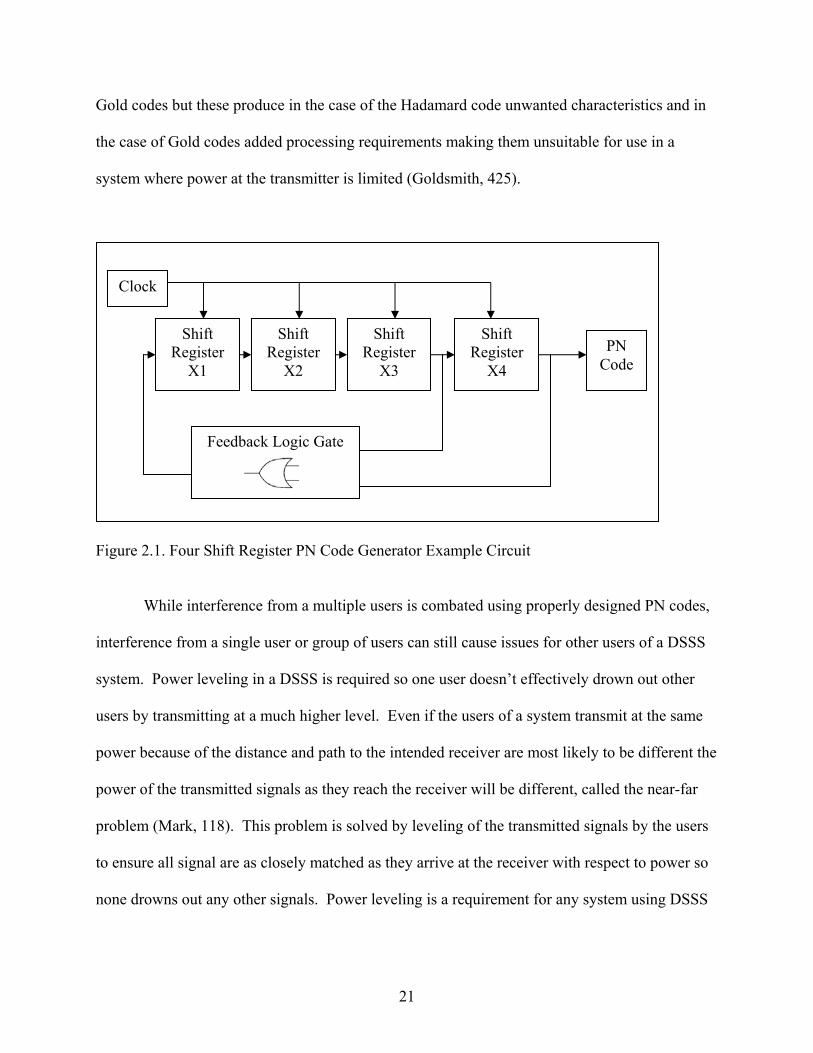
PN codes are said to be approximately orthogonal as creating an orthogonal sequence
with an indefinitely large bandwidth can not be practically generated (Goldsmith, 425).
However, approximately orthogonal PN codes can be created by using a series of shift registers
and logic gates in feedback, Figure 2.1 (Mahmoud, 377). PN codes produced in this manner are
limited in length dependant on the number of shift registers used to create the sequence. A
circuit with four shift registers can only produce a maximum length of fifteen bits before it
repeats because there are fifteen unique combinations of values in the shift registers which are
not all equal to zero at the same time (such a condition would keep the shift registers all equal to
zero after subsequent shifts). In general a circuit with N shift registers can produce PN
sequences with 2N-1 bits without repeating. The circuit utilizing shift registers and logic gates in
feedback can produce a shorter PN sequence but these would be less random as they would
repeat more often which is less desirable in a DSSS system. A shift register and logic gate
circuit producing PN sequences of 2N-1 bits produces the maximum length of non repeating
sequences and is said to be a maximal length PN code generator (Mahmoud, 377). In order to
create PN codes using this method several shift registers and logic gates must be used. This
increases processing and power needs of each transmitter in the system. There are several
additional types of PN codes which can be used for DSSS systems such as Walsh-Hadamard and
21
Gold codes but these produce in the case of the Hadamard code unwanted characteristics and in
the case of Gold codes added processing requirements making them unsuitable for use in a
system where power at the transmitter is limited (Goldsmith, 425).
Figure 2.1. Four Shift Register PN Code Generator Example Circuit
While interference from a multiple users is combated using properly designed PN codes,
interference from a single user or group of users can still cause issues for other users of a DSSS
system. Power leveling in a DSSS is required so one user doesn’t effectively drown out other
users by transmitting at a much higher level. Even if the users of a system transmit at the same
power because of the distance and path to the intended receiver are most likely to be different the
power of the transmitted signals as they reach the receiver will be different, called the near-far
problem (Mark, 118). This problem is solved by leveling of the transmitted signals by the users
to ensure all signal are as closely matched as they arrive at the receiver with respect to power so
none drowns out any other signals. Power leveling is a requirement for any system using DSSS
Clock
Shift Register
X1
Shift Register
X2
Shift Register
X3
Shift Register
X4
Feedback Logic Gate
PN Code
22
for multiple access and requires added processing in order to control the power of transmitted
signals.
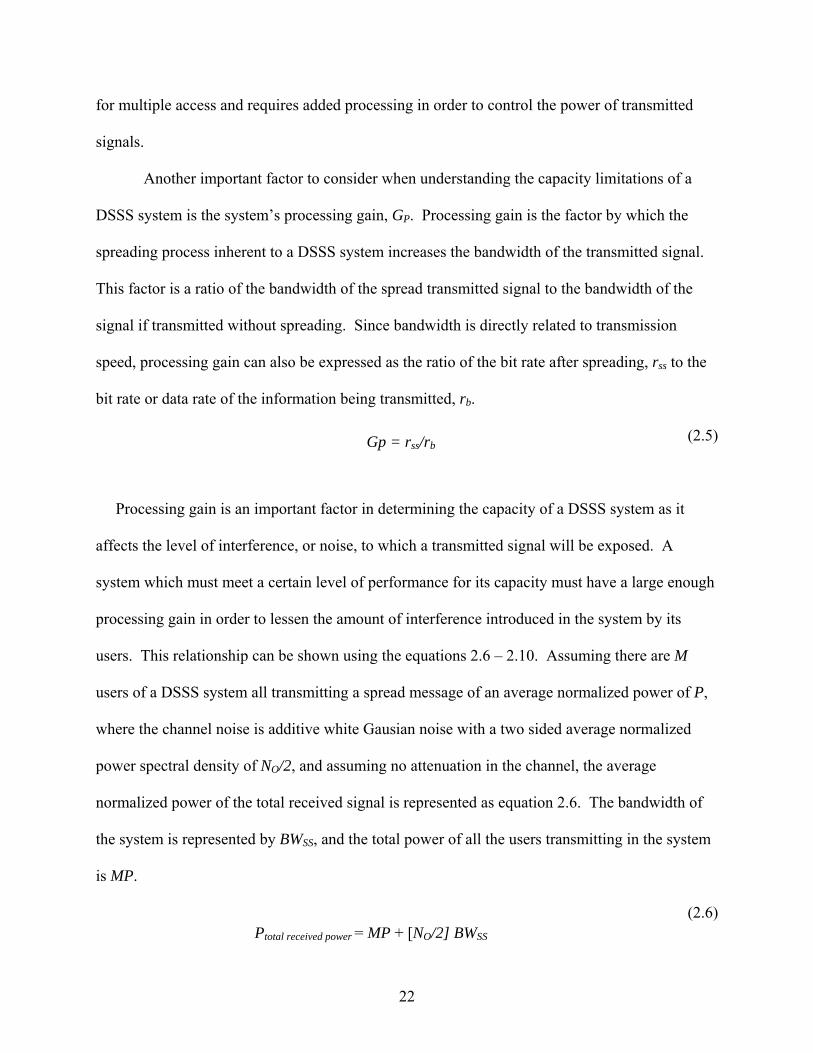
Another important factor to consider when understanding the capacity limitations of a
DSSS system is the system’s processing gain, GP. Processing gain is the factor by which the
spreading process inherent to a DSSS system increases the bandwidth of the transmitted signal.
This factor is a ratio of the bandwidth of the spread transmitted signal to the bandwidth of the
signal if transmitted without spreading. Since bandwidth is directly related to transmission
speed, processing gain can also be expressed as the ratio of the bit rate after spreading, rss to the
bit rate or data rate of the information being transmitted, rb.
(2.5)
Processing gain is an important factor in determining the capacity of a DSSS system as it
affects the level of interference, or noise, to which a transmitted signal will be exposed. A
system which must meet a certain level of performance for its capacity must have a large enough
processing gain in order to lessen the amount of interference introduced in the system by its
users. This relationship can be shown using the equations 2.6 – 2.10. Assuming there are M
users of a DSSS system all transmitting a spread message of an average normalized power of P,
where the channel noise is additive white Gausian noise with a two sided average normalized
power spectral density of NO/2, and assuming no attenuation in the channel, the average
normalized power of the total received signal is represented as equation 2.6. The bandwidth of
the system is represented by BWSS, and the total power of all the users transmitting in the system
is MP.
(2.6) Ptotal received power = MP + [NO/2] BWSS
Gp = rss/rb

23
The signal-to-noise ratio (SNR) at each receiver prior to dispreading can then be calculated by
Equation 2.7.
(2.7)
Then during the despreading of the received signal at the receiver, a single user’s signal is
concentrated into a bandwidth that is 1/GP the bandwidth of the spread signal (see Equation 2.5).
Since the interference from the other users of the system and channel noise are still present, the
SNR of a despread signal, after lowpass filtering with a cutoff frequency of BWss/Gp, can be
represented by equation 2.8.
(2.8)
For further simplification, in a practical DSSS system the total interference from the transmitting
users of the system is assumed to be much greater than the noise in the channel making the
SNRafter despreading equal to equation 2.9.
(2.9)
SNRbefore despreading =
P
( M-1)P + [NO/2] BWSS
SNRafter despreading = P
{ ( M-1)P + [NO/2] BWSS }1 GP
( M-1)P + [NO/2] BWSS = = GPSNRbefore despreading
SNRafter despreading ~ GP P
( M-1)P
GP P
( M-1)P
=

24
Equations 2.6 – 2.9 illustrate how processing gain and system capacity are related (Mahmoud,
380-381). In order to meet a minimum performance for a maximum capacity in a DSSS, system
a designer must take into account the processing gain and design the system with a large enough
processing gain to meet the required performance. Similarly system capacity can be limited
based on the available processing gain of the system. The processing gain of the system can be
limited by either the amount of bandwidth available for the system to operate or the technology
limitations of the transmitters and receivers using the system.
When designing a system using DSSS as a multiple access technique, power and
processing limitations must be taken into account as they plan an important role in the ability to
produce accurate transmissions. Sufficient power is required to not only handle the operations
which must take place to transmit a signal in a DSSS system, added power is required to handle
the added processing required to handle the spreading of the signal with a unique PN codes and
level signal transmission power to ensure proper power level at the receiver. In a RFID DSSS
system using passive tags power efficiency is of the utmost concern. Since a passive RFID tag
does not have any internal power source of its own and harvests power through passive methods
a major limiting factor in the design of a RFID DSSS system is making the design of the tag
efficient enough to allow for the necessary operations to be performed to meet an acceptable
quality of service for the system. Limitations on system capacity begin when processing power
needed to create a large enough pool of quality PN codes exceeds the power available to the tag.
In turn this limits the complexity of how the PN codes can be generated resulting in shorter
length codes and a smaller number of unique PN codes which can be generated. This limits
system capacity as fewer tags can use the same bandwidth simultaneously because they either are
limited by the number of codes available for use or there is too much interference from other tags

25
in use at the same time for accurate communication. Although these factors will limit the
number of tags which can be used simultaneously in a DSSS RFID system, added enhancements
to a standard DSSS system can allow for a greater system capacity without incorporating costly
power adding techniques.
26
CHAPTER 3
As discussed in Chapter 2 a passive RFID data collection system using DSSS as its
multiplexing technique has been chosen for development and evaluation. In addition to a
standard DSSS implementation two additional techniques will be added to the system to improve
the accuracy and spectral efficiency, allowing more tags to use the same system bandwidth.
Technique #1 (Subtraction of correctly received RFIDs)
An inherent issue when designing a DSSS system is managing the SNR of the system.
Specifically as it relates to a passive RFID data collection system, a large number of tags can be
present and simultaneously transmitting in the range of a polling scanner, potentially creating an
excess amount of interference and lowering SNR. As the SNR of the system decreases the
potential for decoding errors increases, jeopardizing the system’s accuracy. In order to mitigate
low SNR, a technique was devised to artificially reduce interference during the decoding process
at the scanner. As discussed in Chapter 2, the goal of the system is to decode information from
many different simultaneously-transmitting tags. The reader can receive and store the total
received signal and then, as an individual tag’s information is correctly despread, decoded and
the data recorded by the scanner, the reader can subtract the tag’s transmitted signature from the
total signal received. By subtracting each correctly decoded tag’s transmitted signature from the
total received signal the SNR of system will be increased, and increasing the SNR of the system
will lessen the probability for bit errors to occur during the decoding steps for each of the
remaining tags.
27
For this technique to be implemented successfully any tag’s signature which is subtracted
from the total received signal must be decoded correctly. If an incorrectly decoded tag’s
signature is subtracted from the total received signal erroneous data will be introduced into the
received signal, subsequently causing the higher likelihood more errors will occur during the
decoding process. To insure that no erroneous data is introduced into the system the receiver
must be certain the tag data most recently decoded is correct. There are several possible ways to
have certainty at the receiver the information received is correct. A possible solution would be
to use error correcting coding, ECC, to correct any errors during the decoding process before
they could be carried on to the rest of the decoding process. Another possible solution would
insert a powerful error detecting code such as a cyclic redundancy check, CRC, into each tag’s
code allowing the receiver to detect errors in the received data. Although both of these methods
would be possible in an RFID system for the use of the system and simulation described in this
document the tags responding to the scanner are assumed to all be know and cataloged
electronically. Therefore as the tags are decoded they are checked using a catalog as a reference
and only considered decoded correctly if they match a valid catalog entry. The use of an ECC or
error detecting code would allow flexibility in the system as the reader would not need to store
all possible valid catalog entries but will not be added to the simulated system as a part of this
research. Future research could incorporate the use of advanced techniques such as ECC or error
detection codes to further mature a DSSS RFID system. To further enhance this technique of
subtracting correctly received tag’s signature from the received signal a recursive method can be
added which will continue to attempt decoding tags from the total received signal until for a
certain number of attempts or time period. Repeating the decoding process several times should
28
raise the SNR of the system allowing tags whose information has been corrupted or drowned out
by other tags and ambient noise to have a higher likelihood of being decoded correctly.
Technique #2 (Staggering Tag’s Transmission)
As discussed in chapter 2, there are mathematical and real world limitations when
implementing a DSSS. Most notably the limitations are the finite number of unique
pseudorandom orthonormal spreading codes and the number of tags responding at a single time
lowering the SNR to a point below a level to insure acceptable system accuracy. Any technique
implemented must work within these constraints in order to have an accurate and reliable system.
The second technique used to maximize the number of tags that can respond in a DSSS RFID
system is to employ a pseudo TDM method in conjunction with the CDMA method already used.
In this system the tags would be imbedded along with the identification data and pseudorandom
orthonormal spreading codes with a timing variable. The timing variable is an identifier that
allows the tag to know when it should transmit its data. Unlike a traditional TDM system no
clock signal will be needed. The scanner will transmit an initial polling signal that will include a
timing variable. The tag will then check its own timing variable against what is being sent by the
scanner, and if they match it will then transmit its data. This will allow for the tags to be sent
divided into groups based on their timing variable. Once an allotted amount of time has passed
or the scanner is ready it will poll with the next timing variable, receiving the next group of tags
until all timing variables have been used polling all tags within range. For this method to be
most effective the number of tags must be evenly grouped and a standard format for the timing
variable must be known and implemented. A similar implementation of this technique would
have the scanner to send a polling signal but for all the responding tags to randomly choose a
timing delay. The delays would have to be multiples of the amount of time necessary for the tag
29
to transmit its message in order to allow tags using a particular time slot to fully complete their
transmission prior to more tags beginning to transmit. As the tags would randomly choose their
timing delay they should be distributed close to evenly over the possible response period. If
implemented correctly using an even, random distribution of the tags over the possible response
groups the capacity of tags allowable on a RFID system would be increased by a factor of the
number of response groups or timing variables used.
Comparable Techniques Already Implemented
Current implementations of RFID data systems include spread spectrum as one of many
implementations for multiple access. Although the use of spread spectrum has not been
standardized from system to system so proprietary techniques are common for many data
collection systems. Both FHSS and DSSS multiple access techniques are being employed in
systems because of the inherent benefits the techniques lend to a data collection system. As well
as the obvious multiple access benefits which are inherent to spread spectrum, systems which
either use or suggest use of spread spectrum for multiple access focus on the benefits a spread
spectrum system has with respect to lessening the probability for collisions within the system
(Rohatgi, 3501-3504). Although research has been performed and data is readily available
outlining the benefits of spread spectrum for use in RFID data collection systems (Mazurek, 25-
32) there is no apparent IEEE industry wide standard for a system which uses either FHSS or
DSSS for multiple access (IEEE 802.15 WPAN RFID Study Group).
Prior to successful and practical implementation of spread spectrum multiple access
techniques rudimentary and cumbersome techniques were used. One such technique was known
as the Interrogator Talks-First (ITF) protocol. ITF was an Electronic Product Code (EPC)
standard for handling anti collision in RFID systems and is further described in ISO/IEC 18000-3
30
Mode 2. This protocol requires the interrogator or scanner to poll each individual tag in order to
access the tag’s information. This method of polling tags was slow due to the scanner having to
poll each individual tag and was power inefficient as the scanner must power up and down for
many polls. In addition to the technical inefficiencies of the ITF protocol it also would have
been unrealistic in a data collection system with many IDs because of the amount of time it
would take a scanner to poll the IDs. Spread spectrum (both FHSS and DSSS) research for use
in RFID systems has allowed the advancement of the systems from the inherent benefits of
spread spectrum multiple access techniques. In particular the benefits of better anti collision and
multiplexing techniques are areas where spread spectrum has shown promise to make RFID data
collection systems more reliable and efficient. Spread spectrum multiple access research for use
in RFID systems has laid the groundwork for more advanced systems utilizing additional
techniques to supplement conventional FHSS and DSSS.
To date much of the research in the area of using spread spectrum in RFID systems,
following the initial reason of providing a means for multiple access, has been directed towards
preventing signal collision in a wireless environment (Rohatgi, 3501-3504). Practical limits on
the number of users per spread spectrum RFID system seem to have been generally regarded as
acceptable with much of the research emphasis being focused on advancements in anti collision
techniques. Although anti collision techniques are of paramount concern to the overall accuracy
and reliability of any RFID data collection system the focus of this document is to verify the
ability of DSSS to be used as the multiple access technique for an RFID system and explore
additional methods which allow for expansion of the number of users, RFID tags, in the system
while not sacrificing reliability or accuracy. Furthermore the suggested improvements discussed
in this chapter would not require drastic advancements in technology. Only a few minor

31
adjustments to a current DSSS RFID system would be required to implement either or both of
the suggested improvements, and the effect of the improvements will show an overall gain in
spectral efficiency by allowing more RFID tags to reliably use the same bandwidth
simultaneously.
32
CHAPTER 4
A software simulation was developed to efficiently model a RFID system with multiple
tags which uses DSSS as its multiple access technique. The simulated system was used to gather
statistics to quantify the accuracy of a basic DSSS system. The improvement techniques
discussed in chapter three were then implemented to study what effect they would have on the
system. Finally noise was added to the simulated channel to further test the effects the
techniques had on the system and their immunity to channel noise. The results presented in this
chapter show how significantly the improvement techniques each add to the accuracy of the
system and provide analysis concerning each respective technique’s performance.
Description of a Simulated DSSS RFID System in MATLAB
A basic simulation of a RFID system using DSSS was needed, first to baseline the
effectiveness of using DSSS as a modulation technique and later as the foundation for additional
simulations which add the innovative techniques discussed in chapter 3. The MathWorks™
MATLAB software package was chosen for its ability to create such a simulation and give
customizable output for analysis purposes. The base simulation was comprised of only the
necessary components of a RFID system and models a static environment with a strong line of
sight signal. Additional components would then be added as necessary to evaluate the accuracy
of the system. Adding a minimal number of components or sections to the simulation would
allow for the accuracy of the system to first be characterized then evaluated with the additional
techniques without interference or system degradation from unneeded simulation steps or
33
components, effectively allowing the techniques to be highlighted first by themselves and
evaluated separately and then together in the system.
At first a MATLAB program had to be created which incorporated the necessary
functions of a DSSS transmitter and receiver. For simulation purposes it was decided that the act
of the scanner to poll an area would be assumed to be the action of executing the simulation
program and therefore the program would start with the response of the RFID tags in range. In
the simulation the RFID tags standardized as unique eight binary bit array codes. The tags were
given no other relevant information other than the codes. In early simulations tags codes were
set prior to executing the simulation in order to trace the expected value through the system.
Once a stable simulation was developed a method was incorporated to allow a user identified
number of tags with random eight bit codes to be added to the system. After tags had been
enumerated in the simulation they were then encoded (by using an exclusive-or XOR logic
function) with the PN spreading code which would be kept in matrix for later use by the receiver
during the decoding process. The PN code in the simulation was generated by using a built in
function of MATLAB which can be used to output a random binary array or matrix. A unique
PN spreading code of length x was created for each RFID where x is a user input integer
spreading factor (or processing gain Gp) multiplied by the number of bits per tag. This process
simulates the transmitter of the RFID spreading the signal over a larger bandwidth by increasing
the number of bits which are to be transmitted over the same time period. Following the
encoding step with the PN code the RFIDs were separately modulated using the built in
MATLAB function qammod(x,M). The qammod function modulates a signal x using quadrature
amplitude modulation of an alphabet size of M. An alphabet of size 2 was chosen for the
simulation for simplicity. The modulated signals of all of the tags responding to the scanner’s

34
poll were then added together simulating the information of the tags being transmitted across the
channel of the RFID system. To better simulate the channel of the system the total transmitted
signal was distorted with additive white Gaussian noise by using the MATLAB function awgn.
The total signal with the additive white Gaussian noise was then considered to be the signal
received by the scanner of the system and what would be used in order to extract each tag’s
information.
On the receiving end of the system the transmitted sign plus the additive white Gaussian
noise was decoded using the MATLAB function qamdemod. In the simulation the output of the
qamdemod function is the total received signal following its transmission across the channel.
The receiver then performs the decoding of the received signal by using a XOR logic function
between the PN code matrix created at the beginning of the simulation and the total received
signal. The output of the XOR logic function is a matrix of the tags information. The accuracy
of the system can then be evaluated by comparing what was transmitted (i.e. the tag’s
information) and what was received (i.e. information decoded by the receiver). Both the number
of bit errors and number of tags successfully received are important in characterizing the
accuracy and effectiveness of the system. The number of bits errors is important as it represents
the overall accuracy of the system where the number of tags successfully received reflects the
effectiveness of the system.
Adding Technique #1 (Tag Subtraction) to the DSSS RFID System Simulation
Technique #1 (Tag Subtraction), subtracting a correctly decoded tag’s signature from the
total received signal, was implemented in the receiver portion of the simulation. The simulation
source code of the receiver was changed so that the total received signal was decoded in an
iterative process where only one PN code from the matrix was used at a time to XOR with the
35
total received signal. As the decoding process took place for each PN code, the information
resulting from the XOR function of the output was checked against the expected output and if
correct the information signature would be subtracted from the received signal. A priority of the
receiver for this technique was to ensure the signal being subtracted is correct with no bit errors
because a corrupted signal, one with bit errors, if subtracted from the received signal would
introduce more error and potentially more bit errors into the overall system causing a
downstream flow of errors to be introduced. If the receiver determined the decoded information
to be correct the information would be modulated and subtracted from the received signal; if the
decoded information was in error then the received signal was not changed. Then to continue
decoding the information the received signal would be demodulated again followed by an XOR
function with the next PN code from the matrix. This process would continue until all tags’
information had been properly decoded or for a set number of iterations determined by the
receiver’s settings.
Adding Technique #2 (Tag Staggering) to the DSSS RFID System Simulation
To implement Technique #2 (Tag Staggering) in the simulation of the DSSS RFID
system the tags were each assigned a random delay variable (called a staggering number) from a
user identified range of zero to x, where x is a positive integer. The staggering number is placed
at the beginning of each tag’s information. Assigning a staggering number at random to each tag
does not ensure an even distribution of tags between the staggering numbers, but allowing the
tags to be distributed at random over the staggering numbers produces a more realistic simulation
as in a real world environment the tags will not always be distributed exactly evenly. After the
staggering numbers have been assigned to the tags in the simulation, as the scanner polls the tags
it does so iteratively; only requesting tags which begin with the integer zero respond. These tags
36
beginning with zero are processed throughout the simulation normally excluding the beginning,
staggering integer. Following the processing of the tags with zero as their beginning integer the
scanners polls the tags again requesting only tags beginning with the integer one, repeating the
process till the scanner requests tags which begin with the integer x. The scanner has now
performed the polling process x times with all the tags responding at some time during the
process.
Combining Technique #1 (Tag Subtraction) and Technique #2 (Tag Staggering) in the DSSS RFID System Simulation
Incorporating Technique #1 and Technique #2 into the DSSS RFID system simulation
only required the coding for each technique to be inserted into the main DSSS simulation.
Neither technique was changed, only inserted to be able to both be performed during the
simulation.
Results of the DSSS RFID System Simulation
Baseline for the DSSS RFID System Simulation
To efficiently gather a large sample size of results using the DSSS RFID system
simulation a simple MATLAB program called rfid_sub_test.m was developed which when
executed would perform the DSSS RFID system simulation a user defined number of iterations
and return the average of the key accuracy benchmarks for the system. These benchmarks were
number of errors and number of RFID tag’s information correctly received divided by the
number of iterations performed. In order to baseline the DSSS RFID system simulation
rfid_sub_test.m was used to perform one thousand iterations of the base system simulation (no
added techniques employed, only basic DSSS) using the inputs of 301 for the spreading factor
37
and 100 RFID tags with no noise present over the transmission channel. The rfid_sub_test.m
program was then run a second time using the same parameters to validate the results and add
additional sample size to the testing. The results of the of the two individual rfid_sub_test.m
program runs were then averaged together with those results being used as the baseline for the
DSSS RFID system simulation’s average number of bit errors per simulation and average
number of correctly received RFID tag’s information. The simulation using the parameters
outlined above, spreading factor of 301 and 100 RFID tags, averaged 66.619 bit errors and
49.837 correctly received RFID tag’s information. Note that the two numbers do not add up to
100 because some of the RFID tags experienced multiple bit errors.
The program rfid_sub_test.m would be used through out the remainder of testing to
gather a large number of samples of the DSSS system simulation for each configuration of the
system using Techniques #1 and #2. In addition the same function parameters, spreading factor
of 301 and 100 RFID tags, and data gathering methodology, performing one thousand system
simulations twice then averaging the results, were used throughout the remainder of testing as
well.
DSSS RFID System Simulation Using Technique #1 (Tag Subtraction)
The Technique #1 (Tag Subtraction) module was then inserted into the main simulation
program in order to test the effectiveness of the technique as opposed to the standard DSSS
system simulation which was previously baselined. The simulation was then run following the
standard simulation and data gather method above with the inclusion of a single iteration of
subtracting the correctly received RFID tags. The results of the single subtraction iteration in the
DSSS system simulation were an average of 64.8705 bit errors and 50.8535 correctly received
RFID tag’s information. The addition of a single tag subtraction iteration showed a decrease in
38
the average bit errors per simulation cycle of 2.625% and an improvement in the correctly
received RFID tags per simulation cycle of 2.04%. The number of subtractions iterations was
then increased by a single iteration from two iterations up to ten subtraction iterations to show
the improvement of the system simulation as the number of correctly received tag subtraction
iterations increased. When using ten subtraction iterations the improvement to the system
decreased the average number of bit errors per cycle by 36.13% and increased the average
number of correctly received RFID tags per simulation cycle by 41.82%. The results of the
testing, as expected, showed a continual improvement as the number of subtraction iterations
increased. A graphical representation of the results from the testing is shown in Figure 4.1. An
analysis of the results from the testing of the DSSS system simulation using one to ten tag
subtraction iterations revealed the initial few iteration cycles lent the greatest benefit to the
system. As the iteration cycles increased the percentage improvement in the accuracy of the
system from a number of subtraction iterations to the next generally began to decline or flatten
out. In short at after a certain number of subtraction cycles Technique #1 returns begin to
diminish. Prudent inclusion of Technique #1 into any further systems then required a study to
find the optimum number of subtraction iterations for efficient use of system resources.
In order to optimize technique #1 for further use in the DSSS system simulation
rfid_sub_test.m was modified to perform 1000 cycles of the simulation where 100 RFID tags
were present similar to prior testing except allow for a maximum of 100 correctly received tag
subtraction iterations. The rfid_sub_test.m program was also modified to include a section
which would compare the number of RFID tags correctly received from one subtraction iteration
to the next. Then at the end of each cycle the number would be saved into an array showing
when the final subtraction iteration produced any further correctly received tags’ information.
39
The output of this test showed the maximum number of subtraction iterations which ever
produced any further correctly received tags to be 31 iterations with the average number of the
subtraction iterations over the 1000 cycles equaling 5.913. Although the data showed for the
1000 cycles simulated the maximum yield for correctly received tags would be fully met during
every cycle by subtracting the correctly received tags for 31 iterations performing the maximum
number of subtraction iterations would be wasteful using unneeded system processing resources
when taking into consideration the average subtraction iterations per cycles equaled less than 6.
The median of the subtraction iteration vector from the 1000 cycle simulation was then taken
into consideration as performing the median number of subtraction iterations would allow the
majority of the testing cycles to max out their number of correctly received RFID tag’s
information. The median of the subtraction vector returned from the modified rfid_sub_test.m
program equaled six subtraction iterations. To further optimize technique #1 the modified
rfid_sub_test.m program was again used to perform 1000 cycles simulation allowing for a
maximum of 31 tag subtraction iterations each cycle. Using the output vector which contains the
maximum number of subtraction iterations needed for each cycle, the percentage of cycles which
required six or less subtraction cycles was found to be 64.5%. Testing again measuring the
percentage of cycles which required seven or less subtraction cycles, eight or less iterations, and
nine or less iterations was found to be 82.3%, 92.3%, 97.4% respectively. As the use of eight
subtraction iterations would be sufficient in maximizing the benefits of technique #1 in over 90%
of the cycles simulated and considering the accuracy increase is less than 0.5% between
performing eight verses nine or greater subtraction iteration cycles it was decided the optimum
setting for tag subtraction iterations following DSSS RFID system simulations incorporating
Technique #1 would be chosen as eight. In conjunction with the analytical process performed
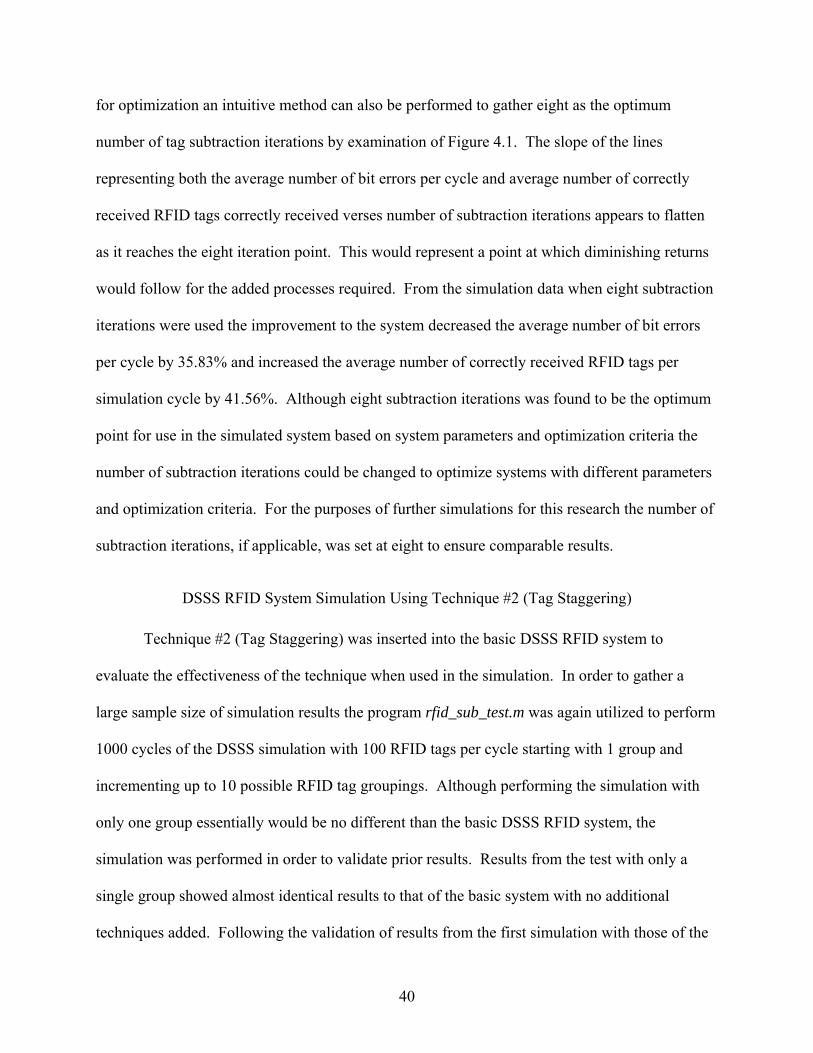
40
for optimization an intuitive method can also be performed to gather eight as the optimum
number of tag subtraction iterations by examination of Figure 4.1. The slope of the lines
representing both the average number of bit errors per cycle and average number of correctly
received RFID tags correctly received verses number of subtraction iterations appears to flatten
as it reaches the eight iteration point. This would represent a point at which diminishing returns
would follow for the added processes required. From the simulation data when eight subtraction
iterations were used the improvement to the system decreased the average number of bit errors
per cycle by 35.83% and increased the average number of correctly received RFID tags per
simulation cycle by 41.56%. Although eight subtraction iterations was found to be the optimum
point for use in the simulated system based on system parameters and optimization criteria the
number of subtraction iterations could be changed to optimize systems with different parameters
and optimization criteria. For the purposes of further simulations for this research the number of
subtraction iterations, if applicable, was set at eight to ensure comparable results.
DSSS RFID System Simulation Using Technique #2 (Tag Staggering)
Technique #2 (Tag Staggering) was inserted into the basic DSSS RFID system to
evaluate the effectiveness of the technique when used in the simulation. In order to gather a
large sample size of simulation results the program rfid_sub_test.m was again utilized to perform
1000 cycles of the DSSS simulation with 100 RFID tags per cycle starting with 1 group and
incrementing up to 10 possible RFID tag groupings. Although performing the simulation with
only one group essentially would be no different than the basic DSSS RFID system, the
simulation was performed in order to validate prior results. Results from the test with only a
single group showed almost identical results to that of the basic system with no additional
techniques added. Following the validation of results from the first simulation with those of the
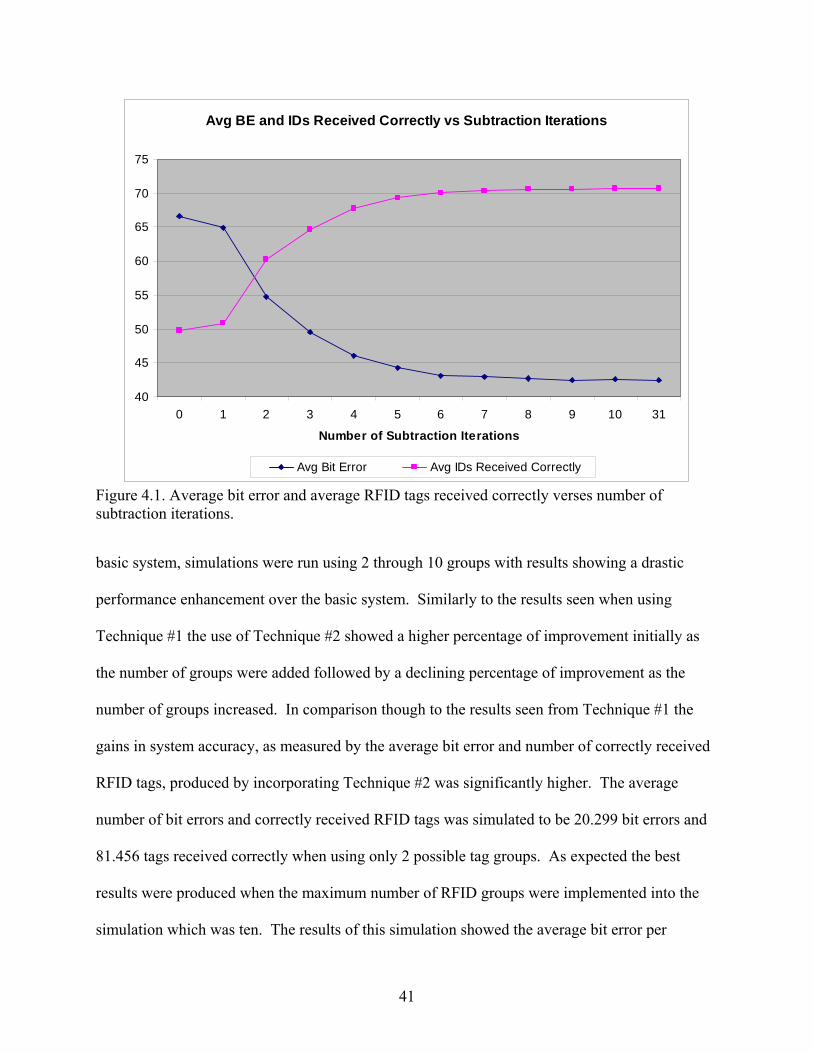
41
Avg BE and IDs Received Correctly vs Subtraction Iterations
40
45
50
55
60
65
70
75
0 1 2 3 4 5 6 7 8 9 10 31
Number of Subtraction Iterations
Avg Bit Error Avg IDs Received Correctly
Figure 4.1. Average bit error and average RFID tags received correctly verses number of subtraction iterations.
basic system, simulations were run using 2 through 10 groups with results showing a drastic
performance enhancement over the basic system. Similarly to the results seen when using
Technique #1 the use of Technique #2 showed a higher percentage of improvement initially as
the number of groups were added followed by a declining percentage of improvement as the
number of groups increased. In comparison though to the results seen from Technique #1 the
gains in system accuracy, as measured by the average bit error and number of correctly received
RFID tags, produced by incorporating Technique #2 was significantly higher. The average
number of bit errors and correctly received RFID tags was simulated to be 20.299 bit errors and
81.456 tags received correctly when using only 2 possible tag groups. As expected the best
results were produced when the maximum number of RFID groups were implemented into the
simulation which was ten. The results of this simulation showed the average bit error per
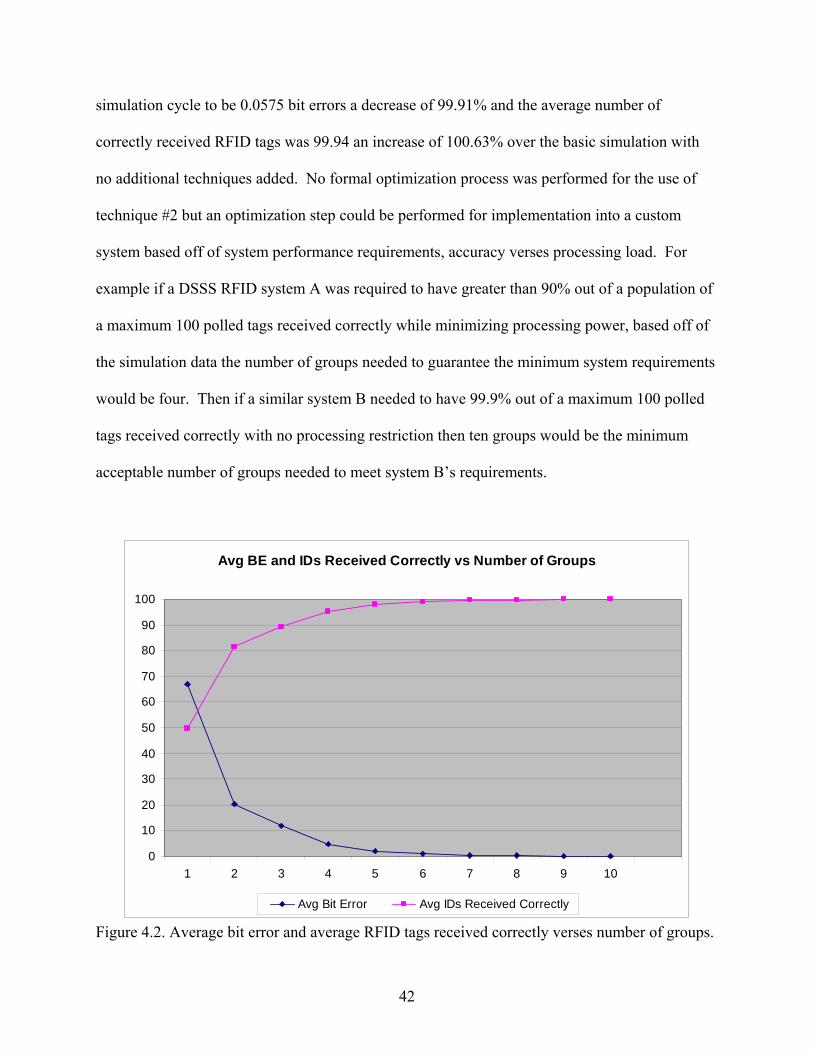
42
simulation cycle to be 0.0575 bit errors a decrease of 99.91% and the average number of
correctly received RFID tags was 99.94 an increase of 100.63% over the basic simulation with
no additional techniques added. No formal optimization process was performed for the use of
technique #2 but an optimization step could be performed for implementation into a custom
system based off of system performance requirements, accuracy verses processing load. For
example if a DSSS RFID system A was required to have greater than 90% out of a population of
a maximum 100 polled tags received correctly while minimizing processing power, based off of
the simulation data the number of groups needed to guarantee the minimum system requirements
would be four. Then if a similar system B needed to have 99.9% out of a maximum 100 polled
tags received correctly with no processing restriction then ten groups would be the minimum
acceptable number of groups needed to meet system B’s requirements.
Avg BE and IDs Received Correctly vs Number of Groups
0
10
20
30
40
50
60
70
80
90
100
1 2 3 4 5 6 7 8 9 10
Avg Bit Error Avg IDs Received Correctly
Figure 4.2. Average bit error and average RFID tags received correctly verses number of groups.
43
DSSS RFID System Simulation Using a Combination of the Optimized Technique #1 (Tag Subtraction) and Technique #2 (Tag Staggering)
In order to evaluate the effectiveness of using both the optimized Technique #1 (Tag
Subtraction) and Technique #2 (Tag Staggering) in a DSSS RFID system simulation, the basic
system simulation was modified such that both techniques were used. For testing, the system
simulation was configured so that the number of subtraction iterations for technique #1 would be
set at eight, which was concluded to be optimized for this particular application based on prior
testing. In order to gain a large number of samples of the simulation results the rfid_sub_test.m
was again used with the parameters of 1000 simulation cycles of the DSSS RFID system
simulation with 100 RFID tags. The number of subtraction iterations of Technique #1 would be
kept the same while the number of groups incorporated for Technique #2 would be varied from
one to ten to gather data similar to what was gathered before for comparison purposes. The data
gathered during these simulations is shown in Figure 4.3. When the data from the system using
the combination of Technique #1 and Technique #2 is compared with the results from the system
using only Technique #2, the system using the combination of techniques shows a significant
improvement in accuracy where a lower number of tag groups are used. Stated simply, as the
number of groups is lowered the system using a combination of improvement techniques shows
an increasing level of accuracy when compared to a system using only Technique #2. In the
simulation where tags were separated into a possible two groups the average bit error decreased
by 53.39% and the total number of correctly received tags increased by 12.60% from the data
gathered from the simulations only employing Technique #2. Subsequent simulations resulted in
possible tag groups of three, four, and five having the average bit error decreased by 55.64%,
61.89%, and 67.82% and the average number of correctly received RFID tags increased by
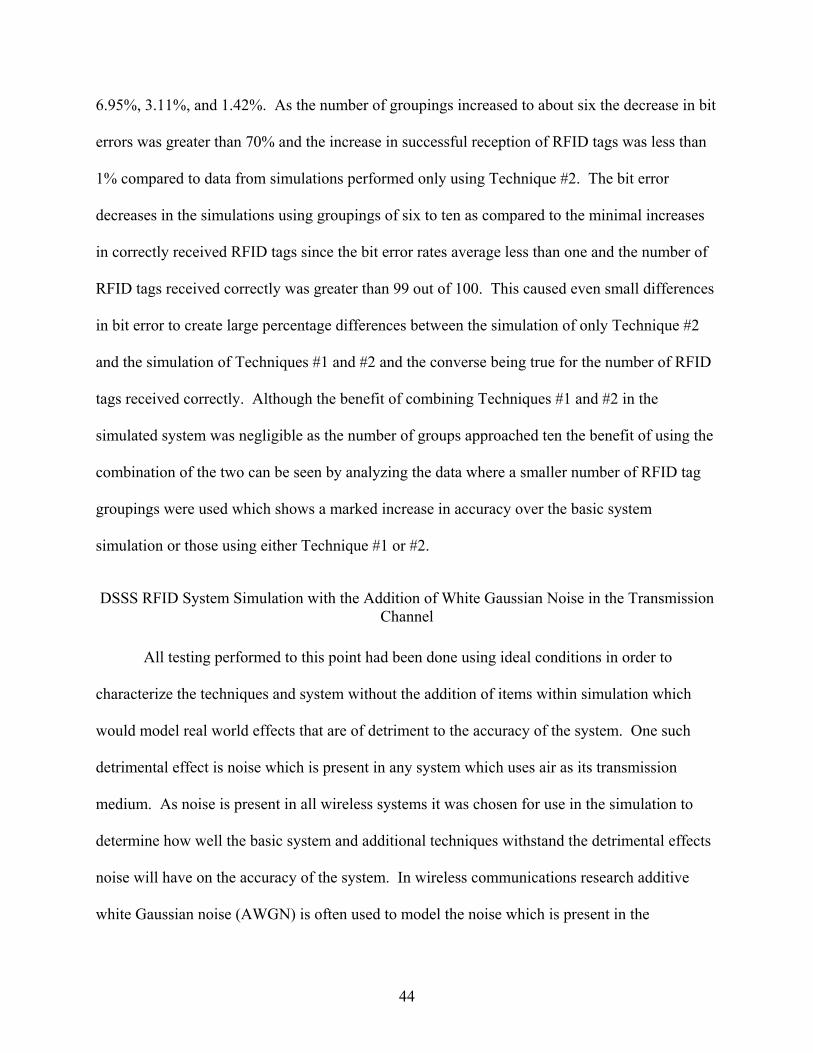
44
6.95%, 3.11%, and 1.42%. As the number of groupings increased to about six the decrease in bit
errors was greater than 70% and the increase in successful reception of RFID tags was less than
1% compared to data from simulations performed only using Technique #2. The bit error
decreases in the simulations using groupings of six to ten as compared to the minimal increases
in correctly received RFID tags since the bit error rates average less than one and the number of
RFID tags received correctly was greater than 99 out of 100. This caused even small differences
in bit error to create large percentage differences between the simulation of only Technique #2
and the simulation of Techniques #1 and #2 and the converse being true for the number of RFID
tags received correctly. Although the benefit of combining Techniques #1 and #2 in the
simulated system was negligible as the number of groups approached ten the benefit of using the
combination of the two can be seen by analyzing the data where a smaller number of RFID tag
groupings were used which shows a marked increase in accuracy over the basic system
simulation or those using either Technique #1 or #2.
DSSS RFID System Simulation with the Addition of White Gaussian Noise in the Transmission Channel
All testing performed to this point had been done using ideal conditions in order to
characterize the techniques and system without the addition of items within simulation which
would model real world effects that are of detriment to the accuracy of the system. One such
detrimental effect is noise which is present in any system which uses air as its transmission
medium. As noise is present in all wireless systems it was chosen for use in the simulation to
determine how well the basic system and additional techniques withstand the detrimental effects
noise will have on the accuracy of the system. In wireless communications research additive
white Gaussian noise (AWGN) is often used to model the noise which is present in the
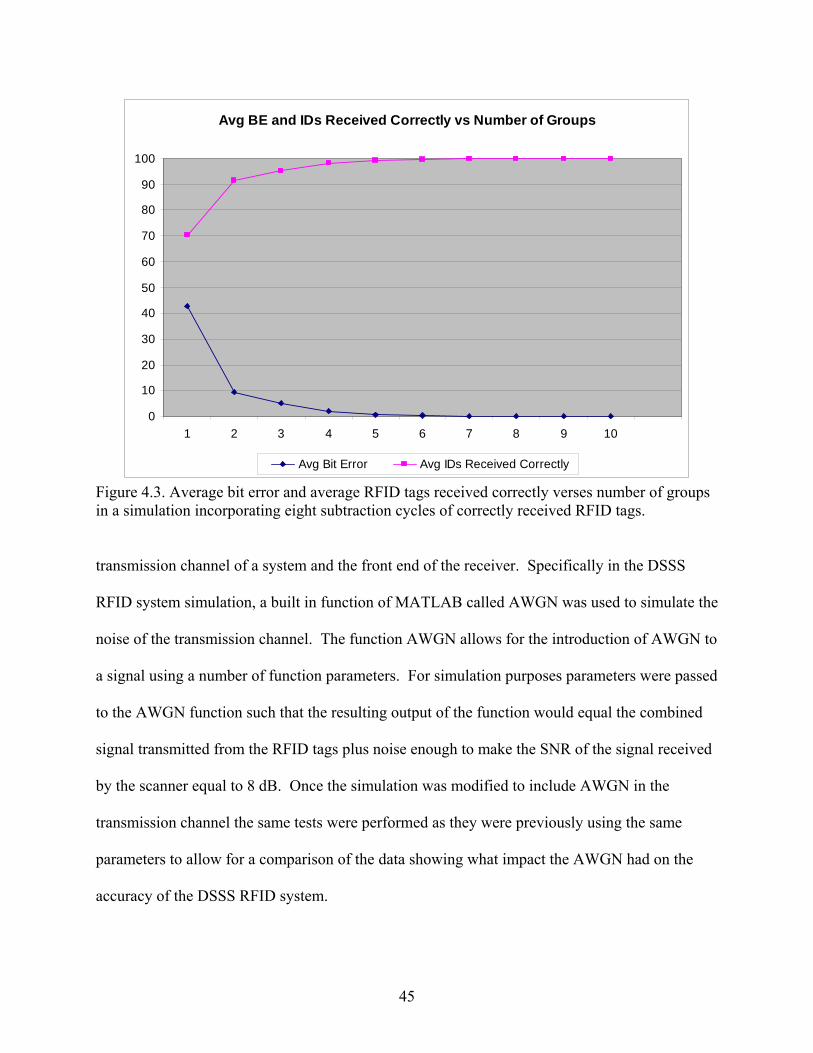
45
Avg BE and IDs Received Correctly vs Number of Groups
0
10
20
30
40
50
60
70
80
90
100
1 2 3 4 5 6 7 8 9 10
Avg Bit Error Avg IDs Received Correctly
Figure 4.3. Average bit error and average RFID tags received correctly verses number of groups in a simulation incorporating eight subtraction cycles of correctly received RFID tags.
transmission channel of a system and the front end of the receiver. Specifically in the DSSS
RFID system simulation, a built in function of MATLAB called AWGN was used to simulate the
noise of the transmission channel. The function AWGN allows for the introduction of AWGN to
a signal using a number of function parameters. For simulation purposes parameters were passed
to the AWGN function such that the resulting output of the function would equal the combined
signal transmitted from the RFID tags plus noise enough to make the SNR of the signal received
by the scanner equal to 8 dB. Once the simulation was modified to include AWGN in the
transmission channel the same tests were performed as they were previously using the same
parameters to allow for a comparison of the data showing what impact the AWGN had on the
accuracy of the DSSS RFID system.
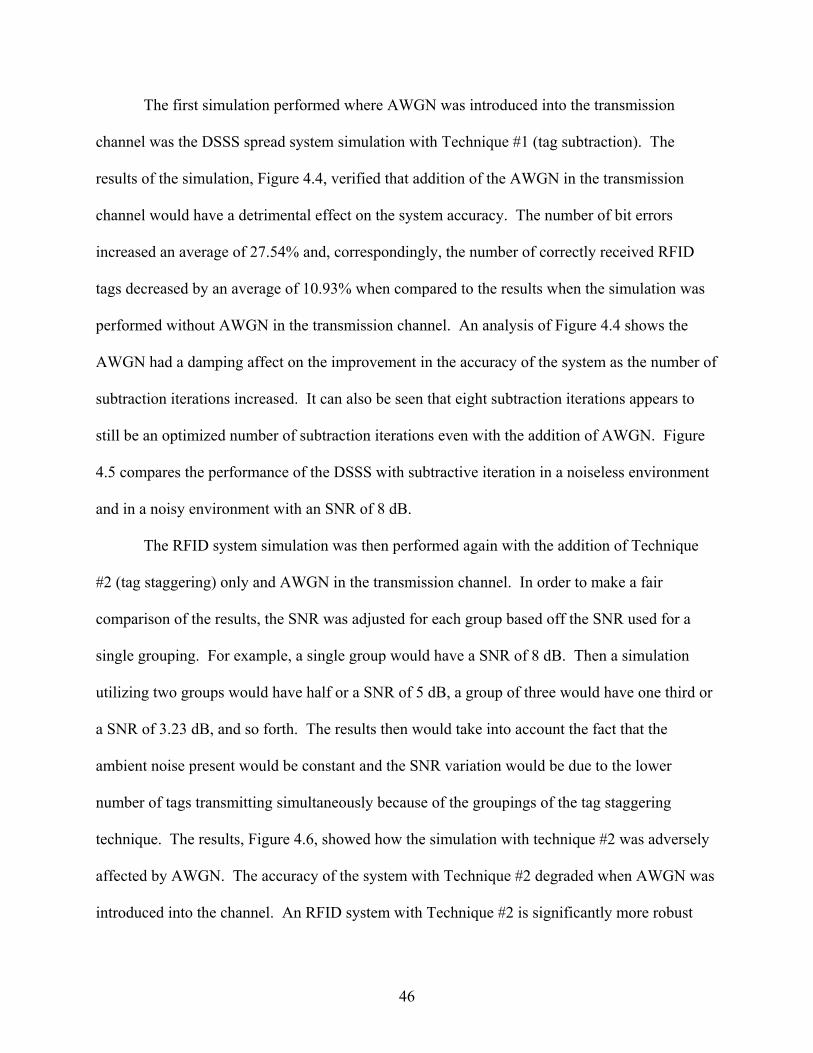
46
The first simulation performed where AWGN was introduced into the transmission
channel was the DSSS spread system simulation with Technique #1 (tag subtraction). The
results of the simulation, Figure 4.4, verified that addition of the AWGN in the transmission
channel would have a detrimental effect on the system accuracy. The number of bit errors
increased an average of 27.54% and, correspondingly, the number of correctly received RFID
tags decreased by an average of 10.93% when compared to the results when the simulation was
performed without AWGN in the transmission channel. An analysis of Figure 4.4 shows the
AWGN had a damping affect on the improvement in the accuracy of the system as the number of
subtraction iterations increased. It can also be seen that eight subtraction iterations appears to
still be an optimized number of subtraction iterations even with the addition of AWGN. Figure
4.5 compares the performance of the DSSS with subtractive iteration in a noiseless environment
and in a noisy environment with an SNR of 8 dB.
The RFID system simulation was then performed again with the addition of Technique
#2 (tag staggering) only and AWGN in the transmission channel. In order to make a fair
comparison of the results, the SNR was adjusted for each group based off the SNR used for a
single grouping. For example, a single group would have a SNR of 8 dB. Then a simulation
utilizing two groups would have half or a SNR of 5 dB, a group of three would have one third or
a SNR of 3.23 dB, and so forth. The results then would take into account the fact that the
ambient noise present would be constant and the SNR variation would be due to the lower
number of tags transmitting simultaneously because of the groupings of the tag staggering
technique. The results, Figure 4.6, showed how the simulation with technique #2 was adversely
affected by AWGN. The accuracy of the system with Technique #2 degraded when AWGN was
introduced into the channel. An RFID system with Technique #2 is significantly more robust
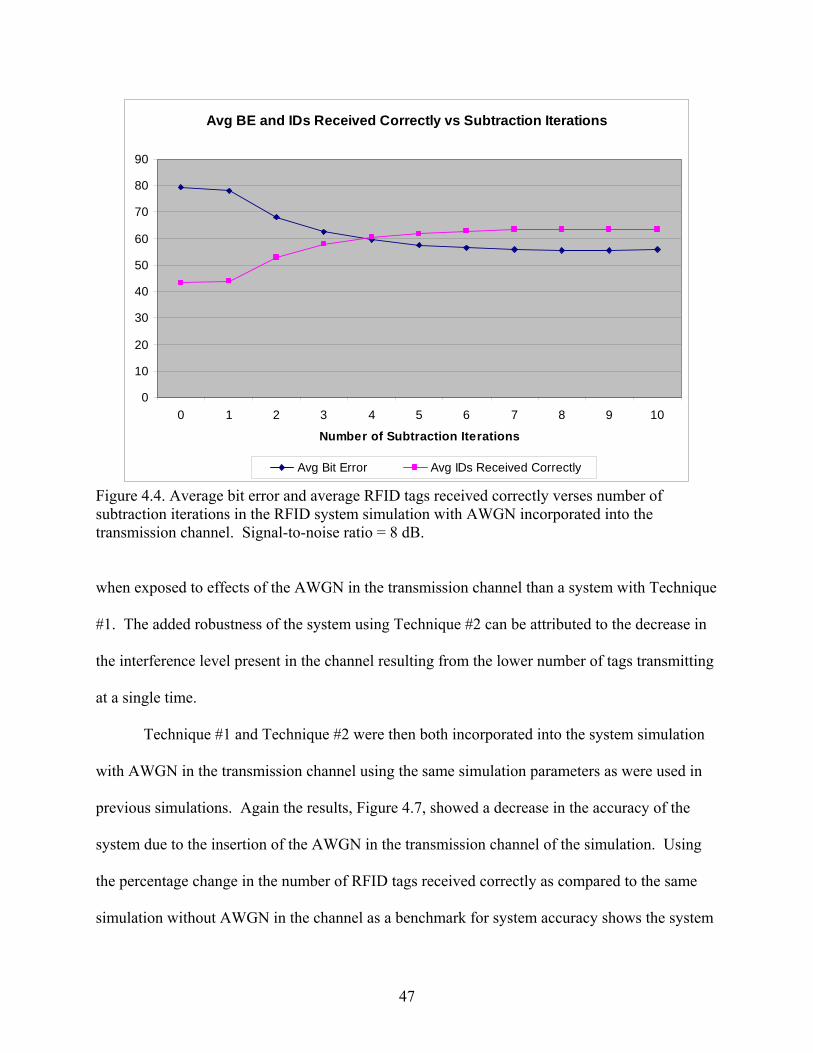
47
Avg BE and IDs Received Correctly vs Subtraction Iterations
0
10
20
30
40
50
60
70
80
90
0 1 2 3 4 5 6 7 8 9 10
Number of Subtraction Iterations
Avg Bit Error Avg IDs Received Correctly
Figure 4.4. Average bit error and average RFID tags received correctly verses number of subtraction iterations in the RFID system simulation with AWGN incorporated into the transmission channel. Signal-to-noise ratio = 8 dB.
when exposed to effects of the AWGN in the transmission channel than a system with Technique
#1. The added robustness of the system using Technique #2 can be attributed to the decrease in
the interference level present in the channel resulting from the lower number of tags transmitting
at a single time.
Technique #1 and Technique #2 were then both incorporated into the system simulation
with AWGN in the transmission channel using the same simulation parameters as were used in
previous simulations. Again the results, Figure 4.7, showed a decrease in the accuracy of the
system due to the insertion of the AWGN in the transmission channel of the simulation. Using
the percentage change in the number of RFID tags received correctly as compared to the same
simulation without AWGN in the channel as a benchmark for system accuracy shows the system
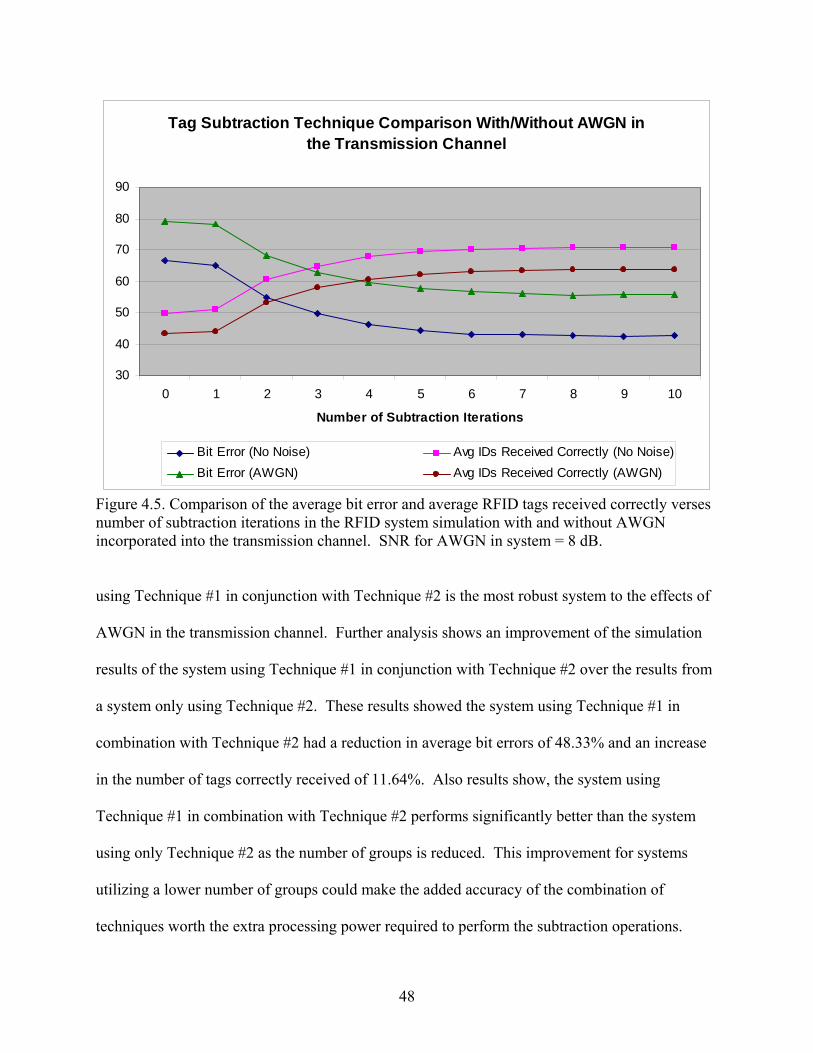
48
Tag Subtraction Technique Comparison With/Without AWGN in the Transmission Channel
30
40
50
60
70
80
90
0 1 2 3 4 5 6 7 8 9 10
Number of Subtraction Iterations
Bit Error (No Noise) Avg IDs Received Correctly (No Noise)Bit Error (AWGN) Avg IDs Received Correctly (AWGN)
Figure 4.5. Comparison of the average bit error and average RFID tags received correctly verses number of subtraction iterations in the RFID system simulation with and without AWGN incorporated into the transmission channel. SNR for AWGN in system = 8 dB.
using Technique #1 in conjunction with Technique #2 is the most robust system to the effects of
AWGN in the transmission channel. Further analysis shows an improvement of the simulation
results of the system using Technique #1 in conjunction with Technique #2 over the results from
a system only using Technique #2. These results showed the system using Technique #1 in
combination with Technique #2 had a reduction in average bit errors of 48.33% and an increase
in the number of tags correctly received of 11.64%. Also results show, the system using
Technique #1 in combination with Technique #2 performs significantly better than the system
using only Technique #2 as the number of groups is reduced. This improvement for systems
utilizing a lower number of groups could make the added accuracy of the combination of
techniques worth the extra processing power required to perform the subtraction operations.
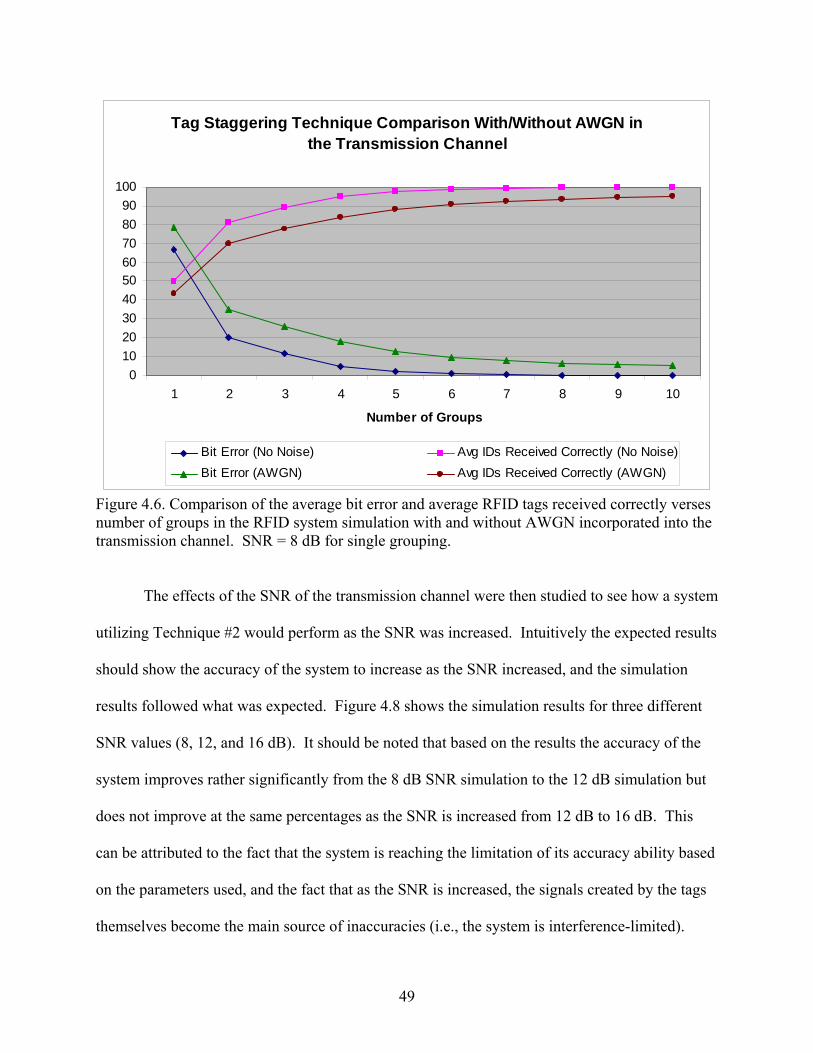
49
Tag Staggering Technique Comparison With/Without AWGN in the Transmission Channel
0102030405060708090
100
1 2 3 4 5 6 7 8 9 10
Number of Groups
Bit Error (No Noise) Avg IDs Received Correctly (No Noise)Bit Error (AWGN) Avg IDs Received Correctly (AWGN)
Figure 4.6. Comparison of the average bit error and average RFID tags received correctly verses number of groups in the RFID system simulation with and without AWGN incorporated into the transmission channel. SNR = 8 dB for single grouping.
The effects of the SNR of the transmission channel were then studied to see how a system
utilizing Technique #2 would perform as the SNR was increased. Intuitively the expected results
should show the accuracy of the system to increase as the SNR increased, and the simulation
results followed what was expected. Figure 4.8 shows the simulation results for three different
SNR values (8, 12, and 16 dB). It should be noted that based on the results the accuracy of the
system improves rather significantly from the 8 dB SNR simulation to the 12 dB simulation but
does not improve at the same percentages as the SNR is increased from 12 dB to 16 dB. This
can be attributed to the fact that the system is reaching the limitation of its accuracy ability based
on the parameters used, and the fact that as the SNR is increased, the signals created by the tags
themselves become the main source of inaccuracies (i.e., the system is interference-limited).
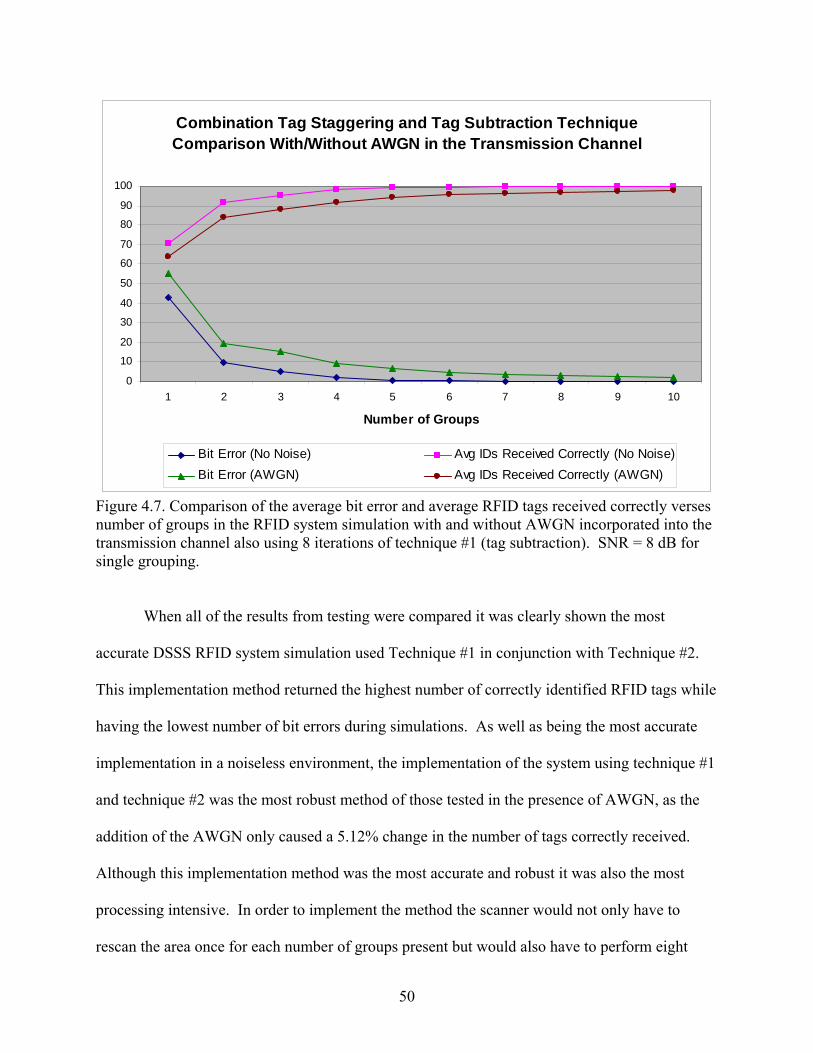
50
Combination Tag Staggering and Tag Subtraction Technique Comparison With/Without AWGN in the Transmission Channel
0
10
20
30
40
50
60
70
80
90
100
1 2 3 4 5 6 7 8 9 10
Number of Groups
Bit Error (No Noise) Avg IDs Received Correctly (No Noise)Bit Error (AWGN) Avg IDs Received Correctly (AWGN)
Figure 4.7. Comparison of the average bit error and average RFID tags received correctly verses number of groups in the RFID system simulation with and without AWGN incorporated into the transmission channel also using 8 iterations of technique #1 (tag subtraction). SNR = 8 dB for single grouping.
When all of the results from testing were compared it was clearly shown the most
accurate DSSS RFID system simulation used Technique #1 in conjunction with Technique #2.
This implementation method returned the highest number of correctly identified RFID tags while
having the lowest number of bit errors during simulations. As well as being the most accurate
implementation in a noiseless environment, the implementation of the system using technique #1
and technique #2 was the most robust method of those tested in the presence of AWGN, as the
addition of the AWGN only caused a 5.12% change in the number of tags correctly received.
Although this implementation method was the most accurate and robust it was also the most
processing intensive. In order to implement the method the scanner would not only have to
rescan the area once for each number of groups present but would also have to perform eight
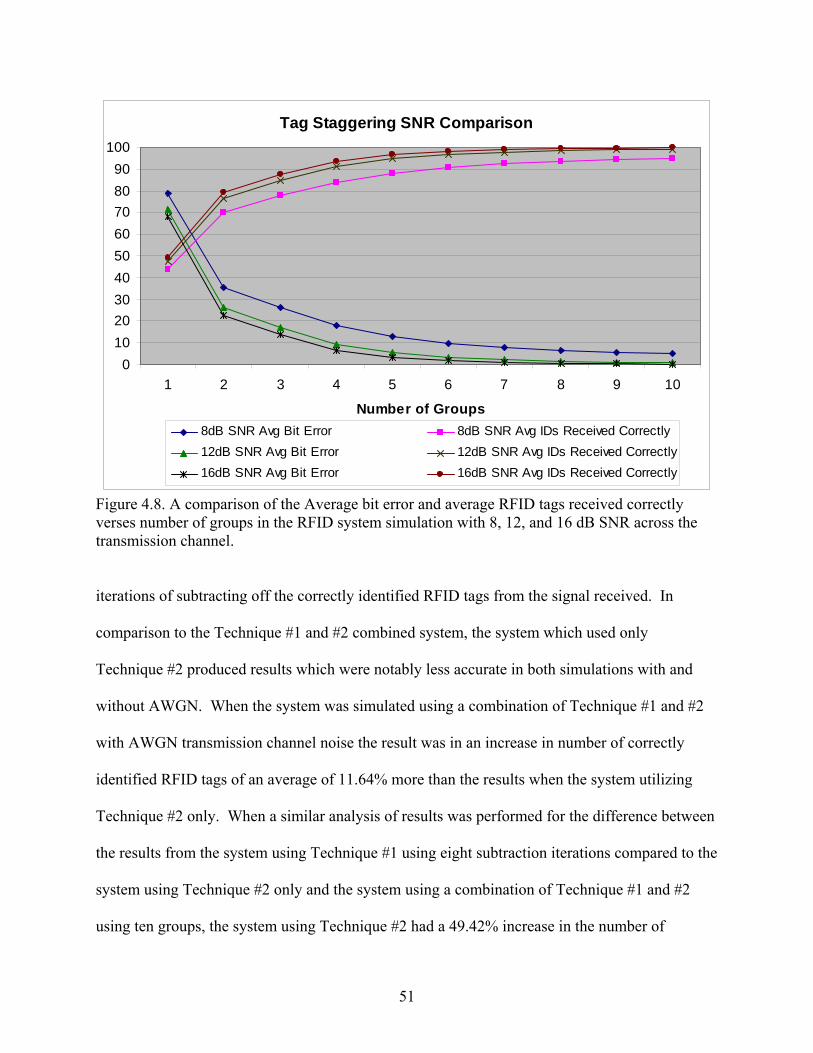
51
Tag Staggering SNR Comparison
0102030405060708090
100
1 2 3 4 5 6 7 8 9 10
Number of Groups8dB SNR Avg Bit Error 8dB SNR Avg IDs Received Correctly12dB SNR Avg Bit Error 12dB SNR Avg IDs Received Correctly16dB SNR Avg Bit Error 16dB SNR Avg IDs Received Correctly
Figure 4.8. A comparison of the Average bit error and average RFID tags received correctly verses number of groups in the RFID system simulation with 8, 12, and 16 dB SNR across the transmission channel.
iterations of subtracting off the correctly identified RFID tags from the signal received. In
comparison to the Technique #1 and #2 combined system, the system which used only
Technique #2 produced results which were notably less accurate in both simulations with and
without AWGN. When the system was simulated using a combination of Technique #1 and #2
with AWGN transmission channel noise the result was in an increase in number of correctly
identified RFID tags of an average of 11.64% more than the results when the system utilizing
Technique #2 only. When a similar analysis of results was performed for the difference between
the results from the system using Technique #1 using eight subtraction iterations compared to the
system using Technique #2 only and the system using a combination of Technique #1 and #2
using ten groups, the system using Technique #2 had a 49.42% increase in the number of
52
correctly identified RFID tags and the system using a combination of Technique #1 and #2 had a
53.75% increase in the number of correctly identified RFID tags. After a comparison of all the
results was completed it was evident that although the use of Technique #1 (tag subtraction)
made a notable improvement to the accuracy of the DSSS RFID system simulated it did not
adequately improve the accuracy of the system given the system parameters simulated enough to
be considered a viable solution on its own but could be a useful addition to future improvement
techniques. The use of technique #2 (tag staggering) contributed the most increase in system
accuracy, and would, based on the results from the simulations performed, be an acceptable
solution for most systems configured similarly to the one simulated. Although the inclusion the
combination of Technique #1 and #2 was the most accurate system and was shown to have
accuracy benefits especially in simulation using a smaller number of groups. This shows the use
of Technique #1 in conjunction with Technique #2 would be valuable for systems requiring
medium or high accuracy in areas of low SNR. The use of Technique #1 in conjunction with
Technique #2 will also become increasingly important as the number of tags increases. The
simulation set the number of tags at one hundred, but if that number were to be increased the
added interference created would decrease the accuracy for the same number of groups. Adding
additional groups could be possible but there will be a limit on the number of groups a system
could have, depending on the message lengths and maximum amount of delay a system can
tolerate. As more tags are added and the maximum number of groups is reached it may be
necessary to add Technique #1 to Technique #2 to sufficiently increase the accuracy of the
system to an acceptable level. Overall the techniques proposed in this document all improved
the level of accuracy of the DSSS RFID system simulated and would allow for an increased
number of tags to efficiently be handled by the system.
53
CHAPTER 5
Conclusion
RFID data collection systems have a multitude of uses and can implemented through a
wide range of methods. Current RFID standards and implementation methods vary from system
to system with many systems using proprietary specifications precluding them from
interoperability with other systems. A RFID data collection system utilizing DSSS as its
multiple access technique was shown to be successfully implemented via a MATLAB
simulation. Through the use of the simulation it was also shown, as theorized, that the accuracy
of the system was improved using the proposed improvement techniques, tag subtraction and tag
staggering, and due to the increase in the overall accuracy of the system the capacity of the
system will increase as well. Tag subtraction, the first improvement technique suggested and
developed in this thesis, is a method where RFID tags which were correctly identified by the
receiver were subtracted from the received signal before starting the next decoding cycle. Tag
subtraction showed a notable improvement in the accuracy of the system simulated although the
tag subtraction technique did not offer enough system improvement to be a suitable stand alone
solution for the system simulated. Tag staggering, the second technique suggested and
developed in this thesis, divides the number of tags in a certain area into groups which respond in
batches instead of all at once. This method produced a drastic improvement in the accuracy of
the system, more than doubling the average number of RFID tags correctly identified by the
system. Then the system was again modified to utilize a combination of the two improvement
54
techniques. These results were again a drastic improvement over the use of the tag subtraction
technique but compared to the use of the tag staggering technique there was only a slight
improvement, 2.82%, in the average number of correctly identified RFID tags.
Next, in order to quantify how the accuracy and robustness of the systems using the
proposed techniques are affected by the introduction of noise in the transmission channel, the
simulation was modified to include AWGN noise in the transmission channel. As expected, the
standard systems’ performance when AWGN was added showed a significant reduction in
accuracy relative to the noiseless system. Incorporating tag subtraction and tag staggering into
the noisy system provided insight into the robustness characteristics of each improvement
technique with respect to noise in the transmission channel. The relative accuracy and
robustness of each system against the effects of AWGN in transmission channel mirrored the
results of the testing done without the AWGN as the tag subtraction technique was most affected
by AWGN followed by the tag staggering technique with the combination of techniques proving
to be the most robust based on the simulation results. Again the difference in accuracy of the tag
subtraction technique in the simulations with AWGN was less than satisfactory for a data
collection system, the accuracy of the tag staggering method was a drastic improvement over the
tag subtraction method, and the combination of the techniques yielded a slight improvement,
5.12%, over the tag staggering technique alone.
Based on the results from all the simulations performed given the parameters of the
system simulated the most accurate and efficient implementation of a DSSS RFID data
collection system would employ the use of the tag staggering technique. For typical system
applications, adding the tag subtraction technique to the tag staggering technique improved
accuracy but at a significant cost to efficiency. However, the combination of techniques could
55
be useful to other systems requiring a medium to high level of accuracy in a low SNR
environment or a system which was limited in the number of tag groupings available.
Further analysis showed how the systems would react to a change in the SNR in the
transmission channel. Using the tag staggering technique only, the system was simulated using
an 8, 12, and 16 dB SNR. As expected the results showed that as the SNR increased the results
were better, but what was also seen was the poor accuracy of the system when a lower number of
groupings were available for use. In addition the results of the varied SNR simulations showed
that even using a high SNR and a large number of groupings the accuracy of the system would
still max out before 100% accuracy was achieved, and to reach a high accuracy level there was a
certain number of groups needed in the system. The results from this testing also pointed to the
conclusion that under certain circumstances the use of the tag staggering technique would be
sufficient to achieve a satisfactory level of accuracy, but in a system which needed a medium or
high level of accuracy or a system which had a limited number of groups and a low SNR, the
combination of tag staggering and tag subtraction techniques would be needed in order to
achieve a sufficient level of accuracy. Although the tag subtraction technique would not be
desirable for use in a system alone, the use of the tag subtraction technique in combination with
the tag staggering technique would add a measured improvement to a DSSS RFID system as it
adds accuracy to the system using any parameters and is especially effective for a system when a
large number of groups can not be utilized. Overall, this research was successful in showing the
viability of creating a RFID data collection system which utilizes DSSS as it multiple access
technique, and with the addition of proposed improvement techniques the system would be able
to simultaneously read a large number tags and achieve an acceptable level of accuracy.
56
Suggestions for Future Research
This section suggests additional research topics, not included in the scope of this
document, which would further assess the viability of using DSSS as the multiple access
technique for an RFID system as well as further quantifying the benefits of incorporating the
improvement techniques suggested, tag subtraction and tag staggering.
The first potential topic would be the improvement of the overall simulation. Currently
the simulation used creates a static environment in which a scanner polls the area and all the tags
in the area respond simultaneously with no lag between the response times, no bandwidth
interference (other than AWGN), and no relative movement between the scanner and tag. A
more realistic simulation would create random lag in between tags’ responses, and would take
into account environmental phenomena such as fading and multipath distortion of the transmitted
signals as well as not assuming a direct line of sight between the scanner and tags it is polling. A
further improvement to the overall simulation would be the inclusion of a defined frequency
spectrum in which the system would be confined to operate.
A second topic for furthering the research presented would increase the complexity of the
RFID tag itself. The results attained from the simulated system only encompassed an 8-bit RFID
tag. Increasing the size of the information stored by the tag would in turn increase the amount of
data being processed through the system making it more vulnerable to data corruption, therefore
establishing a greater knowledge of robustness of the DSSS and improvement techniques
implemented. Also the system would benefit from the inclusion of error correction coding
(ECC) as apart of the data stored on the tag and interpreted by the scanner. The inclusive of
ECC in the system would not only allow for easier characterization of the accuracy of the system
it would also allow the system to use the tag subtraction improvement technique without

57
requiring the scanner have prior knowledge or expectation of what the tag’s data was supposed
to be before it was transmitted. ECC inclusion on the tags would open the system to supports
tags not included in a known database or registry and would allow greater prevention against the
rare circumstance where a tag is falsely recognized as another known tag.
A third area where further research would lend valuable data would be the creation of an
algorithm or master set of parameters for using the improvement techniques proposed in this
document. If no master set of parameters could be used to maximize the efficiency and accuracy
of any RFID system, then possibly an algorithm could be formulated which would take into
account key system characteristics such as number of tags, environment location, line of sight,
and amount of data stored which would allow a system architect to create a system which is
calibrated to perform at its maximum potential.
A fourth research topic would explore how the use of the techniques affects how quickly
the system maxes out accuracy performance, or reaches an asymptote, as the number of groups
are increased. Results shown in chapter 4 suggest that as the number of tags was increased the
accuracy of the system would be diminished, and would require a larger number of groups to
reach the asymptote. The use of the tag subtraction technique and other improvement techniques
should be studied to examine the effectiveness of the techniques to reach the asymptote more
quickly.
Yet another research topic would be the inclusion of current technological restrictions on
the system. Key points of interest would be processing and power limitations of a passive RFID
tag. Simulation data could be skewed allowing performance not achievable using current
technology. A complete understanding of technological limitations would be necessary to access
the viability of creating a DSSS RFID system. Although it can be shown that the current scope

58
of research performed thus far leaves areas for further research, the groundwork has been laid for
future study and enhancement of a RFID system employing DSSS.
59
REFERENCES
1. Agrawal, Dharma, and Qing-An Zeng. Introduction to Wireless and Mobile Systems. California: Brooks/Cole, 2003. Print
2. Goldsmith, Andrea. Wireless Communications. New York: Cambridge University Press,
2003. Print. 3. The History of RFID Technology. RFID Journal. 18 Feb. 2010.
<http://www.rfidjournal.com/article/view/1338/1>. 4. IEEE 802.15 WPAN RFID Study Group (SGrfid). 23 Jan. 2010.
<http://www.ieee802.org/15/pub/SGrfid.html>. 5. ISO/IEC 18000-3:2008(E): Information Technology – Radio frequency identification for item
management – Part 3: Parameters for air interface communications at 13,56MHz. International Organization for Standardization, Geneva, Switzerland.
6. Mahmoud, Samy, and Harold Stern. Communication Systems: Analysis and Design.
International Edition. New York: Tom Robbins, 2004. Print. 7. Mark, Jon, and Weihua Zhuang. Wireless Communications and Networking. New Jersey:
Tom Robbins, 2003. Print. 8. Mazurek, G. “Active RFID System with Spread-Spectrum Transmission.” IEEE
Transactions on Automation Science and Engineering (2009): 25-32. 9. Rappaport, Theodore. Wireless Communications: Principles and Practice. 2nd Edition.
New Jersey: Prentice Hall, 1996. Print. 10. Rohatgi, Anil, and G.D. Durgin. “Implementation of an Anti-Collision Differential-Offset
Spread Spectrum RFID System.” Proceedings of the IEEE Antennas and Propagation Society International Symposium (2006): 3501-3504.
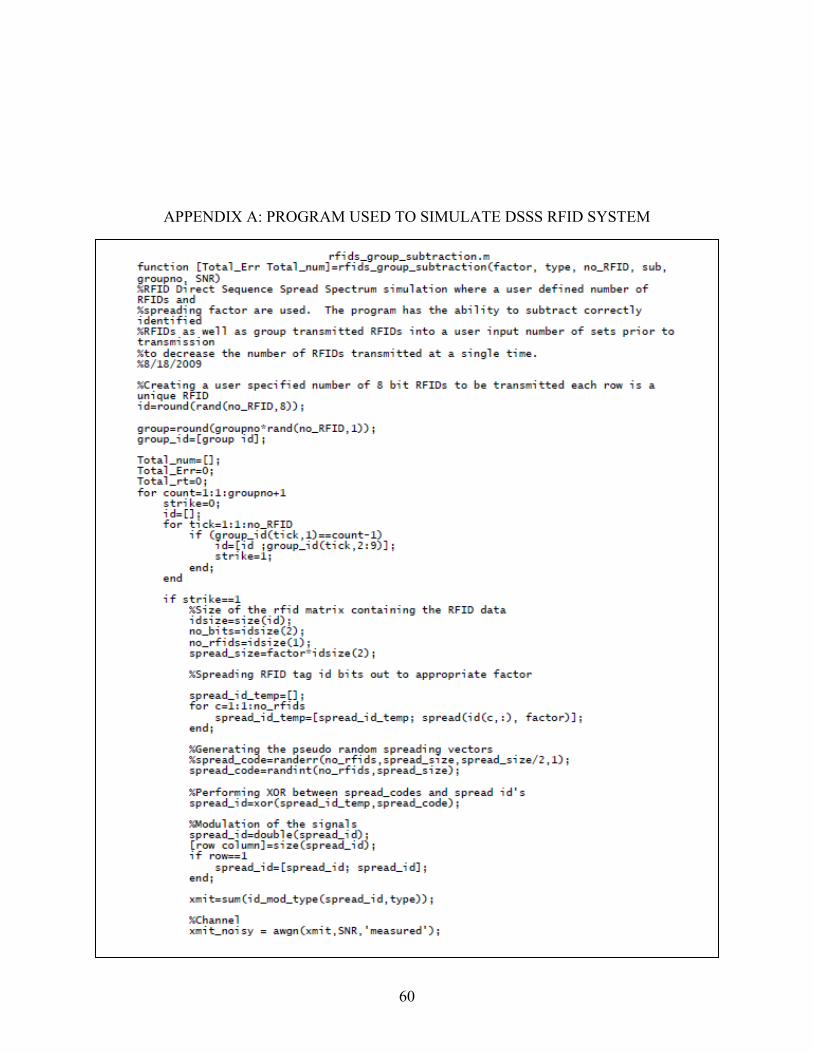
60
APPENDIX A: PROGRAM USED TO SIMULATE DSSS RFID SYSTEM
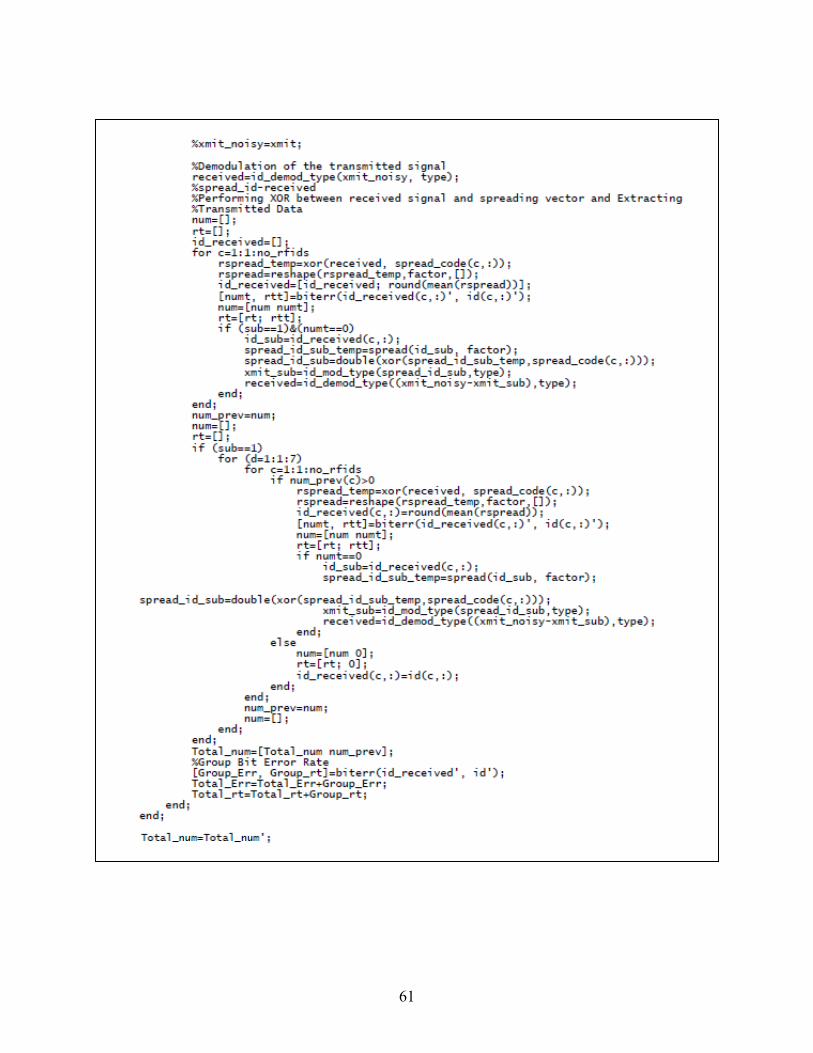
61
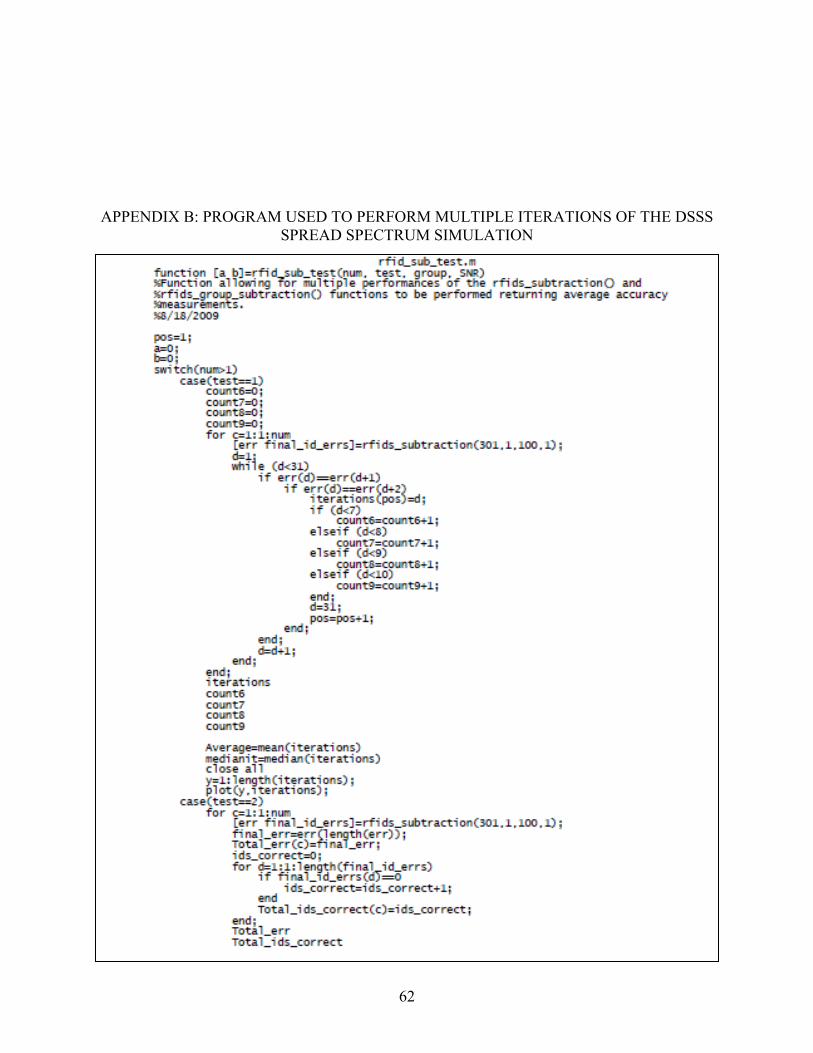
62
APPENDIX B: PROGRAM USED TO PERFORM MULTIPLE ITERATIONS OF THE DSSS SPREAD SPECTRUM SIMULATION
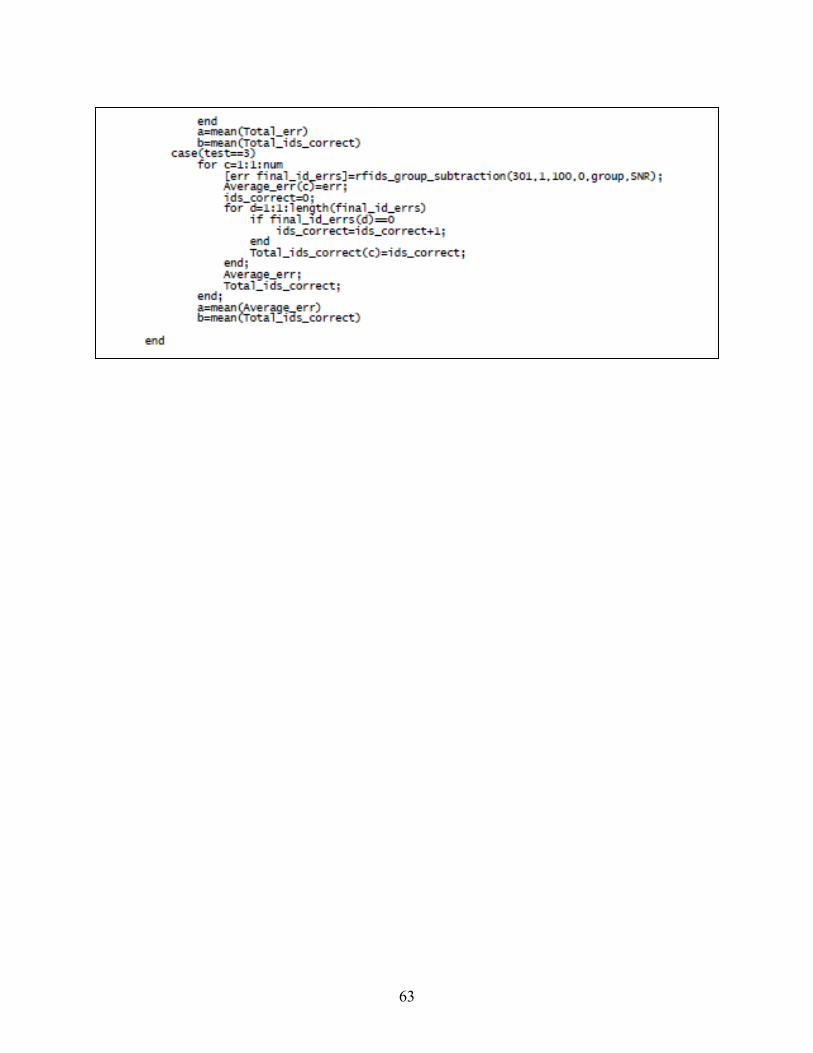
63