Simulation modeling and experimental validation of solar ...
14
J Ther Eng, Vol. 7, No. 6, pp. 1392–1405, September, 2021 ABSTRACT Solar energy is abundantly available on the earth and can be utilized in various applications by converting it in a suitable form. Water supply in remote places and rural areas is still critical due to the unavailability of the grid power. In a developing country like India, the grid construction cost is 6670 $/km because of which some remote areas are still waiting for electricity. There is a large scope to meet this need with the help of a standalone solar water pumping system. In this context, this work presents detailed simulation in MATLAB/Simulink and experimental valida- tion of photovoltaic (PV) permanent magnet brushless DC (PMBLDC) motor water pumping system without energy storing. Simulation is a tool to get system behavior at the various input parameters immedi ately reflects a change in the output parameter. The simulation results are validated with the help of field trials on the experimental setup. A 0.5 hp photovoltaic permanent magnet brushless DC (PMBLDC) motor water pumping system was used for extensive field tri- als experimentation. After extensive field trials, the optimum irradiation observed for full water discharge 19.9 L/min was 330 W/m 2 where voltage and current were 35.1 V and 3.1 A respec- tively. The Water flow – Irradiation characteristic curve and percentage variation in simulation and experimental results showed a good agreement with each other. The efficiency of the photo- voltaic panel and the entire solar water pumping system observed was 12.76 ± 0.64 % and 9.07± 0.45 % respectively. The 0.5 hp PMBLDC motor water pumping system is sufficient to lift 10000 L water every day. PMBLDC motor, shown added advantage of lesser running maintenance due to the absence of carbon brushes which need frequent replacement in case of brushed DC motor. Cite this article as: Deokar V, Bindu RS, Deokar T, Simulation modeling and experimental validation of solar photovoltaic pmbldc motor water pumping system. J Ther Eng 2021;7(6):1392–1405. Journal of ermal Engineering Web page info: https://jten.yildiz.edu.tr DOI: 10.18186/thermal.990701 Research Article Simulation modeling and experimental validation of solar photovoltaic PMBLDC motor water pumping system Vinayak DEOKAR 1,2, * , Rupa S. BINDU 1 , Tejashri DEOKAR 2 1 Dr. D. Y. Patil Institute of Technology, Pune, India 2 Sanjeevan Engineering and Technology Institute, Panhala, India ARTICLE INFO Article history Received: 24 December 2019 Accepted: 04 August 2020 Key words: Renewable energy; Photovoltaic panel; Simulation; Solar PMBLDC motor water pumping system; Error analysis *Corresponding author. *E-mail address: [email protected] This paper was recommended for publication in revised form by Regional Editor Mustafa Kılıç Published by Yıldız Technical University Press, İstanbul, Turkey Copyright 2021, Yıldız Technical University. is is an open access article under the CC BY-NC license (http://creativecommons.org/licenses/by-nc/4.0/). INTRODUCTION A rapid increase in industrialization and population has almost doubled the energy demand of India. India’s total installed capacity is 349.3 GW as on 31 January 2019, in which thermal energy contribution is 63.7 %, Nuclear is 1.93 %, hydro energy 12.85 %, and contribution of renewable energy is 21.14 % [1]. To meet India’s huge power requirement, the sustainable solution is maximizing
Transcript of Simulation modeling and experimental validation of solar ...

J Ther Eng, Vol. 7, No. 6, pp. 1392–1405, September, 2021
ABSTRACT
Solar energy is abundantly available on the earth and can be utilized in various applications by converting it in a suitable form. Water supply in remote places and rural areas is still critical due to the unavailability of the grid power. In a developing country like India, the grid construction cost is 6670 $/km because of which some remote areas are still waiting for electricity. There is a large scope to meet this need with the help of a standalone solar water pumping system. In this context, this work presents detailed simulation in MATLAB/Simulink and experimental valida-tion of photovoltaic (PV) permanent magnet brushless DC (PMBLDC) motor water pumping system without energy storing. Simulation is a tool to get system behavior at the various input parameters immedi ately reflects a change in the output parameter. The simulation results are validated with the help of field trials on the experimental setup. A 0.5 hp photovoltaic permanent magnet brushless DC (PMBLDC) motor water pumping system was used for extensive field tri-als experimentation. After extensive field trials, the optimum irradiation observed for full water discharge 19.9 L/min was 330 W/m2 where voltage and current were 35.1 V and 3.1 A respec-tively. The Water flow – Irradiation characteristic curve and percentage variation in simulation and experimental results showed a good agreement with each other. The efficiency of the photo-voltaic panel and the entire solar water pumping system observed was 12.76 ± 0.64 % and 9.07± 0.45 % respectively. The 0.5 hp PMBLDC motor water pumping system is sufficient to lift 10000 L water every day. PMBLDC motor, shown added advantage of lesser running maintenance due to the absence of carbon brushes which need frequent replacement in case of brushed DC motor.
Cite this article as: Deokar V, Bindu RS, Deokar T, Simulation modeling and experimental validation of solar photovoltaic pmbldc motor water pumping system. J Ther Eng 2021;7(6):1392–1405.
Journal of Thermal EngineeringWeb page info: https://jten.yildiz.edu.tr
DOI: 10.18186/thermal.990701
Research Article
Simulation modeling and experimental validation of solar photovoltaic PMBLDC motor water pumping system
Vinayak DEOKAR1,2,* , Rupa S. BINDU1 , Tejashri DEOKAR2
1Dr. D. Y. Patil Institute of Technology, Pune, India2Sanjeevan Engineering and Technology Institute, Panhala, India
ARTICLE INFO
Article historyReceived: 24 December 2019Accepted: 04 August 2020
Key words:Renewable energy; Photovoltaic panel; Simulation; Solar PMBLDC motor water pumping system; Error analysis
*Corresponding author.*E-mail address: [email protected]
This paper was recommended for publication in revised form by Regional Editor Mustafa Kılıç
Published by Yıldız Technical University Press, İstanbul, TurkeyCopyright 2021, Yıldız Technical University. This is an open access article under the CC BY-NC license (http://creativecommons.org/licenses/by-nc/4.0/).
INTRODUCTION
A rapid increase in industrialization and population has almost doubled the energy demand of India. India’s total installed capacity is 349.3 GW as on 31 January
2019, in which thermal energy contribution is 63.7 %, Nuclear is 1.93 %, hydro energy 12.85 %, and contribution of renewable energy is 21.14 % [1]. To meet India’s huge power requirement, the sustainable solution is maximizing

J Ther Eng, Vol. 7, No. 6, pp. 1392–1405, September, 2021 1393
renewable energy potential. Solar power has emerged as a prominent source of green energy in all renewable energy sources, which will contribute to the growth of countries like India.
For 1 kW electricity generation using non-renewable energy sources 1 kg of CO2 is emitted in the environment which is very harmful to living organs. There are huge energy crises in India and only 10 h of energy is available for the agricultural sector in alternate day and night time which is insufficient. Mostly diesel engine water pumps are used in the absence of grid energy which is harmful to the environment. Therefore, there is a large scope to tap solar energy for the fulfillment of energy needs. India is aiming for a high rise in tapping renewable energy potential to reach 175 GW by 2022 excluding large hydropower plants. The average intensity of irradiation available in India is 4–7 kWh/m2 for 250–300 days [2, 3]. The solar water pumping system is a prominent way to meet water demands by using clean energy. The huge running cost is associated with the system running on-grid energy or on diesel engines which can be minimized by using the solar energy water pumping system.
A well optimum sized Photovoltaic systems additional advantage is in the form of the reduced payback period. Simulation helps in the optimum designing of the system as per the water requirement. The solar photovoltaic system is one way to convert solar energy into electric energy which is subsequently used in the number of applications [4, 5].
For Simulation two internal characteristics series and parallel resistance (Rs and Rp) are the most import-ant parameters, and the Simulink model of the photovol-taic panel with these two parameters gives the best results [6–17]. As the PV panel output and characteristics are non-linear these should be modeled with the maximum power point tracker (MPPT) which figure out the best suitable output as per load requirement [18–19]. The solar photovoltaic water pumping system is one of the popularity gaining application now a day’s as its running maintenance cost is very negligible as compared to diesel engines. The payback period of the solar photovoltaic water pumping system is generally 12 years and the expected life of the system is 25 years. The simulation of the solar PV water pumping system consists of the number of subsystems like PV panel, MPPT, motor, and pump [20–27]. Brushed DC motor or AC induction motors are mostly used in solar water pumping but brushes of brushed DC motor needs to be replaced frequently, and for induction motor inverter is needed as it runs on AC supply whereas PV panels output is DC only [28–37].
In this context, this work presents the use of a solar photovoltaic submersible permanent magnet brushless DC motor (PMBLDC) water pumping system. The objective of this study is optimum designing and installation of the solar photovoltaic water pumping system which will oper-ate efficiently and fulfill water requirements in the remote areas by using a clean solar energy source. Optimum system
design will result in reduced overall system cost so that the payback period will also minimum. Also, the minimum running maintenance cost for the system is expected.
By keeping objectives in mind 0.5 hp PMBLDC solar water pumping system is proposed which runs on clean renewable solar energy only. This will help to reduce CO2 emissions in the environment. Especially to overcome the maintenance of frequent brush changing in brushed DC motor and eliminating inverter to convert DC to AC as it runs directly on DC. The use of energy storing devices avoided minimizing initial as well as the maintenance cost of the system. Step by step detailed modeling of the sub-systems like photovoltaic panel, MPPT, PMBLDC motor, and the pump was carried out in MATLAB/Simulink. All the subsystems connected and the entire Simulink model of solar photovoltaic water pumping system presented. Furthermore Experimental setup of components used in the simulation was built. The optimum value of irradiation for an efficient system of working found out. Simulation results of the proposed system validated with the help of experimental results obtained by extensive experimental field trials and presented with error analysis.
MODELING OF PHOTOVOLTAIC PMBLDC MOTOR WATER PUMPING SYSTEM
The photovoltaic water pumping system consists of the number of components like the PV panel for energy con-version, Buck-Boost converter, PMBLDC motor, and the pump. Modeling and simulation of individual subsystems are carried out separately and then these are combined to get a complete system.
Mathematical Model of Photovoltaic PanelFigure 1 shows a practical model with series and parallel
resistance used for PV panel modeling. In this model, the effect of Rs and Rp is considered as the efficiency of the PV solar cell gets affected due to these parameters [6, 7].
By applying Kirchhoff ’s law,
I = Iph - Id - Ip (1)
The total output current of a PV panel I calculated using the above equation [6].
Figure 1. Model of an equivalent circuit with Rs and Rp.

J Ther Eng, Vol. 7, No. 6, pp.1392–1405, September, 20211394
PV panel photocurrent Iph is calculated using the equation
( ) * /1000Iph Isc Ki Top Tref G = + − (2)
Where G is irradiation (W/m2), Ns is the number of cells in series, Tref is a reference temperature taken (25 oC) [6].
Diode current Id is calculated with using the equation
1V IrsId Is expNsAVt
+ = −
(3)
*t
k TopVq
= (4)
3* 1 1expTop q EgIs Irs
Tref Ak Tref Top
= −
(5)
Where Vt is the thermal voltage depending on the oper-ating temperature Top and Is panel saturation current. V is the output voltage of the panel [7].
Irs is calculated using the equation
exp 1
IscIrsqVoc
NskATop
=
−
(6)
Leakage current Ip is calculated using the equation
V IRsIpRp+
= (7)
The output current I of the PV panel calculated using the equation
* 1V Irs V IRsI Iph Is expNsAVt Rp
+ = − − −
(8)
Simulink Modelling of the PV PanelEldora VSP.72.AAA panel data is used as a reference
data panel for the simulation. Table 1 shows the details of the specifications. The step by step Simulink modeling of
the PV panel is carried out by using mathematical equa-tions 1 to 8.
Photocurrent Iph calculated at the beginning based on irradiation (G) and operating temperature (Top) as shown in Figure 2. The input parameters and their respective con-stant values used for simulation are shown in Figure 3.
The Vt and Irs calculated based on Top and Voc as shown in Figure 4 & 5. Panel saturation current (Is) calculated by taking the output of the Irs as shown in Figure 6.
Table 1. Specifications of Eldora VSP.72.AAA PV panel
Parameters Variable Values
Peak power (W) Pm 320 Maximum voltage (V) Vm 37.5Maximum current (A) Im 8.5Open circuit voltage (V) Voc 45.96Short circuit current (A) Isc 9.03Temperature coefficient Ki 0.52 % /oC
Figure 2. Simulink model of photocurrent.
Figure 3. Input parameters with constant values.
Figure 4. Thermal voltage Vt.
Figure 5. Simulink model of reverse saturation current.

J Ther Eng, Vol. 7, No. 6, pp. 1392–1405, September, 2021 1395
Figure 9 shows the Simulink model of the Buck-Boost converter. Repeating signals produced by the PWM signals compared with the duty cycle generated by the MPPT. The period for which insulated-gate bipolar transistor (IGBT)
The Simulink model for calculating the diode current (Id) and leakage current (Ip) shown in Figure 7. All the subsystems connected to getting photovoltaic panel output current I as shown in Figure 8 [6–17].
Simulink Modelling of the Buck-Boost ConverterThe output of the PV panel is fluctuating, but the load
requires constant voltage and current as input. Therefore it is necessary to regulate the output of the PV panel with the regulating device. Buck-Boost converter is a device used for extracting the maximum amount of power. It always compares the output available at the PV panel with the load requirements and figure outs best voltage for load [18–21].
The output voltage Vo is given by,
1
DVo VsD
= − (9)
Where Vs = Vm (Voltage at maximum power)
Figure 6. Simulink model of panel saturation current.
Figure 9. Simulink model of the buck-boost converter.
Figure 7. Simulink model of diode current and leakage current.
Figure 8. Simulink Model of PV panel.

J Ther Eng, Vol. 7, No. 6, pp.1392–1405, September, 20211396
Simulink Model of the Complete Solar Water Pumping System
The complete Simulink model of the solar water pump-ing system is developed as illustrated in Figure 12. In this model, all the individual subsystems PV panel, Buck-Boost
is ON, the capacitor charges and output is the same as the input. The output increases than input when duty cycle D > 0.5 and it reduces when D < 0.5.
The Perturb & observe algorithm (P & O) is used here to optimize the performance. The source and load impedance matching are achieved by changing the converter’s duty cycle.
Simulink Modelling PMBLDC Motor and PumpIn the case of a positive displacement pump, the flow
rate is directly proportional to motor speed, which depends on the available voltage at the motor input. Figure 10 shows the Simulink model of the PMBLDC motor [23–25]. A pump coupled to the motor is a positive displacement type with constant load torque it is connected directly to the PMBLDC motor. Figure 11 shows the Simulink model of the pump [26–28]. The pump receives input mechanical power from the motor and gives the output as water flow ‘Q’ in L/min.
The water flow ‘Q’ of the pump is calculated using the equation [29–31].
6P* * 3600*101000Q
*H*g*60
η
ρ
= (10)
Where,Q = Pump discharge in L/minP = Power available at motor shaft in Wρ = Density of water = 1000 kg / m3
H = Lifting head in meterg = Gravitational acceleration = 9.8 m/ s2
η = Pump efficiency = 75 %
Figure 10. Simulink Model of the PMBLDC motor.
Figure 11. Simulink model of the pump.
Figure 12. Complete Simulink model of the solar water pumping system.

J Ther Eng, Vol. 7, No. 6, pp. 1392–1405, September, 2021 1397
converter, PMBLDC motor, and pump are assembled. The system has two inputs irradiation (G) and operating tem-perature (Top). The model process this given input and gives the output in terms of water flow (Q). By varying the two inputs we can get the respective output of the system.
Interpretation of Simulation ResultsThe output results in terms of current, voltage, power, and
water flow of the simulated models are obtained by varying the two input parameters irradiation and operating temperature.
Figure 13 shows the I-V characteristic curve at a dif-ferent irradiation level by keeping the operating tempera-ture constant at 25 oC. At irradiation 200 W/m2 model given 41 V 1.7 A output. As irradiation increased current increased drastically but voltage increment was marginal only. At 600 W/m2, the model output was 44 V, 5.4 A, while at maximum irradiation 1000 W/m2 the output was 45.5 V, 9A. The output of the PV panel can be predicted easily at any known value of the irradiation from the curve.
Figure 14 shows the P-V characteristic curve at a differ-ent irradiation level by keeping the operating temperature constant at 25 oC. As power produced is directly proportional
to falling irradiation, P-V characteristic curves show simi-lar trends. PV panel power output was 60 W at 200 W/m2 and 80 W at 300 W/m2 which was increased as the irradia-tion was increased. PV panel developed exactly half power 160 W at irradiation 500 W/m2. Maximum power output 320 W was observed at 1000 W/m2.
Figure 15 shows the I-V characteristic curve at the different operating temperatures by keeping irradiation constant at 1000 W/m2. The graph shows clearly that tem-perature affects adversely on the output voltage resulting in a drop in it at the same irradiation value. The PV panel is expected to work in STC condition but it is difficult to maintain the operating temperature at 25 oC. Temperature increment resulted in the drastic decrement of output volt-age with very little marginal increment in the current and it is observed in the I-V curve. At 25 oC panel output voltage was maximum 45.5 V which reduced to 43 V & 41 V at 45 oC and 65 oC respectively. From the graph, it is cleared that the increment in operating temperature resulted in output voltage decrement.
Figure 16 shows the effect of temperature variation on the output power of the PV panel. The voltage decrement
Figure 13. I-V characteristics by varying irradiation. Figure 15. I-V characteristics by varying temperature.
Figure 14. P-V characteristics by varying irradiation. Figure 16. P-V characteristics by varying temperature.

J Ther Eng, Vol. 7, No. 6, pp.1392–1405, September, 20211398
due to temperature increment resulted in the power dec-rement because it is a product of voltage and current. The model output was 320 W, 300 W, and 290W respectively at 25 oC, 35 oC, and 45 oC, and reduced to 270 W at 65 oC oper-ating temperature. There was 50 W power loss observed at the same irradiation level 1000 W/m2 because of tempera-ture increment by 40 oC than STC (from 25 oC to 65 oC).
Figure 17 shows the output water flow ‘Q’ of the simu-lated model for various irradiations input. Initially, at irra-diation up to 150 W/m², no water discharge was there as the power available was very low to start the pump hence pump was at rest. At irradiation 165 W/m² the output of the model was 4.2 L/min. The output water discharge increased proportionally to irradiation up to 330 W/m². Finally, full water flow 19.9 L/min was observed at irradiation 330 W/m² as the power developed by the panel was 110 W/m2. Further increment in irradiation, water flow was not changed and remained constant at 19.9 L/min.
EXPERIMENTAL SETUP AND TESTING
The Solar Photovoltaic Water pumping experimen-tal setup consists of three major components solar panel, Buck-Boost Converter, and PMBLDC motor pump which is described as follows [32–34].
Solar PanelFor driving 0.5 hp PMBLDC motor pump Eldora
VSP.72.AAA PV panel is used, Fig 18 (A) shows this panel.The maximum power output of the panel at the standard testing condition (STC) is 320 W. Parametric specifications of the PV panel are as per Table 1. The panel is selected by considering the Buck-Boost converter and PMBLDC motors input requirements. For the efficient work of the Buck-Boost converter, the input voltage should be in the range from 24 V to 48 V and the selected PV panel meets this requirement. The panel is capable to give the required input to the converter for continuous pump operation as the irradiation reaches 330 W/m2.
Buck-Boost ConverterBuck-Boost converter is used to maximize power
extraction from the PV panel. Buck-Boost converter is shown in Figure 18 (B). The dry run sensor is fitted at the top of the pump in which a circuit breaker is used. Whenever there is sufficient water in the source then the sensor gives the signal for the starting of the motor, on the other side whenever the water level falls below the sensor then it gives a signal for stopping the motor. After 10 minutes converter gives the signal to start the motor and it again checks the dry run sensor signal. If there will be sufficient water in the source then and then only the motor starts. The converter starts the motor only when there is sufficient input voltage present at the PV panel output and stops the motor when it’s less than the input requirement of the motor. Figure 17. Water flow – Irradiation characteristic by simulation.
Figure 18. A) Solar PV 320 W panel B) Buck-Boost Converter C) PMBLDC motor submersible pump.

J Ther Eng, Vol. 7, No. 6, pp. 1392–1405, September, 2021 1399
PMBLDC Motor Pump For small applications like livestock drinking water,
garden fountains PMBLDC motors are used. For the same size, the reliability and efficiency of the DC system are higher than the AC system. Figure 18 (C) shows the 0.5 hp PMBLDC submersible pump used for field trials. Table 2 shows the specifications of the PMBLDC motor submers-ible Pump. The pump normally takes 27 V and 2.7 A input. The current consumption of the motor increases as the head goes on increasing and it tries to keep the discharge maximum.
Data Logger and SensorsThe data logger system is used for measuring and
recording the irradiation, water flow, voltage, and current observations. For water flow measurement rotor type elec-tronic water flow sensor is used. The observations of the experimental setup are continuously monitored, processed, and stored in the memory of the data logger.
Experimental SetupLocation of the experimental setupPlace – A/P-Vadanage, Taluka – Karvir, District –
Kolhapur, Maharashtra, India, 416229Latitude angle of location – 16.7o N A 320 W solar PV panel was fitted on a steel structure
at a latitude angle 16.7o with due south. The output of the panel was given to the MPPT to which a 0.5 hp PMBLDC motor submersible pump was connected. It is used to lift water from the source. The total lift of the water was 12 m. Figure 19 shows the schematic diagram of the experimental setup.
Testing of the Solar PV Water Pumping SystemThe solar drying experimental study was conducted
on-site during 15th November 2019 to 20th December 2019. The Number of experimental trials was conducted. Results obtained on perfectly sunny days 26th & 27th November 2019 are presented here. The observations irradiations, time, volt-age, current, and water flow are recorded with the help of all sensors attached to the system. Based on voltage and the current available output power was calculated. As the solar irradiation fell on the PV panel it started generating the elec-tricity. Initially, up to 160 W/m2 irradiation, as the power output was insufficient to start the pump it was at rest. The
pump started lifting water as the irradiation reached 175 W/m2 with low water discharge. From irradiation 175 W/m2 to 330 W/m2 the discharge increased linearly with irradiation.
The pump started discharging full water 19.9 L/min from irradiation 330 W/m2 and continued the same till irradiation 330 W/m2 was available. Whenever the irradia-tion was fallen below the 330 W/m2, the pump was running but the discharge decreased proportion to irradiation. The discharge of the pump was observed directly proportional to the fallen solar irradiation during testing. Table 3 shows the experimental test summary.
Interpretation of Experimental Setup ResultsObservation taken on the trial days plotted in the form
of the graphs. Figure 20 shows the irradiation – time char-acteristics of 26th November 2019 which is in the form of bell-shape. The observation was taken from 7.16 am to 5.18 pm. The minimum irradiation observed was 35 W/ m² at 7.16 am and the maximum irradiation was 873 W/m² at 12.30 pm on local solar noon. The irradiation increased from morning to 12:30 pm and then reduced gradually, some drops are observed in the irradiation graph when cloud cover was there. The average irradiation observed on the day was 520 W/ m². The 330 W/ m² and above level irra-diation was observed from 8.45 am to 4.05 pm for 7 hours 15 minutes, which was the required irradiation to produce power 110 W to run the pump efficiently with full capacity.
Table 2. Specification’s of PMBLDC motor submersible Pump
Particularities DescriptionManufacturer Greenmax Model GMTSC-0.5/1.3/75Voltage 24VMax. Flow rate 1.3 m³/hMax. Head 70 m
Figure 19. Schematic diagram of the experimental setup.
Table 3. Test Summary
Parameters 26/11/19 27/11/19Pump Start time 7.57 am 8.03 amPump Stop time 4.32 pm 4.15 pmTotal hours of water lifting (hr) 8 hr 35 min 8 hr 12minAverage water Lifting L/min) 18.7 18.7Total Water lifted in a day (L) 9667 9362
J Ther Eng, Vol. 7, No. 6, pp.1392–1405, September, 20211400
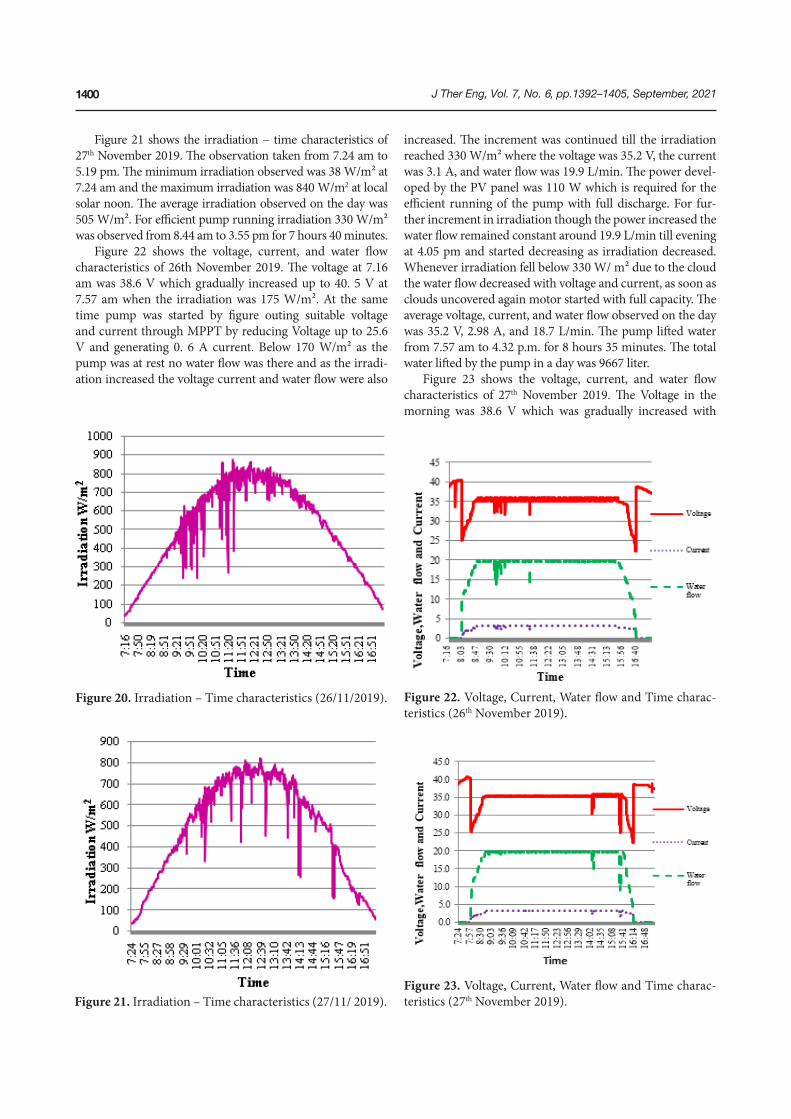
increased. The increment was continued till the irradiation reached 330 W/m² where the voltage was 35.2 V, the current was 3.1 A, and water flow was 19.9 L/min. The power devel-oped by the PV panel was 110 W which is required for the efficient running of the pump with full discharge. For fur-ther increment in irradiation though the power increased the water flow remained constant around 19.9 L/min till evening at 4.05 pm and started decreasing as irradiation decreased. Whenever irradiation fell below 330 W/ m² due to the cloud the water flow decreased with voltage and current, as soon as clouds uncovered again motor started with full capacity. The average voltage, current, and water flow observed on the day was 35.2 V, 2.98 A, and 18.7 L/min. The pump lifted water from 7.57 am to 4.32 p.m. for 8 hours 35 minutes. The total water lifted by the pump in a day was 9667 liter.
Figure 23 shows the voltage, current, and water flow characteristics of 27th November 2019. The Voltage in the morning was 38.6 V which was gradually increased with
Figure 21 shows the irradiation – time characteristics of 27th November 2019. The observation taken from 7.24 am to 5.19 pm. The minimum irradiation observed was 38 W/m² at 7.24 am and the maximum irradiation was 840 W/m2 at local solar noon. The average irradiation observed on the day was 505 W/m². For efficient pump running irradiation 330 W/m² was observed from 8.44 am to 3.55 pm for 7 hours 40 minutes.
Figure 22 shows the voltage, current, and water flow characteristics of 26th November 2019. The voltage at 7.16 am was 38.6 V which gradually increased up to 40. 5 V at 7.57 am when the irradiation was 175 W/m². At the same time pump was started by figure outing suitable voltage and current through MPPT by reducing Voltage up to 25.6 V and generating 0. 6 A current. Below 170 W/m² as the pump was at rest no water flow was there and as the irradi-ation increased the voltage current and water flow were also
Figure 21. Irradiation – Time characteristics (27/11/ 2019).
Figure 20. Irradiation – Time characteristics (26/11/2019). Figure 22. Voltage, Current, Water flow and Time charac-teristics (26th November 2019).
Figure 23. Voltage, Current, Water flow and Time charac-teristics (27th November 2019).

J Ther Eng, Vol. 7, No. 6, pp. 1392–1405, September, 2021 1401
330 W/m2. Constant water flow was observed around 19.9 L/min at irradiation above 330 W/m2 up to 888 W/m2. The irradiation level above the 330 W/m2 does not change water discharge from 19.9 L/min but it was constant and the char-acteristic curve shows this with a horizontal parallel line to the x-axis after the linear increment.
Error AnalysisFor evaluating the accuracy of experimental testing
results random errors resulted due to the entire experi-mental procedure and systematic errors due to measuring
increment in irradiation. The pump started at 8.03 am when irradiation was 172 W/m². The increment in voltage, current, and water flow continued till the irradiation reached 330 W/m². Till 3.55 pm except for a few occasions of cloud cover constant water flow around 19.9 L/min was observed. The average voltage, current, and water flow observed on the day was 35.1 V, 3 A, and 18.7 L/min respectively. The pump lifted water from 8.03 am to 4.15 pm for 8 hours 12 min. The total water lifted by the pump in a day was 9362 liter.
INTERPRETATION OF SIMULATION AND EXPERIMENTAL RESULTS
Table 4 shows the observations of water flow ‘Q’ of sim-ulation and the experimental setup for the respective irra-diation level. It is observed that the experimental water flow values were lesser than the simulated water flow values for a particular irradiation level. The variation in observation at particular irradiation was varied from 0–4.9 %. Initially, at lower irradiation value the variation percentage was large which reduced as the irradiation was increased. The aver-age variation observed during the testing was 1.2 %. The variation observed in results was lower when irradiation available was above 330 W/m2. The observations of Table 4 are plotted with the help of Figure 24 which shows the water flow – Irradiation characteristic curve of simulation and experimental observation. The characteristic curve shows water flow increased linearly with irradiation in the sim-ulation and experimental observation from 175 W/m2 to
Figure 24. Water flow – Irradiation characteristic curve of Simulation and experimental observations.
Table 4. Comparison of water flow ‘Q’
Irradiation (G)
Water flow ‘Q’ Absolute Error‘ε’ (L)
% Relative ErrorSimulation Experimental
0 0 0 0 050 0 0 0 0
175 8.3 7.9 0.4 4.8205 11.5 11.3 0.2 1.7220 13.7 13.4 0.3 2.2250 17 16.8 0.2 1.2260 17.1 16.9 0.2 1.2273 18.1 17.9 0.2 1.1285 18.9 18.6 0.3 1.6323 19.8 19.7 0.1 0.5400 19.9 19.7 0.2 1.0500 19.9 19.8 0.1 0.5600 19.9 19.8 0.1 0.5700 19.9 19.7 0.2 1.0800 19.9 19.8 0.1 0.5850 19.9 19.8 0.1 0.5888 19.9 19.8 0.1 0.5

J Ther Eng, Vol. 7, No. 6, pp.1392–1405, September, 20211402
Where the ‘δEloss’ is the combined loss due to connecting cables, MPPT controller loss, motor, and water pump loss. Finally the total efficiency of the entire system ‘ηtot’ is given by,
l
wtot
so
EE
η = (18)
By using equation 13 and Figure 20 irradiation data along with pyranometer total permissible error the solar energy on the 2 m2 320 W photovoltaic panel surface is,
Esol = 10160 ± 305 Wh.
Photovoltaic panel energy output by considering cur-rent and voltage measurement with instruments permissi-ble error using Equation (14) is,
EPV = 1296.41 ± 25.92 Wh.
The efficiency of the photovoltaic panel using Equation (15) is estimated as:
ηPV = 12.76 ± 0.64 %
The total water lifted on a test day was 9667 liters. Uplifted waters dynamic energy using equation (16) at 35 m elevation and considering instrumental permissible error is calculated as:
Ew = 922 ± 18.5 Wh.
Sum of other losses estimated using equation (17) is
δEloss = 374.41 ± 44.4 Wh.
The efficiency of the entire system using equation (18) is estimated as:
ηtot = 9.07 ± 0.45 %
The average relative error in experimental and simu-lation results observed during the testing was 1.1 %. For normal running condition power required for the motor is 110 W and at irradiation 175 W/m2 PV panel was unable to develop it. The PMBLDC motor requires higher starting torque. Though the power was insufficient MPPT figured out suitable voltage and current to start the pump, lots of power portion was consumed to rotate the rotor and lift the water. Hence we observed maximum (4.8 %) relative error from initial starting condition to normal running condi-tion. Error analysis of every component of the system is carried out considering accuracies of the measuring instru-ments used. But after achieving the required power 110 W at the 330 W/m2, very little error was observed in simula-tion and experimental results. The total energy available on
instruments are considered. Absolute error and % relative error in the experimental and simulation water flow result is calculated by using Eqn. 11 & 12 and mentioned in Table 4. Relative random error is estimated based on extensive mea-surements taken while testing. Table 5 shows the accuracy and relative random error of the measuring instruments.
The following correlations are used for error analysis of the entire system by considering efficiencies of the various subsystems [35–37].
Absolute error and % relative error in the experimental and simulation water flow ‘Q’ is given by,
Absolute error ε = TV - MV (11)
% Relative error 100TV MVTV−
= × (12)
The Solar energy available on the surface of the photo-voltaic panel given as,
0
0
. t t
sol c Tt
E A G dt+∆
= ∫ (13)
Photovoltaic panels energy output is estimated using the following relation,
( )0
0
, ( , ). t t
PV PV T C PV T Ct
E I G V G dtθ θ+∆
= ∫ (14)
Using Equation (11) and (12) the efficiency of the pho-tovoltaic panel calculated by using the following relation,
PVPV
sol
EE
η = (15)
Uplifted waters dynamic energy is given by
EW = ρ × g × h × Vtot (16)
Final energy balance equation is
EPV = EW + δEloss (17)
Table 5. Accuracy and relative random error of measuring instruments
Measuring Instrument
Accuracy (%) Estimated relative random error (%)
Pyranometer ±3 0.2Voltage and current measurement
±2 0.25
Flow sensor ±2 0.5

J Ther Eng, Vol. 7, No. 6, pp. 1392–1405, September, 2021 1403
specifications by knowing the amount of water requirement and total water-lifting head. Furthermore, error analysis provides the factors responsible for variation in numerical and experimental results.
NOMENCLATURE
PV PhotovoltaicG Irradiation W/m2
Rs Series resistanceRp Parallel resistanceMPPT Maximum power point trackerk Boltzmann’s constant 1.380*10–23 J/KA Diode ideality factorTop Cell operating temperatureSTC Standard Testing Condition (G = 1000 W/m2,
Top = 25 oC)I PV panel output currentIph PhotocurrentId Diode currentIp Leakage currentIsc Short circuit currentKi Coefficient for temperature (0.0022 A/ oC)Top Cell operating temperatureIrs Reverse saturation currentIs Saturation currentEg Forbidden energy band gap (1.2 eV)q Electron charge (1.602*10–19 C).Q Water flow L/minTV True valueMV Measured valueEsol Solar energy available on the surface of the
photovoltaic panel (Wh). EPV Output of photovoltaic panel (Wh).EW Dynamic energy of the water (Wh).PMBLDC Permanent Magnet Brushless Direct Current
AUTHORSHIP CONTRIBUTIONS
Completed Design of the system, experimental testing, Manuscript writing: V.H.D.; Procedural design of experi-mentation, Critical review: R.S.B.; Data collection and anal-ysis, Report writing and formatting: T.V.D.
DATA AVAILABILITY STATEMENT
No new data were created in this study. The published publication includes all graphics collected or developed during the study.
CONFLICT OF INTEREST
The author declared no potential conflicts of interest with respect to the research, authorship, and/or publication of this article.
the panel surface was 10160 ± 305 Wh from which 1296.41 ± 25.92 Wh was converted into electricity by the photovol-taic panel. The losses ‘δEloss’ due to system cabling, MPPT controller, motor losses, and pump losses observed were 374.41 ± 44.4 Wh. The efficiency of the photovoltaic panel observed was 12.76 ± 0.64 % while for entire solar water pumping system was 9.07± 0.45 %.
CONCLUSION
This work presents Simulation modeling and its result validation by the extensive field trials on the 0.5 hp exper-imental setup. The increment in operating temperature above 25 oC showed an effect on the output power of the PV panel. 50 W power losses observed at the same irradiation level of 1000 W/m2 because of temperature increment by 40 oC than STC. The optimum requirement of the irradi-ation for efficient of working found was 330 W/m2, where voltage and current were 35.1 V and 3.1 A respectively and power produced by the panel was 110 W. During experi-mentation water flow varied from 8.3–19.9 L/min when irradiation level was 175–330 W/m2 and remained constant around 19.8 L/min after further increment in irradiation. The average relative error in experimental and simulation results observed during the testing was 1.1 %. The total energy available on the panel surface was 10160 ± 305 Wh from which 1296.41 ± 25.92 Wh was converted into elec-tricity by the photovoltaic panel. The losses ‘δEloss’ due to system cabling, MPPT controller, motor losses, and pump losses observed were 374.41 ± 44.4 Wh. The efficiency of the photovoltaic panel and the entire solar water pumping sys-tem observed was 12.76 ± 0.64 % and 9.07 ± 0.45 % respec-tively. The water flow-Irradiation characteristics curve and percentage variation show a good agreement between simulation and experimental observations.
Solar photovoltaic water pumping system shows its usability in remote and rural areas for fulfilling drink-ing or agricultural water needs. As it runs on clean solar energy the CO2 emission is eliminated and large cost of grid construction in remote areas saved. The system helps farmers in water lifting in the day time as per the require-ment to overcome the energy shortage problem. The use of PMBLDC motor shows a great advantage in terms of reduced maintenance cost of frequent carbon brush chang-ing and systems running cost. Simulation modeling helped in the optimistic design of the system which resulted in minimizing the payback period to 10 years. One can enjoy the system for a further 15 years at negligible maintenance cost. The system lifts 10000 L/day water to fulfill 100 peo-ple daily water requirements with overall 9.07 % efficiency.
The system simulation will help to visualize the per-formance behavior of the system in real climate condi-tions before mounting the system and finding its optimum working conditions. The obtained results will help in selecting the pump capacity and all system components

J Ther Eng, Vol. 7, No. 6, pp.1392–1405, September, 20211404
[12] Krismadinata NA, Wooi Ping RH, Selveraj J.Photovoltaic module modeling using simulink/mat-lab. Procedia Environmental Sciences 2013;17:537–46. [CrossRef]
[13] Pandiarajan N, Ranganath M. Mathematical mod-eling of photovoltaic module with Simulink. IEEE1st International Conference on Electrical EnergySystems 2011;258–63. [CrossRef]
[14] Badie Asghar S, Singh RK. Simulink based analy-sis and realization of solar PV system. Energy andPower Engineering 2015;7:546–55. [CrossRef]
[15] Tian H, David F, Ellis K. A cell-to-module-to-arraydetailed model for photovoltaic panels. Solar Energy 2012;86:2695–706. [CrossRef]
[16] Yadav N, Sambariya DK. Mathematical model-ling and simulation of photovoltaic module usingMATLAB/SIMULINK. 9th International Conferenceon Computing Communication and NetworkingTechnologies (ICCCNT) 2018. [CrossRef]
[17] Erdem Z, Erdem MB. A proposed model of photo-voltaic module in matlab/simulink for distance edu-cation. Procedia – Social and Behavioural Sciences2013;103:55–62. [CrossRef]
[18] Hmidet A, Hasnaoui O, Dhifaoui R. Digital controlof MPPT structures for water pumping systems. 7th
IET International Conference on Power Electronics,Machines and Drive. 2014 [CrossRef]
[19] Zakzouk N, Elsaharty M, Abdelsalam A. Improvedperformance low-cost incremental conductance PVMPPT technique. IET Renewable Power Generation 2016;561–74. [CrossRef].
[20] Samantara S, Roy B, Rout A, Sharma R. Modelingand simulation of CUK converter with beta MPPTfor a standalone PV system. Michael Faraday IETInternational Summit 12–13 Sept 2015. [CrossRef].
[21] Mwinga M, Groenewald B, McPherson M.Design modelling and simulation of a fuel cellpower conditioning system. Journal of ThermalEngineering International Conference on Advancesin Mechanical Engineering Istanbul 2015;1:408–19.[CrossRef].
[22] Allouhi A, Buker MS. PV water pumping systemsfor domestic uses in remote areas: sizing process.Simulation and Economic Evaluation 2019;132:798–812. [CrossRef]
[23] Setiawan EA, Setiawan A, Siregar D. Analysis onsolar panel performance and PV-inverter config-uration for tropical region. Journal of ThermalEngineering 2017;3:1259–70. [CrossRef]
[24] Mariem K, Arbi KM, Mouldi BF. Modeling andsimulation of the photovoltaic water pumping sys-tem. IEEE International Conference on ElectricalSciences and Technologies 3–6 Nov, 2014. [CrossRef]
[25] Oi A, Taufik M, Anwari M. Modeling and simula-tion of photovoltaic water pumping system. IEEE
ETHICS
There are no ethical issues with the publication of this manuscript.
REFERENCES
[1] Central electricity authority. All India installedcapacity of power stations 2019;1–7. http://cea.nic.in/reports/monthly/installedcapacity/2019/installed_capacitys-01.pdf.
[2] World Energy Outlook 2015. Special Report: IndiaEnergy Outlook. http://www.iea.org/publications/freepublications/publication/IndiaEnergyOutlook_WEO 2015.
[3] Kirmani S, Jamil M, Rizwan M. Empirical cor-relation of estimating global solar radiation usingmeteorological parameters. International Journal ofSustainable Energy 2015;327–39. https://doi.org/10.1080/14786451.2013.826222. [CrossRef]
[4] Rathore P, Sunder Das S, Singh Chauhan D.Perspectives of solar photovoltaic water pumpingfor irrigation in India. Energy Strategy Reviews2018;22: 385–95. [CrossRef]
[5] Chandela SS, Nagaraju Naika M, Chandel R.Review of performance studies of direct-coupledphotovoltaic water pumping systems and casestudy. Renewable and Sustainable Energy Reviews2017;76:163–75. [CrossRef]
[6] Vinod, RK, Singh SK. Solar photovoltaic modelingand simulation: as a renewable energy solution.Energy Reports 2018;4:701–12. [CrossRef]
[7] Deokar VH, Bindu RS. Active cooling system forefficiency improvement of PV panel and utilizationof waste recovered heat for hygienic drying of onionflakes. Journal of Materials Science – Materials inelectronics 2021;32:2088–102. [CrossRef]
[8] Yin OW, Chitti Babu B. Simple and easy approachfor mathematic al analysis of photovoltaic (PV)module under normal and partial shading condi-tions. International Journal for Light and ElectronOptics 2018;169:48–61. [CrossRef].
[9] Kaldellis J, Meidanis E, Zafirakis D. Experimentalenergy analysis of a stand-alone photovoltaic-basedwater pumping installation. Applied Energy2011;88:4556–62. [CrossRef]
[10] Belkassmi Y, Rafiki A, Gueraoui K. Modelingand simulation of photovoltaic module based onone diode model using Matlab/Simulink. IEEE-International Conference on Engineering & MIS(ICEMIS) Tunisia 2017. [CrossRef]
[11] Chatta MB, Ali HM, Ali M, Bashir MA. Experimentalinvestigation of monocrystalline and polycrystallinesolar modules at different inclination angles. Journal ofThermal Engineering Special 2017;4:2137–48. [CrossRef]

J Ther Eng, Vol. 7, No. 6, pp. 1392–1405, September, 2021 1405
pump under the outdoor condition of Nagpur, India. Renewable Energy 2016;97:737–45. [CrossRef]
[32] Meunier S, Heinrich M, Queval L. A validated modelof a photovoltaic water pumping system for off-gridrural communities. Applied Energy 2019;241:580–91.[CrossRef]
[33] Benghanem M, Daffallah KO, Alamri SN. Effectof pumping head on solar water pumping system,Energy Conversion and Management 2014;77:334–9. [CrossRef]
[34] Taner T, Dalkilic AS. A feasibility study of solar energy: techno economic analysis from Aksaray city. Journalof Thermal Engineering 2019;5:25–30. [CrossRef]
[35] Barsanti M, Ciulli E, Forte P, Libraschi M, Strambi M. Error analysis in the determination of the dynamiccoefficients of tilting pad journal bearings. Procediastructural Integrity 2019;24:988–96. [CrossRef]
[36] Kaldellis JK, Meidanis E, Zafirakis D. Experimentalenergy analysis of stand-alone photovoltaic-basedwater pumping installation. Applied Energy 2015;88:4556–62. [CrossRef]
[37] Grewal BS. Numerical Methods in Engineering andScience – Error in Computation. 9th ed. KhannaPublishers: Darja Ganj, India; 2010:1–12.
3rd Asia International Conference on Modelling & Simulation 2009;497–502. [CrossRef]
[26] Sharifishourabi M, Alimoradiyan H, Atikol U.Modelling of hybrid renewable energy system: thecase study of Istanbul, Turkey. Journal of ThermalEngineering international Conference on Advancesin Mechanical Engineering Istanbul 2016;990–4.[CrossRef]
[27] Malla SG, Bhende CN, Mishra S. Photovoltaicbased water pumping system. IEEE InternationalConference on Energy, Automation and Signal28–30 Dec 2011. [CrossRef].
[28] Kumar R, Singh B. Solar PV powered-sensor lessBLDC motor driven water pump. IET RenewablePower Generation 2018. [CrossRef]
[29] Tiwari AK, Kalamkar VR. Effect of pumping headon solar water pumping system. Proceedings of theIndia International Science Festival- Young Scientists Meet DST – Government of India 2015;25–34.
[30] Mohammedi A, Rekioua D, Mezzai N. Experimental study of a PV water pumping system. Journal ofElectrical Systems 2013;212–22.
[31] Tiwari AK, Kalamkar VR. Performance investiga-tions of solar water pumping system using helical