Simulation approaches for informal inference: Models to ...
9
HAL Id: hal-01287093 https://hal.archives-ouvertes.fr/hal-01287093 Submitted on 11 Mar 2016 HAL is a multi-disciplinary open access archive for the deposit and dissemination of sci- entific research documents, whether they are pub- lished or not. The documents may come from teaching and research institutions in France or abroad, or from public or private research centers. L’archive ouverte pluridisciplinaire HAL, est destinée au dépôt et à la diffusion de documents scientifiques de niveau recherche, publiés ou non, émanant des établissements d’enseignement et de recherche français ou étrangers, des laboratoires publics ou privés. Simulation approaches for informal inference: Models to develop understanding Hollylynne Lee, Dung Tran, Jennifer Nickell, Helen Doerr To cite this version: Hollylynne Lee, Dung Tran, Jennifer Nickell, Helen Doerr. Simulation approaches for informal in- ference: Models to develop understanding. CERME 9 - Ninth Congress of the European Society for Research in Mathematics Education, Charles University in Prague, Faculty of Education; ERME, Feb 2015, Prague, Czech Republic. pp.707-714. hal-01287093
Transcript of Simulation approaches for informal inference: Models to ...

HAL Id: hal-01287093https://hal.archives-ouvertes.fr/hal-01287093
Submitted on 11 Mar 2016
HAL is a multi-disciplinary open accessarchive for the deposit and dissemination of sci-entific research documents, whether they are pub-lished or not. The documents may come fromteaching and research institutions in France orabroad, or from public or private research centers.
L’archive ouverte pluridisciplinaire HAL, estdestinée au dépôt et à la diffusion de documentsscientifiques de niveau recherche, publiés ou non,émanant des établissements d’enseignement et derecherche français ou étrangers, des laboratoirespublics ou privés.
Simulation approaches for informal inference: Models todevelop understanding
Hollylynne Lee, Dung Tran, Jennifer Nickell, Helen Doerr
To cite this version:Hollylynne Lee, Dung Tran, Jennifer Nickell, Helen Doerr. Simulation approaches for informal in-ference: Models to develop understanding. CERME 9 - Ninth Congress of the European Society forResearch in Mathematics Education, Charles University in Prague, Faculty of Education; ERME, Feb2015, Prague, Czech Republic. pp.707-714. �hal-01287093�

707CERME9 (2015) – TWG05
Simulation approaches for informal inference: Models to develop understanding
Hollylynne S. Lee1, Dung Tran1, Jennifer Nickell1 and Helen Doerr2
1 NC State University, Raleigh, North Carolina, USA, [email protected]
2 Syracuse University, Syracuse, New York, USA
Simulation approaches to inference have gained promi-nence in statistics education. In this paper we combine a theoretical analysis of the ways researchers and cur-riculum developers have represented models of simu-lation processes with an empirical analysis of the ways teachers represent models of the process they believe would be helpful to students. Our results cumulate in suggestions for a more explicit framework for using a simulation approach to inference.
Keywords: Teachers, modelling, technology, informal
inference.
INTRODUCTION
The meat of doing statistics is making inferences about data. Researchers suggest introducing infer-ence informally first and then transitioning to the procedures of formal inference (e.g., Zieffler et al., 2008). In building up informal inferential reasoning, a simulation approach can be an important tool to help students build a deep understanding of the abstract statistical concepts involved (Burrill, 2002; Maxara & Biehler, 2006). Indeed, Cobb (2007) suggests that ed-ucators can help students develop an understanding of inference through the “three R’s: randomize data, repeat by simulation, and reject any model that puts your data in its tail” (p.12). Incorporating hands on ex-periences and dynamic statistical software can allow students to visualize the statistical process in order to develop an understanding of the inference process (Budgett, Pfannkuch, Regan, & Wild, 2013). Simulation approaches have been used in several curricula ef-forts in the US at the collegiate level, and new national standards in the US suggest such an approach for high school students. Researchers have reported modest results in improvement of students’ understandings of inference through collegiate curriculum that use a
simulation approach (e.g., Garfield, delMas, & Zieffler, 2012; Tintle et al., 2012).
A simulation approach seems to be an appropriate way to help students develop statistical inference con-ceptually. However, while the “three R’s” process may seem simple, understanding all parts of a simulation is conceptually complicated. In fact, even students who know how to conduct a simulation, may not have a robust understanding of why they are conducting a simulation, what is being simulated, and how to make appropriate conclusions based on a simulation. Thus, our research aims to consider, from a theoretical and empirical perspective, how teachers could and should represent the processes involved in using a simulation approach that could assist students in better under-standing the general usefulness of such an approach in inference contexts.
Our work is situated in a models and modelling per-spective on teaching and learning mathematics as ar-ticulated by Lesh and Doerr (2003). In this perspective, models are systems of elements, relationships, opera-tions, and rules that can be used to describe, explain or predict the behaviour of some other familiar system. Thus, we are very interested in how models (and mod-elling) can be used to improve teachers and students’ understanding of a simulation approach to inference.
MODELS USED BY OTHERS
Many have engaged in research and curriculum devel-opment over the past 15 years, focused particularly on understanding inference and simulation approach-es. For the purposes of our paper, we will highlight the work of several researchers whose models seem to build from one another. In 2002, Saldanha and Thompson reported that, when students can visual-ize a simulation process through a three-tier scheme,

Simulation approaches for informal inference: Models to develop understanding (Hollylynne S. Lee, Dung Tran, Jennifer Nickell and Helen Doerr)
708
they develop a deeper understanding of the process and logic of inference. This scheme is centered around
“the images of repeatedly sampling from a population, recording a statistic, and tracking the accumulation of statistics as they distribute themselves along a range of possibilities” (p. 261). The diagram in Figure 1 is meant to explicitly draw attention to the multiplica-tive relationship between a population, sample(s), and a distribution of sample statistics. Thus, the diagram can serve as a model for the process of repeated sam-pling. Their work also had students experience and attend to three levels in the sampling process: 1) ran-domly draw items to form a sample of a given size and record a statistic of interest, 2) repeat Level 1 process a large number of times and accumulate a collection of statistics, and 3) partition the collection of statistics to determine what proportion lies beyond a given value.
Several researchers have built from Saldanha and Thompson’s multi-tier scheme and the models and modelling work of Lesh and Doerr (2003) for creating models that can assist students when using simulation approaches, or resampling techniques, for inference (Garfield et al., 2012; Lane-Getaz, 2006). Lane-Getaz (2006) offered the Simulation Process Model (SPM). This process includes three tiers: population parame-ters, random samples, and distribution of sample sta-tistics. The SPM resembles Saldanha and Thompson’s (2002) model and verbal description of three levels, but uses more explicit language in the diagram itself. The first tier is to describe the population distribution as the beginning of the simulation process, then, ran-dom samples are drawn from the population, and a sample statistic is selected related to the simula-tion process for Tier 2. In the last and third tier, the distribution of the sample statistics is formulated, and used to evaluate the likelihood of the event happened in the origi-nal problem (Figure 2). Lane-Getaz described how she used the SPM as an organizer to help students understand the general process of inference. She then adapted the SPM to specific examples used in her course so that students can see how the model frames the simu-lation process used in different contexts.
In line with Lane-Getaz’s suggestion, Garfield and col-leagues (2012) used a models and modeling approach in the design and research of the CATALYST curricu-lum (Catalyst for Change, 2012). Figure 3 shows their three-level framework including specifying a model, samples and numerical summary measures, and dis-tribution of the numerical summary measures ap-plied to one task (Cereal Boxes). They, too, advocated using a general structured diagram with students to organize their thinking about the general simulation process and for specific problems.
Figure 1: Model for sampling conception (Saldanha &Thompson,
2002, p. 267)
Figure 2: Simulation Process Model (Lane-Getaz, 2006, p. 280)

Simulation approaches for informal inference: Models to develop understanding (Hollylynne S. Lee, Dung Tran, Jennifer Nickell and Helen Doerr)
709
All the models shown in Figures 1, 2, and 3 include three tiers/levels for the simulation process, includ-ing population, samples, and sampling distribution, even though these terms are either implicitly or ex-plicitly used. However, there are some differences. For example, Saldanha and Thompson (2002) implicitly allude to a statistic of interest in their diagram but explicitly refer to it in their verbal description of the three-level process. The statistic of interest is explic-itly referred to in the other two diagrams (Figures 2 and 3).
Our understandings of the literature on simulation approaches to inference and the representations used by others, informed our design of tasks to use with teachers in a graduate course on teaching and learning statistics. What follows is a description of the course, participants, and several tasks that took a simulation approach to inference. The set of tasks served as a model development sequence (Lesh et al., 2003) that enabled us to support the development of teachers’ understanding of a simulation approach to inference while also revealing and eliciting their thinking. As teachers (and students) are learning about simulation techniques, we cannot assume that they fully understand the computer representations of that process and the underlying randomization and sampling that is occurring. Hence, this paper
focuses on a task presented to teachers to elicit how they would help students understand the simulation process. Specifically, we wondered: What can we learn from teachers’ visualizations of the components of a simulation process for drawing an inference to suggest a general framework (model) that could assist learners?
COURSE AND DATA COLLECTION
A team of four instructors from two institutions met weekly via videoconference for an academic year to design a 15-week course offered at each institution, and to discuss issues and alter plans as the course was taught. The course consisted of opportunities for teachers to engage in statistical investigations with real data and tasks designed to develop understand-ings of distribution, samples and sampling distribu-tions, and inferential statistics, especially using ran-domization approaches. The course used the software TinkerPlots (Konold & Miller, 2011) and applets (e.g., http://lock5stat.com/statkey). The software provided simulation tools needed to represent a population, a sample, and a distribution of sample statistics.
The simulation tasks used in the course were adapt-ed from typical ones used by popular introductory statistics materials that use modeling and random-ization approaches (e.g., Paul the Octopus task, Lock et
Figure 3: CATALYST modeling and simulation process (Garfield et al., 2012, p. 890)
Simulation approaches for informal inference: Models to develop understanding (Hollylynne S. Lee, Dung Tran, Jennifer Nickell and Helen Doerr)
710
al., 2013; Dolphin Therapy task, Catalysts for Change, 2012). Teachers had also been assigned two articles (Lane-Getaz, 2006; Lee, Starling, & Gonzalez, 2014) to read in which authors used diagrams (Figure 2, and another similar to Figure 1) to illustrate the sim-ulation approach used in the tasks discussed in the articles.
After two simulation tasks (Paul the Octopus and Dolphin Therapy), the instructor summarized the models that were designed and the resulting simu-lation process used. The intent of this summary was to help make connections across the two simulation tasks and generalize the processes used to develop an overall conception of the modeling and simula-tion process. After this summary, and before the as-signed readings had been discussed, the instructor used the following task to allow teachers an oppor-tunity to express their developing conceptions of the simulation process in terms of how they would help their students to understand the process. Teachers formed nine groups of 2–3 to create diagrams on a large poster. The exact wording of the task posed to teachers was:
Suppose you were going to use a randomization ap-proach with your students to help them use a simu-lation (with physical objects or computer models) to investigate if an observed statistic is likely to occur, or not unlikely to occur. Draw a diagram you could use to help students understand the general process used for applying randomization techniques for solving these types of tasks.
Across institutions, the course served a variety of graduate students. This paper focuses on the 19 par-ticipants from one institution, since this diagramming task was not completed at the other institution. The 19 participants consisted of one advanced standing preservice teacher (5th year senior), three preservice teachers enrolled in an M.A.T. program; 10 teachers in a masters program while currently teaching stu-dents in secondary or tertiary contexts; and five PhD students in Mathematics or Mathematics Education, three of whom were currently teaching in tertiary contexts. Fifteen teachers were female and four were male, with two teachers for whom English was a sec-ond language. All but one teacher had completed at least a first level course in statistics. Henceforth we refer to course participants as teachers.
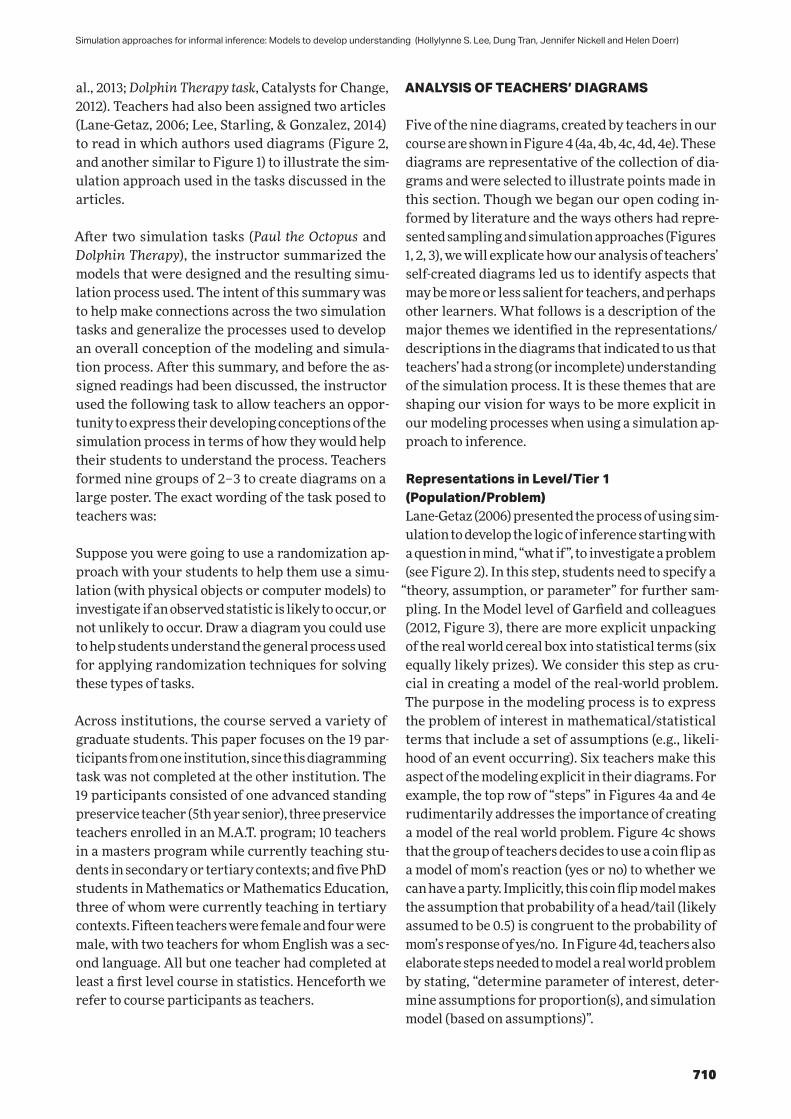
ANALYSIS OF TEACHERS’ DIAGRAMS
Five of the nine diagrams, created by teachers in our course are shown in Figure 4 (4a, 4b, 4c, 4d, 4e). These diagrams are representative of the collection of dia-grams and were selected to illustrate points made in this section. Though we began our open coding in-formed by literature and the ways others had repre-sented sampling and simulation approaches (Figures 1, 2, 3), we will explicate how our analysis of teachers’ self-created diagrams led us to identify aspects that may be more or less salient for teachers, and perhaps other learners. What follows is a description of the major themes we identified in the representations/descriptions in the diagrams that indicated to us that teachers’ had a strong (or incomplete) understanding of the simulation process. It is these themes that are shaping our vision for ways to be more explicit in our modeling processes when using a simulation ap-proach to inference.
Representations in Level/Tier 1 (Population/Problem)Lane-Getaz (2006) presented the process of using sim-ulation to develop the logic of inference starting with a question in mind, “what if ”, to investigate a problem (see Figure 2). In this step, students need to specify a
“theory, assumption, or parameter” for further sam-pling. In the Model level of Garfield and colleagues (2012, Figure 3), there are more explicit unpacking of the real world cereal box into statistical terms (six equally likely prizes). We consider this step as cru-cial in creating a model of the real-world problem. The purpose in the modeling process is to express the problem of interest in mathematical/statistical terms that include a set of assumptions (e.g., likeli-hood of an event occurring). Six teachers make this aspect of the modeling explicit in their diagrams. For example, the top row of “steps” in Figures 4a and 4e rudimentarily addresses the importance of creating a model of the real world problem. Figure 4c shows that the group of teachers decides to use a coin flip as a model of mom’s reaction (yes or no) to whether we can have a party. Implicitly, this coin flip model makes the assumption that probability of a head/tail (likely assumed to be 0.5) is congruent to the probability of mom’s response of yes/no. In Figure 4d, teachers also elaborate steps needed to model a real world problem by stating, “determine parameter of interest, deter-mine assumptions for proportion(s), and simulation model (based on assumptions)”.

Simulation approaches for informal inference: Models to develop understanding (Hollylynne S. Lee, Dung Tran, Jennifer Nickell and Helen Doerr)
711
Figure 4b
Figure 4a
Figure 4e
Figure 4d
Figure 4c
Figure 4: Five diagrams created by teachers

Simulation approaches for informal inference: Models to develop understanding (Hollylynne S. Lee, Dung Tran, Jennifer Nickell and Helen Doerr)
712
Emerging from our teachers’ diagrams, we noticed that they often attended to identifying the statistic of interest in the original problem that would be later used in the simulation process and for decision mak-ing. For example, the posters in Figures 4a, 4b, and 4e explicitly mark or indicate a quantity of interest form the original problem and refer to it later in the simulation process as the statistics to collect and that one needs to locate that statistics in the distribution of sample statistics for decision making. Thus, we found that six diagrams emphasized the process of creating a model for the real world problem and attended to the importance of the original statistics of interest in the problem. This level of detail does not appear explicitly in the models shown in Figures 1, 2, and 3.
After the model of the real-world problem is formu-lated, one needs to develop a model for the simula-tion process. In this modeling step, one decides which types of random-generating devices (physical or tech-nological tools) can be used to accurately represent the random selection or assignment in the problem. When conducting the simulation, it is important to consider the assumptions behind the use of the tools to align with those made in the questions of interest. For example, when using a coin to model the chance of success in Mom saying yes to a party (Figure 4c), an as-sumption inherently made is that the coin is fair or the probabilities of a head and a tail are equal and equal to 0.5. Similarly, if one decides to use a simulator tool, it is important to specify the probability distribution and how it matches the assumptions in the problem (See Figure 4d “Simulation Model”). We also see in Figure 4b that teachers represented the process of combining all participants together and reassigning to groups for the Dolphin Therapy example.
Representations in Level/Tier 2 (Randomize and Repeat)Teachers had very different ways of representing the process of generating a random sample of size n and computing a statistic, repeating this process k times, and collecting and displaying statistics from all k sam-ples. To begin with, the notion of a random sample (or randomization process) was not always explicit. While posters in Figures 4b and 4e indicated random sampling, the poster in Figure 4c may have implied the random process by noting the “coin flip”. The notion of a single sample of size n, repeated k times was also not always well represented. For the posters using a specific example (Figures 4b and 4c), the n
that was noted in the pictures matched the problem context (n=15 in each group, and n= 5 responses from Mom). However, the teachers that drew or described a general process did not explicitly state the need for k samples of size n, though phrases such as “many samples” “high number” and the pictorial diagrams in Figures 4c and 4d implied a repeated process. As deliberately pointed out in the Lane-Getaz’s (2006) diagram (Figure 2), “the samples of size n” are im-portant to distinguish from k samples (often many) in sampling. Both n and k are critical parameters in designing and running a simulation, especially since they are often inputs required in software such as TinkerPlots.
All teachers explicitly or implicitly indicated that the simulation process including recording, collecting, and graphing a statistic of interest from each sample. However, the level of detail or pictorial representa-tion of this process varied greatly. Since these diagram were meant for teacher to express a representation they could use to help their students understand this process, we were certainly left wondering whether they really understood the randomize, repeat and collect phase.
Representations from Level/Tier 3 (Empirical Sampling Distribution)Seven diagrams included an image of an empirical sampling distribution in their diagram, with an excep-tion shown in Figure 4d. Many also explicitly drew or indicated that the original statistic from the problem context should be located in the distribution (Figures 4a, 4d, 4e) and used to assess likelihood that the orig-inal statistics would occur under the assumed model of random selection or assignment. Only six diagrams explicitly indicated where to look in the empirical sampling distribution and how to estimate a prob-ability (proportion) of the actual observed event by examining the tail(s) of the distribution (Figures 4a, 4b, 4e).
SUMMARY AND SUGGESTIONS
As we reflected on the diagrams constructed by our teachers and compared these with the diagrams for simulation processes discussed in research literature, we saw the need to propose aspects of a simulation approach that should be made much more explicit for learners and teachers. One major distinction we suggest is that more attention needs to be given to
Simulation approaches for informal inference: Models to develop understanding (Hollylynne S. Lee, Dung Tran, Jennifer Nickell and Helen Doerr)
713
the modelling process. We feel that there is a two part modelling process that should be made explicit. This modelling process is similar to the emergent models that Gravemeijer (1999) purports can assist in tran-sitioning from a real context to formal mathematics. The first is to create a local specific model of the real world context in statistical terms. The second is cre-ating a model for the simulation process that can be used to generate random samples. The second model for the simulation process is more general because it can be applied to many problems. Most previous works have combined these two aspects into a single
“model” or population level. We also suggest being more explicit concerning building a distribution of sample statistics, using the distribution to reason about the observed statistic, and making a claim about the chance of that observed statistic occurring. We encourage others to consider making explicit the following aspects:
Level 1. Population: Create a MODEL OF the re-al-world problem
― Make assumptions to build a mathematical/statistical model of the problem – determine a null hypothesis
― Specify the observed statistic and the statistic of interest
Level 2: Simulation Model: Create a MODEL FOR simulation process
― Choose appropriate tool(s) (physical/techno-logical) for the problem that aligns with the assumptions made in creating the model of the real problem
Level 3. Samples and Statistics: Randomize and repeat
― Draw a random sample of same size n and record relevant statistic
― Repeat random sample k times (large number) and collect statistics from each sample
Level 4. Empirical Sampling Distribution: Examine how statistics vary
― Build a distribution for the recorded statistics
― Locate the original observed statistic in the sampling distribution
Level 5. Final Decision: Making inferences from models
― Use proportional reasoning to evaluate the likelihood of the event happened.
― Decide if the observed statistic and those more extreme are explainable by chance.
We maintain that a simulation approach framework could help support scaffolding, and eventually ab-straction, for how a simulation approach can be used for inference. It is also important for students to expe-rience various models in specific situations. Such ped-agogical approaches have been advocated for by many, and used successfully in work such as Garfield and colleagues (2012) and Podworny and Biehler (2014).
REFERENCES
Budgett, S., Pfannkuch, M., Regan, M., & Wild, C. J. (2013).
Dynamic visualizations and the randomization test.
Technology Innovations in Statistics Education, 7(2), 1–21.
Burrill, G. (2002). Simulation as a tool to develop statistical un-
derstanding. Paper Presented at the Sixth International
Conference on Teaching Statistics, Cape Town, South
Africa.
Catalysts for Change. (2012). Statistical thinking: A simulation
approach to modeling uncertainty. Minnesota, MN: Catalyst
Press.
Cobb, P. (2007). The introductory statistics course: A ptolemaic
curriculum? Technology Innovations in Statistics Education,
1(1).
Gravemeijer, K. (1999). How emergent models may foster the
constitution of formal mathematics. Mathematical Thinking
and Learning, 1(2), 155–177.
Garfield, J., delMas, R., & Zieffler, A. (2012). Developing statisti-
cal modelers and thinkers in an introductory, tertiary-level
statistics course. ZDM, 44, 883–898.
Konold, C., & Miller, C.D. (2011). TinkerPlots: Dynamic data explo-
ration [computer software, Version 2.0]. Emeryville, CA: Key
Curriculum Press.
Lane-Getaz, S. J. (2006). What is statistical thinking and how
is it developed? In G. Burrill (Ed.), Thinking and reasoning
with data and chance: Sixty-eighth yearbook (pp. 272–289).
Reston, VA: National Council of Teachers of Mathematics.

Simulation approaches for informal inference: Models to develop understanding (Hollylynne S. Lee, Dung Tran, Jennifer Nickell and Helen Doerr)
714
Lee, H. S., Starling, T. T., & Gonzalez, M. D. (2014). Using data
to motivate the use of empirical sampling distributions.
Mathematics Teacher, 107(6), 465–469.
Lesh, R. A., & Doerr, H. M. (Eds.). (2003). Beyond constructivism:
Models and modeling perspectives on mathematics prob-
lem solving, learning, and teaching. Mahwah, NJ: Lawrence
Erlbaum Associates.
Lesh, R. A., Cramer, K., Doerr, H. M., Post, T., & Zawojewski, J. S.
(2003). Model development sequences. In R. A. Lesh & H.
M. Doerr (Eds.), Beyond constructivism: Models and model-
ing perspectives on mathematics problem solving, learning,
and teaching (pp. 35–58). Mahwah, NJ: Lawrence Erlbaum
Assoc.
Lock, R. H., Lock, R.H., Morgan, K. L., Lock, E. F., & Lock, D. F.
(2013). Statistics: Unlocking the power of data. Wiley.
Maxara, C., & Biehler, R. (2006). Students’ probabilistic simula-
tion and modeling competence after a computer intensive
elementary course in statistics and probability. Paper
Presented at the Seventh International Conference on
Teaching Statistics. Salvador da Bahia, Brazil.
Podworny, S., & Biehler, R. (2014). A learning trajectory on hy-
pothesis testing with TinkerPlots - Design and exploratory
evaluation. In K. Makar, B. de Sousa, & R. Gould (Eds.),
Sustainability in statistics education. Proceedings of the
Ninth International Conference on Teaching Statistics
(ICOTS9, July 2014) Flagstaff, Arizona, USA. Voorburg, The
Netherlands: International Statistical Institute.
Saldanha, L., & Thompson, P. W. (2002). Conceptions of sample
and their relationship to statistical inference. Educational
Studies in Mathematics, 51, 257–270.
Tintle, N., Topliff, K., Vanderstoep, J., Holmes, V.-L., & Swanson,
T. (2012). Retention of statistical concepts in a preliminary
randomization-based introductory statistics curriculum.
Statistics Education Research Journal, 11(1), 21–40.
Zieffler, A., Garfield, J., Delmas, R., & Reading, C. (2008). A frame-
work to support research on informal inferential reasoning.
Statistics Education Research Journal, 7(2), 40–58.