Simulation and Management of Environmental Disturbances in ...
99
FACULDADE DE E NGENHARIA DA UNIVERSIDADE DO P ORTO Simulation and Management of Environmental Disturbances in Flight Simulator X João Fernando de Sousa Almeida Mestrado Integrado em Engenharia Informática e Computação Supervisor: Daniel Castro Silva September 22, 2017
Transcript of Simulation and Management of Environmental Disturbances in ...

FACULDADE DE ENGENHARIA DA UNIVERSIDADE DO PORTO
Simulation and Management ofEnvironmental Disturbances in Flight
Simulator X
João Fernando de Sousa Almeida
Mestrado Integrado em Engenharia Informática e Computação
Supervisor: Daniel Castro Silva
September 22, 2017


Simulation and Management of EnvironmentalDisturbances in Flight Simulator X
João Fernando de Sousa Almeida
Mestrado Integrado em Engenharia Informática e Computação
September 22, 2017


Abstract
The frequency of natural and man-made disasters which affect the environment has been risingin recent years. In order to comprehend, examine, and even combat these occurrences, variousvehicles are utilized on missions: aircraft, ships and automobiles represent the majority. Such ve-hicles may be manned, remote-controlled, or even fully autonomous; the latter being increasinglycommon.
As to provide a way of simulating cooperative multi-vehicle missions, a platform was de-veloped at the Artificial Intelligence and Computer Science Laboratory (Faculty of Engineering,University of Porto) using Microsoft’s Flight Simulator X (FSX) as its core and simulation engine.Despite being centered on a flight simulator, it supports vehicles beyond aircraft.
The Platform includes a control panel, which allows for the specification of each mission;an agent to manage traffic; a vehicle control agent; performance analysis; and the basis for adisturbances management tool. The Platform enables the specification and deployment of a widevariety of missions using multiple vehicle types on various simulations. While still technically inprototype stage, the Platform is currently at a fairly advanced level.
Is it possible to create an environmental disturbances manager, and effectively integrate itwithin the existing platform? Is it feasible to introduce a generic interface for external disastersimulators into the system? The former research questions represent the focus of the research anddevelopment work at hand. A positive answer would be an excellent sign that the Platform waseffectively improved, and that it became more suitable for a real world application. A neutral oreven negative answer may be undesired, however it may still provide a good insight on what isachievable on a similar architecture, and provide the researcher with the knowledge to apply onimproving current or future solutions to similar problems.
The Disturbances Manager is responsible for the simulation of environmental anomalies -which may require the intervention of vehicle teams, or have an impact on unrelated vehicularmissions; it is launched through the Platform’s Control Panel, communicates with FSX and withthe Vehicle Control Agents - as to relay the corresponding sensor readings (e.g. an automobilebeing driven in the vicinity of a burning building will get higher temperature and carbon dioxidereadings).
The Control Panel allows for the specification of disturbances using a graphical interface, aswell as saving and loading of the resulting XML files. After the mentioned steps, the DisturbancesManager is launched to handle the Disturbances at hand - handling their position, space and timeevolutions, generated sensor readings, and more.
Given that the Disturbances Manager was fully integrated into a distributed simulation plat-form, similar architectures were studied and taken into consideration on how to perform saidintegration.
A fire may be spreading on a mountain range, which needs to be located; a hurricane mayoccur in the set course for an upcoming flight. The Disturbances Manager aims to facilitate thesimulation of such events, among others.
i

The main objective for this dissertation was the development the disturbances managementcomponent of the mentioned platform, with simulates objective of simulating a wide array of dis-turbances, such as fires, pollution, storms, volcanic eruptions and chemical spills. The simulationof such disturbances allows the posterior automatic adapting of vehicular missions according tothe placement, evolution, and sensor readings related to the disturbances at hand (e.g. to avoid alow-visibility area in a commercial flight or to locate the center of a forest fire, in the case of aerialfirefighting).
The Disturbances Manager was implemented within The Platform, achieving the core objec-tive of the dissertation. A battery of tests was performed in order to validate its functionalities andunderstand its limitations. It was verified that the sensor readings are sent to the vehicles oncethey reach the affected area; the readings are higher at the center of the disturbances; the timeevolutions of the emitted readings occur as planned; the spacial growth of the disturbances’ areasalso performs as expected.
Keywords: simulation, environmental, disturbances, flight, multi-vehicle, missions
ii

Resumo
A frequência de desastres que afectam o ambiente, tanto naturais como originados pelo Homem,tem vindo a aumentar. De modo a compreender, examinar, e até combater estas ocorrências, váriosveículos são utilizados em missões: aeronaves, navios e automóveis representando a maioria. Taisveículos podem conter um condutor humano, podem ser controlados remotamente, ou até sercompletamente autónomos, com esta alternativa a tornar-se cada vez mais comum.
De modo a providenciar uma forma de simular missões cooperativas multi-veículo, uma plata-forma foi desenvolvida utilizando o Flight Simulator X da Microsoft (FSX) como o correspondentenúcleo e motor de simulação. Apesar de ser centrada num simulador de vôo, a plataforma suportaveículos para além de aeronaves.
A Plataforma inclui um painel de controlo, que permite a especificação de cada missão; umagente para gerir o tráfego; um agente de controlo de veículos; análise de desempenho; e a basepara uma plataforma de gestão de distúrbios. A Plataforma permite a especificação e execução deuma abrangente variedade de missões utilizando múltiplos tipos de veículos em várias simulações.Apesar de ainda tecnicamente em fase de protótipo, A Plataforma encontra-se numa fase bastanteavançada.
Será possível criar um gestor de distúrbios ambientais, e integrá-lo eficazmente na plataformaexistente? É exequível introduzir uma interface genérica para simulações externas de desastresno sistema? As questões apresentadas representam o foco da tarefa de investigação e desenvolvi-mento em questão. Uma resposta positiva para estas questões seria ser um excelente sinal de quea Plataforma foi melhorada eficazmente, e que essa se tornou mais adequada para aplicações nomundo real. Uma resposta neutra ou até negativa pode ser indesejada, no entanto providencia-ria também uma boa perspectiva sobre o que pode ser alcançado em arquiteturas semelhantes, efornecer ao investigador conhecimento a ser aplicado no sentido a melhorar soluções atuais oufuturas para problemas semelhantes.
O Gestor de Distúrbios é responsável pela simulação de anomalias ambientais - que podem re-querer a intervenção de equipas veículares, ou ter impacto em missões veículares não relacionadas;este é lançado através do Painel de Controlo da Plataforma, comunicando com o FSX e com osAgentes de Controlo de Veículos - de modo a transmitir aos mesmos as leituras dos sensores cor-respondentes (e.g. um automóvel a ser conduzido na vizinhança de um edifício em chamas obteráleituras de temperatura e de dióxido de carbono acima da norma).
O Painel de Controlo permite a especificação de distúrbios através de uma interface gráfica, talcomo guardar e carregar os ficheiros XML resultantes. Após os passos mencionados, o Gestor deDistúrbios é lançado para processar os mesmos - gerindo a respetiva posição, evoluções temporale espacial, leituras de sensores geradas, e mais.
Sendo que o Gestor de Distúrbios foi integrado numa plataforma de simulação distribuída,arquiteturas semelhantes foram tidas em consideração no que toca a como realizar a integraçãomencionada.
iii

Um incêndio pode estar a propagar-se numa serra, sendo necessário localizá-lo; um furacãopode ocorrer no trajeto planeado para um vôo prestes a descolar. O objectivo do Gestor de Distúr-bios é facilitar a simulações de eventos desse tipo, entre outros.
O objetivo principal desta dissertação foi o desenvolvimento do componente de gestão de dis-túrbios da plataforma mencionada, com o propósito de simular uma vasta gama de distúrbios, taiscomo incêndios, poluição, tempestades, erupções vulcânicas e derrames químicos. A simulaçãode tais distúrbios permite a posterior adaptação automática de missões veiculares de acordo com alocalização, evolução e leituras de sensores relacionadas com os distúrbios em questão (e.g. paraevitar uma área de baixa visibilidade num vôo comercial ou de modo a localizar o centro de umfogo florestal, no caso de combate aéreo a incêndios).
O Gestor de Distúrbios foi implementado n’A Plataforma, atingindo o objectivo principal dadissertação. Um conjunto de testes foi realizado de modo a validar as respectivas funcionalidadese entender as suas limitações. Foi verificado que as leituras de sensores são enviadas para osveículos assim que estes atingem a área afectada; as leituras são mais elevadas no centro dosdistúrbios; as evoluções temporais das leituras emitidas ocorrem como planeado; o crescimentoespacial das áreas dos distúrbios também ocorre como esperado.
Palavras-chave: simulação, ambiental, distúrbios, vôo, multi-veículo, missões
iv

Acknowledgements
I would like to start this section by stating my gratitude to my supervisor, Daniel Silva. He was notonly the proponent for this dissertation and the creator of The Platform, but also an invaluable andever-present source of knowledge, advice and meaningful discussions. I am also thankful towardÁlvaro Câmara, who is a part of the project and provided many helpful comments, and VascoGonçalves, my friend and colleague who helped me review the document.
I would also like to thank all my friends, colleagues and teachers who worked with me andhelped me throughout my academic path.
Finally, and most importantly, I would like to give thanks to my dear family and belovedgirlfriend for withstanding my frequent absences and, above all, for the unconditional supportthroughout this journey.
Dedicated to my late father, Fernando Almeida, who passed on too soon.
João Almeida
v

vi

“And once the storm is over, you won’t remember how you made it through,how you managed to survive.
You won’t even be sure, whether the storm is really over.But one thing is certain.
When you come out of the storm, you won’t be the same person who walked in.That’s what this storm’s all about.”
Haruki Murakami
vii

viii
Contents
1 Introduction 11.1 Context and Motivation . . . . . . . . . . . . . . . . . . . . . . . . . . . . . . . 11.2 Main Goals & Research Questions . . . . . . . . . . . . . . . . . . . . . . . . . 21.3 Document Structure . . . . . . . . . . . . . . . . . . . . . . . . . . . . . . . . . 3
2 State of the Art 52.1 Disturbances - Environmental and Beyond . . . . . . . . . . . . . . . . . . . . . 5
2.1.1 Environmental Disturbance Simulators . . . . . . . . . . . . . . . . . . 82.1.2 Forest Fire Simulators . . . . . . . . . . . . . . . . . . . . . . . . . . . 102.1.3 Meteorology APIs . . . . . . . . . . . . . . . . . . . . . . . . . . . . . 122.1.4 Disturbance Representation in FSX . . . . . . . . . . . . . . . . . . . . 14
2.2 Architectures with Co-Simulators - HLA . . . . . . . . . . . . . . . . . . . . . . 162.3 Summary/Conclusions . . . . . . . . . . . . . . . . . . . . . . . . . . . . . . . 16
3 Planning & Methodology 193.1 Work Plan . . . . . . . . . . . . . . . . . . . . . . . . . . . . . . . . . . . . . . 193.2 Final Work Overview . . . . . . . . . . . . . . . . . . . . . . . . . . . . . . . . 213.3 Risk Management . . . . . . . . . . . . . . . . . . . . . . . . . . . . . . . . . . 233.4 Work Strategy . . . . . . . . . . . . . . . . . . . . . . . . . . . . . . . . . . . . 233.5 Technologies and Platforms . . . . . . . . . . . . . . . . . . . . . . . . . . . . . 24
3.5.1 The Platform . . . . . . . . . . . . . . . . . . . . . . . . . . . . . . . . 243.5.2 Programming Languages . . . . . . . . . . . . . . . . . . . . . . . . . . 253.5.3 AgentService . . . . . . . . . . . . . . . . . . . . . . . . . . . . . . . . 253.5.4 Flight Simulator X . . . . . . . . . . . . . . . . . . . . . . . . . . . . . 25
4 The Disturbance Manager 274.1 The Platform’s Architecture . . . . . . . . . . . . . . . . . . . . . . . . . . . . 274.2 The Disturbances Manager . . . . . . . . . . . . . . . . . . . . . . . . . . . . . 284.3 Disturbance Description Language (DDL) . . . . . . . . . . . . . . . . . . . . . 294.4 Teams Description Language (TDL) . . . . . . . . . . . . . . . . . . . . . . . . 304.5 Disturbance Database . . . . . . . . . . . . . . . . . . . . . . . . . . . . . . . . 304.6 High-Level Description . . . . . . . . . . . . . . . . . . . . . . . . . . . . . . . 314.7 Core . . . . . . . . . . . . . . . . . . . . . . . . . . . . . . . . . . . . . . . . . 31
4.7.1 GUI . . . . . . . . . . . . . . . . . . . . . . . . . . . . . . . . . . . . . 324.7.2 Space and Time Evolution of a Disturbance . . . . . . . . . . . . . . . . 33
4.8 Vehicle Sensor Readings . . . . . . . . . . . . . . . . . . . . . . . . . . . . . . 344.9 Communication with The Platform . . . . . . . . . . . . . . . . . . . . . . . . . 35
4.9.1 FSX - SimConnect . . . . . . . . . . . . . . . . . . . . . . . . . . . . . 35
ix
CONTENTS
4.9.2 AgentService . . . . . . . . . . . . . . . . . . . . . . . . . . . . . . . . 354.9.3 Control Panel . . . . . . . . . . . . . . . . . . . . . . . . . . . . . . . . 35
4.10 Summary / Conclusions . . . . . . . . . . . . . . . . . . . . . . . . . . . . . . . 36
5 Testing & Results 415.1 Core Test . . . . . . . . . . . . . . . . . . . . . . . . . . . . . . . . . . . . . . 42
5.1.1 Vehicle Position & Sensor Readings . . . . . . . . . . . . . . . . . . . . 425.1.2 Higher Readings in The Center . . . . . . . . . . . . . . . . . . . . . . . 425.1.3 Readings Time Evolution . . . . . . . . . . . . . . . . . . . . . . . . . . 435.1.4 Disturbance Components Space Evolution . . . . . . . . . . . . . . . . . 44
5.2 AgentService Stress Test . . . . . . . . . . . . . . . . . . . . . . . . . . . . . . 455.3 AgentService Endurance Tests . . . . . . . . . . . . . . . . . . . . . . . . . . . 53
6 Conclusions & Future Work 576.1 Limitations . . . . . . . . . . . . . . . . . . . . . . . . . . . . . . . . . . . . . 586.2 Future Work . . . . . . . . . . . . . . . . . . . . . . . . . . . . . . . . . . . . . 58
Bibliography 59
A DDL XML File 63A.1 Sample Disturbance Specification File . . . . . . . . . . . . . . . . . . . . . . . 63
B TDL XML File 67B.1 Sample Section of a Team Specification File . . . . . . . . . . . . . . . . . . . . 67
C XML Databases 71C.1 Disturbances . . . . . . . . . . . . . . . . . . . . . . . . . . . . . . . . . . . . 71C.2 Sensors . . . . . . . . . . . . . . . . . . . . . . . . . . . . . . . . . . . . . . . 75
D XSD Additions 77D.1 DDL . . . . . . . . . . . . . . . . . . . . . . . . . . . . . . . . . . . . . . . . . 77D.2 TDL . . . . . . . . . . . . . . . . . . . . . . . . . . . . . . . . . . . . . . . . . 78
x

List of Figures
2.1 ForeFire . . . . . . . . . . . . . . . . . . . . . . . . . . . . . . . . . . . . . . . 112.2 Wildfire Analyst . . . . . . . . . . . . . . . . . . . . . . . . . . . . . . . . . . . 11
3.1 Work Plan Gantt Diagram . . . . . . . . . . . . . . . . . . . . . . . . . . . . . . 193.2 The Platform’s Initial Architecture . . . . . . . . . . . . . . . . . . . . . . . . . 243.3 Flight Simulator X . . . . . . . . . . . . . . . . . . . . . . . . . . . . . . . . . 26
4.1 The Platform’s New Architecture . . . . . . . . . . . . . . . . . . . . . . . . . . 284.2 The Disturbance Manager’s Internal Structure . . . . . . . . . . . . . . . . . . . 294.3 DDL Schema Diagram . . . . . . . . . . . . . . . . . . . . . . . . . . . . . . . 374.4 TDL Schema Diagram . . . . . . . . . . . . . . . . . . . . . . . . . . . . . . . 384.5 The DM’s GUI . . . . . . . . . . . . . . . . . . . . . . . . . . . . . . . . . . . 384.6 Sensor Readings Sequence Diagram . . . . . . . . . . . . . . . . . . . . . . . . 394.7 Distance to Center of Disturbance . . . . . . . . . . . . . . . . . . . . . . . . . 394.8 The DM’s Data Flow . . . . . . . . . . . . . . . . . . . . . . . . . . . . . . . . 394.9 Control Panel (GUI) . . . . . . . . . . . . . . . . . . . . . . . . . . . . . . . . 40
5.1 Vehicle Position & Sensor Readings Test - (1/2) . . . . . . . . . . . . . . . . . . 435.2 Vehicle Position & Sensor Readings Test - (2/2) . . . . . . . . . . . . . . . . . . 445.3 Higher Readings in The Center Test - (1/2) . . . . . . . . . . . . . . . . . . . . . 455.4 Higher Readings in The Center Test - (2/2) . . . . . . . . . . . . . . . . . . . . . 465.5 Readings Time Evolution Test - (1/2) . . . . . . . . . . . . . . . . . . . . . . . . 475.6 Readings Time Evolution Test - (2/2) . . . . . . . . . . . . . . . . . . . . . . . . 485.7 Disturbance Components Space Evolution Test - (1/2) . . . . . . . . . . . . . . . 505.8 Disturbance Components Space Evolution Test - (2/2) . . . . . . . . . . . . . . . 525.9 Difference Between Expected Message Rate and Effective Message Rate . . . . . 535.10 Time per Test . . . . . . . . . . . . . . . . . . . . . . . . . . . . . . . . . . . . 545.11 Difference Between Expected Message Rate and Effective Message Rate . . . . . 555.12 Time per Test . . . . . . . . . . . . . . . . . . . . . . . . . . . . . . . . . . . . 55
xi

LIST OF FIGURES
xii

List of Tables
2.1 Land Disturbances . . . . . . . . . . . . . . . . . . . . . . . . . . . . . . . . . 62.2 Sea Disturbances . . . . . . . . . . . . . . . . . . . . . . . . . . . . . . . . . . 72.3 Storm Disturbances . . . . . . . . . . . . . . . . . . . . . . . . . . . . . . . . . 72.4 General Disturbances . . . . . . . . . . . . . . . . . . . . . . . . . . . . . . . . 72.5 Environmental Disturbance APIs Comparison . . . . . . . . . . . . . . . . . . . 92.6 Fire Simulators Comparison . . . . . . . . . . . . . . . . . . . . . . . . . . . . 122.7 Meteorology APIs Comparison . . . . . . . . . . . . . . . . . . . . . . . . . . . 13
3.1 Risk Table . . . . . . . . . . . . . . . . . . . . . . . . . . . . . . . . . . . . . . 24
5.1 AgentService One Minute Stress Tests . . . . . . . . . . . . . . . . . . . . . . . 495.2 AgentService Five Minute Stress Tests . . . . . . . . . . . . . . . . . . . . . . . 495.3 AgentService Ten Minute Stress Tests . . . . . . . . . . . . . . . . . . . . . . . 505.4 AgentService One Minute Stress Tests (Optimized) . . . . . . . . . . . . . . . . 515.5 AgentService Five Minute Stress Tests (Optimized) . . . . . . . . . . . . . . . . 515.6 AgentService Ten Minute Tests (Optimized) . . . . . . . . . . . . . . . . . . . . 525.7 AgentService Endurance Test . . . . . . . . . . . . . . . . . . . . . . . . . . . . 53
xiii

LIST OF TABLES
xiv

Abbreviations
API Application Programming InterfaceATC Air Traffic ControllerCSV Comma Separated ValuesCPM Counts Per MinuteCPU Central Processing UnitDDL Disturbances Description LanguageDM Disturbances ManagerED Environmental DisturbanceHDD Hard Disk DriveFIPA Foundation for Intelligent Physical AgentsGUI Graphical User InterfaceFSX Flight Simulator XHLA High Level ArchitectureIP Internet ProtocolJSON JavaScript Object NotationOS Operating SystemRAM Random Access MemoryRPM Rotations Per MinuteSATA Serial AT AttachmentSDK Software Development KitTDL Teams Description LanguageUI User InterfaceXML eXtensible Markup LanguageXSD XML Schema Definition
xv


Chapter 1
Introduction
In the present chapter, an overview of the thesis at hand is provided. At first, the context in which
the project is inserted is presented, as well as the motivation behind it; then, the main goals and
research questions are described; followed by the problems being approached; next, the chosen
methodology to do so; and finally an outline of this document’s structure.
1.1 Context and Motivation
Considering the increase in the frequency of climatic disasters [CRED, 2015], it is becoming more
relevant to develop methods of studying them. In the real world, multiple types of vehicles are
utilized on missions related to environmental disasters: from cars to aircraft. As to provide a means
of simulating such missions, a platform was developed [Silva, 2011] centered on Microsoft’s Flight
Simulator X. The Platform is the basis for the work at hand.
Multiple vehicle missions can be simulated through The Platform, such as searching for a spe-
cific terrain type, drop missions (e.g. dropping water over an area supposedly on fire or dropping
a food crate over an area with a rough terrain) and tracking and escorting an airplane.
One of the original purposes for The Platform is the automation of specific tests and tasks. As
an example, at The Platform’s initial state, in order to simulate the dropping of water on burning
terrain, the user must decide on which area he considers "on fire" (since the platform didn’t simu-
late fires). After such decision, the user should check whether the helicopter travels to the correct
location (not identified on the map), and if the drop occurs on the right spot. The described inter-
action requires user intervention and supervision on many levels. If there were a way to simulate
environmental disturbances and programatically deploy them at set times, that would allow for the
posterior full automation of such missions - thereby achieving one of The Platform’s objectives.
Later, a layer of automated testing could be introduced.
The Platform was developed at the Faculty of Engineering of the University of Porto, at the
Artificial Intelligence and Computer Science Laboratory. It has been the focus of one Ph.D.
1

Introduction
thesis[Silva, 2011] and four completed Masters’ theses [Camara, 2013][Sousa, 2010][Santos,
2010][Silva, 2008]; and is currently the basis for one ongoing Ph.D. thesis and three Master’s
theses. A few articles have also been written around The Platform [Sousa et al., 2010][Câmara
et al., 2014][Rodrigues et al., 2015].
The Disturbances Manager aims to add a disturbance simulation component to The Platform,
allowing the vehicles therein to become aware of ongoing disturbances near their location. When
completed, the DM should be a significant contribution toward not only The Platform’s feature
set, but also toward its potential regarding future functionalities.
1.2 Main Goals & Research Questions
The primary objective for this dissertation is to implement the component of the mentioned plat-
form responsible for the simulation of multiple types of disturbances (environmental and more) -
e.g. forest fires, floods, oil spills or lost people. Attaining the goal of a functional Disturbances
Manager (DM) enables the posterior adapting of vehicular missions to specific disturbances. As
an example: if an aircraft can get carbon dioxide sensor readings regarding an ongoing forest fire,
it may adjust its course as to minimize such readings, or even survey the area as to locate the center
of the fire - therefore allowing the testing of multiple search algorithms to find their time efficiency
at locating (i.e. putting out) fires. While forest fires were used as an example, the same may be
said for analogous disturbances.
The secondary objective is the implementation of a generic interface to be used between the
DM and external disaster simulators. If a user wishes to simulate, say, an earthquake using a 3rd-
party earthquake simulator, he should be able to use his desired simulator on The Platform through
this interface. Instead of the intensity, position, and progression of the earthquake being processed
by the DM, these (possibly among other) aspects would be provided to the DM through a software
layer which would inform the DM of the required data. This should be a means of programatically
inject information from an external simulator into the DM.
The focal points of the developed thesis work can be exposed in the form of the following
research questions:
• Is it possible to create an environmental disturbances manager, and effectively integrate it
within the existing platform?
• Is it feasible to introduce a generic interface for external disaster simulators into the system?
The first question represents the implementation of the DM on the platform. "Effectively" is
used as a key word, since even if the DM is implemented with a wide array of useful function-
alities, if it significantly impacts the real-time performance of the platform, it would not be of
use. The second question regards the aforementioned secondary objective, with "feasible" being a
meaningful term - because if the implementation were to generate a delay in the processing time
to the degree of impeding real-time performance, it would also not be useful.
2

Introduction
The Platform’s performance is considered significantly negatively impacted if it becomes un-
able to run not only real-time simulations, but also simulations at double or even four times the
real-time simulation speed. On Chapter 5, several methods were used in order to validate the
performance with a running DM.
Many components of the DM would be sufficiently complex as to warrant multiple dissertation
topics by themselves, such as the time evolution of the disturbances, their spacial dispersion,
how and when they should occur, and so on. Taking this into consideration, the project at hand
will not provide an accurate representation for each possible disturbance type; instead, the aim
is to provide a Disturbances Manager as proof of concept - that it is possible to integrate such
simulations into the Platform. The inclusion of an optional external disturbance-specific simulator
aims to ameliorate the limitations derived from the genericity of this approach.
With the exception of the external co-simulator (more details on Final Work Overview), all
the planned objectives were obtained. Validation corresponding to the main aspects of the imple-
mented functionalities was also performed, as detailed on Testing & Results.
1.3 Document Structure
The remaining sections of this document are structured as follows:
Chapter 2 consists of a summary of the state of the art and key concepts required to fully
understand this dissertation’s subject matter, including what is considered a disturbance and a dis-
aster simulator, in the context of the project at hand; what is a flight simulator; and what composes
an architecture with co-simulators.
Chapter 3 exposes the chosen methodology regarding the developed work, including plan-
ning, risk management, the chosen strategy, and technological choices - such as programming
languages.
Chapter 4 lists how the solution fits into the existing architecture, namely by expanding upon
The Platform’s enhanced architecture, the Disturbance Description Language (DDL) and the Dis-
turbance Database. It also includes a description of the Disturbances Manager’s functionalities.
The chapter also contains details regarding the implemented Disturbances Manager, including the
initial prototype, the vehicles’ sensor readings and communication with the corresponding ele-
ments of the Platform’s architecture.
The 5th chapter includes information on the creation of the performed tests, and the matching
results.
Finally, chapter 6 consists of the conclusions reached throughout the project and includes some
possibilities for future work
3

Introduction
4

Chapter 2
State of the Art
This chapter consists of a listing of the key concepts involved in the project, as well as a sum-
mary of the researched state of the art on the related subjects. It starts with the adopted definition
for the term disturbance, followed by a listing and comparison of several types of environmen-
tal disturbance-related simulators. An interesting researched architecture for systems with co-
simulators is also presented.
2.1 Disturbances - Environmental and Beyond
An Environmental Disaster is an event which negatively impacts the natural environment, often
with a high and/or long-lasting impact on the ecosystem in question. Occasionally, only occur-
rences resulting from human activity are considered environmental disasters - using the concept
of natural disaster for incidents which occur without human intervention. Throughout this doc-
ument, the expression Environmental Disturbance will encompass both concepts.
Throughout the research process, multiple sources were useful in providing information and
statistics on specific environmental disasters:
1. Government entities from the United States of America proved to be a valuable source
of data. Not only on finding the most serious [NOAA, 2017b] (in terms of lives taken
and financial damage) but also on finding statistics on the increase in yearly occurrences
[NOAA, 2017a];
2. Certain websites on the topic of disaster preparedness were also useful since they often
include listings on not only natural but also man-made disasters [IEDC, 2016];
3. An Indian government entity was also a good source on not only the types of existing dis-
turbances and their details, but also on their potential impact: with examples of the most
noteworthy disasters [NIDM, 2014];
5

State of the Art
4. A paper was found on the future prospects for disturbances [Quarantelli, 1992] which proved
to be rather insightful on the subject of what can be expected, and what can be done regard-
ing future disasters;
5. How should one study environmental disasters? At the early stages of the research work at
hand, there was some difficulty in researching and quantifying knowledge on the subject.
A research article provided valuable input on the subject [Drabek, 1970], and brought upon
the idea of introducing the Seriousness Degree on the specification of disturbances, and also
on defining the level of abstraction which was adopted on the listing and specification of the
disturbances chosen.
Furthermore, considering that there is no restriction on what a Disturbance may be, it was de-
cided to include non-environmental situations to the list of cases that are intended to be simulated
- such as car and train accidents, missing people and oil spills. Onward, the term Disturbancewill encompass all those listed in Tables 2.1 through 2.4). The following paragraphs include a
description on the rationale behind the grouping of the disturbances, as well as some details on
them.
The Land Disturbance category encompasses all the considered disturbances which occur on
land, both literally (landslides, earthquakes and volcanoes) and not (e.g. floods, accidents). These
are listed on Table 2.1.
Table 2.1: Land Disturbances
Seriousness GrowthName Origin Sensor Types Degree Rate
Landslide Natural CameraIntensity; Microphone yes yesEarthquake Natural CameraIntensity; Microphone yes yes
Flood Natural CameraIntensity yes yes
Volcano NaturalCameraIntensity; IRCameraIntensity;
yes yesTemperature; Microphone
Car Accident ManMade CameraBinary yes noTrain Accident ManMade CameraBinary yes noFleeing Person ManMade CameraBinary; Microphone yes noLost Animal ManMade CameraBinary; Microphone yes noForest Fire Any CameraIntensity; IRCameraIntensity; CO2; Temperature yes yes
Building Fire ManMade CameraIntensity; IRCameraIntensity; Temperature; CO2 yes yes
The Sea Disturbance category aggregates all the selected disturbances which take place at
sea. From tsunami to chemical spills, many were considered relevant to include on The Platform.
These are listed on Table 2.1.
The Storm Disturbance category accumulates the chosen disturbances which are related to
storms that were not listed under Land or Sea disturbances, since they can occur both on land and
at sea. The category was detailed on Table 2.3.
The General Disturbances category includes those which would not be considered good fits
for the previous categories (Land, Sea or Storm). The General Disturbances are listed in Table 2.4.
The sensors indicated in tables 2.1, 2.2, 2.3 and 2.4 are the following:
6

State of the Art
Table 2.2: Sea Disturbances
Seriousness GrowthName Origin Sensor Types Degree Rate
Strong Waves Natural CameraIntensity; Microphone yes yesTsunami Natural CameraIntensity; Microphone yes yesOil Spill ManMade CameraIntensity yes no
Chemical Spill ManMade CameraIntensity ; Chemical yes yesBoat Accident ManMade CameraBinary yes no
Hydrothermal Vent Natural CameraIntensity; Temperature; Microphone yes yes
Submarine Volcano NaturalCameraIntensity; Temperature; Chemical;
yes yesMicrophone
Schooling Fish1 Natural CameraIntensity yes yes1 A large aggregation of fish, relevant to submarines and boats
Table 2.3: Storm Disturbances
Seriousness GrowthName Origin Sensor Types Degree Rate
Heavy Rain Natural CameraIntensity; HumiditySensor; AirPressure; yes yesWindSpeed; Microphone
Thunderstorm NaturalCameraIntensity; HumiditySensor; AirPressure
yes yesWindSpeed; ElectricField; MagneticField; Microphone
Hurricane Natural CameraIntensity; AirPressure; WindSpeed; Microphone yes yes
Table 2.4: General Disturbances
Seriousness GrowthName Origin Sensor Types Degree Rate
Bug Infestation Natural CameraIntensity yes yesExtreme Temperature Natural Temperature yes yes
Cold Wave Natural Temperature yes yesHeat Wave Natural Temperature yes yes
Chemical Contamination ManMade Chemical yes yesChemical Cloud ManMade Chemical yes yes
Radiation ManMade GeigerCounter yes yesUnder Fire ManMade CameraIntensity; Microphone yes yes
Buildings In Ruins ManMade CameraBinary yes no
7

State of the Art
• Airpressure - A sensor for air pressure, which typically displays readings in the atm unit;
• CameraBinary - A camera, which reads true or false, according to whether the disturbance
in question can be observed;
• CameraIntensity - A camera, which reads an observed disaster intensity;
• Chemical - A generic chemical sensor, which may convey readings in a specified unit;
• CO2 - A Carbon Dioxide sensor, which reads the concentration of the chemical in the air;
• ElectricField - Measures the intensity of affecting electric fields, typically in newtons per
coulomb (N/C);
• GeigerCounter - Indicates radiation intensity, measured in counts per minute (CPM);
• HumiditySensor - Measures the humidity of the air, typically indicated in grams of water
vapor per cubic meter of air;
• IRCameraIntensity - An infrared camera, which reads an observed disaster intensity;
• MagneticField - Measures the intensity of affecting electric fields, typically in Teslas (T);
• Microphone - Reads the surrounding sound intensity;
• Temperature - A thermometer, which reads given ambient temperature;
• WindSpeed - Obtains the speed of the wind.
The seriousnessDegreee indicates whether a degree of seriousness is applicable to the distur-
bance in question, and similarly the growthRate indicates whether a rate of growth is applicable
for the disturbance at hand (e.g. a "missing person" can not grow in intensity but can grow in
seriousness; however a chemical spill may increase in both intensity, i.e. how much chemical is
being spilled, and seriousness, given the region to which it may be moving).
2.1.1 Environmental Disturbance Simulators
At the initial stage of the research regarding Environmental Disturbance Simulators, the scope was
too broad, as the search was performed in order to find simulators for any type of disturbance.
Many of the encountered applications were too simplistic, e.g. taking form as children’s in-
formative games such as Hurricane Simulation1; while others were far too complex to consider,
resulting in more computationally expensive simulations, and all the intrinsic detail being of no
potential use to the DM.
Before deciding on narrowing the scope of the search (see below: Forest Fire Simulators),
three simulators stood out among the research results - these are detailed and compared in the
following paragraphs, as well as in Table 2.5.
1Available at http://scijinks.gov/hurricane-simulation/
8

State of the Art
Virtual Quake2 is a simulation program which models the fault3 system in California. Several
geological details regarding the region’s characteristics are used to simulate an earthquake. Vir-
tual Quake claims a design which allows for the fast execution of the thousands of small events
involved in the calculations. Its execution results in a detailed dataset, which may be used to study
several aspects of the simulation. The application offers the option of outputting the simulation
results in an HDF5 file4, allowing for posterior processing and analysis of the data.
F5Data5 is mainly a weather simulator and forecasting program. It simulates numerous
weather aspects, from sea surface temperatures to wind flow. Despite it’s wide array of fea-
tures, including a hurricane component, the program was not considered a strong applicant for
the planned co-simulation for its merely superficial approach to environmental disturbances, and
only offering the option to save data as an image. It is also not open-source software an does not
provide a good manual or documentation.
NERIES ELER V3.16 is perhaps the most complete of the gathered simulation programs. It
estimates the propagation of the seismic waves through the earth from a given epicenter and mag-
nitude value, offering the option of including additional geological data regarding the region at
hand to improve the accuracy of the results. The tool also computes an estimation of building and
human physical damage on the affected region. It was developed using the MATLAB7 program-
ming environment, and uses MATLAB to display the results, but also offers the option of exporting
data to popular GIS programs8. Since this tool does not export the simulation results to a common
format such as XML (Extensible Markup Language) or JSON (JavaScript Object Notation), the
mentioned GIS exporting functionality requires further investigation as to assert the feasibility of
utilizing ELER as a co-simulator on The Platform.
Table 2.5 provides a summary of the mentioned simulators, namely the respective names,
whether they are free, open-source and the perceived quality of the documentation (1 being the
lowest, including only a few code examples; 2 as the intermediate level, with better code exam-
ples or tutorial videos; and 3 as the highest quality, corresponding to a detailed and well-written
documentation).
Table 2.5: Environmental Disturbance APIs Comparison
Name Free Open-Source Documentation (1-3)
Virtual Quake Yes Yes 2F5Data Yes No 1
NERIES ELER Yes No 3
2Available at https://geodynamics.org/cig/software/vq/3A fault zone is a zone where small earth dislocations have occurred [Brodie et al., 2007]4Hierarchical Data Format 5 - a file format designed for storage of large amounts of data5Available at http://www.f5data.com/6Available at http://www.koeri.boun.edu.tr/Haberler/NERIES%20ELER%20V3.1_6_176.depmuh7Available at https://www.mathworks.com/products/matlab.html8"A geographic information system (GIS) is a computer system for capturing, storing, checking, and displaying
data related to positions on Earth’s surface. GIS can show many different kinds of data on one map, such as streets,buildings, and vegetation." [NG, 2017]
9

State of the Art
2.1.2 Forest Fire Simulators
Computer simulations of forest fires have been performed for over 40 years [Stevenson et al.,
1975]. These simulations can be highly complex, and many mathematical methods are applied in
order to perform the matching calculations, from probability spread calculations [Ivanilova, 1985]
to multiplex networks [Buscarino et al., 2015]. These types of simulations are widely used across
several entities, such as the U.S. Forest Service and the U.S. National Park Service [USDA, 2015].
Considering the wide variety of existing environmental disturbances, many corresponding
software simulators exist. It was decided on narrowing the scope of this component of the re-
search to a specific type of disturbance.
Portugal has an immense risk of forest fires [NICIF and Lourenço, 1994], mainly on account
of its geographic characteristics. As such, tens of thousands of hectares of forest burn on a yearly
basis [MAMAOT, 2015]. Taking these facts into consideration, the decision was made to focus
the research regarding environmental disaster simulators to simulators of fires - specifically forest
fires. Another advantage of the simulation of fires, is that they can be very representative of a
simulator’s capacities: from simple aspects such as higher temperatures to more complex cases
such as the spreading patterns of smoke.
FlamMap9 is program which maps and computes fire behavior, including spread rate and in-
tensity. It is developed by U.S. Forest Service, which belongs to the United State Department of
Agriculture; free to use, yet not open source. The software is not a complete fire growth simula-
tion model, focusing on calculating fire behavior characteristics for specific sets of environmental
conditions. The functional principle of the program is the creation of raster maps of the terrain,
with each pixel potentially containing certain fire behavior details and other aspects such as wind
speeds - this is performed over a FARSITE (detailed below) landscape [A. Finney, 2006]. These
raster maps can be visualised within FlamMap or exported in other formats. It does not provide
an API.
FARSITE10 is similar to FlamMap, and also developed by the U.S. Forest Service, yet focuses
on the behavior of fires throughout long time periods and across multiple terrain types; using mul-
tiple popular fire behavior models, such as Rothermel’s [Wells, 2008] surface fire spread model.
FARSITE aggregates existing models of surface fire using a vector propagation technique [Finney
and Station-Ogden, 1998]. The software is used across many institutions in the United States of
America, such as the National Park Service[USDA, 2015]. It does not provide an API.
ForeFire11 is an open-source simulation engine designed for large scale fire simulation which
takes standard landscape data as input. It includes numerous bindings for different programming
languages (such as Java and Python), as to provide easy integration in other projects. Its goal is to
provide a set of open simulation tools and a Javascript API. ForeFire is based on the propagation
speed model of Balbi et al. [Henri Balbi et al., 2009][Filippi et al., 2011].
9Available at https://www.firelab.org/project/flammap10Available at https://www.firelab.org/project/farsite11Available at http://forefire.univ-corse.fr/sim/dev
10

State of the Art
Figure 2.1: ForeFire
Capaware12 is an open-source framework which provides real-time forecasting of the evo-
lution of fires, developed in the Technological Institute of the Canary Islands. The program is
focused on data visualization, and offers a free API as to facilitate the development of new appli-
cations around it. However, the corresponding documentation appears lacking.
Wildfire Analyst13 provides real-time (i.e. one second of simulation time corresponds to one
second in what would happen in real life) simulation and analysis of the spreading of wildfire (fire
within an region of combustible vegetation). Provides a wide range of output data and a fully
featured API. Regarding the set of features, Wildfire Analyst appears to be one of the best options
encountered. However, it is not free to use.
Figure 2.2: Wildfire Analyst
Table 2.8 provides a summary of the mentioned fire simulators, namely the respective names,
whether they are free, open-source and the perceived quality of the documentation (1 being the12Available at http://www.capaware.org13Available at http://wildfireanalyst.com/
11

State of the Art
lowest, including only a few code examples; 2 as the intermediate level, with better code exam-
ples or tutorial videos; and 3 as the highest quality, corresponding to a detailed and well-written
documentation).
Table 2.6: Fire Simulators Comparison
Name Free Open-Source Provides API Documentation (1-3)
Capaware Yes Yes Yes 2Farsite Yes No No 1Forefire Yes No Yes 2
FlamMap Yes No No 1Wildfire Analyst No No Yes 3
Pondering over the considered platform, Capaware was considered the best candidate for inte-
gration with The Platform. However lacking in documentation, being the only one both free and
providing an API makes it the preferred choice. If there were the possibility of obtaining a free or
academic license for Wildfire Analyst, it would also be a good choice - not being open-source, it
could make up for it by the quality of the documentation provided.
2.1.3 Meteorology APIs
Since the recent boom of open data [Gewin, 2016], a wide array of weather-related APIs also
became freely available [Santos, 2012]. The original intent of using a co-simulator was to allow a
more lifelike representation of environmental disturbances, by providing them with more accurate
behaviours, not limited by the standardized models within The Platform. Given that the result
of the Environmental Disturbance Simulators research returned a relatively reduced number of
simulators, it was considered relevant to investigate Meteorology API’s as to use real disturbance
data instead of simulated data.
Real-life data is, by definition, more reliable than any simulation. Therefore the data from one
of the gathered APIs could be utilized to provide a specific disturbance’s behaviour and evolution,
emulating a simulator by processing and transferring the information to The Platform in real time,
as if the registered event was happening again. However this would not invalidate the need for a
simulator, given that one might wish to see the results of a specific disturbance had, for example,
the weather conditions been different. One might also wish to change other parameters of a sim-
ulation, in order to simulate disturbances like none that ever existed - i.e. with no real-life data
available on it.
Multiple APIs were found which not only provide the typical weather related information (e.g.
temperature, wind and humidity) but also have a component regarding environmental disturbances.
Most of them are free to use - however subject to daily request limits - and not open-source,
however there are some exceptions.
Given that the studied APIs are considerably similar, they have been included in Table 2.7
as to provide a simpler overview on all. The noted differentiation factor for each API was also
included.
12

State of the Art
Table 2.7: Meteorology APIs Comparison
Name Free Open-Source Documentation (1-3)Accuweathera Freeb No 3OpenWeatherMapc Freed No 3Baron Velocity Weathere Free No 2Aerisweatherf Freeg No 2USGS Earthquakeh Free No 3Dark Skyi Freej No 3Weather Undergroundk Freel No 3NOAAm Free No 3
aAccuweather’s API is available at https://apidev.accuweather.com/developersbFree to use up to the set daily/monthly request limitcThe OpenWeatherMap API is available at http://www.openweathermap.com/currentdSee footnote (b)eThe Baron Velocity Weather API is available at https://www.velocityweather.com/products/
weather-data-apifThe Aerisweather API is available at http://www.aerisweather.com/support/docs/api/gSee footnote (b)hThe United States Geological Survey Earthquake Catalog API is available at https://earthquake.usgs.
gov/fdsnws/event/1/iThe Dark Sky API is available at https://darksky.net/dev/jSee footnote (b)kThe Weather Underground API is available at https://www.wunderground.com/weather/api/lSee footnote (b)
mNational Oceanic and Atmospheric Administration’s Weather and Climate Toolkit is available at https://www.ncdc.noaa.gov/wct/
• Accuweather was found to be highly regarded, given it’s accuracy;
• OpenWeatherMap includes UV index, air pollution, and tornadoes;
• Baron Velocity Weather’s provides tornado tracking;
• Aerisweather supports thunderstorms and volcanic ash (harmful for airplanes [USGS, 2016]).
• USGS works with both real-time and archived earthquakes;
• Dark Sky supports real-time disaster warnings, which could be used to trigger disasters
in-simulation. However only includes a superficial disaster component;
• Weather Underground supports real-time disaster warnings, which could be used to trigger
disasters in-simulation. Provides movement data of active hurricanes;
• NOAA allows for the exporting of data in a wide array of data formats. Supports thunder-
storms, tornadoes and blizzards.
After considering all the mentioned Meteorology APIs, Weather Underground’s API was
deemed the best option therein - being free to use, providing thorough documentation and sup-
porting real-time disaster warnings. Ergo, the API should be a good contender to simulate the role
of co-simulator.
13

State of the Art
2.1.4 Disturbance Representation in FSX
Given the popularity of the flight simulator, a wide community was formed around it. With thou-
sands of active members, many tools and add-ons were created for the game.
While not the focus of the dissertation at hand, having some kind of in-game representation of
the disturbances would be an interesting and visually appealing addition to the project. Multiple
tools which enable the representation of various weather effects in the game were studied as to
find an acceptable way of achieving the in-game representation of environmental disturbances.
Besides the potential in achieving a visually appealing solution, it could also become possible
to have the vehicles obtain specific readings from the simulator itself - thereby reducing the need
for processing and information transferring from outside FSX.
2.1.4.1 Mission Creation
The SDK (Source Development Kit) for Flight Simulator X includes a Mission Creation compo-
nent [Microsoft, 2008a]. By creating missions, through the editing of XML files or via a graphical
interface, one can set up various activities for the player - which can be associated via triggers to
in-game visual effects, e.g. smoke or fire, which could be used for the desired purpose.
However versatile in the possibilities for in-game disturbance representation, FSX’s missions
pose a great disadvantage: they require compiling and posterior loading at the start of the simula-
tion; this does not agree with the objective of deploying disturbances mid-simulation. Thereby, the
Mission Creator was set aside. However, as an alternative, the Mission Creator could be utilized
by having the missions created and compiled at the start of the simulation. This would provide
the desired results, with the restriction of the creation of the disturbances only at the start of the
simulation.
2.1.4.2 Special Effects Tool
FSX’s SDK also includes a Special Effects Tool [Microsoft, 2008c]. The major advantage of the
tool in the context of representing disturbances on-screen would be that it allows for a special effect
(e.g. fire) to have specific movements and dispersion patterns, as is expected of the DM. However,
the special effects can also only be used through generating the file, compiling and loading it
before the simulation starts. This is a restriction of the game’s core engine, therefore unavoidable;
as such, the Special Effects Tool was also put aside. As with the Mission Creation, one could
circumvent this limitation by specifying the disturbances, generating the matching Special Effects
files and compiling them before the start of the simulation.
2.1.4.3 SimConnect
SimConnect [Microsoft, 2008b] is the core of FSX’s SDK, allowing several types of information
exchange between the Simulator and external programs. While not offering many options regard-
ing visual effects, SimConnect’s foremost advantage is the fact that ir runs in real-time during the
14

State of the Art
simulation.
SimConnect’s features were studied with focus on finding a way to make use of it as to show
an in-game indication of environmental disturbances. Through combining its ability of loading
aircraft models and the possibility of activating specific events within the aircraft (e.g. turning on
lights or retracting/expanding landing gear) the researcher arrived upon the possibility of deploy-
ing an airplane at the center of the disturbances, as to later enable their smoke emission engine -
signaling, for example, a fire at the same location. Considering that the deployed airplane itself
was just a means to achieving the possibility of showing smoke, and as to not add unnecessary
visual elements to the simulation, the aircraft chosen to show the smoke can be made invisible
through the editing of aircraft configuration files. Later, it was discovered that the aircraft’s emis-
sion can be changed from smoke to a different effect such as water, fire, or even fireworks, which
allows for a more diverse in-game visual representation of disturbances.
The mentioned limitation of SimConnect was surpassed in SimConnect Version 4 for Lock-
heed Martin’s Prepar3D simulation software [Martin, 2017], which allows the creation of Special
Effects in runtime. The latest SimConnect is unfortunately not available for FSX.
2.1.4.4 Weather Engines
In the context of FSX, weather engines focus on enhancing in-game weather effects: most com-
monly through not only enhancing the visual fidelity of clouds and other aspects, but also by
changing the in-game weather to match what is happening in real-life. In the search for maximum
in-game visual fidelity, many weather engines were developed for the game by various parties.
Through research, many appeared interesting and potentially useful for the project.
Amongst all the encountered weather engines, the following were the most noteworthy on
account of their feature sets
• FSXWX14
• FSrealWX15
• AS1616
• OpusFSI17
• Weather Architect18
All of which, being weather engines, are focused on injecting weather into the simulation: not
only with more accurate behaviour than default (as in matching real-world weather in terms of
real-time updates and location), but also - and above all - looking more lifelike. Unfortunately,
14Available at http://www.plane-pics.de/fsxwx/home.htm15Available at http://www.fsrealwx.net/16Available at http://hifisimtech.com/as16/17Available at http://www.opussoftware.co.uk/opusfsi.htm18Available at http://www.rexsimulations.com/weatherarchitect.html
15
State of the Art
only AS16 provides an API, and even that does not allow for the injection of weather occurrences
in real time onto the simulation. Besides, all these weather engines rely on stopping the simulation
for a significant amount of time as to process all the data at hand. It was during this research that
game engine’s limitation mentioned in the Special Effects section above was discovered.
2.2 Architectures with Co-Simulators - HLA
In order to achieve a better understanding of what is typically involved in and required for an
architecture with a co-simulator, it was decided to research the HLA architecture.
The High Level Architecture (HLA) is an IEEE standard [IEE, 2010] to specify distributed
computer simulation systems. Unfortunately, the official IEEE document was not freely available
at the time of research, so alternate documents [Reid and Powers, 2000][Dahmann et al., 1998]
were utilized in order to comprehend the HLA.
One of the core purposes of the HLA is "the continuous reuse and interoperation of simu-
lations" [Dahmann et al., 1998]. The main advantage of using an HLA is that one can "reduce
software costs by facilitating the reuse of simulation components and by providing a runtime in-
frastructure to manage the simulations." [Reid and Powers, 2000] In summary, the Architecture
allows the user to save resources by managing the simulations through a specific infrastructure -
which allows for the communication and synchronization of actions between different simulations.
HLA has a specific terminology:
• A Federate is an HLA-compliant simulation entity;
• A Federation is a set of connected simulations;
• An Object is a set of data transferred between simulations. Conceptually, an Object is an
entity being modeled by the simulation;
• An Interaction is a message that any Federate within the execution can transfer or receive;
• The Runtime Infrastructure is the simulation itself, i.e. the core software;
• An Object Model Template is what defines the format for the data being transferred during
the simulations.
HLA’s rules describe how the Federates and Federations act, and has the goal of allowing
simulation applications to be structured as a set of smaller simulations - which allows for the
re-utilization of specific "sub-simulation" results, therefore saving resources.
2.3 Summary/Conclusions
Regarding the Disaster Simulators and the meteorology API, it is considered that the acquired
information will be of great value to the development of the intended solution. With a wide array
16

State of the Art
of options, there are many fail-safe alternatives - in case one or more of the mentioned tools
somehow does not work as expected during the implementation stage.
Regarding the in-game representation of the disturbances, along with the decided focus on
simulating forest fires, the three listed options were analyzed as to elect the best option for the
implementation, weighing their pros and cons. It was decided to use the SimConnect approach
- by combining the smoke (or other effects) emission from an invisible airplane spawned at the
center of the disturbances. This provides a simple and time-effective way of achieving the desired
result of a visual representation in FSX.
On the subject of fire simulators and meteorology APIs, many interesting options were ana-
lyzed, with Capaware and Weather Underground’s API being regarded as the prime candidates for
integration in The Platform.
As to the HLA architecture, it proved to be an interesting approach to the structuring and orga-
nization of simulation systems, and will be taken into consideration throughout the development
of the solution and its integration into The Platform.
17

State of the Art
18

Chapter 3
Planning & Methodology
This chapter introduces the preliminary decisions related to all the planning, practical and research
work at hand. First, each of the main work stages is elaborated upon; second, the risk management
is detailed; third, the planned methodology is briefly explained; and finally, the technological
choices related to the implementation are described.
3.1 Work Plan
The following section of the document includes the summary of the work plan elaborated in order
to specify all the time and task management regarding the project at hand. Each of the stages on
the plan is also included in the Gantt Diagram on Fig. 3.1 - which includes the start and end dates
for each stage.
Figure 3.1: Work Plan Gantt Diagram
1. Familiarization with the existing platform - the goal of this task is to become acquainted with
The Platform. This involves the necessary setup, running it, performing some experiments
19

Planning & Methodology
and analyzing the existing code. Since the Platform is of a considerable dimension, this
phase is essential to the start of the project
2. Research
(a) Which types of environmental disturbances should be included? At this stage, a list
should be created to provide a summary of all the disturbances to be simulated. As well
as a list of the main sensors necessary to acquire readings related to the disturbances
at hand;
(b) What types of readings would they generate on an approximating vehicle? Follow-
ing the previously mentioned lists, each disturbance should be assigned at least one
reading - to be generated on a specific sensor;
(c) State of the art: Environmental Disturbance Simulators. At this point, the most rel-
evant, potentially useful, and most modern simulators of environmental disturbances
should be researched and catalogued, specifically to help make the decision of the
external co-simulator which should become an optional element of the Platform;
(d) State of the art: Architectures with Co-Simulators. Software architectures incorporat-
ing co-simulators should be analyzed as to acquire the knowledge necessary for the
development of the project: it will allow for the researcher to become familiarized
with the industry standards; to know the existing alternatives; and to avoid building an
architecture from the start when existing and proven architectures exist - which can be
considered as good examples.
3. Design and specification of solution
(a) Schema definition for the disturbances. Based upon the information gathered on the
types of disturbances and related readings, the Platform’s existing XML Schema for
disturbances should be altered as to allow for the inclusion of the required elements
not previously specified.
4. Implementation
(a) Directly on The Platform - the first stage of implementation is related to the starting of
the DM itself. After the updating of the aforementioned schemas, the related C# class
files should be updated as to allow for the correct reading and saving of XML files,
as well as their de-serialization into Objects. The DM should be launched through the
Control Panel and handle the loaded disturbances by managing their location, deploy-
ment, evolution, and most importantly sending the sensor readings to the vehicles;
(b) Communication with the Vehicle Agents - as mentioned before, the DM will commu-
nicate with the vehicles to provide them with sensor reading information. As a means
to achieve this communication, AgentService (introduced in 3.5.3) will be used. A
message structure should be specified; the messages should be generated, sent, re-
ceived and processed by each agent - which save a log file with the received readings;
20

Planning & Methodology
(c) Using the optional co-simulator - the interface between the DM and an external dis-
turbance simulator should be developed as to allow the DM to process specific distur-
bances more accurately by gathering instructions on their behavior (i.e. intensity and
dispersion patterns, among other aspects) from the external simulator. The interface
should be sufficiently generic as to allow for easy adaptation of any simulator which
provides an API;
(d) System testing and optimization - this stage, which occurs after the development itself,
concerns the optimization and testing of the developed components. A set of tests
should be specified and performed on The Platform, with the results being registered
and analyzed. Throughout this stage, if any functionality of the software is found to
be excessively slow, it should be altered as to maximize performance.
5. Writing
(a) Thesis - the thesis, despite being the final aspect of the work to be delivered, should
be advanced throughout the entire work period. This allows for an iterative approach,
with feedback from the supervisor and constant updating;
(b) Scientific Article - by the end of the work period, a scientific article is to be written,
summarizing the performed work and achieved results, with the goal of being submit-
ted and later presented on a conference.
This section, along with Fig. 3.1, provides information on the work plan which was devel-
oped at the start of the dissertation planing stage. Before mentioning the risk management aspects
regarding the project, the actual - as was completed - work schedule is included in the next sub-
section.
3.2 Final Work Overview
In this section, all the points of the work plan will be scanned, providing details on how the
performed tasks matched the work schedule; as well as mentioning the related Risk Management
items.
1. Familiarization with the existing platform - This stage of the work plan was executed
as expected, with no significant difficulties other than fully grasping the intricacies of each
of the architecture’s components. Being a considerably large project, some difficulty was
expected; however, with the aid of the supervisor in clarifying some of the components’
functionalities, the familiarization was performed successfully. As a result, the first potential
risk (i.e. the first entry in the Risk Management subsection below) was successfully avoided.
2. Research
(a) Which types of environmental disturbances should be included and what typesof readings would they generate on an approximating vehicle? - As mentioned
21

Planning & Methodology
in section 2.1, through research and common knowledge, four lists of disturbances
were created for the following categories: Land, Storm and General. Work went as
expected, and while gathering each disturbance type, the corresponding possible origin
(Natural or Man-Made) was specified, as well as the matching vehicle sensor types.
Lastly, for each of the listed disturbances, it was decided whether they should have
an associated seriousnessDegree and a growthRate - for example, it is obvious that a
forest fire should have a specific growth rate, while it does not make sense to have a
growth rate for a lost person (the person is either lost or not lost, it’s not considered
that someone could become somehow "more" lost). This work stage took the expected
amount of time, and was performed without difficulties.
(b) State of the art: Environmental Disturbance Simulators - As described in Chapter
2, at first, the spectrum of the research was excessively wide. This resulted in a fair
amount of time being spent on researching simulators for various types of disturbances
before the scope was narrowed to fire simulators. The possibility for this delay was
considered in the second item of the Risk Management subsection - as planned, the
work schedule was appropriately restructured and advice was taken from the supervi-
sor.
(c) State of the art: Additional Work - While not considered in the original work plan,
as it was considered an interesting addition to the project, several options to obtain
in-game representation of the disturbances’ effects were analyzed (subsection 2.1.4).
Given the vast amount of options encountered, a significant amount of time was allo-
cated to this task. This relates to the third entry in the Risk Management section - the
unveiling of unexpected tasks, and was handled accordingly.
(d) State of the art: Architectures with Co-Simulators - This section of the research
was completed without delays. The supervisor suggested the research of the HLA,
which was investigated.
3. Design and specification of solution
(a) Schema definition for the disturbances - This stage was performed in a small amount
of time; however the initial specification was not final, as a few additions were per-
formed during the DM implementation stage, when it became apparent that they were
necessary. Therefore this stage of the project was performed somewhat iteratively,
throughout more time than what was initially expected, however did not exceed the
planned time.
4. Implementation
(a) Directly on The Platform - As planned, this was the most prolonged stage of the entire
project. Due to multiple unexpected obstacles amid the development, the mitigation
strategy for the second risk management item was utilized - thereby re-allocating the
available work time and taking advice from the supervisor.
22

Planning & Methodology
(b) Communication with the Vehicle Agents - Considering that other components of The
Platform (i.e. the ATC agent) perform comparable message exchanges with Vehicle
Agents, a significant amount of the existing code could be taken as an example; as
such, by performing a few alterations and additions, the communication between the
DM and the Vehicle Agents was achieved.
(c) System testing and optimization.
5. Writing
(a) Thesis - The dissertation should be written iteratively from the start. This should allow
for an iterative approach, adding content as the implementation are completed.
(b) Scientific Article - The planned scientific article is currently being developed, and
will be completed as to be sumitted in a relevant conference.
Considering the risk mitigation strategies, namely the allocation of additional time to the tasks
above, a fair amount of available work time was reduced. Therefore, it was decided to exclude the
optional co-simulator from the development plan. While not the least meaningful element of the
project (which would be the visual representation of the disturbances), it was a stage which could
be removed without affecting the work performed thus far.
3.3 Risk Management
The following represent the most significant risks regarding the project at hand, as well as the
corresponding risk mitigation strategies.
• Risk 1: failure to grasp the scope of the Platform. Mitigation: early and frequent meetings
with the supervisor to clear any existing questions; allocation of sufficient time to explore
the Platform and read about it.
• Risk 2: one or more of the implementation stages sustaining significant delay, or simply
taking longer than planned. Mitigation: re-structuring of the work plan; allocating more
time to the task at hand; taking advice from the supervisor.
• Risk 3: the necessity to perform unexpected tasks. Mitigation: similarly to the previous
point, the re-structuring of the work plan and allocated times, as well as considering input
from the supervisor.
The listed risks have been assigned impact and probability values in Table 3.1.
3.4 Work Strategy
Throughout the development of the remaining aspects of the project, indicated in the Work Plan,
the following iterative strategy was adopted: individual work, followed by a meeting with the
Supervisor. This was repeated on a weekly basis throughout the entire development process.
23

Planning & Methodology
Table 3.1: Risk Table
Probability
Low Medium High
ImpactHigh
Medium R1 R2Low R3
3.5 Technologies and Platforms
In the following section, the main technologies related to the work at hand will be described.
Considering that the project in question fits within an existing system, the technologies mentioned
had already been established, therefore they will not be significantly compared to others.
3.5.1 The Platform
The Platform’s initial architecture is illustrated on Fig. 3.2.
Figure 3.2: The Platform’s Initial Architecture
This subsection includes a description of the platform around which the project at hand is
centered. It is developed using the C# programming language.
24
Planning & Methodology
The Platform includes a control panel, which allows for the specification of each mission; an
agent to manage traffic (Air Traffic Control, or ATC, Agent); a vehicle control agent; performance
analysis; and the basis for a disturbance management tool. The Platform enables the specification
and deployment of a wide variety of missions using multiple vehicle types on various simulations.
While still technically in prototype stage, the Platform is currently at a fairly advanced level.
The Disturbances Manager is responsible for the simulation of environmental anomalies -
which may require the intervention of vehicle teams, or have an impact on unrelated vehicular
missions; it communicates with the Platform’s Control Panel, vehicle agents, FSX, and optionally
with external disturbance-specific simulators (e.g. if one were to use an external tornado simu-
lator as to obtain a more rigorous behavior for such disaster, one could interconnect it with the
Disturbances Manager).
At its state by the start of the thesis work, the Control Panel allowed for the basic specification
of disturbances using a graphical interface. The disturbances are stored as XML files for the DM
to subsequently process; this specification is to be further developed, as to encompass the details of
all the disturbances to be considered. Given that the DM is to be fully integrated into a distributed
simulation platform, similar architectures [Pereira and Rossetti, 2012][Chen et al., 2006] have
been studied and taken into consideration on how to perform said integration.
3.5.2 Programming Languages
Given that C# is the focal programming language of The Platform, with the purpose of facilitating
the integration of this dissertation’s practical work therein, C# will be used to implement all the
required DM components.
The DM’s graphical interface includes an embedded Google Maps window. Through Javascript,the disturbances’ affected areas, as well as the vehicles’ trajectories, are drawn over the map itself.
3.5.3 AgentService
AgentService 1 is a programing framework for the development of multi-agent systems. The
framework is based on the Common Language Interface2 (CLI) and C#. Provided by the Lab-
oratory of Informatics of the Department of Communication Computer and System Sciences of
the University of Genoa, the framework handles the communication between the agents on the
Platform. AgentService is FIPA(Foundation for Intelligent Physical Agents)-compliant.
3.5.4 Flight Simulator X
A Flight Simulator [Wong, 1998] is a type of virtual reality environment where the user pilots
a virtual airplane - usually matching an existing model and simulating its cockpit, dimensions
and flight behaviour. They are used for training of prospective pilots and within the context of
video-games, with varying degrees of realism.
1Available at http://www.agentservice.it/2More details at https://www.iso.org/standard/42927.html
25

Planning & Methodology
Figure 3.3: Flight Simulator X
Microsoft’s Flight Simulator X, originally released in 2006, is a flight simulation video game
for Microsoft Windows operating systems. It is the tenth version of the popular "flight sim". The
inclusion of a wide array of playable aircraft, all with a detailed, realistic and interactive cockpit;
thousands of real-world airports; weather effects; support for other (i.e. land and water) vehicles;
compatibility with varied joysticks and other controllers.
FSX is not only a popular video game and simulation platform, but also a good basis for
research projects: it provides a solid simulation platform, very complete and well documented
API and SDK, capability to simulate specific failures in the vehicles, multiple vehicle types, and
more. A screenshot of the game’s interface can be seen on Fig. 3.3.
26

Chapter 4
The Disturbance Manager
The present chapter includes a description of The Platform’s Architecture and how the DM fits
into it, and the functionalities of the Disturbances Manager. Furthermore, the additions to the
Disturbance Description language and the Teams Description Language - used to specify details
of the team such as the types of vehicles and which sensors they carry - are also expressed.
The current chapter is also used to provide details on the several facets of the DM, specifically
on its implementation process. Firstly, a high-level description on the major steps performed by
the DM, followed by the technical aspects: the core, the generation of the sensor readings for the
vehicles and communication with the remaining components of the platform.
4.1 The Platform’s Architecture
This section aims to illustrate the expansion of the initial system architecture by the addition
of the components necessary to the successful implementation of the project at hand. Namely
the aforementioned optional and external co-simulator, to be used by someone who wishes to
use an external disturbances manager as a way to achieve a more accurate representation of the
disturbance in question.
In order to facilitate an approach which allows for compatibility with as many as possible
possible external, an interface will be developed. The technical details have not been decided,
however the HLA architectural specification shows great potential for this type of application - as
described in section 2.2. Fig. 4.1 illustrates the expected final architecture for The Platform.
In Fig. 4.1, the External Disturbance Simulator is illustrated, being part of the planned archi-
tecture. Several options regarding external simulators were studied in Environmental Disturbance
Simulators, however, due to reasons detailed on Final Work Overview, this element was not im-
plemented.
27

The Disturbance Manager
Figure 4.1: The Platform’s New Architecture
4.2 The Disturbances Manager
The internal structure of the Disturbances Manager is illustrated in Fig. 4.2. The Platform Com-
munication section (in section 4.9) encompasses the modules responsible for the communication
with the other components of The Platform, namely the SimConnect Module (communication with
FSX; see subsection 4.9.1) and the AgentService Module (used to communicate with the Vehicle
Agents; see subsection 4.9.2). The Core (see section 4.7) components are the DistrubancesMan-
ager class, which contains the configuration data transferred from the Control Panel (see section
4.9.3) and the DeployedDisturbance class, which refers to a Disturbance that is being simulated -
containing data not only on the disturbance at hand but also on its evolution.
The main function of the Disturbances Manager is to simulate each disturbance selected by
the user of The Platform. The simulation consists on several aspects, including managing the area
being affected by the disturbance and communicating the sensor readings to each vehicle (through
the corresponding Vehicle Agent); computing the evolution of the disturbance through both time -
it may be constant, or evolve as specified by a given function (e.g. exponential, linear, logarithmic)
- and space, since it may also increase in size and move through the map. The Disturbances
Manager is launched through The Platform’s Control Panel, as illustrated in Fig. 4.9, on which the
specification of the several aspects for the disturbances are selected by the user, before the actual
simulation or deployment occurs. At the time of the instantiating of the DM, it receives input data
28

The Disturbance Manager
Figure 4.2: The Disturbance Manager’s Internal Structure
from the Control Panel - as illustrated in Fig. 4.1 and detailed on subsection 4.9.3.
4.3 Disturbance Description Language (DDL)
The DDL is used to specify disturbances, including their descriptions, areas of effect, type of
evolution, and more. An XSD (XML Schema Definition) file formally describes the DDL, which
had already been [Silva et al., 2016] prior to the start of the project in progress, however some
additions were made as to achieve the planned solution.
The seriousness value is an optional integer, ranging from 0 to 5, indicating the degree of
severity of the disturbance in question. The origin value is a string which carries one of three
possible values: Natural, ManMade and Any - relating to the possible origins of the disturbance
being specified. For example, an oil spill is an occurrence inherently related to human activities,
therefore ManMade; while a forest fire may also have (albeit less frequently) a natural origin,
therefore Any.
The additions to the pre-existing DDL schema are highlighted on Fig. 4.3 (for clarity reasons
and size constraints, not all branches of the diagram have been fully expanded) and the following
enumeraton includes a short description for each field.
1. disturbanceTypeGroup/disturbanceType - This field is used to indicate the type of the dis-
turbance, among those indicated in the tables on 2.1;
2. distOriginGroup/seriousness - This field is used to specify the Seriousness Degree of each
disturbance, as seen in section 2.1;
3. distOriginGroup/origin - As with the previous entry, this correlates to the origin of the
disturbances, indicated in Disturbances - Environmental and Beyond;
4. generatedReading/type - The type of the generated sensor reading at hand, e.g. a floating
point number;
5. generatedReading/startValue - The starting value of the emmitted sensor readings;
29

The Disturbance Manager
6. generatedReading/minLimitValue - The minimum limit value for the generated readings,
even if the growth function returns a lower value;
7. generatedReading/maxLimitValue - Analogous to the previous entry, however refers to the
maximum limit;
8. growthFunctionGroup_optional/growthFunction - along with functionVariable, this optional
field is used to specify the growth function followed by a specific disturbance component.
It is optional because a constant component does not have an associated growth.
An example DDL XML file is included in Appendix A.
Regarding the sensors illustrated on Chapter 2 (Tables 2.1, 2.2, 2.3 and 2.4), the original (i.e.
existing before the start of the project at hand) common.xsd schema included a few sensors -
however more were introduced as to cover all of them. The additions to the XSD file are included
in XSD Additions.
4.4 Teams Description Language (TDL)
The TDL indicates information about a vehicle team on the platform: which vehicles it contains,
restrictions such as no-fly areas, among other details. An XSD file formally describes the TDL,
which - as with the DDL - had already been specified [Silva et al., 2017] prior to the start of the
project in progress, however some additions were made as to achieve the planned solution - adding
details to the sensors on the team’s vehicles.
The fields added to the TDL are the following:
1. sensorReadingType/type - Refers to the type of reading generated by the sensor at hand. E.g.
a CO2 sensor will generate numeric readings;
2. sensorReadingType/unit - Refers to the unit of the generated readings. For example a CO2
sensor may generate grams/m3 readings.
These additions to the previously-existing TDL schema are highlighted on Fig. 4.4 (for clarity
reasons and size constraints, the remainder of diagram is not shown). An excerpt of an XML TDL
file is included in Appendix B.
4.5 Disturbance Database
Besides the tables in chapter 2, it was decided to portray the same information in a more "machine-
friendly" manner, therefore two small XML databases were created: one for the disturbances and
one for the sensors. The main purpose being the posterior auto-completion of the Control Panel’s
GUI (Graphical User Interface) - once someone selects a specific disturbance name from the menu,
the remainder of the specification (i.e. origin, sensorType, seriousnessDegree and growthRate)
30
The Disturbance Manager
should be automatically filled with the corresponding values. This way, the user will have the
freedom to change the preset values, but won’t be affected by the inconvenience of manually
setting every aspect of the disturbance to be deployed. The mentioned databases are included in
XML Databases.
4.6 High-Level Description
What follows is an enumeration of the main steps needed to use the DM and performed by it.
The section is meant to be understandable by someone with no Computer Engineering knowledge,
therefore technical terms are purposefully avoided and simpler vocabulary is put to use.
1. The user launches Flight Simulator X and The Platform;
2. The user utilizes the Control Panel of The Platform to define a specific disturbance (for
example a fire): where it starts, how large it is and how it grows;
3. The Control Panel checks if all the data was introduced with no errors;
4. The Control Panel saves that information and launches the Disturbances Manager, transmit-
ting to it the information regarding the fire;
5. The Disturbances Manager opens a window which shows the map and all the active vehicles
(both on the map and on a table);
6. The Disturbance Manager "informs" the vehicles within the areas affected by the distur-
bance of the sensor readings they are receiving (Carbon Dioxide and Temperature, for ex-
ample);
7. The vehicles receive the information and save it on a text file.
4.7 Core
When launched, the DM performs the following key actions:
• A series of initializations, both regarding the GUI elements, the embedded Google Maps
window and the connection data required to connect to FSX through SimConnect and to
AgentService;
• Loads the disturbances file transferred by the Control Panel and validates it against the
corresponding XSD schema;
• Loads the active team configuration file, in order to load the vehicles therein to the GUI and
reads each of their sensors in order to later create the column headers on the table identified
with (H) on Fig. 4.5;
31

The Disturbance Manager
• Dynamically creates the table identified with (H) in Fig. 4.5: a column for the vehicle name;
another for indicating whether it’s active (a vehicle may be on the team but not deployed);
the "Affected?" column - which indicates whether a vehicle is under the influence of at least
one disturbance; and finally one column for each of the sensors at hand: the ones mentioned
in the active team configuration file, as mentioned above, and those listed in the affected
sensor types for each of the loaded disturbances’ components;
• The disturbances and their components are loaded onto table (C) in Fig. 4.5;
• Through SimConnect, an invisible smoke-emitting airplane is spawned in-game at the center
of each of the affected areas by the deployed disturbances. The reasoning for this step is
justified in the conclusion of chapter 2, and the details of the matching implementation can
be read below, on subsection 4.9.1;
• Each time the active vehicle data (table (I)) is updated from FSX through SimConnect (de-
tails on 4.9.1)
– Table (I) is updated with details on the vehicles active in the simulation (mainly lati-
tude, longitude, altitude, heading and speed);
– The new vehicles’ positions are matched against the areas covered by the disturbances’
components (illustrated as the rectangle and the circle in Fig. 4.5-(F)): if the vehicles
are in the affected area, the Affected? value is updated accordingly (Fig. 4.5-(H))
and the sensor reading messages are sent to the vehicles (more details in the sections
below);
– The active vehicle’s position is updated on the Google Maps window (Fig. 4.5 - (F))
by drawing its trajectory as a red line on the map.
4.7.1 GUI
The DM’s GUI was built iteratively, with its components being added throughout the development
of its features. Illustrated in Fig. 4.5, it is composed of several components listed below.
The DM is launched through the Control Panel; after that, the user should click to connect (if in
test mode, otherwise the connection is performed automatically) to FSX through SimConnect and
to AgentService. Then, the loaded Disturbances are deployed, either automatically or by pressing
the Deploy button (test mode).
(A) AgentService Connection - Includes text fields which indicate the details for the connection
with AgentService. The fields are auto-filled with the data which the Control Panel obtains
from The Platform’s data on Windows’ registry, if available. The connection is performed
after the user clicks on the Connect button;
32

The Disturbance Manager
(B) SimConnect Connection - Utilized for the specification of the IP (Internet Protocol) ad-
dress of the machine running FSX to which the connection is intended and buttons to con-
nect and disconnect from it. As with the AgentService region, the default IP address is
loaded from a Windows registry key;
(C) Active Disturbance Table - Indicates the designation of the active disturbances, as well
as that of each of their components. Also shows the vehicle sensors affected by the listed
components;
(D) Center on Disturbances Button - This button centers the Google Maps window (F) on the
center of the disturbance being simulated;
(E) Deploy Button - Used only in test mode, activates the disturbance loaded from the Control
Panel to the DM, initiating the simulation. While not in test mode, the disturbances run
automatically;
(F) Google Maps Window - This region of the UI contains an embedded Google Maps page,
on which several overlays are created: geometric shapes regarding the affected areas of the
disturbances (such as the blue circle and rectangle in Fig. 4.5) and red lines for the trajectory
of the vehicles;
(G) Sensor Readings Message Log - This region encloses a log of all the sensor readings sent
through AgentService throughout the simulation. Each entry includes the identifier for the
receiving agent, the message structure, the sensorid (identifying the affected sensor) and the
reading value;
(H) Team Vehicle Sensor Table - This table is dynamically generated, which means that instead
of having fixed columns with set names, the columns are generated on runtime (the process
is described in section 4.7). Includes an identifier for each vehicle in the team, a Yes or No
value on wether it is deployed in the current simulation, and the latest sensor readings for
each of the available sensors;
(I) Active Vehicle Table - The final table includes the data obtained from FSX through Sim-
Connect (see subsection 4.9.1), namely the vehicle’s name, model, ID and several other
details, such as position and speed.
4.7.2 Space and Time Evolution of a Disturbance
On the disturbances’ XML files, the growth functions are specified along with a startValue, a min-
LimitValue and maxLimitValue, and a growthFunction. In order to demonstrate how the evolution
processing is handled, the linear type of growthFunction with a specific coefficient will be used
as an example. At each time the update occurs, the following operation is performed for each
component of the active disturbances:
33

The Disturbance Manager
currentValue = startValue+ coe f f icient ∗ (stopwatch.ElapsedMilliseconds/timeScale)
i f (currentValue < minLimitValue)currentValue = minLimitValue
i f (currentValue > maxLimitValue)currentValue = maxLimitValue
The indicated operations allow for the evolution of the disturbance reading emission values
through the linear function with the specified coefficient, within the range delimited by the min-
LimitValue and maxLimitValue values.
4.8 Vehicle Sensor Readings
The sensor readings, which are sent to the corresponding vehicle agents through AgentService
(subsection 4.9.2 for details on the transmission of the message), are calculated through the fol-
lowing formulae:
reading = EmmitedReading∗ (1− distanceFromCenterO f DisturbanceMaxDistanceFromCenterO f Disturbance
) (4.1)
transmittedReading =
minLimitValue, if reading < minLimitValue
maxLimitValue, if reading > maxLimitValue(4.2)
On the first formula, the fraction generates a linear decrease in the reading value, as the dis-
tance from the center of the disturbance increases. Which means that if such distance is null, then
the reading value will be the same as EmmitedReading; when the distanceFromCenterOfDistur-
bance is at its maximum value, the fraction will equate to 1, as such the EmmitedReading value
will be null.
Each disturbance’s component, on the disturbances XML file, includes a startValue, minLim-
itValue, maxLimitValue, growthFunction and one or more coefficients.
EmmitedReading matches the reading which is emmited at the center of the disturbance, where
the vehicles receive the highest readings. When the vehicles get farther from the center, the read-
ings they receive are lower.
DistanceFromCenterOfDisturbance refers to the distance from the vehicle to the center of the
disturbance’s component which affects it. MaxDistanceFromCenterOfDisturbance is the maxi-
mum possible distance from a vehicle to the center of the disturbance: if the shape is circular,
the value will be the radius; in case of a rectangular region, the value will be half of its diagonal
length.
The mentioned reading values are sent to each Vehicle Agent that possesses the corresponding
sensor and is contained in the affected area. The Vehicle Agents generate a log, which includes the
time when the simulation started, and the received messages in CSV (Comma Separated Values)
format.
The interaction regarding the dispatching of the sensor readings is illustrated through the Se-
quence Diagram in Fig. 4.6.
34

The Disturbance Manager
4.9 Communication with The Platform
The present section includes the details on the communication between the DM and other com-
ponents of The Platform, namely FSX through SimConnect and the Vehicle Agents through
AgentService.
4.9.1 FSX - SimConnect
The DM connects with FSX through SimConnect with two purposes:
• Acquiring information regarding which vehicles are currently deployed;
• Deploying the invisible airplane in the center of the disturbance-affected areas, as to show
smoke or other effects which are emitted from the aircraft.
Since other Platform components, such as the ATC Agent, already connected to FSX through
SimConnect, the corresponding code was adapted to perform the DM’s connection - thereby saving
a significant amount of time. A sample project provided in FSX’s SDK to obtain details on the
position and speed of aircraft also proved useful for the task at hand.
4.9.2 AgentService
The DM connects to the AgentService with the objective of sending sensor readings to the de-
ployed Vehicle Agents. As with SimConnect, the ATC Agent also performs an equivalent con-
nection. Thereby the corresponding code was adapted to perform the DM’s connection to the
AgentService.
After both connections are complete (SimConnect and AgentService), the obtained informa-
tion is cross-referenced as to match SimConnect data with AgentService data. This allows for the
adding of the AgentService identifier and the SimConnect identifier to the internal data structure
used to enclose the vehicle data, such as position and speed.
4.9.3 Control Panel
As the user defines a disturbance through the Disturbance Configuration tab on the Control Panel,
or loads one from an XML file to the GUI, and clicks "Launch", the Control Panel does as follows:
1. Saves the Disturbance specified in the GUI, validating it in the process;
2. Attaches the path to the saved Disturbance (XML) file to an Application Configuration
(AppConfig) structure;
3. Attaches to the same AppConfig file the information required for the DM to use the AgentSer-
vice, i.e. User Name and Password;
4. Launches the DM agent with the complete AppConfig file as a parameter.
35

The Disturbance Manager
4.10 Summary / Conclusions
This chapter detailed the performed development as to achieve a functional Disturbances Manager.
A high-level description of the component was presented; followed by the core functions of the
DM; the GUI; the processing of space and time evolutions of disturbances; the generation of the
sensor readings for the vehicles; the communication with the FSX, AgentService, Control Panel
and the Vehicle Agents.
Several aspects were considered throughout the development, from the code to the user inter-
face. These include the usage of relevant comments detailing each function, explicit function and
argument names, consistent indentation and appropriate partitioning of code in several files. This
should provide future users of The Platform with the means of easily understanding the internal
functionality of the DM, as well as the capacity to add features and integrate the DM into future
projects.
Overall, the development stage of the Disturbances Manager is considered successful, and was
conducted according to the work plan.
36

The Disturbance Manager
Figure 4.3: DDL Schema Diagram
37

The Disturbance Manager
Figure 4.4: TDL Schema Diagram
Figure 4.5: The DM’s GUI
38

The Disturbance Manager
Figure 4.6: Sensor Readings Sequence Diagram
Figure 4.7: Distance to Center of Disturbance (retrieved from [Silva, 2011])
Figure 4.8: The DM’s Data Flow (adapted from [Silva, 2011])
39

The Disturbance Manager
Figure 4.9: Control Panel (GUI)
40

Chapter 5
Testing & Results
The chapter at hand includes information about the creation and performance of the tests developed
around the DM and AgentService.
In order to validate the work developed, it is essential to develop a way to test and evaluate its
performance. With that objective in mind, the following tests were specified:
1. Core test - the following compose the primary validation for the DM’s functionalities. The
objective is to verify that all the components are working as intended. Therefore, the fol-
lowing tests will be performed:
(a) Vehicle Position & Sensor Readings - the most significant test of the DM, meant to
verify whether the DM correctly detects if the vehicles are within areas affected by
components of disturbances, and if the sensor readings are sent to the corresponding
vehicles;
(b) Higher Readings in The Center - all disturbance components have a center where the
intensity for sensor readings is meant to be higher. This test aims to certify if the
sensor readings sent to the Vehicle Agents match this aspect;
(c) Readings Time Evolution - generated sensor readings for the components of distur-
bances may have an evolution function (linear, polynomial, exponential, etc.). This
test’s goal is to demonstrate, via matching the sensor readings sent to vehicles, that the
mentioned evolution occurs as specified;
(d) Disturbance Components Space Evolution - the components of disturbances can be
static or have specific spacial evolutions. This test aims to corroborate this evolution.
2. AgentService Stress Test - the objective for this test is to find how much of a potential
bottleneck AgentService poses to the DM’s performance, in terms of messages per agent
per second.
41

Testing & Results
3. AgentService Endurance Test - after the conclusion of the AgentService Frequency Stress
Test and finding the maximum message rate for AgentService, another test will be run - to
find the maximum message rate that AgentService can reliably maintain over an indefinite
amount of time.
For all the performed tests, only aircraft vehicles were deployed because these are the focus of
The Platform and allow for higher speeds - therefore quicker tests.
5.1 Core Test
5.1.1 Vehicle Position & Sensor Readings
The test at hand, despite being the most significant for the DM, is very straight-forward. In order to
validate whether the DM is correctly checking the vehicles’ positions, and thereby sending sensor
readings to vehicles within affected regions, the following steps will be performed:
1. A randomly-placed disturbance is deployed;
2. The vehicle is initially placed outside the area affected by a specific disturbance;
3. An instruction is given to the vehicle, in order for it to move toward the affected area;
4. Both visually (through the Google Maps window on the DM’s GUI) and manually (through
the debug information on the console, checking the coordinates of the vehicle), the point
after which the vehicle should start to receive sensor readings can be verified;
5. If the vehicle starts to receive and register sensor readings on the mentioned point and stops
doing so after leaving the affected area, the test results are deemed positive.
Confirming what was expected, the vehicle started receiving sensor readings as soon as it
entered the affected area visible on the map. On Fig. 5.1, the airplane is outside the visible
affected regions (green and blue), and the sensor reading log (bottom left area of the image, see
GUI) is empty. On Fig. 5.2 the airplane just entered one of the regions, and began receiving the
matching sensor readings, as expected. The vehicle’s coordinates were also manually checked, in
order to verify whether its coordinates at the time it started receiving messages match those of the
outer region of the disturbance.
5.1.2 Higher Readings in The Center
In order to verify whether the generated sensor readings are higher in the center of the disturbance
components, the listed steps will be executed:
1. A circular component is deployed on the map;
2. The vehicle is initially placed outside the area affected by a specific disturbance;
42

Testing & Results
Figure 5.1: Vehicle Position & Sensor Readings Test - (1/2)
3. An instruction is given to the vehicle, in order for it to move through the center of the
affected area;
4. The vehicle should receive readings while in the affected region, and perform the corre-
sponding text logs;
5. After the vehicle leaves the affected region, the text logs are analyzed as to verify that the
obtained reading values for the sensor in question grow linearly up to a specific value, and
then symmetrically decrease until the vehicle stopped receiving readings. If the vehicle logs
match the expected values, this test is validated.
As expected, while outside the affected area (Fig. 5.3), the vehicle did not receive any readings
(vertical axis on the figure). Entering the disturbance’s region, the sensor readings started to be
transferred to the vehicle via AgentService - having the lowest readings at the outskirts of the
region in question, and higher its center. The vehicle logs its received readings in CSV format,
which enabled straightforward creation of the graph on Fig. 5.3 - which confirms the expected
results.
5.1.3 Readings Time Evolution
As to check whether the disturbances’ sensor readings can evolve as specified, the aftermentioned
steps are to be performed:
1. A disturbance with linear evolution and a specific coefficient is deployed;
43

Testing & Results
Figure 5.2: Vehicle Position & Sensor Readings Test - (2/2)
2. A vehicle is placed within the affected region;
3. The disturbance’s generated readings should evolve according to a linear function with the
specified coefficient and be saved accordingly by the vehicle;
4. The simulation is terminated and the vehicle logs analyzed. If the logged sensor reading
values match the previously specified function, the test’s validity is confirmed.
As to perform the test, a stopped airplane was placed within the rectangular area of effect of
a disturbance, as displayed in Fig. 5.5. The evolution of the readings for that disturbance was
specified as linear, and should have a maximum value of 100.
The received sensor readings of the airplane were converted into a graph and can be observed
in Fig. 5.6. As expected, the sensor readings received by the vehicle used in the test matched the
specified evolution function. The last three values of the graph match the maximum value of 100
reached by the disturbance; however, since the readings are lower as the vehicles increase their
distance to the center of the disturbances, the original value of 100 decreased to around 73.
5.1.4 Disturbance Components Space Evolution
As a means to confirm the spacial evolution of disturbance components, the following steps will
be performed:
1. A circular and growing disturbance is specified and deployed;
2. A static vehicle is placed outside the affected region;
44

Testing & Results
Figure 5.3: Higher Readings in The Center Test - (1/2)
3. The disturbance’s component’s growth is observed through the Google Maps window on
the DM’s GUI, along with the vehicle’s (fixed) position;
4. At the moment the circular component region reaches the vehicle, it should start receiving
sensor reading messages - this is to be verified by noticing if this starts to occur at the
expected time. If it does, and if the received readings increase according to the formulas on
section 4.8 the test is considered covered.
Initially, the disturbance was deployed nearby the placed airplane, as can be observed in Fig.
5.7. As expected, when the circular effect region grew past the airplane’s location, the readings
started to be transmitted (observable in Fig. 5.8) and increasing, since the airplane’s relative
distance to the disturbance’s center decreases.
5.2 AgentService Stress Test
The XML specification of the vehicle teams include specific definitions of the sensors for each
vehicle (as can be seen on the used Team Configuration file on B). This includes several aspects,
such as the working temperature and humidity ranges of the sensors, as well as their mass. Another
setting that would be an interesting addition to the sensors would be the frequency with which
they obtain readings. At the current stage of the DM, the sensor readings are sent to the matching
vehicles each time their positions are updated - i.e. at each time the SimConnect information is
updated. The current SimConnect refresh rate is around two times per second. Considering the
real-life characteristics of sensors, which can vary in terms of refresh rate (slower sensors will
45

Testing & Results
Figure 5.4: Higher Readings in The Center Test - (2/2)
not obtain readings as quickly as a faster sensor), it becomes relevant to take into consideration
different refresh rates.
AgentService is software responsible for the transferring of messages from the DM to the Ve-
hicle Agents (see The Disturbance Manager’s Internal Structure). As such, it represents a possible
bottleneck in terms of the message frequency. Therefore it was considered relevant to perform
tests in order to perceive what were AgentService’s limits: how many reading messages can be
sent per second, and to how many agents. As such, a small script was created in order to simulate
specific message frequencies, and find the limit. It is not only relevant to find the limit up to which
AgentService is able to run without errors, but also to find the message frequencies that cause
delays in the performance of The Platform - i.e. if the messages, meant to be processed in real-
time (simulation time) are received without significant delays. However interesting and useful to
know how many messages per second AgentService can handle in short bursts, the end-goal of the
following tests is to discover a message frequency, for specific numbers of active Vehicle Agents,
which can be processed indefinitely in an efficient manner.
The test script is run through the DM, after it connects to FSX and AgentService. The required
number of Vehicle Agents are launched through the Control Panel. The simulation variables of
the tests are as follows:
• nMinutes - the duration of the tests, in minutes
• messagesPerSecond - the message frequency, in messages per second
The resulting elements of the tests are the following:
• Effective Number of Messages/second/agent - corresponds to the number of messages being
sent per second for each agent. It can differ from the messagesPerSecond value as, with high
46

Testing & Results
Figure 5.5: Readings Time Evolution Test - (1/2)
values, AgentService will originate delays in their transferring; therefore, the messagesPer-
Second value is the desired message frequency, while the Effective Messages/second/agent
value represents the real frequency obtained in the tests, which include AgentService’s de-
lays;
• Errors - Some tests generated AgentService related errors, and were only successful after
a certain number of runs. The number of failed test runs before the achieved results for a
specific test is represented in Errors.
The developed test script is detailed in the following steps:
1. The time to wait between sending each message is calculated through the following self-
explanatory formula: secondsBetweenMessages = 1/messagesPerSecond
2. A stopwatch is started
3. A random value for the simulated sensor reading is calculated
4. A sensor reading message is sent to each of the active Vehicle Agents, containing the ran-
domly generated reading value
5. Waiting for the amount of time calculated in step 1
The script then repeats the loop of generating a random reading value, sending the message
and waiting for the number of iterations calculated through the following formula, which equates
to the total number of messages sent to each agent:
47

Testing & Results
Figure 5.6: Readings Time Evolution Test - (2/2)
nIterations = nMinutes∗60∗messagesPerSecond
Multiple test scenarios were performed, and the corresponding results are displayed in Tables
5.1, 5.2 and 5.3, where the scenarios which did not achieve a successful test run after 5+ tries were
marked with ERROR.
Analyzing the obtained results, Figs. 5.9 and 5.10 were generated, and it became apparent that
the test time was largely exceeding the expected time, especially with high message frequencies
combined with a high number of Vehicle Agents, e.g. in the Five Minute Stress Test (which should,
as the name implies, last five minutes) with 8 agents and 2 messages per second, the elapsed test
time was over five minutes. This situation represents a very significant delay, as such the present
test method should be optimized.
After some consideration, it was decided to change the way the secondsBetweenMessages
value was calculated. The current formula, calculating the inverse of the desired message fre-
quency, is only applicable if each message is handled instantly. Since this is not the case, the
effective delay will be the sum of the secondsBetweenMessages value and the delay inherent to
AgentService’s processing. As the latter can not be changed, the secondsBetweenMessages value
obviously required some adapting. As such, the following optimization was performed to the test
script, every two seconds:
1. Calculate the effective rate of messages being transferred;
2. If the value is lower than messagesPerSecond, the secondsBetweenMessages delay is re-
duced
3. Otherwise, if the value is higher, the secondsBetweenMessages delay is increased
-
48

Testing & Results
Table 5.1: AgentService One Minute Stress Tests
nAgents nMessages Messages/second Errors Time (minutes)Effective
Messages/second Effective/agent messages/second
1 600 10 0 1,003 9,974 9,9741 1200 20 0 1,012 19,759 19,7591 2400 40 1 1,157 34,569 34,5691 3600 60 1 1,208 49,673 49,6731 4800 80 1 1,759 45,493 45,4931 6000 100 0 1,410 70,933 70,9331 7200 120 0 2,098 57,193 57,1931 8400 140 2 1,529 91,540 91,5401 9600 160 3 1,630 98,150 98,1501 10800 180 1 1,854 97,067 97,0671 12000 200 2 1,875 106,662 106,6621 13200 220 1 2,184 100,750 100,7501 14400 240 1 2,437 98,493 98,4931 15600 160 1 2,457 105,819 105,8191 16800 280 2 2,669 104,901 104,9011 18000 300 2 2,930 102,398 102,3981 19200 320 0 3,247 98,564 98,5642 6000 100 0 1,096 91,228 182,4552 7200 120 1 1,305 91,935 183,8694 4800 80 0 2,859 27,981 111,9234 6000 100 1 2,766 36,152 144,6088 4200 70 0 4,372 16,009 128,0738 4800 80 1 5,683 14,077 112,620
Table 5.2: AgentService Five Minute Stress Tests
nAgents nMessages Messages/second Errors Time (minutes)Effective
Messages/second Effective/agent messages/second
1 3000 10 0 5,208 9,600 9,6001 4500 15 0 5,253 14,277 14,2771 4800 16 0 5,461 14,649 14,6491 5100 17 1 ERROR ERROR ERROR2 3000 5 0 5,201 9,613 19,2262 6000 10 ERROR ERROR ERROR ERROR4 1500 5 1 5,370 4,656 18,6224 3000 10 0 5,942 8,415 33,6608 600 2 0 5,477 1,826 14,6078 900 3 1 5,767 2,601 20,8098 1500 5 ERROR ERROR ERROR ERROR8 3000 10 ERROR ERROR ERROR ERROR
49

Testing & Results
Figure 5.7: Disturbance Components Space Evolution Test - (1/2)
This optimization allows for the dynamic adaptation of the delay introduced between mes-
sages. Since AgentService’s delays increase with the number of agents and message frequency,
the updated test script will adapt and assumingly provide better results. It should be noted that,
once the secondsBetweenMessages delay is reduced as much as it can (zero seconds), it means
that the overhead originated through AgentService is fully responsible for the occurring delays.
The optimized test process was run for each test of the previous test scenarios, in order to
compare results (listed in tables 5.4, 5.5 and 5.6).
The obtained results were highly improved, as can be seen in Tables 5.4, 5.5 and 5.6 and Figs.
5.11 and 5.12. The difference between the expected and obtained message frequencies (Fig. 5.11)
decreased significantly, generally becoming much closer to the desired null value - which occurred
Table 5.3: AgentService Ten Minute Stress Tests
nAgents nMessages Messages/second Errors Time (minutes)Effective
Messages/second Effective/agent messages/second
1 6000 10 0 10,0932183 9,90764252 9,9081 12000 20 ERROR ERROR ERROR ERROR2 6000 10 0 10,49796551 9,525655095 19,0512 12000 20 ERROR ERROR ERROR ERROR4 6000 10 0 12,05686293 8,294031365 33,1764 12000 20 ERROR ERROR ERROR ERROR8 6000 10 0 14,99001083 6,671109195 53,3698 12000 20 0 19,85166051 10,07472391 80,5988 18000 30 ERROR ERROR ERROR ERROR
50

Testing & Results
Table 5.4: AgentService One Minute Stress Tests (Optimized)
nAgents nMessages Messages/second Errors Time (minutes)Effective
Messages/second Effective/agent messages/second
1 600 10 0 0,965 10,368 10,3681 1200 20 0 1,002 19,969 19,9691 2400 40 0 1,014 39,447 39,4471 3600 60 0 1,004 59,749 59,7491 4800 80 0 1,008 79,388 79,3881 6000 100 0 1,021 97,977 97,9771 7200 120 0 1,037 115,703 115,7031 8400 140 5 ERROR ERROR ERROR1 9600 160 5 ERROR ERROR ERROR1 10800 180 5 ERROR ERROR ERROR1 12000 200 5 ERROR ERROR ERROR1 13200 220 5 ERROR ERROR ERROR1 14400 240 5 ERROR ERROR ERROR1 15600 160 5 ERROR ERROR ERROR1 16800 280 5 ERROR ERROR ERROR1 18000 300 5 ERROR ERROR ERROR1 19200 320 5 ERROR ERROR ERROR2 6000 100 1 1,059 94,435 188,8712 7200 120 0 1,170 102,576 205,1524 4800 80 0 1,441 55,506 222,0234 6000 100 0 1,768 56,577 226,3078 4200 70 0 5,400 12,964 103,7138 4800 80 0 5,822 13,741 109,929
Table 5.5: AgentService Five Minute Stress Tests (Optimized)
nAgents nMessages Messages/second Errors Time (minutes)Effective
Messages/second Effective/agent messages/second
1 3000 10 0 4,901 10,201 10,2011 4500 15 0 4,902 15,300 15,3001 4800 16 2 5,176 15,455 15,4551 5100 17 1 4,746 17,911 17,9112 3000 5 1 4,961 5,039 10,0792 6000 10 0 4,933 10,135 20,2704 1500 5 0 4,947 5,054 20,2154 3000 10 0 4,971 10,058 40,2338 600 2 0 4,943 2,023 16,1858 900 3 0 4,965 3,021 24,1708 1500 5 0 4,967 5,033 40,2668 3000 10 0 4,998 10,003 80,025
51

Testing & Results
Figure 5.8: Disturbance Components Space Evolution Test - (2/2)
for lower message frequencies, as expected on account of the smaller overhead due to a lower rate
of messages.
The information provided thus far represents the conclusion of AgentService’s stress testing.
The results were not as good as expected, since many errors occurred when trying to raise the rate
of the messages. Another negative aspect was the inconsistent occurrence of errors, since many
tests only performed successfully after a few attempts.
Table 5.6: AgentService Ten Minute Tests (Optimized)
nAgents nMessages Messages/second Errors Time (minutes)Effective
Messages/second Effective/agent messages/second
1 6000 10 0 9,700 10,309 10,3091 12000 20 0 9,412 21,250 21,2502 6000 10 0 9,822 10,181 20,3612 12000 20 1 9,736 20,541 41,0834 6000 10 0 9,921 10,079 40,3174 12000 20 0 9,814 9,814 39,2558 6000 10 0 10,074 9,926 79,4118 12000 20 0 12,869 15,541 124,3328 18000 30 0 18,134 16,544 132,350
52

Testing & Results
Figure 5.9: Difference Between Expected Message Rate and Effective Message Rate
5.3 AgentService Endurance Tests
For any number of agents (one to eight being the most typical uses of The Platform), the maximum
message rate that enables error-free performance of the DM in The Platform would be defined as
one which could be used without errors, at the first try and for an indefinite amount of time. As
so, an additional set of tests were performed in order to find said value. Considering that it should
be a single value for one to eight agents, it makes sense to perform these tests with eight agents -
which represent the highest load on AgentService. Considering the results obtained in Table 5.6,
it was decided to start the tests at 10 messages per second. The ideal frequency should not only
allow for the continuous use without errors but also not represent significant overhead in terms of
processing time, i.e. five minutes of messages should be handled in not more than five minutes.
The results of these tests are detailed in Table 5.7:
Table 5.7: AgentService Endurance Test
nAgents nMessages Messages/second Errors Time (minutes)Effective
Messages/second Effective/agent messages/second
8 18000 10 0 29,38282557 10,21004595 81,680367598 21600 12 0 30,0314826 11,98742013 95,899361058 23400 13 0 29,98079165 13,00832892 104,06663148 25200 14 0 30,43242599 13,80106861 110,40854898 27000 15 ERROR ERROR ERROR ERROR
Considering the obtained results, regarding the maximum frequency of messages to be used
on the DM with any number of airplanes, it was concluded that 10 messages per second is a
safe choice. The tests with 11 through 14 messages per second were also successful, however
considering that the test with 15 messages per second was unsuccessful, the value 10 represents a
53

Testing & Results
Figure 5.10: Time per Test
valid option with a reasonable margin of error. Besides, with 14 messages per second, the effective
rate of messages was 13.801, which is slightly lower than 14, meaning that the processing overhead
starts to become too high. As expected, the chosen value of 10 messages per second per agent,
which translates to 80 global messages per second is close to the maximum message rate obtained
in Table 5.4 for one agent, meaning that the number of agents doesn’t have significant impact over
AgentService’s maximum capability - i.e. it is roughly the same to send 10 messages to one agent
as it would be to send 1 message to ten agents. Unlike in the previous tables, the final entry was
marked with ERROR after a single failed attempt - considering that this test was meant to find
reliable message frequencies, additional test runs were not performed in order to achieve the rate
of 15 messages/second/agent.
All the AgentService tests were performed on a machine with the following specifications:
• CPU: Intel Core i5 650 @ 3.20 GHz
• RAM: 8GB Single-Channel DDR3 @ 1333 MHz
• HDD: 7200RPM Seagate SATA
• OS: Windows 7 Professional 64-bit Service Pack 1
54

Testing & Results
Figure 5.11: Difference Between Expected Message Rate and Effective Message Rate
Figure 5.12: Time per Test
55

Testing & Results
56

Chapter 6
Conclusions & Future Work
The chapter at hand includes a summary of the results and conclusions achieved throughout the
development of this thesis, as well as the importance of the produced work, limitations of the DM
and possibilities for future work.
In Main Goals & Research Questions, two research questions are stated, regarding the work
which was planned ahead. At the present stage, they can be answered: Is it possible to cre-ate an environmental disturbances manager, and effectively integrate it within the existingplatform? Yes. The Environmental Disturbances Manager was implemented and effectively inte-
grated within The Platform, including the main features which were planned.
Is it feasible to introduce a generic interface for external disaster simulators into the sys-tem? Unfortunately, due to alterations in the Work Plan, this question can’t be given an absolute
answer since such interface was not developed (details in Final Work Overview). However, due to
the modular structure and current feature set of the DM, it is considered most likely possible.
With the completion of the Disturbances Manager, The Platform became even more intricate.
Future users will be able to take advantage of the DM in order to develop more realistic and
complex vehicular missions, for example regarding the testing of search methods for the center of
a forest fire - allowing for the acquisition of knowledge which could be directly applied in real-
world firefighting. The possibilities for uses of The Platform were quite broad before the DM,
which added an extra layer of potential to it.
It was found that FSX is indeed a very complete simulator, and serves as a solid basis for The
Platform. Despite its age, it shows remarkable potential for additions, modifications and upgrades
through its extensively-documented SDK. However complete, the documentation isn’t the most
user-friendly, which originated some difficulty throughout the development of the DM’s features.
The Platform was also rather interesting to work with; having multiple and diverse components,
the understanding of its global set of functionalities took some time, but proved useful in the
integration of the DM therein.
57

Conclusions & Future Work
From the beginning to the end of the development of this thesis, many hardships arose and were
overcome. The developed work is considered successful and proved to be rather challenging, yet
rewarding.
6.1 Limitations
The limitation of the implemented Disturbances Manager which is considered most significant
refers to AgentService and its modest capacity to handle large loads, in terms of the rate of mes-
sages. This reflects upon the Disturbances Manager as a limitation to potential future work - the
implementation of different update frequencies of the vehicles’ sensors, as described in AgentSer-
vice Stress Test.
6.2 Future Work
Multiple extensions and improvements to the developed Disturbances Manager were considered
throughout the development of the dissertation at hand:
• Implementation of a generic interface for external co-simulators, as was initially planned,
and mentioned in Work Plan;
• Possibility for changing the specification of disturbances during simulation - besides the
specification of the disturbances previous to their deployment, it would be a welcome addi-
tion to change the details of disturbances while they are being simulated. As an example, it
could be useful to move an active disturbance to a different area of the map;
• More time and space evolution functions could be implemented, as to provide the means for
simulating more diverse disturbances;
• The introduction of specific update rates for each sensor;
• More detailed in-game representation of disturbances. As described in SimConnect, the
version of SimConnect does not allow for the programmatic deployment of Special Effects
in the simulation. By migrating The Platform to Prepar3D, it would become possible to use
this feature of the updated SimConnect, among others.
58

Bibliography
[IEE, 2010] (2010). IEEE standard for modeling and simulation (M&S) high level architecture
(HLA)– framework and rules. IEEE Std 1516-2010 (Revision of IEEE Std 1516-2000), pages
1–38.
[A. Finney, 2006] A. Finney, M. (2006). An overview of flammap fire modeling capabilities. In
Fuels Management-How to Measure Success: Conference Proceedings.
[Brodie et al., 2007] Brodie, K., Fettes, D., Harte, B., and Schmid, R. (2007). Structural terms
including fault rock terms. Recommendations by the IUGS Subcommission.
[Buscarino et al., 2015] Buscarino, A., Famoso, C., Fortuna, L., Frasca, M., and Xibilia, M. G.
(2015). Complexity in forest fires: From simple experiments to nonlinear networked models.
Communications in Nonlinear Science and Numerical Simulation, 22(1-3):660–675.
[Camara, 2013] Camara, Á. (2013). Controlo de tráfego aéreo usando o microsoft flight simulator
x. Master’s thesis, Department of Informatics Engineering, University of Coimbra, Coimbra,
Portugal.
[Câmara et al., 2014] Câmara, Á., Silva, D. C., Abreu, P. H., and Oliveira, E. (2014). Comparing
a centralized and decentralized multi-agent approaches to air traffic control. In Proceedings of
the 28th European Simulation and Modelling Conference (ESM’2014), October 22-24, 2014,
Porto, Portugal, pages 189–193.
[Chen et al., 2006] Chen, D., Turner, S. J., and Cai, W. (2006). A framework for robust hla-
based distributed simulations. In 20th Workshop on Principles of Advanced and Distributed
Simulation (PADS’06), pages 183–192.
[CRED, 2015] CRED (2015). The Human Cost of Natural Disasters 2015: Global Perspective.
Technical report, Centre for Research on the Epidemology of Disasters (CRED).
[Dahmann et al., 1998] Dahmann, J. S., Kuhl, F., and Weatherly, R. (1998). Standards for Simu-
lation: As Simple As Possible But Not Simpler The High Level Architecture For Simulation.
SIMULATION, 71(6):378–387.
[Drabek, 1970] Drabek, T. E. (1970). Methodology of studying disasters. American Behavioral
Scientist, 13(3):331–343.
59

BIBLIOGRAPHY
[Filippi et al., 2011] Filippi, J.-B., Bosseur, F., Pialat, X., Santoni, P.-A., Strada, S., and Mari,
C. (2011). Simulation of Coupled Fire/Atmosphere Interaction with the MesoNH-ForeFire
Models. Journal of Combustion, 2011:1–13.
[Finney and Station-Ogden, 1998] Finney, M. and Station-Ogden, R. M. R. (1998). FARSITE,
Fire Area Simulator–model development and evaluation. Number no. 4 in Research paper
RMRS. U.S. Dept. of Agriculture, Forest Service, Rocky Mountain Research Station.
[Gewin, 2016] Gewin, V. (2016). Data sharing: An open mind on open data. Nature,
529(7584):117–119.
[Henri Balbi et al., 2009] Henri Balbi, J., Morandini, F., Silvani, X., Filippi, J. B., and Rinieri, F.
(2009). A Physical Model for Wildland Fires. Combustion and Flame, 156(12):2217–2230.
[IEDC, 2016] IEDC (2016). Types of disasters. Last Accessed on 2016-11; Avail-
able online at http://restoreyoureconomy.org/disaster-overview/
types-of-disasters/.
[Ivanilova, 1985] Ivanilova, T. (1985). Set probability identification in forest fire simulation. An-
nual Review in Automatic Programming, 12(Part 2):185 – 188. Systems Analysis and Simula-
tion 1985.
[MAMAOT, 2015] MAMAOT (2015). Áreas ardidas anuais por tipo de ocupação do solo. Last
Accessed on 2016-11; Available online at http://www.icnf.pt/portal/florestas/
dfci/Resource/doc/estat/area-ardida-1996-a-2014.
[Martin, 2017] Martin, L. (2017). PREPAR3D SDK Overview. Last Accessed on 2017-05-20;
Available online at http://www.prepar3d.com/SDKv4/sdk/sdk_overview.html.
[Microsoft, 2008a] Microsoft (2008a). Mission creation. Last Accessed on 2017-06; Available
online at https://msdn.microsoft.com/en-us/library/cc526963.aspx.
[Microsoft, 2008b] Microsoft (2008b). Simconnect. Last Accessed on 2017-06; Available online
at https://msdn.microsoft.com/en-us/library/cc526983.aspx.
[Microsoft, 2008c] Microsoft (2008c). Special effects tool. Last Accessed on 2017-02; Available
online at https://msdn.microsoft.com/en-us/library/cc526969.aspx.
[NG, 2017] NG (2017). GIS (geographic information system) - National Geographic Soci-
ety. Last Accessed on 2017-01; Available online at http://www.nationalgeographic.
org/encyclopedia/geographic-information-system-gis/.
[NICIF and Lourenço, 1994] NICIF and Lourenço, L. (1994). Risco de incêndio florestal em
Portugal Continental. Colectâneas Cindínicas, 1.
60

BIBLIOGRAPHY
[NIDM, 2014] NIDM (2014). Types of environmental disasters. Last Accessed on 2016-11;
Available online at http://nidm.gov.in/easindia2014/err/pdf/themes_issue/
env/types.pdf.
[NOAA, 2017a] NOAA (2017a). Billion-dollar weather and climate disasters. Last Accessed on
2016-11; Available online at https://www.ncdc.noaa.gov/billions.
[NOAA, 2017b] NOAA (2017b). Billion-dollar weather and climate disasters: Table of
events. Last Accessed on 2016-11; Available online at https://www.ncdc.noaa.gov/
billions/events/US/1980-2017.
[Pereira and Rossetti, 2012] Pereira, J. L. F. and Rossetti, R. J. F. (2012). An integrated architec-
ture for autonomous vehicles simulation. In Proceedings of the 27th Annual ACM Symposium
on Applied Computing, SAC ’12. ACM.
[Quarantelli, 1992] Quarantelli, E. L. (1992). The environmental disasters of the future will be
more and worse but the prospects is not hopeless. Technical report.
[Reid and Powers, 2000] Reid, M. R. and Powers, E. I. (2000). An Evaluation of the High Level
Architecture (HLA) as a Framework for NASA Modeling and Simulation.
[Rodrigues et al., 2015] Rodrigues, C., Silva, D. C., Rossetti, R. J. F., and Oliveira, E. (2015).
Distributed flight simulation environment using flight simulator x. In Proceedings of the 10th
Iberian Conference on Information Systems and Technologies, June 17-20 2015, Águeda, Por-
tugal, pages 1293–1297.
[Santos, 2010] Santos, A. (2010). Autonomous Intelligent Vehicle Adaptation and Performance
Analysis in Flight Simulator X. Master’s thesis, Faculty of Engineering, University of Porto,
Porto, Portugal.
[Santos, 2012] Santos, W. (2012). 26 Weather APIs, 12 Support JSON | ProgrammableWeb. Last
Accessed on 2017-02; Available online at https://www.programmableweb.com/news/
26-weather-apis-12-support-json/2012/01/11.
[Silva, 2011] Silva, D. C. (2011). Cooperative Multi-Robot Missions: Development of a Platform
and a Specification Language. PhD thesis, Faculty of Engineering, University of Porto, Porto,
Portugal.
[Silva et al., 2017] Silva, D. C., Abreu, P. H., Reis, L. P., and Oliveira, E. (2017). Development
of Flexible Languages for Scenario and Team Description in Multi-Robot Missions. Artificial
Intelligence for Engineering Design, Analysis and Manufacturing, 31(1):69–86.
[Silva et al., 2016] Silva, D. C., Reis, P. H. A. L. P., and Oliveira, E. (2016). Development of a
Flexible Language for Disturbance Description for Multi-Robot Missions. Journal of Simula-
tion, 10(3):166–181.
61

BIBLIOGRAPHY
[Silva, 2008] Silva, R. (2008). Communication Layer in an Aviation Simulator. Master’s thesis,
Faculty of Engineering, University of Porto, Porto, Portugal.
[Sousa, 2010] Sousa, P. D. (2010). Autonomous Air Traffic Control for Intelligent Vehicles using
Microsoft Flight Simulator X. Master’s thesis, Faculty of Engineering, University of Porto,
Porto, Portugal.
[Sousa et al., 2010] Sousa, P. D., Silva, D. C., and Reis, L. P. (2010). Air Traffic Control with Mi-
crosoft Flight Simulator X. In Álvaro Rocha, Sexto, C. F., Reis, L. P., and Cota, M. P., editors,
Actas de la 5a Conferencia Ibérica de Sistemas y Tecnologías de Información (CISTI 2010),
June 16–19 2010, Santiago de Compostela, Spain, pages 378–383. in Portuguese (original
title: Controlo de Tráfego Aéreo com o Microsoft Flight Simulator X).
[Stevenson et al., 1975] Stevenson, A., Schermerhorn, D., and Miller, S. (1975). Simulation of
southern california forest fires. Symposium (International) on Combustion, 15(1):147–155.
[USDA, 2015] USDA (2015). FARSITE. Last Accessed on 2017-03; Available online at https:
//www.firelab.org/project/farsite.
[USGS, 2016] USGS (2016). USGS: Volcano Hazards Program. Last Accessed on 2017-02;
Available online at https://volcanoes.usgs.gov/vhp/hazards.html.
[Wells, 2008] Wells, G. (2008). The rothermel Fire-Spread Model: Still running Like a champ.
[Wong, 1998] Wong, V. (1998). Flight Simulation (Department of Computing | Imperial College
London).
62

Appendix A
DDL XML File
A.1 Sample Disturbance Specification File
1 <?xml version="1.0" encoding="UTF-8"?>
2 <disturbances xmlns:xsi="http://www.w3.org/2001/XMLSchema-instance"
xsi:schemaLocation="dcs:disturbance disturbances_joao.xsd" xmlns="
dcs:disturbance">
3 <disturbance id="d0" disturbanceType="hurricane" origin="ManMade" seriousness="2"
>
4 <denomination>Fire Number One</denomination>
5 <distLocation placing="random">
6 <area id="l1">
7 <denomination>Forest Area</denomination>
8 <medium air="false" land="true" water="false" underwater="false" />
9 <availability available="always" />
10 <circle>
11 <minAlt measured="agl" lengthUnit="Foot">0</minAlt>
12 <maxAlt measured="agl" lengthUnit="Foot">1</maxAlt>
13 <center>
14 <latitude>48o 21’ 0.50’’ N</latitude>
15 <longitude>122o 40’ 18.91’’ W</longitude>
16 </center>
17 <radius lengthUnit="Foot">1500</radius>
18 </circle>
19 </area>
20 </distLocation>
21 <distAvailability start="scheduled" end="unspecified">
22 <starting>
23 <timePoint countingFrom="simulationStart">
24 <after>PT0H00M20S</after>
25 </timePoint>
26 </starting>
27 </distAvailability>
28 <distMobility mobilityType="Stationary" constrainedToArea="false">
63
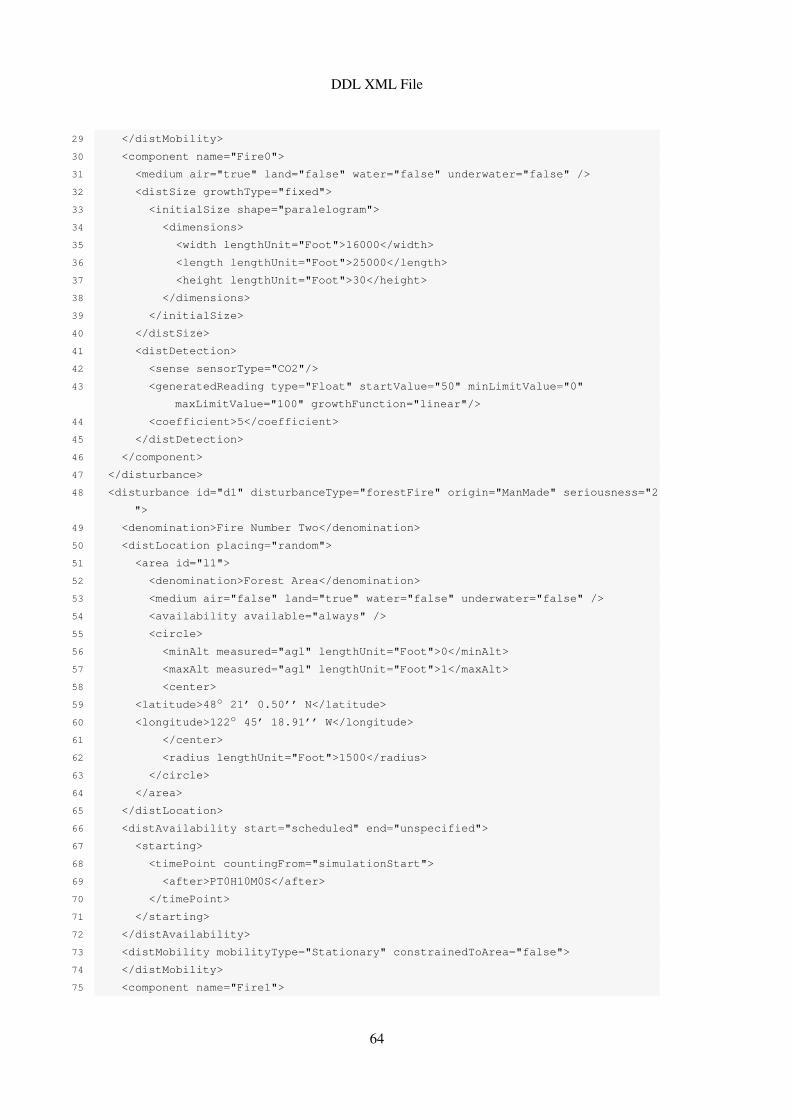
DDL XML File
29 </distMobility>
30 <component name="Fire0">
31 <medium air="true" land="false" water="false" underwater="false" />
32 <distSize growthType="fixed">
33 <initialSize shape="paralelogram">
34 <dimensions>
35 <width lengthUnit="Foot">16000</width>
36 <length lengthUnit="Foot">25000</length>
37 <height lengthUnit="Foot">30</height>
38 </dimensions>
39 </initialSize>
40 </distSize>
41 <distDetection>
42 <sense sensorType="CO2"/>
43 <generatedReading type="Float" startValue="50" minLimitValue="0"
maxLimitValue="100" growthFunction="linear"/>
44 <coefficient>5</coefficient>
45 </distDetection>
46 </component>
47 </disturbance>
48 <disturbance id="d1" disturbanceType="forestFire" origin="ManMade" seriousness="2
">
49 <denomination>Fire Number Two</denomination>
50 <distLocation placing="random">
51 <area id="l1">
52 <denomination>Forest Area</denomination>
53 <medium air="false" land="true" water="false" underwater="false" />
54 <availability available="always" />
55 <circle>
56 <minAlt measured="agl" lengthUnit="Foot">0</minAlt>
57 <maxAlt measured="agl" lengthUnit="Foot">1</maxAlt>
58 <center>
59 <latitude>48o 21’ 0.50’’ N</latitude>
60 <longitude>122o 45’ 18.91’’ W</longitude>
61 </center>
62 <radius lengthUnit="Foot">1500</radius>
63 </circle>
64 </area>
65 </distLocation>
66 <distAvailability start="scheduled" end="unspecified">
67 <starting>
68 <timePoint countingFrom="simulationStart">
69 <after>PT0H10M0S</after>
70 </timePoint>
71 </starting>
72 </distAvailability>
73 <distMobility mobilityType="Stationary" constrainedToArea="false">
74 </distMobility>
75 <component name="Fire1">
64

DDL XML File
76 <medium air="true" land="false" water="false" underwater="false" />
77 <distSize growthType="grow">
78 <initialSize shape="sphere">
79 <dimensions>
80 <width lengthUnit="Foot">8000</width>
81 <length lengthUnit="Foot">8000</length>
82 <height lengthUnit="Foot">15</height>
83 </dimensions>
84 </initialSize>
85 </distSize>
86 <distDetection>
87 <sense sensorType="CO2"/>
88 <generatedReading type="Float" startValue="10.0" minLimitValue="0.0"
maxLimitValue="100.0" growthFunction="constant"/>
89 <coefficient>0</coefficient>
90 </distDetection>
91 </component>
92 </disturbance>
93 </disturbances>
65

DDL XML File
66

Appendix B
TDL XML File
B.1 Sample Section of a Team Specification File
1 <agent id="a1" agentTypeID="y1">
2 <name>Lusitania</name>
3 <description>Primeiro agente a voar</description>
4 <initialLocation baseID="b1" locationID="p01">
5 <heading headingType="True">180</heading>
6 </initialLocation>
7 <state>
8 <fuel volumeUnit="Litre">2.5</fuel>
9 <lights cabin="false" logo="false" wing="false" recognition="false" panel="
false" strobe="false" taxi="false" landing="false" beacon="false" nav="
false" />
10 <doorsOpen>false</doorsOpen>
11 <gearDown>true</gearDown>
12 <flapsHandlePosition>3</flapsHandlePosition>
13 <rudder>-0.01334</rudder>
14 <aileron>-0.1213</aileron>
15 <elevator>0.01223</elevator>
16 </state>
17 <simulatedAgent>
18 <tailNumber>DCS01</tailNumber>
19 </simulatedAgent>
20 <realAgent>
21 <communication>
22 <controlFrequency frequencyUnit="MegaHertz">1245.75</controlFrequency>
23 <activeFrequency frequencyUnit="MegaHertz">121.2</activeFrequency>
24 <standByFrequency frequencyUnit="MegaHertz">124.5</standByFrequency>
25 </communication>
26 <ATC>
27 <callSign>Air One</callSign>
28 <tailNumber>NLS01</tailNumber>
29 <name>Lusitania</name>
67

TDL XML File
30 </ATC>
31 </realAgent>
32 <payloads>
33 <payload name="PayloadCenter">
34 <sensors>
35 <sensor sensorType="CO2" id="s1_a1">
36 <dimensions>
37 <width lengthUnit="Centimeter">20</width>
38 <length lengthUnit="Centimeter">18</length>
39 <height lengthUnit="Centimeter">14</height>
40 </dimensions>
41 <weight massUnit="Kilogram">4</weight>
42 <operatingRequirements>
43 <temperature>-40oC - 75oC</temperature>
44 <humidity>0 - 99%</humidity>
45 <voltage>3 - 5.5 vdc</voltage>
46 <current>10 mA</current>
47 <powerConsumption><100mW</powerConsumption>
48 </operatingRequirements>
49 <specifications>
50 <specification name="Detects">CO2</specification>
51 <specification name="Method">Infrared</specification>
52 <specification name="Range">0-2000ppm</specification>
53 <specification name="Accuracy">5%</specification>
54 <specification name="Resolution">10ppm</specification>
55 <specification name="Output Range">0-22 mA</specification>
56 <specification name="Response Time">5 ms</specification>
57 </specifications>
58 <sensorReadingType type="numeric" unit="ppmv"/>
59 </sensor>
60 <sensor sensorType="IRCameraIntensity" id="s2_a1">
61 <dimensions>
62 <width lengthUnit="Centimeter">30</width>
63 <length lengthUnit="Centimeter">35</length>
64 <height lengthUnit="Centimeter">30</height>
65 </dimensions>
66 <weight massUnit="Kilogram">2</weight>
67 <operatingRequirements>
68 <temperature>-15oC - 90oC</temperature>
69 <humidity>0 - 99%</humidity>
70 <voltage>3 - 5.5 vdc</voltage>
71 <current>25 mA</current>
72 <powerConsumption><125mW</powerConsumption>
73 </operatingRequirements>
74 <specifications>
75 <specification name="Detects">Generic</specification>
76 </specifications>
77 <sensorReadingType type="numeric" unit="X"/>
78 </sensor>
68

TDL XML File
79 </sensors>
80 <cargo type="water" quantity="180"/>
81 </payload>
82 </payloads>
83 </agent>
69

TDL XML File
70
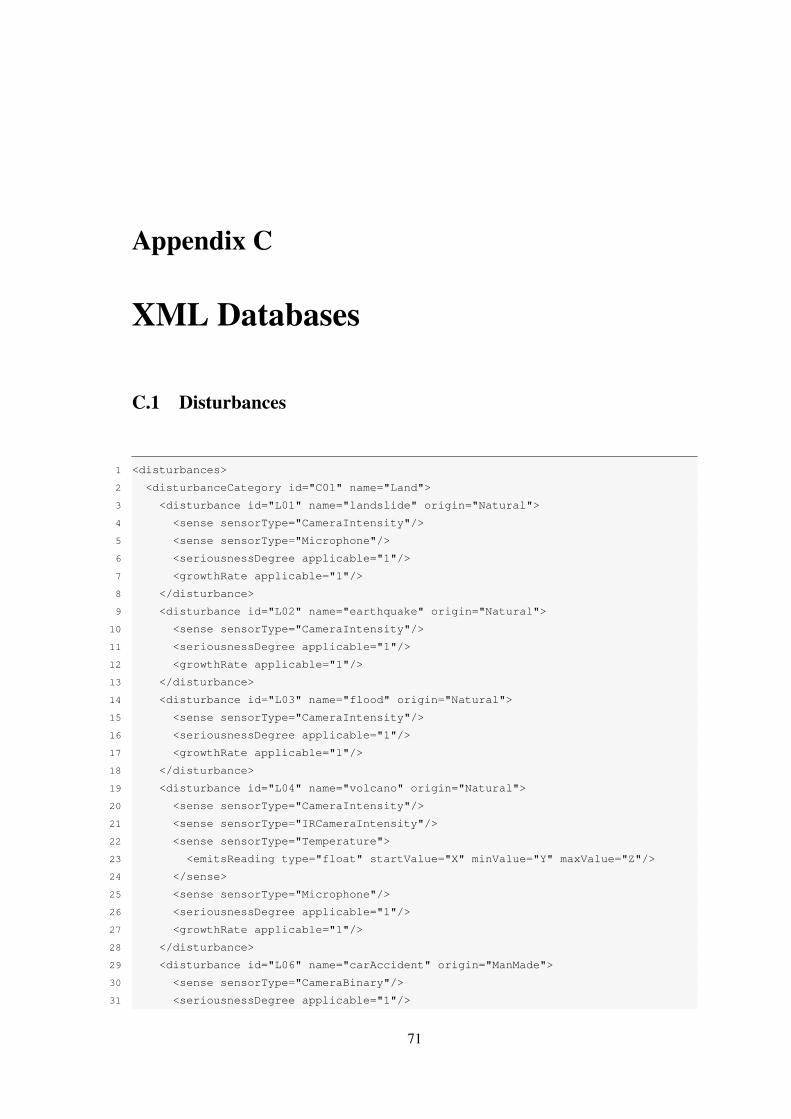
Appendix C
XML Databases
C.1 Disturbances
1 <disturbances>
2 <disturbanceCategory id="C01" name="Land">
3 <disturbance id="L01" name="landslide" origin="Natural">
4 <sense sensorType="CameraIntensity"/>
5 <sense sensorType="Microphone"/>
6 <seriousnessDegree applicable="1"/>
7 <growthRate applicable="1"/>
8 </disturbance>
9 <disturbance id="L02" name="earthquake" origin="Natural">
10 <sense sensorType="CameraIntensity"/>
11 <seriousnessDegree applicable="1"/>
12 <growthRate applicable="1"/>
13 </disturbance>
14 <disturbance id="L03" name="flood" origin="Natural">
15 <sense sensorType="CameraIntensity"/>
16 <seriousnessDegree applicable="1"/>
17 <growthRate applicable="1"/>
18 </disturbance>
19 <disturbance id="L04" name="volcano" origin="Natural">
20 <sense sensorType="CameraIntensity"/>
21 <sense sensorType="IRCameraIntensity"/>
22 <sense sensorType="Temperature">
23 <emitsReading type="float" startValue="X" minValue="Y" maxValue="Z"/>
24 </sense>
25 <sense sensorType="Microphone"/>
26 <seriousnessDegree applicable="1"/>
27 <growthRate applicable="1"/>
28 </disturbance>
29 <disturbance id="L06" name="carAccident" origin="ManMade">
30 <sense sensorType="CameraBinary"/>
31 <seriousnessDegree applicable="1"/>
71

XML Databases
32 <growthRate applicable="0"/>
33 </disturbance>
34 <disturbance id="L07" name="trainAccident" origin="ManMade">
35 <sense sensorType="CameraBinary"/>
36 <seriousnessDegree applicable="1"/>
37 <growthRate applicable="0"/>
38 </disturbance>
39 <disturbance id="L08" name="fleeingPerson" origin="ManMade">
40 <sense sensorType="CameraBinary"/>
41 <sense sensorType="Microphone"/>
42 <seriousnessDegree applicable="1"/>
43 <growthRate applicable="0"/>
44 </disturbance>
45 <disturbance id="L09" name="lostAnimal" origin="ManMade">
46 <sense sensorType="CameraBinary"/>
47 <sense sensorType="Microphone"/>
48 <seriousnessDegree applicable="1"/>
49 <growthRate applicable="0"/>
50 </disturbance>
51 </disturbanceCategory>
52 <disturbanceCategory id="C02" name="Sea">
53 <disturbance id="S01" name="strongWaves" origin="Natural">
54 <sense sensorType="CameraIntensity"/>
55 <sense sensorType="Microphone"/>
56 <seriousnessDegree applicable="1"/>
57 <growthRate applicable="1"/>
58 </disturbance>
59 <disturbance id="S02" name="tsunami" origin="Natural">
60 <sense sensorType="CameraIntensity"/>
61 <sense sensorType="Microphone"/>
62 <seriousnessDegree applicable="1"/>
63 <growthRate applicable="1"/>
64 </disturbance>
65 <disturbance id="S03" name="oilSpill" origin="ManMade">
66 <sense sensorType="CameraIntensity"/>
67 <seriousnessDegree applicable="1"/>
68 <growthRate applicable="0"/>
69 </disturbance>
70 <disturbance id="S04" name="chemicalSpill" origin="ManMade">
71 <sense sensorType="CameraIntensity"/>
72 <sense sensorType="Chemical"/>
73 <seriousnessDegree applicable="1"/>
74 <growthRate applicable="0"/>
75 </disturbance>
76 <disturbance id="S05" name="boatAccident" origin="ManMade">
77 <sense sensorType="CameraBinary"/>
78 <seriousnessDegree applicable="1"/>
79 <growthRate applicable="0"/>
80 </disturbance>
72

XML Databases
81 <disturbance id="S06" name="lostPerson" origin="ManMade">
82 <sense sensorType="CameraBinary"/>
83 <seriousnessDegree applicable="1"/>
84 <growthRate applicable="0"/>
85 </disturbance>
86 <disturbance id="S07" name="hydrothermalVent" origin="Natural">
87 <sense sensorType="CameraIntensity"/>
88 <sense sensorType="Temperature"/>
89 <sense sensorType="Microphone"/>
90 <seriousnessDegree applicable="1"/>
91 <growthRate applicable="0"/>
92 </disturbance>
93 <disturbance id="S08" name="schoolingFish" origin="Natural">
94 <sense sensorType="CameraIntensity"/>
95 <sense sensorType="Chemical"/>
96 <seriousnessDegree applicable="1"/>
97 <growthRate applicable="0"/>
98 </disturbance>
99 </disturbanceCategory>
100 <disturbanceCategory id="C03" name="Fire">
101 <disturbance id="F01" name="forestFire" origin="Any">
102 <sense sensorType="CameraIntensity"/>
103 <sense sensorType="IRCameraIntensity"/>
104 <sense sensorType="Temperature">
105 <emitsReading type="float" startValue="X" minValue="Y" maxValue="Z"/>
106 </sense>
107 <sense sensorType="CO2"/>
108 <seriousnessDegree applicable="1"/>
109 <growthRate applicable="1"/>
110 </disturbance>
111 <disturbance id="F02" name="buildingsFire" origin="ManMade">
112 <sense sensorType="CameraIntensity"/>
113 <sense sensorType="IRCameraIntensity"/>
114 <sense sensorType="Temperature">
115 <emitsReading type="float" startValue="X" minValue="Y" maxValue="Z"/>
116 </sense>
117 <sense sensorType="CO2"/>
118 <seriousnessDegree applicable="1"/>
119 <growthRate applicable="1"/>
120 </disturbance>
121 </disturbanceCategory>
122 <disturbanceCategory id="C04" name="Storm">
123 <disturbance id="S01" name="heavyRain" origin="Natural">
124 <sense sensorType="CameraIntensity"/>
125 <sense sensorType="HumiditySensor"/>
126 <sense sensorType="AirPressure"/>
127 <sense sensorType="WindSpeed"/>
128 <sense sensorType="Microphone"/>
129 <seriousnessDegree applicable="1"/>
73

XML Databases
130 <growthRate applicable="1"/>
131 </disturbance>
132 <disturbance id="S02" name="thunderstorm" origin="Natural">
133 <sense sensorType="CameraIntensity"/>
134 <sense sensorType="HumiditySensor"/>
135 <sense sensorType="AirPressure"/>
136 <sense sensorType="WindSpeed"/>
137 <sense sensorType="Microphone"/>
138 <sense sensorType="ElectricField"/>
139 <sense sensorType="MagneticField"/>
140 <seriousnessDegree applicable="1"/>
141 <growthRate applicable="1"/>
142 </disturbance>
143 <disturbance id="S03" name="hurricane" origin="Natural">
144 <sense sensorType="CameraIntensity"/>
145 <sense sensorType="AirPressure"/>
146 <sense sensorType="WindSpeed"/>
147 <sense sensorType="Microphone"/>
148 <seriousnessDegree applicable="1"/>
149 <growthRate applicable="1"/>
150 </disturbance>
151 </disturbanceCategory>
152 <disturbanceCategory id="C05" name="General">
153 <disturbance id="G01" name="bugInfestation" origin="Natural">
154 <sense sensorType="CameraIntensity"/>
155 <seriousnessDegree applicable="1"/>
156 <growthRate applicable="1"/>
157 </disturbance>
158 <disturbance id="G02" name="extremeTemperature" origin="Natural">
159 <sense sensorType="Temperature">
160 <emitsReading type="float" startValue="X" minValue="Y" maxValue="Z"/>
161 </sense>
162 <seriousnessDegree applicable="1"/>
163 <growthRate applicable="1"/>
164 </disturbance>
165 <disturbance id="G03" name="coldWave" origin="Natural">
166 <sense sensorType="Temperature">
167 <emitsReading type="float" startValue="X" minValue="Y" maxValue="Z"/>
168 </sense>
169 <seriousnessDegree applicable="1"/>
170 <growthRate applicable="1"/>
171 </disturbance>
172 <disturbance id="G04" name="heatWave" origin="Natural">
173 <sense sensorType="Temperature"/>
174 <emitsReading type="float" startValue="X" minValue="Y" maxValue="Z"/>
175 <seriousnessDegree applicable="1"/>
176 <growthRate applicable="1"/>
177 </disturbance>
178 <disturbance id="G05" name="chemicalContamination" origin="ManMade">
74

XML Databases
179 <sense sensorType="ChemicalSensor"/>
180 <seriousnessDegree applicable="1"/>
181 <growthRate applicable="1"/>
182 </disturbance>
183 <disturbance id="G06" name="chemicalCloud" origin="ManMade">
184 <sense sensorType="ChemicalSensor"/>
185 <seriousnessDegree applicable="1"/>
186 <growthRate applicable="1"/>
187 </disturbance>
188 <disturbance id="G07" name="underFire" origin="ManMade">
189 <sense sensorType="CameraIntensity"/>
190 <seriousnessDegree applicable="1"/>
191 <growthRate applicable="1"/>
192 </disturbance>
193 <disturbance id="G08" name="buildingsInRuins" origin="ManMade">
194 <sense sensorType="CameraBinary"/>
195 <seriousnessDegree applicable="1"/>
196 <growthRate applicable="0"/>
197 </disturbance>
198 <disturbance id="G09" name="radiation" origin="ManMade">
199 <sense sensorType="GeigerCounter"/>
200 <seriousnessDegree applicable="1"/>
201 <growthRate applicable="0"/>
202 </disturbance>
203 <disturbance id="G10" name="underFire" origin="ManMade">
204 <sense sensorType="CameraIntensity"/>
205 <sense sensorType="Microphone"/>
206 <seriousnessDegree applicable="1"/>
207 <growthRate applicable="0"/>
208 </disturbance>
209 </disturbanceCategory>
210 </disturbances>
C.2 Sensors
1 <sensors>
2 <sensor name="Temperature" readingType="numeric" unit="degreeCelcius"/>
3 <sensor name="CO2" readingType="numeric" unit="ppmv"/>
4 <sensor name="CO" readingType="numeric" unit="ppmv"/>
5 <sensor name="CameraBinary" readingType="boolean"/>
6 <sensor name="CameraIntensity" readingType="seriousness"/>
7 <sensor name="IRCameraIntensity" readingType="seriousness"/>
8 <sensor name="ChemicalSensor" readingType="numeric" unit="genericFloat"/>
9 <sensor name="Microphone" readingType="numeric" unit="genericFloat"/>
10 <sensor name="Chemical" readingType="numeric" unit="genericFloat"/>
11 <sensor name="AirPressure" readingType="numeric" unit="genericFloat"/>
75

XML Databases
12 <sensor name="WindSpeed" readingType="numeric" unit="genericFloat"/>
13 <sensor name="GeigerCounter" readingType="numeric" unit="genericFloat"/>
14 <sensor name="ElectricField" readingType="numeric" unit="genericFloat"/>
15 <sensor name="MagneticField" readingType="numeric" unit="genericFloat"/>
16 </sensors>
76

Appendix D
XSD Additions
D.1 DDL
1 <xs:attributeGroup name="distOriginGroup">
2 <xs:attribute name="seriousness">
3 <xs:simpleType>
4 <xs:restriction base="xs:integer">
5 <xs:minInclusive value="0"/>
6 <xs:maxInclusive value="5"/>
7 </xs:restriction>
8 </xs:simpleType>
9 </xs:attribute>
10
11 <xs:attribute name="origin" use="required">
12 <xs:simpleType>
13 <xs:restriction base="xs:string">
14 <xs:enumeration value="Natural"/>
15 <xs:enumeration value="ManMade"/>
16 <xs:enumeration value="Any"/>
17 </xs:restriction>
18 </xs:simpleType>
19 </xs:attribute>
20
21 <xs:attribute name="growthFunction" use="optional">
22 <xs:simpleType>
23 <xs:restriction base="xs:string">
24 <xs:enumeration value="linear"/>
25 <xs:enumeration value="polynomial"/>
26 <xs:enumeration value="exponential"/>
27 <xs:enumeration value="logarithmic"/>
28 <xs:enumeration value="root"/>
29 <xs:enumeration value="sinusoid"/>
30 <xs:enumeration value="custom"/>
31 </xs:restriction>
77

XSD Additions
32 </xs:simpleType>
33 </xs:attribute>
34
35 <xs:element name="distDetection">
36 <xs:complexType>
37 <xs:sequence>
38 <xs:element ref="sense" maxOccurs="unbounded"/>
39 <xs:element ref="generatedReading" minOccurs="1" maxOccurs="1"/>
40 <xs:sequence>
41 <xs:element ref="coefficient" maxOccurs="unbounded"/>
42 </xs:sequence>
43 </xs:sequence>
44 </xs:complexType>
45 </xs:element>
46
47 <xs:element name="generatedReading">
48 <xs:complexType>
49 <xs:attributeGroup ref="generatedReadingAttributes"/>
50 <xs:attributeGroup ref="growthFunctionGroup_optional"/>
51 <xs:attributeGroup ref="functionVariableGroup"/>
52 </xs:complexType>
53 </xs:element>
54
55 <xs:attributeGroup name="generatedReadingAttributes">
56 <xs:attribute name="type" use="required">
57 <xs:simpleType>
58 <xs:restriction base="xs:string">
59 <xs:enumeration value="Binary"/>
60 <xs:enumeration value="Float"/>
61 </xs:restriction>
62 </xs:simpleType>
63 </xs:attribute>
64 <xs:attribute name="startValue" type="xs:string" use="optional"/>
65 <xs:attribute name="minLimitValue" type="xs:string" use="optional"/>
66 <xs:attribute name="maxLimitValue" type="xs:string" use="optional"/>
67 </xs:attributeGroup>
D.2 TDL
1 <xs:element name="sensorReadingType">
2 <xs:complexType>
3 <xs:simpleContent>
4 <xs:extension base="xs:string">
5 <xs:attribute name="type" type="xs:string" use="required"/>
6 <xs:attribute name="unit" type="xs:string" use="required"/>
7 </xs:extension>
78

XSD Additions
8 </xs:simpleContent>
9 </xs:complexType>
10 </xs:element>
79