Simulation and Experimental Observation of Double-slit ...
11
Chiang Mai J. Sci. 2020; 47(5) : 1081-1091 http://epg.science.cmu.ac.th/ejournal/ Contributed Paper Simulation and Experimental Observation of Double-slit Interference of Non-monochromatic Light Weicheng Li [a], Jianhua Zeng*[a,b] and Jianrong Yang [a,c] [a] School of Physics and Electronic Information, Shangrao Normal University, Shangrao 334001, China. [b] Quantum information research center, Shangrao Normal University, Shangrao 334001, China. [c] Intelligent Engineering Technology Research Center of Electric Vehicle Parts in Jiangxi Province, Shangrao Normal University, Shangrao 334001, China. *Author for correspondence; e-mail: [email protected] Received: 29 May 2019 Revised: 22 February 2020 Accepted: 24 February 2020 ABSTRACT Double-slit interference of non-monochromatic light with different central wavelengths was simulated using MATLAB, and related experiments were conducted using a sodium lamp, a halogen lamp and an light-emitting diode (LED) lamp. Through theoretical and experimental explorations of double-slit interference of non-monochromatic light, the characteristics of interference fringe distributions were intuitively demonstrated; the results can deepen the understanding of the interference mechanism of non-monochromatic light. Our study can also provide theoretical support for measuring engineering parameters with non-monochromatic light in interferometric engineering measurements. Keywords: double-slit interference, non-monochromatic light, central wavelength, spectrum width 1. I NTRODUCTION Double-slit interference is the most basic and important effect in optics, which has confirmed the wave nature of light for the first time [1-7]. Through double-slit interference experiments, the wave nature of photons [8,9], electrons [2,10,11], neutrons [12] and atoms [13] is shown. When light interferes, interference fringes can be produced; these are manifested as the intensity of light or the stable distribution of lightness and darkness in space after light encounters obstacles. In essence, the interference of light is the enhancement and cancellation of a limited beam of light vibrations during superposition. There has been continual interest in double-slit interference for over two centuries since the double-slit experiment was first performed by Thomas Young in the early 1800s [1]. Even in the past twenty years, there have been many related studies. Ambrose et al. investigated students’ understanding of single-slit diffraction and double-slit interference [14]. Gonzalez et al. described a simple interference experiment involving scattered light using a “dusty” plane back-silvered mirror, a screen, and a laser [15]. Gondran et al. presented a numerical simulation of the double-slit interference experiment realized with ultracold atoms [16]. Frabboni et al. reported a method for demonstrating to undergraduate and graduate students the double-slit electron interference experiment using a conventional
Transcript of Simulation and Experimental Observation of Double-slit ...

Chiang Mai J. Sci. 2020; 47(5) : 1081-1091http://epg.science.cmu.ac.th/ejournal/Contributed Paper
Simulation and Experimental Observation of Double-slit Interference of Non-monochromatic LightWeicheng Li [a], Jianhua Zeng*[a,b] and Jianrong Yang [a,c][a] School of Physics and Electronic Information, Shangrao Normal University, Shangrao 334001, China.
[b] Quantum information research center, Shangrao Normal University, Shangrao 334001, China.
[c] Intelligent Engineering Technology Research Center of Electric Vehicle Parts in Jiangxi Province, Shangrao Normal University, Shangrao 334001, China.
*Author for correspondence; e-mail: [email protected]: 29 May 2019
Revised: 22 February 2020 Accepted: 24 February 2020
ABSTRACT Double-slit interference of non-monochromatic light with different central wavelengths was
simulated using MATLAB, and related experiments were conducted using a sodium lamp, a halogen lamp and an light-emitting diode (LED) lamp. Through theoretical and experimental explorations of double-slit interference of non-monochromatic light, the characteristics of interference fringe distributions were intuitively demonstrated; the results can deepen the understanding of the interference mechanism of non-monochromatic light. Our study can also provide theoretical support for measuring engineering parameters with non-monochromatic light in interferometric engineering measurements.
Keywords: double-slit interference, non-monochromatic light, central wavelength, spectrum width
1. INTRODUCTIONDouble-slit interference is the most basic and
important effect in optics, which has confirmed the wave nature of light for the first time [1-7]. Through double-slit interference experiments, the wave nature of photons [8,9], electrons [2,10,11], neutrons [12] and atoms [13] is shown. When light interferes, interference fringes can be produced; these are manifested as the intensity of light or the stable distribution of lightness and darkness in space after light encounters obstacles. In essence, the interference of light is the enhancement and cancellation of a limited beam of light vibrations during superposition.
There has been continual interest in double-slit interference for over two centuries since the
double-slit experiment was first performed by Thomas Young in the early 1800s [1]. Even in the past twenty years, there have been many related studies. Ambrose et al. investigated students’ understanding of single-slit diffraction and double-slit interference [14]. Gonzalez et al. described a simple interference experiment involving scattered light using a “dusty” plane back-silvered mirror, a screen, and a laser [15]. Gondran et al. presented a numerical simulation of the double-slit interference experiment realized with ultracold atoms [16]. Frabboni et al. reported a method for demonstrating to undergraduate and graduate students the double-slit electron interference experiment using a conventional

Chiang Mai J. Sci. 2020; 47(5)1082
transmission electron microscope [17]. Atkins et al. investigated thin film interference with a digital camera [18]. Lee et al. fabricated slits for Young’s experiment using graphic arts films [19]. Hou et al. proposed a simple double-source model for interference of capillaries [20]. Rueckner et al. investigated Young’s double-slit experiment with single photons and a quantum eraser [21]. Matteucci et al. used a conventional transmission electron microscope to demonstrate the build-up of interference patterns [22]. Illarramendi et al. discussed the design of a simple experiment that reproduced the operation of the Michelson stellar interferometer [23]. Kincaid et al. presented a model of interference, dephasing, and measure-ment-induced decoherence in a one-dimensional version of the double-slit experiment [24]. Goss-man et al. studied optical interference with digital holograms [25]. Aspden et al. investigated video recording true single-photon double-slit interference [26]. Meyer detailed an instructional sequence that allowed an authentic, student-centred approach to Young’s double-slit experiment [27]. Gao et al. proposed and performed an interference exper-iment involving a distributed angular double slit and the orbital angular momentum correlations of thermal light [28]. Koopman et al. described the use of a low-cost commercial flatbed scanner in an undergraduate teaching laboratory to image large interference and diffraction patterns in two dimensions [29]. Brom et al. explored the measure-ment of the wavelength of a particle via quantum interference [30]. Jackson et al. discussed Young’s double-slit experiment using a partially coherent light source consisting of a helium-neon laser incident on a rotating piece of white paper [31].
Although double-slit interference has been widely discussed, compared with the double-slit interference of monochromatic light, a small amount of previous research work concerns the double-slit interference of non-monochro-matic light. From the spectral point of view, a wave with a single wavelength is only an ideal; in actuality, any wave has a certain spectral
width. The centre of the spectra corresponds to the central wavelength. The spectral width characterizes the monochromatism of the light source: the smaller the spectral width, the better the monochromatism. Non-monochromatic light has a certain spectral width Δλ; light with each wavelength in Δλ generates its own set of inter-ference fringes, and the actual interference fringes of non-monochromatic light are formed by the overlap and stagger of these sets of interference fringes. The light emitted by each light source cannot be light with a single wavelength but rather quasi-monochromatic light with certain wavelength range. The usual interference fringes are often obtained from such quasi-monochromatic light. Understanding the influence of the spectral width of quasi-monochromatic light on the interference is very important for engineering measurements based on the interference of light. In this paper, we explored the influence of the central wave-length and spectral width of non-monochromatic light on double-slit interference results through a simulation using MATLAB (MathWorks, Natick, USA). Through Fresnel’s double prism interference experiment, the patterns of interference with a sodium lamp, a halogen lamp, and an light-emitting diode (LED) lamp were observed. Our research can deepen the understanding of the interference mechanism of non-monochromatic light and has value as a reference for exploring the application of non-monochromatic light interference in engineering measurements.
2. PRINCIPLE AND EXPERIMENTAL METHOD OF DOUBLE-SLIT INTERFERENCE
The light path of the double-slit interference experiment is shown in Figure 1, assuming that the light emitted by the light source has a single wavelength. At point P, the interference intensity I of two coherent light waves starting from S1, S2 should be [32,33]
Chiang Mai J. Sci. Zeng J. et al
2
discussed the design of a simple experiment that reproduced the operation of the Michelson stellar interferometer [23]. Kincaid et al. presented a model of interference, dephasing, and measurement-induced decoherence in a one-dimensional version of the double-slit experiment [24]. Gossman et al. studied optical interference with digital holograms [25]. Aspden et al. investigated video recording true single-photon double-slit interference [26]. Meyer detailed an instructional sequence that allowed an authentic, student-centred approach to Young’s double-slit experiment [27]. Gao et al. proposed and performed an interference experiment involving a distributed angular double slit and the orbital angular momentum correlations of thermal light [28]. Koopman et al. described the use of a low-cost commercial flatbed scanner in an undergraduate teaching laboratory to image large interference and diffraction patterns in two dimensions [29]. Brom et al. explored the measurement of the wavelength of a particle via quantum interference [30]. Jackson et al. discussed Young’s double-slit experiment using a partially coherent light source consisting of a helium-neon laser incident on a rotating piece of white paper [31].
Although double-slit interference has been widely discussed, compared with the double-slit interference of monochromatic light, a small amount of previous research work concerns the double-slit interference of non-monochromatic light. From the spectral point of view, a wave with a single wavelength is only an ideal; in actuality, any wave has a certain spectral width. The centre of the spectra corresponds to the central wavelength. The spectral width characterizes the monochromatism of the light source: the smaller the spectral width, the better the monochromatism. Non-monochromatic light has a certain spectral width Δλ; light with each wavelength in Δλ generates its own set of interference fringes, and the actual interference fringes of non-monochromatic light are formed by the overlap and stagger of these sets of interference fringes. The light emitted by each light source cannot be light with a single wavelength but rather quasi-monochromatic light with certain wavelength range. The usual interference fringes are often obtained from such quasi-monochromatic light. Understanding the influence of the spectral width of quasi-monochromatic light on the interference is very important for engineering measurements based on the interference of light. In this paper, we explored the influence of the central wavelength and spectral width of non-monochromatic light on double-slit interference results through a simulation using MATLAB (MathWorks, Natick, USA). Through Fresnel’s double prism interference experiment, the patterns of interference with a sodium lamp, a halogen lamp, and an light-emitting diode (LED) lamp were observed. Our research can deepen the understanding of the interference mechanism of non-monochromatic light and has value as a reference for exploring the application of non-
monochromatic light interference in engineering measurements.
2. Principle and experimental method of double-slit interference
The light path of the double-slit interference experiment is shown in Fig. 1, assuming that the light emitted by the light source has a single wavelength. At point P, the interference intensity I of two coherent light waves starting from S1, S2 should be [32,33]
1 2 1 22 cosI I I I I δ= + + (1)
In Eq. (1), I1 and I2 are the intensities of two coherent light waves, and δ is the phase difference between the two coherent light waves. Since the two coherent light waves are emitted by the same light source, there is I1=I2=I0. The phase difference δ of the two light waves at point P satisfies
2 1 2 1
0
2 2( ) ( )π πδ r r r rλ λ
= − = − (2)
In Eq. (2), the meanings of r1 and r2 are shown in Fig. 1; λ and λ0 are the wavelengths of the light waves in air and a vacuum, respectively. Then
2 2 10
0
( )4 cos [ ]π r rI Iλ−
= (3)
From Eq. (3), the light intensity at point P depends mainly on the optical path difference of the two coherent light waves; the light intensity reaches a maximum and a bright fringe appears at point P when the optical path difference satisfies
2 1 0-r r r mλ∆ = = ( 0, 1, 2,......)m = ± ± (4) The light intensity reaches a minimum and a dark fringe appears at point P when the optical path difference satisfies
Fig. 1. Light path diagram of Young’s double-slit interference experiment. d is the distance between the double slits; D is the distance between the double slits and the receiving screen, D d. r1, r2 are lengths of S1P, S2P, respectively. x is the length of OP, ∆r is the optical path difference, and θ is the diffraction angle.
2 1 01- ( )2
r r r m+ λ∆ = = ( 0, 1, 2,......)m = ± ± (5)
(1)

Chiang Mai J. Sci. 2027; 47(5) 1083
In Eq. (1), I1 and I2 are the intensities of two co-herent light waves, and δ is the phase difference between the two coherent light waves. Since the two coherent light waves are emitted by the same light source, there is I1=I2=I0. The phase difference δ of the two light waves at point P satisfies
Chiang Mai J. Sci. Zeng J. et al
2
discussed the design of a simple experiment that reproduced the operation of the Michelson stellar interferometer [23]. Kincaid et al. presented a model of interference, dephasing, and measurement-induced decoherence in a one-dimensional version of the double-slit experiment [24]. Gossman et al. studied optical interference with digital holograms [25]. Aspden et al. investigated video recording true single-photon double-slit interference [26]. Meyer detailed an instructional sequence that allowed an authentic, student-centred approach to Young’s double-slit experiment [27]. Gao et al. proposed and performed an interference experiment involving a distributed angular double slit and the orbital angular momentum correlations of thermal light [28]. Koopman et al. described the use of a low-cost commercial flatbed scanner in an undergraduate teaching laboratory to image large interference and diffraction patterns in two dimensions [29]. Brom et al. explored the measurement of the wavelength of a particle via quantum interference [30]. Jackson et al. discussed Young’s double-slit experiment using a partially coherent light source consisting of a helium-neon laser incident on a rotating piece of white paper [31].
Although double-slit interference has been widely discussed, compared with the double-slit interference of monochromatic light, a small amount of previous research work concerns the double-slit interference of non-monochromatic light. From the spectral point of view, a wave with a single wavelength is only an ideal; in actuality, any wave has a certain spectral width. The centre of the spectra corresponds to the central wavelength. The spectral width characterizes the monochromatism of the light source: the smaller the spectral width, the better the monochromatism. Non-monochromatic light has a certain spectral width Δλ; light with each wavelength in Δλ generates its own set of interference fringes, and the actual interference fringes of non-monochromatic light are formed by the overlap and stagger of these sets of interference fringes. The light emitted by each light source cannot be light with a single wavelength but rather quasi-monochromatic light with certain wavelength range. The usual interference fringes are often obtained from such quasi-monochromatic light. Understanding the influence of the spectral width of quasi-monochromatic light on the interference is very important for engineering measurements based on the interference of light. In this paper, we explored the influence of the central wavelength and spectral width of non-monochromatic light on double-slit interference results through a simulation using MATLAB (MathWorks, Natick, USA). Through Fresnel’s double prism interference experiment, the patterns of interference with a sodium lamp, a halogen lamp, and an light-emitting diode (LED) lamp were observed. Our research can deepen the understanding of the interference mechanism of non-monochromatic light and has value as a reference for exploring the application of non-
monochromatic light interference in engineering measurements.
2. Principle and experimental method of double-slit interference
The light path of the double-slit interference experiment is shown in Fig. 1, assuming that the light emitted by the light source has a single wavelength. At point P, the interference intensity I of two coherent light waves starting from S1, S2 should be [32,33]
1 2 1 22 cosI I I I I δ= + + (1)
In Eq. (1), I1 and I2 are the intensities of two coherent light waves, and δ is the phase difference between the two coherent light waves. Since the two coherent light waves are emitted by the same light source, there is I1=I2=I0. The phase difference δ of the two light waves at point P satisfies
2 1 2 1
0
2 2( ) ( )π πδ r r r rλ λ
= − = − (2)
In Eq. (2), the meanings of r1 and r2 are shown in Fig. 1; λ and λ0 are the wavelengths of the light waves in air and a vacuum, respectively. Then
2 2 10
0
( )4 cos [ ]π r rI Iλ−
= (3)
From Eq. (3), the light intensity at point P depends mainly on the optical path difference of the two coherent light waves; the light intensity reaches a maximum and a bright fringe appears at point P when the optical path difference satisfies
2 1 0-r r r mλ∆ = = ( 0, 1, 2,......)m = ± ± (4) The light intensity reaches a minimum and a dark fringe appears at point P when the optical path difference satisfies
Fig. 1. Light path diagram of Young’s double-slit interference experiment. d is the distance between the double slits; D is the distance between the double slits and the receiving screen, D d. r1, r2 are lengths of S1P, S2P, respectively. x is the length of OP, ∆r is the optical path difference, and θ is the diffraction angle.
2 1 01- ( )2
r r r m+ λ∆ = = ( 0, 1, 2,......)m = ± ± (5)
(2)
In Eq. (2), the meanings of r1 and r2 are shown in Figure 1; λ and λ0 are the wavelengths of the light waves in air and a vacuum, respectively. Then
Chiang Mai J. Sci. Zeng J. et al
2
discussed the design of a simple experiment that reproduced the operation of the Michelson stellar interferometer [23]. Kincaid et al. presented a model of interference, dephasing, and measurement-induced decoherence in a one-dimensional version of the double-slit experiment [24]. Gossman et al. studied optical interference with digital holograms [25]. Aspden et al. investigated video recording true single-photon double-slit interference [26]. Meyer detailed an instructional sequence that allowed an authentic, student-centred approach to Young’s double-slit experiment [27]. Gao et al. proposed and performed an interference experiment involving a distributed angular double slit and the orbital angular momentum correlations of thermal light [28]. Koopman et al. described the use of a low-cost commercial flatbed scanner in an undergraduate teaching laboratory to image large interference and diffraction patterns in two dimensions [29]. Brom et al. explored the measurement of the wavelength of a particle via quantum interference [30]. Jackson et al. discussed Young’s double-slit experiment using a partially coherent light source consisting of a helium-neon laser incident on a rotating piece of white paper [31].
Although double-slit interference has been widely discussed, compared with the double-slit interference of monochromatic light, a small amount of previous research work concerns the double-slit interference of non-monochromatic light. From the spectral point of view, a wave with a single wavelength is only an ideal; in actuality, any wave has a certain spectral width. The centre of the spectra corresponds to the central wavelength. The spectral width characterizes the monochromatism of the light source: the smaller the spectral width, the better the monochromatism. Non-monochromatic light has a certain spectral width Δλ; light with each wavelength in Δλ generates its own set of interference fringes, and the actual interference fringes of non-monochromatic light are formed by the overlap and stagger of these sets of interference fringes. The light emitted by each light source cannot be light with a single wavelength but rather quasi-monochromatic light with certain wavelength range. The usual interference fringes are often obtained from such quasi-monochromatic light. Understanding the influence of the spectral width of quasi-monochromatic light on the interference is very important for engineering measurements based on the interference of light. In this paper, we explored the influence of the central wavelength and spectral width of non-monochromatic light on double-slit interference results through a simulation using MATLAB (MathWorks, Natick, USA). Through Fresnel’s double prism interference experiment, the patterns of interference with a sodium lamp, a halogen lamp, and an light-emitting diode (LED) lamp were observed. Our research can deepen the understanding of the interference mechanism of non-monochromatic light and has value as a reference for exploring the application of non-
monochromatic light interference in engineering measurements.
2. Principle and experimental method of double-slit interference
The light path of the double-slit interference experiment is shown in Fig. 1, assuming that the light emitted by the light source has a single wavelength. At point P, the interference intensity I of two coherent light waves starting from S1, S2 should be [32,33]
1 2 1 22 cosI I I I I δ= + + (1)
In Eq. (1), I1 and I2 are the intensities of two coherent light waves, and δ is the phase difference between the two coherent light waves. Since the two coherent light waves are emitted by the same light source, there is I1=I2=I0. The phase difference δ of the two light waves at point P satisfies
2 1 2 1
0
2 2( ) ( )π πδ r r r rλ λ
= − = − (2)
In Eq. (2), the meanings of r1 and r2 are shown in Fig. 1; λ and λ0 are the wavelengths of the light waves in air and a vacuum, respectively. Then
2 2 10
0
( )4 cos [ ]π r rI Iλ−
= (3)
From Eq. (3), the light intensity at point P depends mainly on the optical path difference of the two coherent light waves; the light intensity reaches a maximum and a bright fringe appears at point P when the optical path difference satisfies
2 1 0-r r r mλ∆ = = ( 0, 1, 2,......)m = ± ± (4) The light intensity reaches a minimum and a dark fringe appears at point P when the optical path difference satisfies
Fig. 1. Light path diagram of Young’s double-slit interference experiment. d is the distance between the double slits; D is the distance between the double slits and the receiving screen, D d. r1, r2 are lengths of S1P, S2P, respectively. x is the length of OP, ∆r is the optical path difference, and θ is the diffraction angle.
2 1 01- ( )2
r r r m+ λ∆ = = ( 0, 1, 2,......)m = ± ± (5)
(3)
From Eq. (3), the light intensity at point P depends mainly on the optical path difference of the two coherent light waves; the light intensity reaches a maximum and a bright fringe appears at point P when the optical path difference satisfies
Chiang Mai J. Sci. Zeng J. et al
2
discussed the design of a simple experiment that reproduced the operation of the Michelson stellar interferometer [23]. Kincaid et al. presented a model of interference, dephasing, and measurement-induced decoherence in a one-dimensional version of the double-slit experiment [24]. Gossman et al. studied optical interference with digital holograms [25]. Aspden et al. investigated video recording true single-photon double-slit interference [26]. Meyer detailed an instructional sequence that allowed an authentic, student-centred approach to Young’s double-slit experiment [27]. Gao et al. proposed and performed an interference experiment involving a distributed angular double slit and the orbital angular momentum correlations of thermal light [28]. Koopman et al. described the use of a low-cost commercial flatbed scanner in an undergraduate teaching laboratory to image large interference and diffraction patterns in two dimensions [29]. Brom et al. explored the measurement of the wavelength of a particle via quantum interference [30]. Jackson et al. discussed Young’s double-slit experiment using a partially coherent light source consisting of a helium-neon laser incident on a rotating piece of white paper [31].
Although double-slit interference has been widely discussed, compared with the double-slit interference of monochromatic light, a small amount of previous research work concerns the double-slit interference of non-monochromatic light. From the spectral point of view, a wave with a single wavelength is only an ideal; in actuality, any wave has a certain spectral width. The centre of the spectra corresponds to the central wavelength. The spectral width characterizes the monochromatism of the light source: the smaller the spectral width, the better the monochromatism. Non-monochromatic light has a certain spectral width Δλ; light with each wavelength in Δλ generates its own set of interference fringes, and the actual interference fringes of non-monochromatic light are formed by the overlap and stagger of these sets of interference fringes. The light emitted by each light source cannot be light with a single wavelength but rather quasi-monochromatic light with certain wavelength range. The usual interference fringes are often obtained from such quasi-monochromatic light. Understanding the influence of the spectral width of quasi-monochromatic light on the interference is very important for engineering measurements based on the interference of light. In this paper, we explored the influence of the central wavelength and spectral width of non-monochromatic light on double-slit interference results through a simulation using MATLAB (MathWorks, Natick, USA). Through Fresnel’s double prism interference experiment, the patterns of interference with a sodium lamp, a halogen lamp, and an light-emitting diode (LED) lamp were observed. Our research can deepen the understanding of the interference mechanism of non-monochromatic light and has value as a reference for exploring the application of non-
monochromatic light interference in engineering measurements.
2. Principle and experimental method of double-slit interference
The light path of the double-slit interference experiment is shown in Fig. 1, assuming that the light emitted by the light source has a single wavelength. At point P, the interference intensity I of two coherent light waves starting from S1, S2 should be [32,33]
1 2 1 22 cosI I I I I δ= + + (1)
In Eq. (1), I1 and I2 are the intensities of two coherent light waves, and δ is the phase difference between the two coherent light waves. Since the two coherent light waves are emitted by the same light source, there is I1=I2=I0. The phase difference δ of the two light waves at point P satisfies
2 1 2 1
0
2 2( ) ( )π πδ r r r rλ λ
= − = − (2)
In Eq. (2), the meanings of r1 and r2 are shown in Fig. 1; λ and λ0 are the wavelengths of the light waves in air and a vacuum, respectively. Then
2 2 10
0
( )4 cos [ ]π r rI Iλ−
= (3)
From Eq. (3), the light intensity at point P depends mainly on the optical path difference of the two coherent light waves; the light intensity reaches a maximum and a bright fringe appears at point P when the optical path difference satisfies
2 1 0-r r r mλ∆ = = ( 0, 1, 2,......)m = ± ± (4) The light intensity reaches a minimum and a dark fringe appears at point P when the optical path difference satisfies
Fig. 1. Light path diagram of Young’s double-slit interference experiment. d is the distance between the double slits; D is the distance between the double slits and the receiving screen, D d. r1, r2 are lengths of S1P, S2P, respectively. x is the length of OP, ∆r is the optical path difference, and θ is the diffraction angle.
2 1 01- ( )2
r r r m+ λ∆ = = ( 0, 1, 2,......)m = ± ± (5)
(4)
The light intensity reaches a minimum and a dark
fringe appears at point P when the optical path difference satisfies
Chiang Mai J. Sci. Zeng J. et al
2
discussed the design of a simple experiment that reproduced the operation of the Michelson stellar interferometer [23]. Kincaid et al. presented a model of interference, dephasing, and measurement-induced decoherence in a one-dimensional version of the double-slit experiment [24]. Gossman et al. studied optical interference with digital holograms [25]. Aspden et al. investigated video recording true single-photon double-slit interference [26]. Meyer detailed an instructional sequence that allowed an authentic, student-centred approach to Young’s double-slit experiment [27]. Gao et al. proposed and performed an interference experiment involving a distributed angular double slit and the orbital angular momentum correlations of thermal light [28]. Koopman et al. described the use of a low-cost commercial flatbed scanner in an undergraduate teaching laboratory to image large interference and diffraction patterns in two dimensions [29]. Brom et al. explored the measurement of the wavelength of a particle via quantum interference [30]. Jackson et al. discussed Young’s double-slit experiment using a partially coherent light source consisting of a helium-neon laser incident on a rotating piece of white paper [31].
Although double-slit interference has been widely discussed, compared with the double-slit interference of monochromatic light, a small amount of previous research work concerns the double-slit interference of non-monochromatic light. From the spectral point of view, a wave with a single wavelength is only an ideal; in actuality, any wave has a certain spectral width. The centre of the spectra corresponds to the central wavelength. The spectral width characterizes the monochromatism of the light source: the smaller the spectral width, the better the monochromatism. Non-monochromatic light has a certain spectral width Δλ; light with each wavelength in Δλ generates its own set of interference fringes, and the actual interference fringes of non-monochromatic light are formed by the overlap and stagger of these sets of interference fringes. The light emitted by each light source cannot be light with a single wavelength but rather quasi-monochromatic light with certain wavelength range. The usual interference fringes are often obtained from such quasi-monochromatic light. Understanding the influence of the spectral width of quasi-monochromatic light on the interference is very important for engineering measurements based on the interference of light. In this paper, we explored the influence of the central wavelength and spectral width of non-monochromatic light on double-slit interference results through a simulation using MATLAB (MathWorks, Natick, USA). Through Fresnel’s double prism interference experiment, the patterns of interference with a sodium lamp, a halogen lamp, and an light-emitting diode (LED) lamp were observed. Our research can deepen the understanding of the interference mechanism of non-monochromatic light and has value as a reference for exploring the application of non-
monochromatic light interference in engineering measurements.
2. Principle and experimental method of double-slit interference
The light path of the double-slit interference experiment is shown in Fig. 1, assuming that the light emitted by the light source has a single wavelength. At point P, the interference intensity I of two coherent light waves starting from S1, S2 should be [32,33]
1 2 1 22 cosI I I I I δ= + + (1)
In Eq. (1), I1 and I2 are the intensities of two coherent light waves, and δ is the phase difference between the two coherent light waves. Since the two coherent light waves are emitted by the same light source, there is I1=I2=I0. The phase difference δ of the two light waves at point P satisfies
2 1 2 1
0
2 2( ) ( )π πδ r r r rλ λ
= − = − (2)
In Eq. (2), the meanings of r1 and r2 are shown in Fig. 1; λ and λ0 are the wavelengths of the light waves in air and a vacuum, respectively. Then
2 2 10
0
( )4 cos [ ]π r rI Iλ−
= (3)
From Eq. (3), the light intensity at point P depends mainly on the optical path difference of the two coherent light waves; the light intensity reaches a maximum and a bright fringe appears at point P when the optical path difference satisfies
2 1 0-r r r mλ∆ = = ( 0, 1, 2,......)m = ± ± (4) The light intensity reaches a minimum and a dark fringe appears at point P when the optical path difference satisfies
Fig. 1. Light path diagram of Young’s double-slit interference experiment. d is the distance between the double slits; D is the distance between the double slits and the receiving screen, D d. r1, r2 are lengths of S1P, S2P, respectively. x is the length of OP, ∆r is the optical path difference, and θ is the diffraction angle.
2 1 01- ( )2
r r r m+ λ∆ = = ( 0, 1, 2,......)m = ± ± (5) (5)
When the illuminating light is non-mono-chromatic light, because each wavelength of light that comprises the non-monochromatic light produces an its own interference light field, the interference fringes with different wavelengths have different line spacings with their central maximum fringes at the same position. Whereas the higher order fringes overlap to various extent. Supposing that the wavelength range of the light source is [λ, λ+Δλ], at a certain optical path difference, the (m+1)th-level fringe with a wavelength λ coincides with the mth-level fringe with a wavelength λ+Δλ, that is, the two wave-lengths’ fringes move the spacing of one fringe relatively. At this moment, the zone between the mth-level fringe and the (m-1)th-level fringe of the wavelength λ+Δλ is covered with fringes of other wavelengths in the wavelength range of [λ, λ+Δλ], where light intensities are equal and
Figure 1. Light path diagram of Young’s double-slit interference experiment. d is the distance between the double slits; D is the distance between the double slits and the receiving screen, D>>d. r1, r2 are lengths of S1P, S2P, respectively. x is the length of OP, ∆r is the optical path difference, and θ is the diffraction angle.

Chiang Mai J. Sci. 2020; 47(5)1084
interference fringes disappear; the corresponding optical path difference is the maximum optical path difference ∆rmax at which interference can happen, that is, the coherent length Lc, and where the optical path difference satisfies [34]
Chiang Mai J. Sci. Zeng J. et al
3
When the illuminating light is non-monochromatic light, because each wavelength of light that comprises the non-monochromatic light produces an its own interference light field, the interference fringes with different wavelengths have different line spacings with their central maximum fringes at the same position. Whereas the higher order fringes overlap to various extent. Supposing that the wavelength range of the light source is [λ, λ+Δλ], at a certain optical path difference, the (m+1)th-level fringe with a wavelength λ coincides with the mth-level fringe with a wavelength λ+Δλ, that is, the two wavelengths’ fringes move the spacing of one fringe relatively. At this moment, the zone between the mth-level fringe and the (m-1)th-level fringe of the wavelength λ+Δλ is covered with fringes of other wavelengths in the wavelength range of [λ, λ+Δλ], where light intensities are equal and interference fringes disappear; the corresponding optical path difference is the maximum optical path difference ∆rmax at which interference can happen, that is, the coherent length Lc, and where the optical path difference satisfies [34] ( ) ( )m λ m λ λ+ = + ∆1 (6) Then, the interference level of the place can be obtained as follows
λmλ
=∆
(7)
Therefore, the maximum optical path difference ∆rmax or the coherent length Lc is
2
max cλr L mλλ
=∆ = =∆
(8)
The coherent length describes the longitudinal spatial coherence of the light source, which is equal to the maximum spatial interval that can make the light waves coherent at two different points in the direction of light propagation. This space interval is actually the length of the wave train emitted by the light source, which is proportional to the coherence time. The coherence length and coherence time of the light source reflect the quality of the monochromatic performance of light source. Eq. (8) shows that the maximum optical path is inversely proportional to the wavelength width of the light source. The smaller the wavelength width of the light source, greater the optical path difference at which interference fringes can be observed.
In our simulation with MATLAB, different wavelengths of non-monochromatic light are classified and superimposed. Approximately eleven spectra are selected. For calculating the light intensity, the light intensities of the eleven spectra are superimposed and averaged.
The light path diagram of the Fresnel-double-prism
Fig. 2. The light path diagram of the Fresnel-double-prism interference experiment.
experiment is shown in Fig. 2. The double prism is composed of two right-angle prisms with very small refractive angles. The light emitted from the point light source S is refracted twice by the double prism to form two coherent light beams, which are effectively emitted from the virtual light sources S1 and S2, with the same frequency, the same vibration direction, and a constant phase difference at the meeting point. During the propagation, the interference happens in the overlapping part in Fig. 2. If screen Π is placed anywhere in the interference area, brightness-darkness alternating interference fringes can be seen on the screen. The Fresnel double prism is an improvement of Yang’s interference, and S1 and S2 are equivalent to double holes in Yang’s interference experiment. In practice, the slit width of a man-made double slit is often too large to obtain the ideal interference fringe, and the diffraction pattern of two single slits, even the result of light travelling in straight lines through two slits, is often obtained. In other words, the ideal man-made double slit with a narrow slit width is difficult to fabricate. However, two virtual light sources can be produced using the double prism, which well satisfies the condition of two-slit interference, and the ideal interference result can be obtained. Therefore, we use a double-prism interference experiment to explore the phenomenon of double-slit interference.
3. Simulation and experimental observation of double-slit interference of non-monochromatic light
3.1 Comparison of double-slit interference of monochromatic and non-monochromatic light
To compare double-slit interference of monochromatic and non-monochromatic light, we first carried out the Fresnel-double-prism interference experiment by using a sodium lamp a s t h e l i g h t s o u r c e . W e o b s e r v e d a g o o d
(6)
Then, the interference level of the place can be obtained as follows
Chiang Mai J. Sci. Zeng J. et al
3
When the illuminating light is non-monochromatic light, because each wavelength of light that comprises the non-monochromatic light produces an its own interference light field, the interference fringes with different wavelengths have different line spacings with their central maximum fringes at the same position. Whereas the higher order fringes overlap to various extent. Supposing that the wavelength range of the light source is [λ, λ+Δλ], at a certain optical path difference, the (m+1)th-level fringe with a wavelength λ coincides with the mth-level fringe with a wavelength λ+Δλ, that is, the two wavelengths’ fringes move the spacing of one fringe relatively. At this moment, the zone between the mth-level fringe and the (m-1)th-level fringe of the wavelength λ+Δλ is covered with fringes of other wavelengths in the wavelength range of [λ, λ+Δλ], where light intensities are equal and interference fringes disappear; the corresponding optical path difference is the maximum optical path difference ∆rmax at which interference can happen, that is, the coherent length Lc, and where the optical path difference satisfies [34] ( ) ( )m λ m λ λ+ = + ∆1 (6) Then, the interference level of the place can be obtained as follows
λmλ
=∆
(7)
Therefore, the maximum optical path difference ∆rmax or the coherent length Lc is
2
max cλr L mλλ
=∆ = =∆
(8)
The coherent length describes the longitudinal spatial coherence of the light source, which is equal to the maximum spatial interval that can make the light waves coherent at two different points in the direction of light propagation. This space interval is actually the length of the wave train emitted by the light source, which is proportional to the coherence time. The coherence length and coherence time of the light source reflect the quality of the monochromatic performance of light source. Eq. (8) shows that the maximum optical path is inversely proportional to the wavelength width of the light source. The smaller the wavelength width of the light source, greater the optical path difference at which interference fringes can be observed.
In our simulation with MATLAB, different wavelengths of non-monochromatic light are classified and superimposed. Approximately eleven spectra are selected. For calculating the light intensity, the light intensities of the eleven spectra are superimposed and averaged.
The light path diagram of the Fresnel-double-prism
Fig. 2. The light path diagram of the Fresnel-double-prism interference experiment.
experiment is shown in Fig. 2. The double prism is composed of two right-angle prisms with very small refractive angles. The light emitted from the point light source S is refracted twice by the double prism to form two coherent light beams, which are effectively emitted from the virtual light sources S1 and S2, with the same frequency, the same vibration direction, and a constant phase difference at the meeting point. During the propagation, the interference happens in the overlapping part in Fig. 2. If screen Π is placed anywhere in the interference area, brightness-darkness alternating interference fringes can be seen on the screen. The Fresnel double prism is an improvement of Yang’s interference, and S1 and S2 are equivalent to double holes in Yang’s interference experiment. In practice, the slit width of a man-made double slit is often too large to obtain the ideal interference fringe, and the diffraction pattern of two single slits, even the result of light travelling in straight lines through two slits, is often obtained. In other words, the ideal man-made double slit with a narrow slit width is difficult to fabricate. However, two virtual light sources can be produced using the double prism, which well satisfies the condition of two-slit interference, and the ideal interference result can be obtained. Therefore, we use a double-prism interference experiment to explore the phenomenon of double-slit interference.
3. Simulation and experimental observation of double-slit interference of non-monochromatic light
3.1 Comparison of double-slit interference of monochromatic and non-monochromatic light
To compare double-slit interference of monochromatic and non-monochromatic light, we first carried out the Fresnel-double-prism interference experiment by using a sodium lamp a s t h e l i g h t s o u r c e . W e o b s e r v e d a g o o d
(7)
Therefore, the maximum optical path difference ∆rmax or the coherent length Lc is
Chiang Mai J. Sci. Zeng J. et al
3
When the illuminating light is non-monochromatic light, because each wavelength of light that comprises the non-monochromatic light produces an its own interference light field, the interference fringes with different wavelengths have different line spacings with their central maximum fringes at the same position. Whereas the higher order fringes overlap to various extent. Supposing that the wavelength range of the light source is [λ, λ+Δλ], at a certain optical path difference, the (m+1)th-level fringe with a wavelength λ coincides with the mth-level fringe with a wavelength λ+Δλ, that is, the two wavelengths’ fringes move the spacing of one fringe relatively. At this moment, the zone between the mth-level fringe and the (m-1)th-level fringe of the wavelength λ+Δλ is covered with fringes of other wavelengths in the wavelength range of [λ, λ+Δλ], where light intensities are equal and interference fringes disappear; the corresponding optical path difference is the maximum optical path difference ∆rmax at which interference can happen, that is, the coherent length Lc, and where the optical path difference satisfies [34] ( ) ( )m λ m λ λ+ = + ∆1 (6) Then, the interference level of the place can be obtained as follows
λmλ
=∆
(7)
Therefore, the maximum optical path difference ∆rmax or the coherent length Lc is
2
max cλr L mλλ
=∆ = =∆
(8)
The coherent length describes the longitudinal spatial coherence of the light source, which is equal to the maximum spatial interval that can make the light waves coherent at two different points in the direction of light propagation. This space interval is actually the length of the wave train emitted by the light source, which is proportional to the coherence time. The coherence length and coherence time of the light source reflect the quality of the monochromatic performance of light source. Eq. (8) shows that the maximum optical path is inversely proportional to the wavelength width of the light source. The smaller the wavelength width of the light source, greater the optical path difference at which interference fringes can be observed.
In our simulation with MATLAB, different wavelengths of non-monochromatic light are classified and superimposed. Approximately eleven spectra are selected. For calculating the light intensity, the light intensities of the eleven spectra are superimposed and averaged.
The light path diagram of the Fresnel-double-prism
Fig. 2. The light path diagram of the Fresnel-double-prism interference experiment.
experiment is shown in Fig. 2. The double prism is composed of two right-angle prisms with very small refractive angles. The light emitted from the point light source S is refracted twice by the double prism to form two coherent light beams, which are effectively emitted from the virtual light sources S1 and S2, with the same frequency, the same vibration direction, and a constant phase difference at the meeting point. During the propagation, the interference happens in the overlapping part in Fig. 2. If screen Π is placed anywhere in the interference area, brightness-darkness alternating interference fringes can be seen on the screen. The Fresnel double prism is an improvement of Yang’s interference, and S1 and S2 are equivalent to double holes in Yang’s interference experiment. In practice, the slit width of a man-made double slit is often too large to obtain the ideal interference fringe, and the diffraction pattern of two single slits, even the result of light travelling in straight lines through two slits, is often obtained. In other words, the ideal man-made double slit with a narrow slit width is difficult to fabricate. However, two virtual light sources can be produced using the double prism, which well satisfies the condition of two-slit interference, and the ideal interference result can be obtained. Therefore, we use a double-prism interference experiment to explore the phenomenon of double-slit interference.
3. Simulation and experimental observation of double-slit interference of non-monochromatic light
3.1 Comparison of double-slit interference of monochromatic and non-monochromatic light
To compare double-slit interference of monochromatic and non-monochromatic light, we first carried out the Fresnel-double-prism interference experiment by using a sodium lamp a s t h e l i g h t s o u r c e . W e o b s e r v e d a g o o d
(8)
The coherent length describes the longitudinal spatial coherence of the light source, which is equal to the maximum spatial interval that can make the light waves coherent at two different points in the direction of light propagation. This space interval is actually the length of the wave train emitted by the light source, which is proportional to the coherence time. The coherence length and
coherence time of the light source reflect the quality of the monochromatic performance of light source. Eq. (8) shows that the maximum optical path is inversely proportional to the wavelength width of the light source. The smaller the wavelength width of the light source, greater the optical path difference at which interference fringes can be observed.
In our simulation with MATLAB, different wavelengths of non-monochromatic light are classified and superimposed. Approximately eleven spectra are selected. For calculating the light intensity, the light intensities of the eleven spectra are superimposed and averaged.
The light path diagram of the Fresnel-double-prism experiment is shown in Figure 2. The double prism is composed of two right-angle prisms with very small refractive angles. The light emitted from the point light source S is refracted twice by the double prism to form two coherent light beams, which are effectively emitted from the virtual light sources S1 and S2, with the same frequency, the same vibration direction, and a constant phase difference at the meeting point. During the propagation, the interference happens in the overlapping part in Figure 2. If screen Π is placed anywhere in the
Figure 2. The light path diagram of the Fresnel-double-prism interference experiment.

Chiang Mai J. Sci. 2027; 47(5) 1085
interference area, brightness-darkness alternating interference fringes can be seen on the screen. The Fresnel double prism is an improvement of Yang’s interference, and S1 and S2 are equivalent to double holes in Yang’s interference experiment. In practice, the slit width of a man-made double slit is often too large to obtain the ideal interference fringe, and the diffraction pattern of two single slits, even the result of light travelling in straight lines through two slits, is often obtained. In other words, the ideal man-made double slit with a narrow slit width is difficult to fabricate. However, two virtual light sources can be produced using the double prism, which well satisfies the condition of two-slit interference, and the ideal interfer-ence result can be obtained. Therefore, we use a double-prism interference experiment to explore the phenomenon of double-slit interference.
3. SIMULATION AND EXPERIMENTAL OBSER-VATION OF DOUBLE-SLIT INTERFERENCE OF NON-MONOCHROMATIC LIGHT3.1 Comparison of Double-slit Interference of Monochromatic and Non-monochromatic Light
To compare double-slit interference of monochromatic and non-monochromatic light, we first carried out the Fresnel-double-prism interference experiment by using a sodium lamp as the light source. We observed a good monochromatic light interference fringe, as shown in Figure 3a. At the same time, based on MATLAB, a simulation was carried out by using the parameters in the experiment. The simulation result was consistent with the experimental result, as shown in Figure 3b.
Figure 3. Comparison of double-slit interference of monochromatic light and non-monochromatic light. (a) Experimental result of double-slit interference with a sodium lamp. For (b) and (d), the upper part is the interference fringe, and the lower part is the corresponding light intensity distribution. (c) Influence of light source non-monochromaticity on the fringe.

Chiang Mai J. Sci. 2020; 47(5)1086
Figure 4. Double-slit interference fringes of non-monochromatic light with a halogen lamp as the light source.
Then, we simulated the distribution of light intensity with wavelengths of λ = 575 nm and λ+Δλ= 605 nm, which are represented by the solid and dotted lines in the lower half of Figure 3c, respectively. The upper half of Figure 3c shows the light intensity distribution after the overlap of all light waves; we can see the light intensity decreases with increasing optical path difference and becomes zero at certain optical path difference, that is, the fringe disappears.
We simulated the interference field of non-monochromatic light with a wavelength range of 540 nm - 640 nm. The result of the simulation is shown in Figure 3d, and the fringes become blurred from the fifth interference level, confirming the result obtained via the calculation given by Eq. (7).
3.2 Double-slit Interference of Non-mono-chromatic Light with a Halogen Lamp as the Light Source
To further investigate the interference of non-monochromatic light, we used a halogen lamp as the light source in the double-prism in-terference experiment to obtain the interference pattern, as shown in Figure 4. The experimental
result shows the multi-colour fringes which is due to the overlap of the interference multi-wave-length fringes. With increasing fringe level, the fringe contrast decreases, and the fringe ultimately disappears. In Figure 4, starting with the central bright fringe, we can clearly see and distinguish the alternation of bright and dark stripes three times; after that, the pattern becomes coloured, and we cannot tell the difference.
Since the light emitted by the halogen lamp is yellow, we simulated interference fringes of non-monochromatic light with different spectral widths at the central wavelength of 585 nm; the result is shown in Figure 5. Starting with the central bright fringe, in Figure 5a, we can clearly see and distinguish the alternation of bright and dark stripes nine times. In Figure 5b, we can clearly see and distinguish the alternation of bright and dark stripes five times. In Figure 5c, we can clearly see and distinguish the alternation of bright and dark stripes three times. In Figure 5d, we can clearly see and distinguish the alternation of bright and dark stripes twice. The widths of the clear bright and dark fringes in Figures 4 and 5c is identical, in other words, the result in Figure 5c is closest to the result in Figure 4. Therefore, we can provide

Chiang Mai J. Sci. 2027; 47(5) 1087
Chiang Mai J. Sci. Zeng J. et al
4
Fig. 3. Comparison of double-slit interference of monochromatic light and non-monochromatic light. (a) Experimental result of double-slit interference with a sodium lamp. For (b) and (d), the upper part is the interference fringe, and the lower part is the corresponding light intensity distribution. (c) Influence of light source non-monochromaticity on the fringe.
monochromatic light interference fringe, as shown in Fig. 3a. At the same time, based on MATLAB, a simulation was carried out by using the parameters in the experiment. The simulation result was consistent with the experimental result, as shown in Fig. 3b.
Then, we simulated the distribution of light intensity with wavelengths of 575λ = nm and 605λ λ+ ∆ = nm, which are represented by the solid and dotted lines in the lower half of Fig. 3c, respectively. The upper half of Fig. 3c shows the light intensity distribution after the overlap of all light waves; we can see the light intensity decreases with increasing optical path difference and becomes zero at certain optical path difference, that is, the fringe disappears.
We simulated the interference field of non-monochromatic light with a wavelength range of 540 nm - 640 nm. The result of the simulation is shown in Fig. 3d, and the fringes become blurred from the fifth interference level, confirming the result obtained via the calculation given by Eq. (7).
3.2 Double-slit interference of non-monochromatic light with a halogen lamp as the light source
To further investigate the interference of non-monochromatic light, we used a halogen lamp as the light source in the double-prism interference experiment to obtain the interference pattern, as shown in Fig. 4. The experimental result shows the multi-colour fringes which is due to the overlap of the interference multi-wavelength fringes. With increasing fringe level, the fringe contrast decreases, and the fringe ultimately disappears. In Fig. 4, starting with the central bright fringe, we can clearly see and distinguish the alternation
of bright and dark stripes three times; after that, the pattern becomes coloured, and we cannot tell the difference.
Since the light emitted by the halogen lamp is yellow, we simulated interference fringes of non-monochromatic light with different spectral widths at the central wavelength of 585 nm; the result is shown in Fig. 5. Starting with the central bright fringe, in Fig. 5a, we can clearly see and distinguish the alternation of bright and dark stripes nine times. In Fig. 5b, we can clearly see and distinguish the alternation of bright and dark stripes five times. In Fig. 5c, we can clearly see and distinguish the alternation of bright and dark stripes three times. In Fig. 5d, we can clearly see and distinguish the alternation of bright and dark stripes twice. The widths of the clear bright and dark fringes in Figs. 4 and 5c is identical, in other words, the result in Fig. 5c is closest to the result in Fig. 4. Therefore, we can provide a rough estimate that the wavelength range of light emitted by the halogen lamp is 485 - 685 nm. In addition, the same estimate can be obtained by clearly identifying the number of maxima and minima that can be clearly distinguished in Fig. 5e-5h.
Fig. 4. Double-slit interference fringes of non-monochromatic light with a halogen lamp as the light source.
Fig. 5. Simulation results of double-slit interference of non-monochromatic light with a central wavelength of 585 nm. (a) and (e) are the interference fringe and the corresponding distribution of light intensity for spectral width from 535 nm - 635 nm; (b) and (f) are the interference fringe and the corresponding distribution of light intensity for spectral width from 510 nm - 660 nm; (c) and (g) are the interference fringe and the corresponding distribution of light intensity for spectral width from 485 nm - 685 nm; (d) and (h) are the interference fringe and the corresponding distribution of light intensity for spectral width from 460 nm - 710 nm.
3.3 Double-slit interference of non-monochromatic light with an LED lamp as the light source
Figure 5. Simulation results of double-slit interference of non-monochromatic light with a central wavelength of 585 nm. (a) and (e) are the interference fringe and the corresponding distribution of light intensity for spectral width from 535 nm - 635 nm; (b) and (f) are the interference fringe and the corresponding distribution of light intensity for spectral width from 510 nm - 660 nm; (c) and (g) are the interference fringe and the corresponding distribution of light intensity for spectral width from 485 nm - 685 nm; (d) and (h) are the interference fringe and the corresponding distribution of light intensity for spectral width from 460 nm - 710 nm.
a rough estimate that the wavelength range of light emitted by the halogen lamp is 485 - 685 nm. In addition, the same estimate can be obtained by clearly identifying the number of maxima and minima that can be clearly distinguished in Figure 5e-5h.
3.3 Double-slit Interference of Non-mono-chromatic Light with an LED Lamp as the Light Source
Replacing the halogen lamp with an LED lamp that emits white light, we observed the interference pattern of the double-slit interference experiment, as shown in Figure 6. White light is a
Figure 6. Interference pattern of the double-slit interference experiment with an LED lamp as the light source.

Chiang Mai J. Sci. 2020; 47(5)1088
composition of light with different wavelengths. We assumed the central wavelength of the white light that the LED lamp emits can be considered to be 500 nm, and then we simulated the white light interference, as shown in Figure 7.
From Figure 6, it can be observed that the interference fringes from the first stage have become blurred, starting with the central bright fringe; we can only clearly see and distinguish the alternation of bright and dark stripes twice in Figure 6. In Figure 7a, we can clearly see and distinguish the alternation of bright and dark stripes nine times. In Figure 7b, we can clearly see and distinguish the alternation of bright and dark stripes seven times. In Figure 7c, we can clearly see and distinguish the alternation of bright and dark stripes four times. In Figure 7d, we can clearly see and distinguish the alternation of bright and dark stripes twice. The widths of the clear bright and dark fringes in Figures 6 and 7d is identical, in other words, the result in Figure
7d is closest to the result in Figure 6. Therefore, we can give a rough estimate that the wavelength range of light emitted by the LED lamp is 400 nm - 600 nm. In addition, the same estimate can be obtained by clearly identifying the number of maxima and minima that can be distinguished clearly in Figure 7e-7h.
3.4 Effect of the Central Wavelength and Spectral Width on Double-slit Interference of Non-monochromatic Light
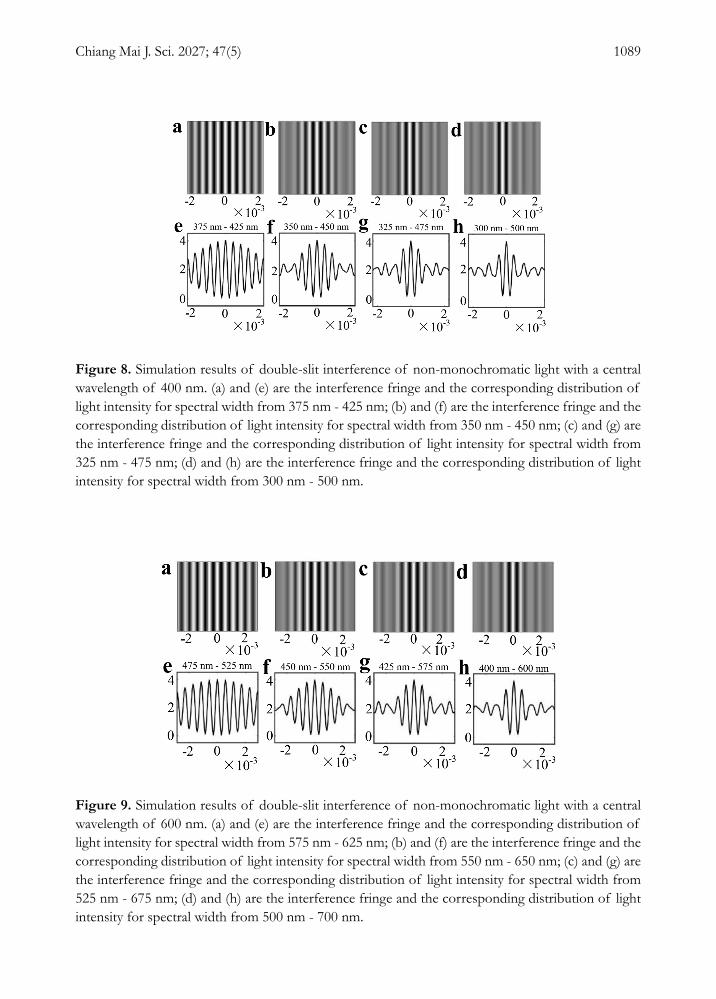
To investigate the effect of the central wave-length and spectral width on double-slit interference of non- monochromatic light, through changing the spectral width, we simulated the interference of non-monochromatic light with central wave-lengths of 400 nm and 600 nm, respectively, as shown in Figures 8 and 9.
Comparing the simulation results in Figures 8, 7 and 9, such as Figures 8c, 7c and 9c (or Figures 8g, 7g and 9g), corresponding to a spectral width
Chiang Mai J. Sci. Zeng J. et al
5
Replacing the halogen lamp with an LED lamp that emits white light, we observed the interference pattern of the double-slit interference experiment, as shown in Fig. 6. White light is a composition of light with different wavelengths. We assumed the central wavelength of the white light that the LED lamp emits can be considered to be 500 nm, and then we simulated the white light interference, as shown in Fig. 7.
From Fig. 6, it can be observed that the interference fringes from the first stage have become blurred, starting with the central bright fringe; we can only clearly see and distinguish the alternation of bright and dark stripes twice in Fig. 6. In Fig. 7a, we can clearly see and distinguish the alternation of bright and dark stripes nine times. In Fig. 7b, we can clearly see and distinguish the alternation of bright and dark stripes seven times. In Fig. 7c, we can clearly see and distinguish the alternation of bright and dark stripes four times. In Fig. 7d, we c a n c l e a r l y s e e a n d d i s t i n g u i s h t h e
Fig. 6. Interference pattern of the double-slit interference experiment with an LED lamp as the light source.
Fig. 7. Simulation results of double-slit interference of non-monochromatic light with a central wavelength of 500 nm. (a) and (e) are the interference fringe and the corresponding distribution of light intensity for spectral width from 475 nm - 525 nm; (b) and (f) are the interference fringe and the corresponding distribution of light intensity for spectral width from 450 nm - 550 nm; (c) and (g) are the interference fringe and the corresponding distribution of light intensity for spectral width from 425 nm - 575 nm; (d) and (h) are the interference fringe and the corresponding distribution of light intensity for spectral width from 400 nm - 600 nm. alternation of bright and dark stripes twice. The widths of the clear bright and dark fringes in Figs. 6 and 7d is identical, in other words, the result in Fig. 7d is closest to the result in Fig. 6. Therefore, we can give a rough estimate that the wavelength
range of light emitted by the LED lamp is 400 nm - 600 nm. In addition, the same estimate can be obtained by clearly identifying the number of maxima and minima that can be distinguished clearly in Fig. 7e-7h.
3.4 Effect of the central wavelength and spectral width on double-slit interference of non-monochromatic light
To investigate the effect of the central wavelength and spectral width on double-slit interference of non- monochromatic light, through changing the spectral width, we simulated the interference of non-monochromatic light with central wavelengths of 400 nm and 600 nm, respectively, as shown in Figs. 8 and 9.
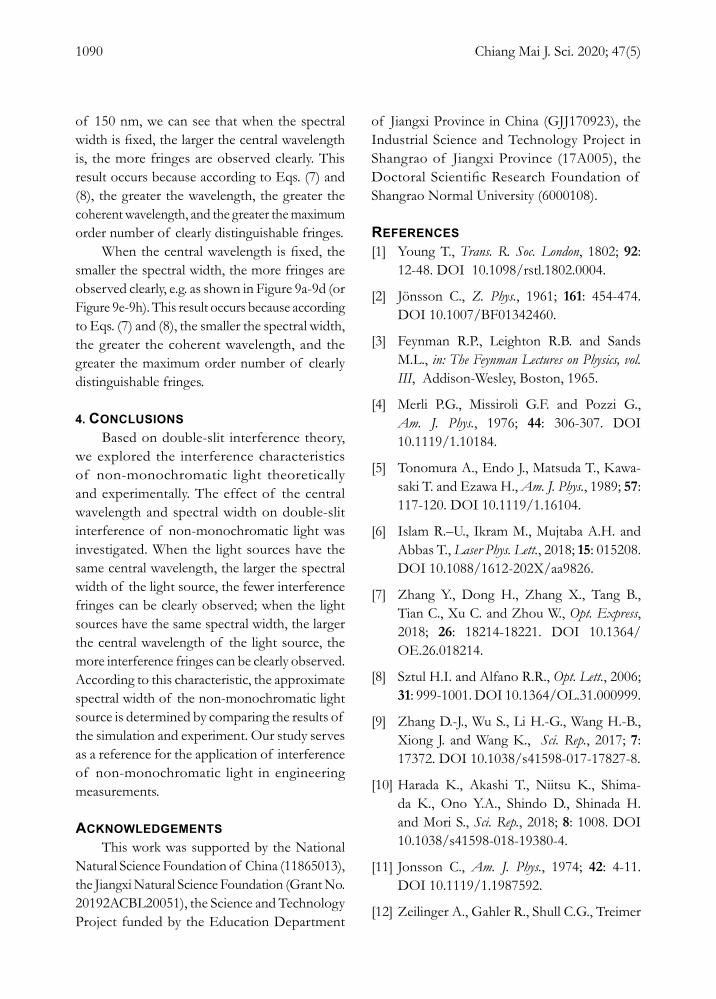
Comparing the simulation results in Figs. 8, 7 and 9, such as Figs. 8c, 7c and 9c (or Figs. 8g, 7g and 9g), corresponding to a spectral width of 150 nm, we can see that when the spectral width is fixed, the larger the central wavelength is, the more fringes are observed clearly. This result occurs because according to Eqs. (7) and (8), the greater the wavelength, the greater the coherent wavelength, and the greater the maximum order number of clearly distinguishable fringes.
When the central wavelength is fixed, the smaller the spectral width, the more fringes are observed clearly, e.g. as shown in Fig. 9a-9d (or Fig. 9e-9h). This result occurs because according to Eqs. (7) and (8), the smaller the spectral width, the greater the coherent wavelength, and the greater the maximum order number of clearly distinguishable fringes.
Fig. 8. Simulation results of double-slit interference of non-monochromatic light with a central wavelength of 400 nm. (a) and (e) are the interference fringe and the corresponding distribution of light intensity for spectral width from 375 nm - 425 nm; (b) and (f) are the interference fringe and the corresponding distribution of light intensity for spectral width from 350 nm - 450 nm; (c) and (g) are the interference fringe and the corresponding distribution of light intensity for spectral width from 325 nm - 475 nm; (d) and (h) are the interference fringe and the corresponding distribution of light intensity for spectral width from 300 nm - 500 nm.
Figure 7. Simulation results of double-slit interference of non-monochromatic light with a central wavelength of 500 nm. (a) and (e) are the interference fringe and the corresponding distribution of light intensity for spectral width from 475 nm - 525 nm; (b) and (f) are the interference fringe and the corresponding distribution of light intensity for spectral width from 450 nm - 550 nm; (c) and (g) are the interference fringe and the corresponding distribution of light intensity for spectral width from 425 nm - 575 nm; (d) and (h) are the interference fringe and the corresponding distribution of light intensity for spectral width from 400 nm - 600 nm.
Chiang Mai J. Sci. 2027; 47(5) 1089
Figure 8. Simulation results of double-slit interference of non-monochromatic light with a central wavelength of 400 nm. (a) and (e) are the interference fringe and the corresponding distribution of light intensity for spectral width from 375 nm - 425 nm; (b) and (f) are the interference fringe and the corresponding distribution of light intensity for spectral width from 350 nm - 450 nm; (c) and (g) are the interference fringe and the corresponding distribution of light intensity for spectral width from 325 nm - 475 nm; (d) and (h) are the interference fringe and the corresponding distribution of light intensity for spectral width from 300 nm - 500 nm.
Figure 9. Simulation results of double-slit interference of non-monochromatic light with a central wavelength of 600 nm. (a) and (e) are the interference fringe and the corresponding distribution of light intensity for spectral width from 575 nm - 625 nm; (b) and (f) are the interference fringe and the corresponding distribution of light intensity for spectral width from 550 nm - 650 nm; (c) and (g) are the interference fringe and the corresponding distribution of light intensity for spectral width from 525 nm - 675 nm; (d) and (h) are the interference fringe and the corresponding distribution of light intensity for spectral width from 500 nm - 700 nm.
Chiang Mai J. Sci. 2020; 47(5)1090
of 150 nm, we can see that when the spectral width is fixed, the larger the central wavelength is, the more fringes are observed clearly. This result occurs because according to Eqs. (7) and (8), the greater the wavelength, the greater the coherent wavelength, and the greater the maximum order number of clearly distinguishable fringes.
When the central wavelength is fixed, the smaller the spectral width, the more fringes are observed clearly, e.g. as shown in Figure 9a-9d (or Figure 9e-9h). This result occurs because according to Eqs. (7) and (8), the smaller the spectral width, the greater the coherent wavelength, and the greater the maximum order number of clearly distinguishable fringes.
4. CONCLUSIONSBased on double-slit interference theory,
we explored the interference characteristics of non-monochromatic light theoretically and experimentally. The effect of the central wavelength and spectral width on double-slit interference of non-monochromatic light was investigated. When the light sources have the same central wavelength, the larger the spectral width of the light source, the fewer interference fringes can be clearly observed; when the light sources have the same spectral width, the larger the central wavelength of the light source, the more interference fringes can be clearly observed. According to this characteristic, the approximate spectral width of the non-monochromatic light source is determined by comparing the results of the simulation and experiment. Our study serves as a reference for the application of interference of non-monochromatic light in engineering measurements.
ACKNOWLEDGEMENTSThis work was supported by the National
Natural Science Foundation of China (11865013), the Jiangxi Natural Science Foundation (Grant No. 20192ACBL20051), the Science and Technology Project funded by the Education Department
of Jiangxi Province in China (GJJ170923), the Industrial Science and Technology Project in Shangrao of Jiangxi Province (17A005), the Doctoral Scientific Research Foundation of Shangrao Normal University (6000108).
REFERENCES[1] Young T., Trans. R. Soc. London, 1802; 92:
12-48. DOI 10.1098/rstl.1802.0004.
[2] Jönsson C., Z. Phys., 1961; 161: 454-474. DOI 10.1007/BF01342460.
[3] Feynman R.P., Leighton R.B. and Sands M.L., in: The Feynman Lectures on Physics, vol. III, Addison-Wesley, Boston, 1965.
[4] Merli P.G., Missiroli G.F. and Pozzi G., Am. J. Phys., 1976; 44: 306-307. DOI 10.1119/1.10184.
[5] Tonomura A., Endo J., Matsuda T., Kawa-saki T. and Ezawa H., Am. J. Phys., 1989; 57: 117-120. DOI 10.1119/1.16104.
[6] Islam R.–U., Ikram M., Mujtaba A.H. and Abbas T., Laser Phys. Lett., 2018; 15: 015208. DOI 10.1088/1612-202X/aa9826.
[7] Zhang Y., Dong H., Zhang X., Tang B., Tian C., Xu C. and Zhou W., Opt. Express, 2018; 26: 18214-18221. DOI 10.1364/OE.26.018214.
[8] Sztul H.I. and Alfano R.R., Opt. Lett., 2006; 31: 999-1001. DOI 10.1364/OL.31.000999.
[9] Zhang D.-J., Wu S., Li H.-G., Wang H.-B., Xiong J. and Wang K., Sci. Rep., 2017; 7: 17372. DOI 10.1038/s41598-017-17827-8.
[10] Harada K., Akashi T., Niitsu K., Shima-da K., Ono Y.A., Shindo D., Shinada H. and Mori S., Sci. Rep., 2018; 8: 1008. DOI 10.1038/s41598-018-19380-4.
[11] Jonsson C., Am. J. Phys., 1974; 42: 4-11. DOI 10.1119/1.1987592.
[12] Zeilinger A., Gahler R., Shull C.G., Treimer

Chiang Mai J. Sci. 2027; 47(5) 1091
W. and Mampe W., Rev. Mod. Phys., 1988; 60: 1067-1073. DOI 10.1103/RevMod-Phys.60.1067.
[13] Carnal O. and Mlynek J., Phys. Rev. Lett., 1991; 66: 2689-2692. DOI 10.1103/Phys-RevLett.66.2689.
[14] Ambrose B.S., Shaffer P.S., Steinberg R.N. and McDermott L.C., Am. J. Phys., 1999; 67: 146-155. DOI 10.1119/1.19210.
[15] Gonzalez J., Bravo A. and Juarez K., Am. J. Phys., 1999; 67: 839-840. DOI 10.1119/1.19134.
[16] Gondran M. and Gondran A., Am. J. Phys., 2005; 73: 507-515. DOI 10.1119/1.1858484.
[17] Frabboni S., Gazzadi G. C. and Pozzi G., Am. J. Phys., 2007; 75: 1053-1055. DOI 10.1119/1.2757621.
[18] Atkins L.J. and Elliott R.C., Am. J. Phys., 2010; 78: 1248-1253. DOI 10.1119/1.3490011.
[19] Lee C., Shin K. and Lee S., Am. J. Phys., 2010; 78: 71-74. DOI 10.1119/1.3230035.
[20] Hou Z., Zhao X. and Xiao J., Eur. J. Phys., 2012; 33: 199-206. DOI 10.1088/0143-0807/33/1/017.
[21] Rueckner W. and Peidle J., Am. J. Phys., 2013; 81: 951-958. DOI 10.1119/1.4819882.
[22] Matteucci G., Pezzi M., Pozzi G., Alberghi G.L., Giorgi F., Gabrielli A., Cesari N.S., Villa M., Zoccoli A., Frabboni S. and Gaz-zadi G.C., Eur. J. Phys., 2013; 34: 511-517. DOI 10.1088/0143-0807/34/3/511.
[23] Illarramendi M.A., Hueso R., Zubia J., Aldabaldetreku G., Durana G. and Sán-chez-Lavega A., Am. J. Phys., 2014; 82: 649-653. DOI 10.1119/1.4869280.
[24] Kincaid J., McLelland K. and Zwolak M., Am. J. Phys., 2016; 84: 522-530. DOI 10.1119/1.4943585.
[25] Gossman D., Perez-Garcia B., Her-nandez-Aranda R.I. and Forbes A., Am. J. Phys., 2016; 84: 508-516. DOI 10.1119/1.4948604.
[26] Aspden R.S., Padgett M.J. and Spalding G.C., Am. J. Phys., 2016; 84: 671-677. DOI 10.1119/1.4955173.
[27] Meyer D.Z., Phys. Teach., 2017; 55: 159-163. DOI 10.1119/1.4976659.
[28] Gao L., Rafsanjani S.M.H., Zhou Y., Yang Z., Magana-Loaiza O.S., Mirhos-seini M., Zhao J., Gao B. and Boyd R.W., Appl. Phys. Lett., 2017; 110: 071107. DOI 10.1063/1.4976575.
[29] Koopman T. and Gopal V., Am. J. Phys., 2017; 85: 392-398. DOI 10.1119/1.4978034.
[30] Brom J.M., J. Chem. Educ., 2017; 94: 577-581. DOI 10.1021/acs.jchemed.6b00830.
[31] Jackson D.P., Ferris N., Strauss R., Li H. and Pearson B.J., Am. J. Phys., 2018; 86: 683-689. DOI 10.1119/1.5047438.
[32] Yang H.J., Deibel J., Nyberg S., and Riles K., Appl. Optics, 2005; 44: 3937-3944. DOI 10.1364/AO.44.003937.
[33] Zheng J., Appl. Optics, 2007; 46: 2189-2196. DOI 10.1364/AO.46.002189.
[34] Herrick R.B. and Meyer-Arendt J.R., Appl. Optics, 1966; 5: 981-983. DOI 10.1364/AO.5.000981.