
Simulation Analysis of Proton Exchange Membrane Fuel Cell … · 2016-08-10 · Proton Exchange...
9
IJSRD - International Journal for Scientific Research & Development| Vol. 4, Issue 06, 2016 | ISSN (online): 2321-0613 All rights reserved by www.ijsrd.com 452 Simulation Analysis of Proton Exchange Membrane Fuel Cell (PEMFC) by using Computational Fluid Dynamics Manjunath A Dhadke 1 M.R.Nagaraj 2 1 M.Tech. Student 2 Associate Professor 1,2 Department of Mechanical Engineering 1,2 PDA College of Engg. Gulbarga, Karnataka, India Abstract— A full three-dimensional, single phase computational fluid dynamics model of a proton exchange membrane fuel cell (PEMFC) with both gas distribution flow channels and Membrane Electrode Assembly (MEA) has been developed. A single set of conservation equations which are valid for the flow channels, gas-diffusion electrodes, catalyst layers, and the membrane region are developed and numerically solved using a finite volume based computational fluid dynamics technique. In this research, some parameters such as oxygen consumption, water production, temperature distribution, ohmic losses, anode water activity, cathode over-potential and the fuel cell performance for straight single cell were investigated in more detail. The numerical simulations reveal that these important operating parameters are highly dependent on each other and the fuel cell efficiency is affected by kind of species distribution. 3D computational model for proton exchange membrane (PEM) fuel cells has been developed, and implemented into a computational fluid dynamic (CFD) code. The model allows parallel computing, thus making it practical to perform well-resolved simulations for large computational domains. So for, especial uses in desirable voltages, for preventing from the unwilling losses, these numerical results can be useful. Key words: PEM Fuel Cell, Ohmic Loss, Water Activity, ANSYS Fluent, CFD, Fuel Cell Performance I. INTRODUCTION In past decades, the researchers have tried to find the new technology as the solution to the energy and Environmental problems. In this way, they could gain the fuel cell technology. The different types of fuel cells are distinguished by the electrolytes used. Among them, the Proton Exchange Membrane Fuel Cell (PEMFC), which is the focus of this paper, is described by the use of a polymer electrolyte membrane. As shown in figure 1, a typical PEM fuel cell is consisting of 9 regions: anode (bipolar plate, gas channel, gas diffusion layer, and catalyst layer), membrane, cathode (bipolar plate, gas channel, gas diffusion layer, and catalyst layer). The humidified air and hydrogen (to keep the membrane water swollen in order to enhance sufficient proton conductivity) enter the cathode and anode channels, respectively. The hydrogen molecule diffuses through the anode diffusion layer towards the catalyst layer where it divides into H+ and electrons: H2 →2H + +2e - Since the membrane is considered impermeable for reactant gases and electrons, only protons can migrate through the membrane. The produced electrons travel through the conductive diffusion layer and an external circuit. The main electro chemical reaction occurs on the cathode catalyst layer. The oxygen diffuses through the diffusion layer and reacts with the protons and electrons to form water and heat: O2+2H + +2e - →H2O Development of polymer membrane with high performance, thermal and water management is the subject that some studies have focused on. If the membrane has good thermal and protonic conductivity, it can remain hydrated and can conduct the protons better [1]. On the other hand, some investigations have focused on fuel cell structure design. These types of fuel cells have some advantages: low operating temperature (60 90oC), simple design, low weight and volume and the prospect of further significant cost reduction make PEMFC technology a candidate for transport applications as well as for small appliances such as laptop computers. In the past, to provide understanding about fuel cell performance, numerical and theoretical fuel cell modeling has been used extensively. Numerous researchers have focused on different aspects of the fuel cell: Bernardi and Verbrugge [2, 3] investigated a one dimensional, isothermal model which provides valuable information about the physics of the electrochemical reactions and transport phenomena in the gas diffusion, catalyst and membrane layer. Fuller and Newman [4] published a quasi-two dimensional model of the MEA, which is based on concentration solution theory for the membrane and accounts for thermal effects. Nguyen and White [5] proposed a two-dimensional and isothermal model. They considered water transport through membrane by the electro osmosis drag force as well as heat transfer from the solid phase to the gas phase along the flow channels. Gurau et al. [6] first used the methods of computational fluid dynamics (CFD) for PEM Fuel Cell modeling. They developed a two dimensional, steady state model of a whole fuel cell, i.e. both flow channels with the MEA in between. In their model, there was no interaction between gas and liquid phase of water. The first three-dimensional modeling was done by Dutta.[7]. They obtained velocity, density and pressure contours in the gas diffusion layers. Their results showed that the current direction is drastically dependent on the mass transfer mechanism in the membrane electrode assembly. This article presents the results of a numerical investigation using a comprehensive 3-dimensional, single phase, non-isothermal and parallel flow model of a PEM fuel cell with straight channels. The main objective of this work is to explain the mass transport phenomena, temperature variation and current density distribution of base model (model with straight flow channels). This model is implemented into the commercial CFD code Fluent 6.1, with custom developed user-subroutines that take account of
Transcript of Simulation Analysis of Proton Exchange Membrane Fuel Cell … · 2016-08-10 · Proton Exchange...
IJSRD - International Journal for Scientific Research & Development| Vol. 4, Issue 06, 2016 | ISSN (online): 2321-0613
All rights reserved by www.ijsrd.com 452
Simulation Analysis of Proton Exchange Membrane Fuel Cell (PEMFC)
by using Computational Fluid Dynamics Manjunath A Dhadke1 M.R.Nagaraj2 1M.Tech. Student 2Associate Professor
1,2Department of Mechanical Engineering 1,2PDA College of Engg. Gulbarga, Karnataka, India
Abstract— A full three-dimensional, single phase
computational fluid dynamics model of a proton exchange
membrane fuel cell (PEMFC) with both gas distribution flow
channels and Membrane Electrode Assembly (MEA) has
been developed. A single set of conservation equations
which are valid for the flow channels, gas-diffusion
electrodes, catalyst layers, and the membrane region are
developed and numerically solved using a finite volume
based computational fluid dynamics technique. In this
research, some parameters such as oxygen consumption,
water production, temperature distribution, ohmic losses,
anode water activity, cathode over-potential and the fuel cell
performance for straight single cell were investigated in more
detail. The numerical simulations reveal that these important
operating parameters are highly dependent on each other and
the fuel cell efficiency is affected by kind of species
distribution. 3D computational model for proton exchange
membrane (PEM) fuel cells has been developed, and
implemented into a computational fluid dynamic (CFD)
code. The model allows parallel computing, thus making it
practical to perform well-resolved simulations for large
computational domains. So for, especial uses in desirable
voltages, for preventing from the unwilling losses, these
numerical results can be useful.
Key words: PEM Fuel Cell, Ohmic Loss, Water Activity,
ANSYS Fluent, CFD, Fuel Cell Performance
I. INTRODUCTION
In past decades, the researchers have tried to find the new
technology as the solution to the energy and Environmental
problems. In this way, they could gain the fuel cell
technology. The different types of fuel cells are
distinguished by the electrolytes used. Among them, the
Proton Exchange Membrane Fuel Cell (PEMFC), which is
the focus of this paper, is described by the use of a polymer
electrolyte membrane. As shown in figure 1, a typical PEM
fuel cell is consisting of 9 regions: anode (bipolar plate, gas
channel, gas diffusion layer, and catalyst layer), membrane,
cathode (bipolar plate, gas channel, gas diffusion layer, and
catalyst layer). The humidified air and hydrogen (to keep the
membrane water swollen in order to enhance sufficient
proton conductivity) enter the cathode and anode channels,
respectively. The hydrogen molecule diffuses through the
anode diffusion layer towards the catalyst layer where it
divides into H+ and electrons:
H2 →2H++2e-
Since the membrane is considered impermeable for
reactant gases and electrons, only protons can migrate
through the membrane. The produced electrons travel
through the conductive diffusion layer and an external
circuit. The main electro chemical reaction occurs on the
cathode catalyst layer. The oxygen diffuses through the
diffusion layer and reacts with the protons and electrons to
form water and heat:
O2+2H++2e- →H2O
Development of polymer membrane with high
performance, thermal and water management is the subject
that some studies have focused on. If the membrane has
good thermal and protonic conductivity, it can remain
hydrated and can conduct the protons better [1]. On the
other hand, some investigations have focused on fuel cell
structure design. These types of fuel cells have some
advantages: low operating temperature (60 90oC), simple
design, low weight and volume and the prospect of further
significant cost reduction make PEMFC technology a
candidate for transport applications as well as for small
appliances such as laptop computers.
In the past, to provide understanding about fuel cell
performance, numerical and theoretical fuel cell modeling
has been used extensively. Numerous researchers have
focused on different aspects of the fuel cell:
Bernardi and Verbrugge [2, 3] investigated a one
dimensional, isothermal model which provides valuable
information about the physics of the electrochemical
reactions and transport phenomena in the gas diffusion,
catalyst and membrane layer. Fuller and Newman [4]
published a quasi-two dimensional model of the MEA,
which is based on concentration solution theory for the
membrane and accounts for thermal effects.
Nguyen and White [5] proposed a two-dimensional
and isothermal model. They considered water transport
through membrane by the electro osmosis drag force as well
as heat transfer from the solid phase to the gas phase along
the flow channels.
Gurau et al. [6] first used the methods of
computational fluid dynamics (CFD) for PEM Fuel Cell
modeling. They developed a two dimensional, steady state
model of a whole fuel cell, i.e. both flow channels with the
MEA in between. In their model, there was no interaction
between gas and liquid phase of water.
The first three-dimensional modeling was done by
Dutta.[7]. They obtained velocity, density and pressure
contours in the gas diffusion layers. Their results showed
that the current direction is drastically dependent on the
mass transfer mechanism in the membrane electrode
assembly.
This article presents the results of a numerical
investigation using a comprehensive 3-dimensional, single
phase, non-isothermal and parallel flow model of a PEM
fuel cell with straight channels. The main objective of this
work is to explain the mass transport phenomena,
temperature variation and current density distribution of
base model (model with straight flow channels). This model
is implemented into the commercial CFD code Fluent 6.1,
with custom developed user-subroutines that take account of
Simulation Analysis of Proton Exchange Membrane Fuel Cell (PEMFC) by using Computational Fluid Dynamics
(IJSRD/Vol. 4/Issue 06/2016/107)
All rights reserved by www.ijsrd.com 453
the physicochemical processes associated with PEM fuel
cells. The model equations are then solved by a numerical
method based on finite volume method (FVM). The model
findings are then validated with the experimental data
reported in Wang.[8] to verify its accuracy.
II. MODEL DESCRIPTION AND FIELD EQUATIONS
The model developed here is 3-dimensional that takes into
account phenomena involving transport in the membrane,
gas diffusion layer and flow channels in a PEM fuel cell.
The model is built considering the following assumptions:
1) The system operates under steady state condition.
2) The gas diffusion layers, catalyst layers and membrane
are isotropic and homogeneous porous media.
3) Ideal gas behaviour for reactant gases.
4) The flow regime in channels is supposed to be laminar
for reactant gases because of low velocities gradient and
eventually low Reynolds number.
5) The membrane is considered impermeable for reactant
gases.
6) There is no interaction between the gas and liquid phase
of water (the model is single phase).
7) Activation over potential is constant within anode and
cathode compartments.
In this numerical simulation, a single domain
model formation was used for the governing equations.
These equations consist of:
A. Continuity Equation
Electrodes are considered as a porous medium where
reactant gases are distributed on catalyst layers. If 𝜀 is the
porosity inside porous media: 𝜕(𝜌𝜀𝑢)
𝜕𝑥+
𝜕(𝜌𝜀𝑣)
𝜕𝑦+
𝜕(𝜌𝜀𝑤)
𝜕𝑧= 𝑆𝑚 (3)
Where 𝑆𝑚 is mass source term, 𝜌 mixture density,
and u, v, and w are velocity components along x,y,z
direction respectively. 𝜀 is the porosity; the fuel cell is a
porous media. In the flow channels, this term is zero,
because there is no reaction, but in the catalyst layers it is
not zero due to reaction of reactant species:
𝑆H2(kg s−1m−3) = −
𝑀H2
2𝐹 𝑅𝑎𝑛 (4)
𝑆O2(kg s−1m−3) = −
𝑀H2
4𝐹 𝑅𝑐𝑎𝑡 (5)
𝑆H2O(kg s−1m−3) =𝑀H2O
2𝐹 𝑅𝑐𝑎𝑡 (6)
𝑆H2 and 𝑆O2
are negative, because they are being
consumed, but 𝑆H2O is positive due to its formation in
catalyst layer. F is the Faraday constant and M the molecular
weight of species. 𝑅𝑎𝑛 and 𝑅𝑐𝑎𝑡 are the source terms which
are calculated using the Butler- Volmer equation.
B. Momentum Equation
In porous electrodes and for Newtonian fluid, the
momentum equation can be written as:
∇ ∙ (𝜀𝜌𝑉𝑉) = −𝜀∇𝑃 + ∇ ∙ (𝜀𝜇∇𝑉) + 𝑆𝑚𝑜𝑚 (7)
Where V, P and 𝜇 are velocity vector, pressure,
viscosity and momentum source term, respectively.
The 𝑆𝑚𝑜𝑚is used to describe Darcy’s drag for flow
through porous gas diffusion layers and catalyst layers as:
𝑆𝑚𝑜𝑚 = −𝜇
𝛽𝑉 (8)
𝛽 is the gas permeability inside the porous media.
C. Mass Transfer Equation
The continuity equation in steady state conditions is written
as follows:
∇ ∙ (𝜌𝜀𝑉𝑦𝑖) = −∇ ∙ 𝐽𝑖 + 𝑆𝑖 (9)
Where 𝑦𝑖 and 𝐽𝑖 are mass fraction and diffusion
mass flux vector, respectively. 𝑆𝑖 is mass source term which
has been presented in equations 4-6.
Fick’s equation gives the diffusion mass flux
vector:
𝐽𝑖 = − ∑ 𝜌 𝐷𝑖𝑗𝑒𝑓𝑓
∇𝑦𝑖 (10)
Within porous electrodes, mass transfer equation
changes to:
∇ ∙ (𝜀𝜌𝑉𝑦𝑖) = ∇ ∙ (𝜌𝜀𝐷𝑖𝑗𝑒𝑓𝑓
𝑉𝑦𝑖) + 𝑆𝑖 (11)
𝐷𝑖𝑗𝑒𝑓𝑓
is effective diffusivity of species estimated from the:
𝜀𝐷𝑖𝑗𝑒𝑓𝑓
= 𝐷𝑖𝑗 × 𝜀1.5 (12)
𝐷𝑖𝑗 is diffusivity of species inside.
D. Energy equation
The energy equation is given by:
∇ ∙ (𝜌𝜀𝑉𝑇) = ∇ ∙ (𝑘𝑒𝑓𝑓∇𝑇) + 𝑆𝑇 (13)
𝑘𝑒𝑓𝑓 is the effective thermal conductivity which is
calculated as volume average of solid and fluid conductivity
in porous medium. 𝑆𝑇 is source term and defined with the
following equation:
𝑆𝑇 = 𝐼𝑅𝑅𝑂ℎ𝑚 + ℎ𝑟𝑒𝑐𝑡𝑖𝑜𝑛 + ℎ𝑝ℎ𝑎𝑠𝑒 (14)
Since phase change in numerical simulation was
not considered, ℎ𝑝ℎ𝑎𝑠𝑒 so would be omitted. ℎ𝑟𝑒𝑐𝑡𝑖𝑜𝑛 is the
heat generated through the chemical reactions and 𝑅𝑂ℎ𝑚 is
defined as:
𝑅𝑜ℎ𝑚 =𝑡𝑚
𝜎𝑚𝑒𝑚
(15)
Where 𝑡𝑚 and 𝜎𝑚𝑒𝑚 are thickness and protonic
conductivity of membrane respectively.
𝜎𝑚𝑒𝑚 = 𝑒𝑥𝑝 [1268 (1
303−
1
𝑇)] (16)
(0.005139 λ 0.00326)
Where water content in the membrane, λ is defined
as the number of water molecules per sulfonate group inside
the membrane. The water content can be expressed as a
function of the water activity, a, by the following equation:
𝜆 = 0.3 + 6𝑎[1 − tanh(𝑎 − 0.5)]
+3.9√𝑎 [1 + tanh (𝑎 − 0.89
0.23)] (17)
Where the activity, a , is calculated by:
𝑎 =𝐶𝑊𝑅𝑇
𝑃𝑠𝑎𝑡
=𝑃𝑊
𝑃𝑠𝑎𝑡
(18)
𝑃𝑊 and 𝑃𝑠𝑎𝑡 are water vapor and saturation
pressure respectively.
D. Charge Conservation Equation
As mentioned before, electrons transfer through conductive
solid phase and protons transport through the membrane. So,
two charge equations are needed:
∇ ∙ (𝜎𝑠𝑜𝑙∇∅𝑠𝑜𝑙) + 𝑅𝑠𝑜𝑙 = 0 (19)
∇ ∙ (𝜎𝑚𝑒𝑚∇∅𝑚𝑒𝑚) + 𝑅𝑚𝑒𝑚 = 0 (20)
𝜎𝑠𝑜𝑙 and 𝜎𝑚𝑒𝑚 are electrical conductivity of
electrodes and membrane (S/m), respectively.
∅𝑠𝑜𝑙 and ∅𝑚𝑒𝑚 are defined as potential of electron
and proton, respectively. 𝑅𝑠𝑜𝑙 and 𝑅𝑚𝑒𝑚 are source terms
Simulation Analysis of Proton Exchange Membrane Fuel Cell (PEMFC) by using Computational Fluid Dynamics
(IJSRD/Vol. 4/Issue 06/2016/107)
All rights reserved by www.ijsrd.com 454
(they are current density (A/m3)). These terms are only
defined in the catalyst layers: For the solid phase:
𝑅𝑠𝑜𝑙 = −𝑅𝑎𝑛𝑜𝑑𝑒 (< 0) 𝑎𝑛𝑜𝑑𝑒 𝑠𝑖𝑑𝑒
𝑅𝑠𝑜𝑙 = 𝑅𝑐𝑎𝑡ℎ𝑜𝑑𝑒 (> 0) 𝑐𝑎𝑡ℎ𝑜𝑑𝑒 𝑠𝑖𝑑𝑒 For the membrane phase:
𝑅𝑚𝑒𝑚 = 𝑅𝑎𝑛𝑜𝑑𝑒 (> 0) 𝑎𝑛𝑜𝑑𝑒 𝑠𝑖𝑑𝑒
𝑅𝑚𝑒𝑚 = −𝑅𝑐𝑎𝑡ℎ𝑜𝑑𝑒 (< 0) 𝑐𝑎𝑡ℎ𝑜𝑑𝑒 𝑠𝑖𝑑𝑒
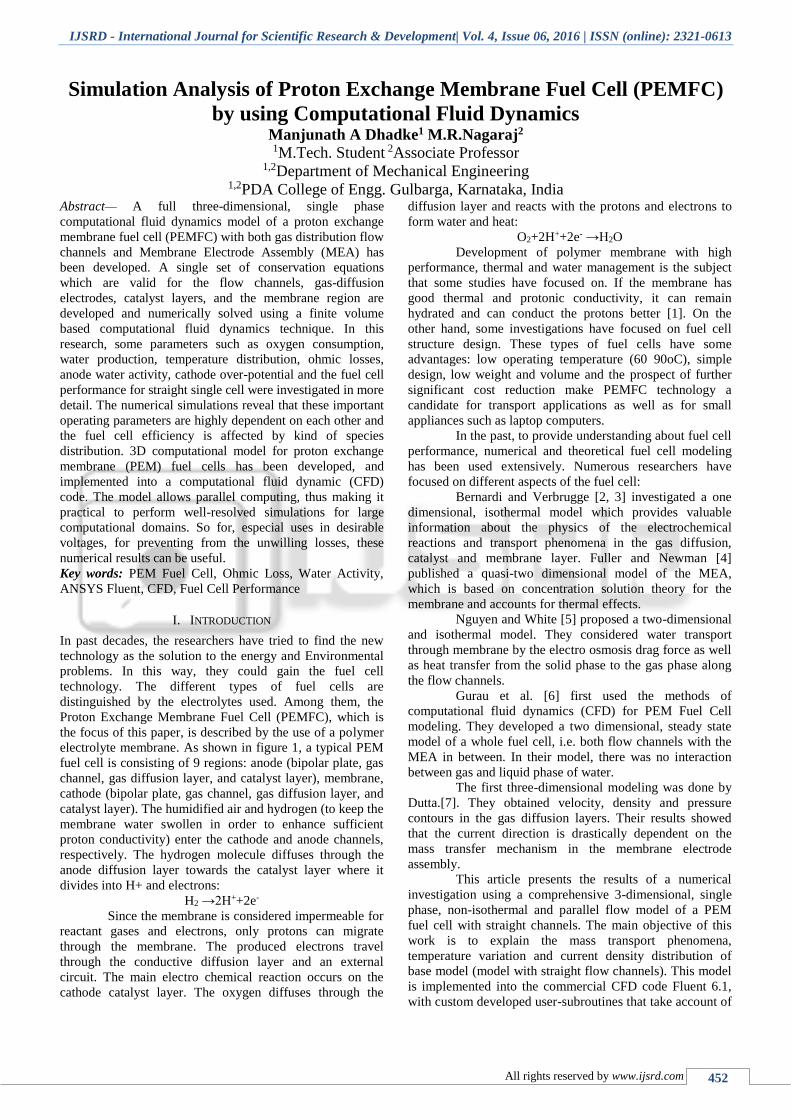
III. BOUNDARY CONDITIONS
Constant mass flow rate at the channel inlet and constant
pressure are the conditions at the channel outlet, and the no-
flux conditions are executed for mass, momentum, species
and potential conservation equations at all boundaries expect
for inlets and outlets of the anode and cathode flow
channels. Fig.2 shows the other surface boundary
conditions.
Fig. 2: Boundary conditions.
The source terms are calculated using the Butler-Volmer
equation:
𝑅𝑎𝑛 = 𝑗𝑎𝑛𝑟𝑒𝑓
([𝐻2]
[𝐻2]𝑟𝑒𝑓
)
𝛾𝑎𝑛
(𝑒(𝛼𝑎𝑛𝐹
𝑅𝑇)𝜂𝑎𝑛
− 𝑒−(𝛼𝑎𝑛𝐹
𝑅𝑇)𝜂𝑐𝑎𝑡) (21)
𝑅𝑐𝑎𝑡 = 𝑗𝑐𝑎𝑡𝑟𝑒𝑓
([𝑜2]
[𝑜2]𝑟𝑒𝑓
)
𝛾𝑐𝑎𝑡
(𝑒−(𝛼𝑐𝑎𝑡𝐹
𝑅𝑇)𝜂𝑐𝑎𝑡
− 𝑒(𝛼𝑐𝑎𝑡𝐹
𝑅𝑇)𝜂𝑎𝑛) (22)
𝑗𝑟𝑒𝑓is reference exchange current density (A/m2).
IV. METHODOLOGY AND MODEL
A. Water Transport through Membrane
Water molecules in PEM fuel cell are transported via
electro-osmotic drag due to the properties of polymer
electrolyte membrane in addition to the molecular diffusion.
H+ protons transport water molecules through the polymer
electrolyte membrane and this transport phenomenon is
called electro-osmotic drag.
In addition to the molecular diffusion and electro
osmotic drag, water is also produced in the catalyst layers
due to the electrochemical reaction. The assumption of
single phase model is used here. It means that water
generated from the cathodic equation is in a vapor state.
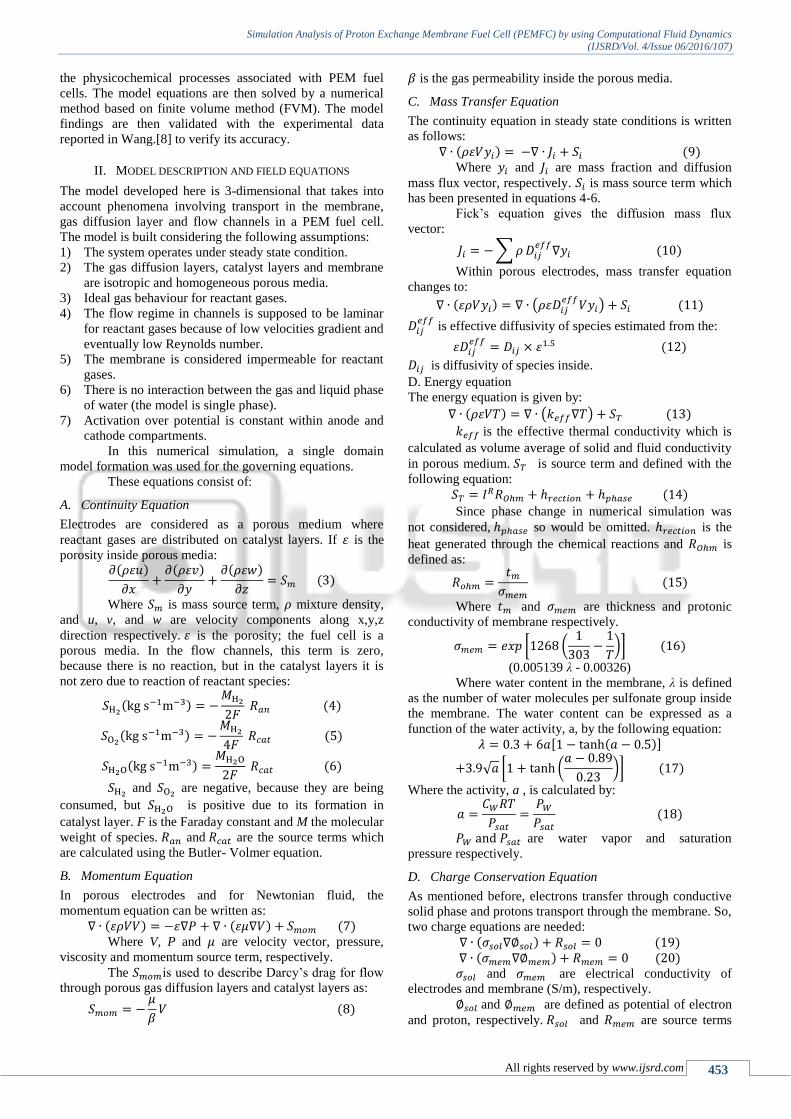
The governing equations with the appropriate
boundary conditions are solved by the finite volume method
and implicit solver. The SIMPLE algorithm is applied for
solving the equations. Fig. 3 indicates the algorithm
designed for numerical simulation of model equations.
Fig. 3: A general solution algorithm of solving governing
equations in proton exchange membrane fuel cell (PEMFC).
In the base model, the structured meshes are used
and in catalyst layers where the electro chemical reactions
occur, the meshes are finer. Also, grid-independence test
was implemented, and finally the optimum number of
meshes chosen. Fig. 4 indicates the computational domain
of base model. A series of simulation were carried out on
the model from low to high operating current densities. In
order to evaluate the validity of the model, numerical
simulation results (for conventional model) were compared
with the experimental data presented by Wang et al. [22], as
shown in Figure 5
Simulation Analysis of Proton Exchange Membrane Fuel Cell (PEMFC) by using Computational Fluid Dynamics
(IJSRD/Vol. 4/Issue 06/2016/107)
All rights reserved by www.ijsrd.com 455
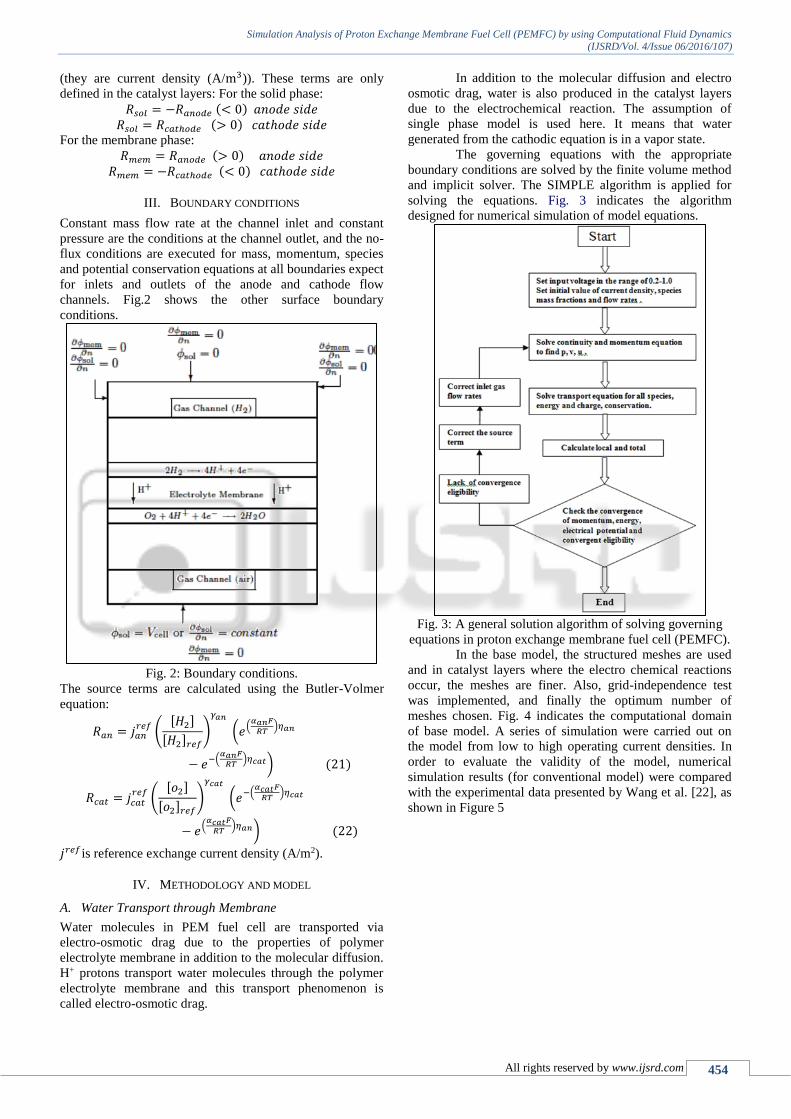
Fig. 4: Computational domain of numerical model.
Fig. 5: Comparison between PEMFC modelling Prediction
and Experimental Data.
From Fig 5 there is a non-concurrence between the
numerical simulation results and experimental data
especially at the high current density region. This fact is the
result of the single phase assumption. In other words, the
water produced in the catalyst layer is in the vapor phase (in
numerical simulation). In fact, liquid water fills the pores of
the catalyst and gas diffusion layers and do not let the
oxygen molecules transfer to the catalyst layer easily. So,
the mass transfer resistance of reactants (concentration loss)
increases at the high current density region. The power
density curve for the model is illustrated too. There is a
relation between voltage, current density and the power of
the fuel cell as P =V.I.
Fuel cell operating condition and geometric
parameters are shown in
Parameter Value
Anode & cathode pressure 3atm
Anode &cathode humidity 100%
Cell temperature 70˚C
Gas diffusion layer thickness 3 × 10⁻⁴ m
Catalyst layer thickness 1.29 × 10⁻⁵ m
Gas channel length 7 × 10⁻² m
Gas channel width and depth 1 × 10⁻³ m
Bipolar plate width 5 × 10⁻⁴ m
Stoichiometry 2
Porosity 4
Table 1: Parameter
V. RESULTS AND DISCUSSIONS
The first important parameter which should be explained is
temperature distribution, especially along the cell width. The
temperature affects various factors of the fuel cell. As it is
clear from Figures 6 and 7 the temperature at the regions
next to the bipolar plates is lower; because bipolar plates are
good thermal conductors and cause the better heat transfer;
this fact leads to temperature reduction at the shoulder
regions. The slight temperature decrease along the flow
direction is probably because of water level and its
distribution. The electrochemical reaction occurring in the
cathode catalyst layer has two significant roles: water
formation and temperature rise (so the cathode side
temperature is higher than that of the anode side). In this
model, the higher temperature distribution is at 0.4v and this
is due to high reaction rate in the fuel cell. High current
densities (or low voltages) cause the reactants to react faster
and subsequently the temperature rises. The high rate of
water production along the cell assists cooling of the cell
especially at exit region of the cell; therefore, high
temperature losses will happen in this voltage.
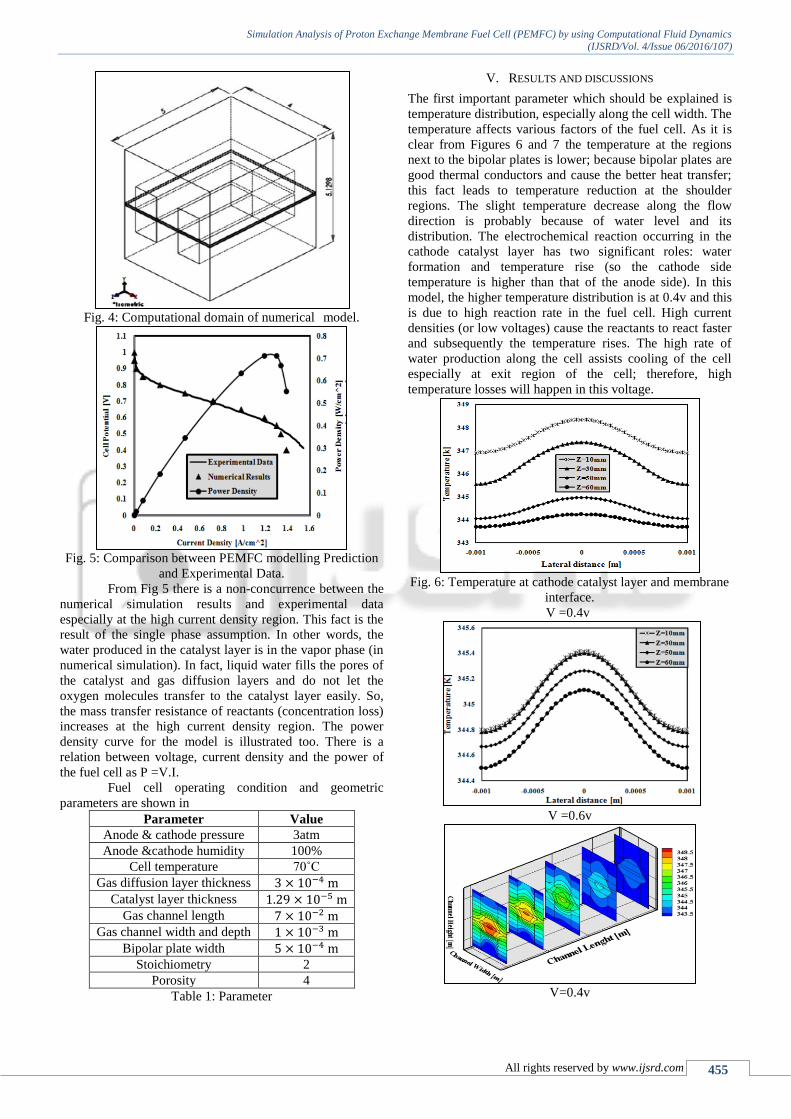
Fig. 6: Temperature at cathode catalyst layer and membrane
interface.
V =0.4v
V =0.6v
V=0.4v
Simulation Analysis of Proton Exchange Membrane Fuel Cell (PEMFC) by using Computational Fluid Dynamics
(IJSRD/Vol. 4/Issue 06/2016/107)
All rights reserved by www.ijsrd.com 456
V=0.6v
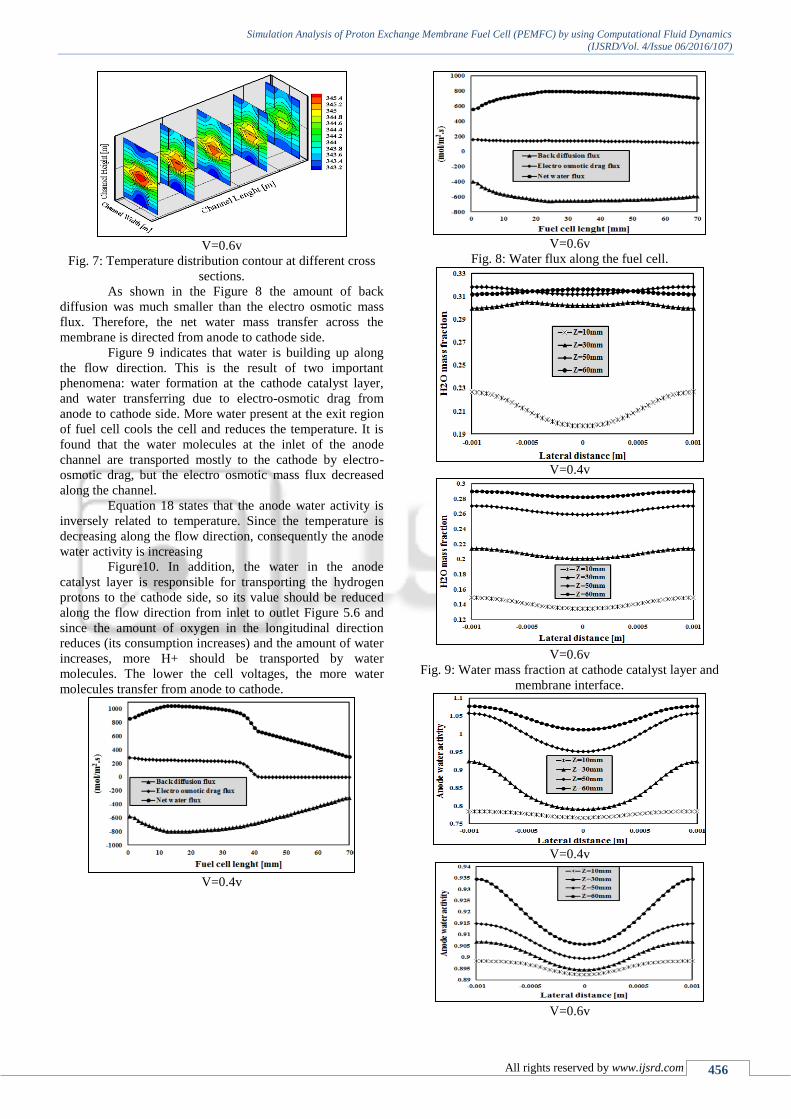
Fig. 7: Temperature distribution contour at different cross
sections.
As shown in the Figure 8 the amount of back
diffusion was much smaller than the electro osmotic mass
flux. Therefore, the net water mass transfer across the
membrane is directed from anode to cathode side.
Figure 9 indicates that water is building up along
the flow direction. This is the result of two important
phenomena: water formation at the cathode catalyst layer,
and water transferring due to electro-osmotic drag from
anode to cathode side. More water present at the exit region
of fuel cell cools the cell and reduces the temperature. It is
found that the water molecules at the inlet of the anode
channel are transported mostly to the cathode by electro-
osmotic drag, but the electro osmotic mass flux decreased
along the channel.
Equation 18 states that the anode water activity is
inversely related to temperature. Since the temperature is
decreasing along the flow direction, consequently the anode
water activity is increasing
Figure10. In addition, the water in the anode
catalyst layer is responsible for transporting the hydrogen
protons to the cathode side, so its value should be reduced
along the flow direction from inlet to outlet Figure 5.6 and
since the amount of oxygen in the longitudinal direction
reduces (its consumption increases) and the amount of water
increases, more H+ should be transported by water
molecules. The lower the cell voltages, the more water
molecules transfer from anode to cathode.
V=0.4v
V=0.6v
Fig. 8: Water flux along the fuel cell.
V=0.4v
V=0.6v
Fig. 9: Water mass fraction at cathode catalyst layer and
membrane interface.
V=0.4v
V=0.6v
Simulation Analysis of Proton Exchange Membrane Fuel Cell (PEMFC) by using Computational Fluid Dynamics
(IJSRD/Vol. 4/Issue 06/2016/107)
All rights reserved by www.ijsrd.com 457
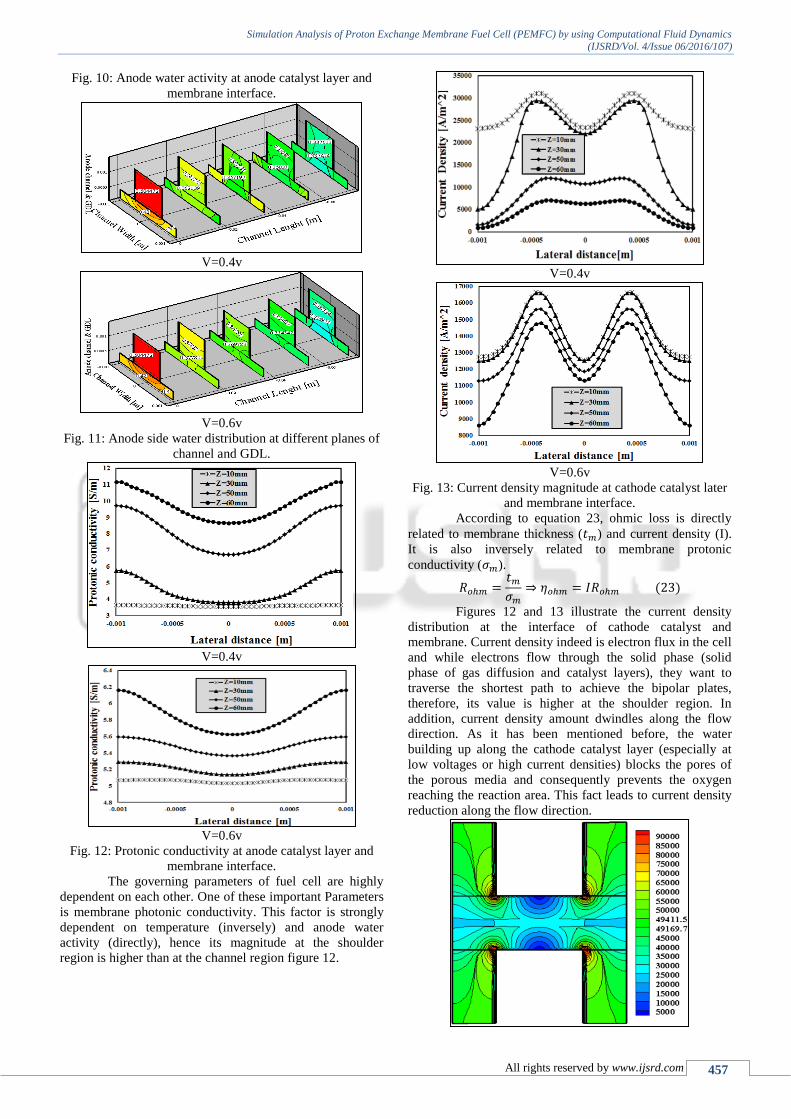
Fig. 10: Anode water activity at anode catalyst layer and
membrane interface.
V=0.4v
V=0.6v
Fig. 11: Anode side water distribution at different planes of
channel and GDL.
V=0.4v
V=0.6v
Fig. 12: Protonic conductivity at anode catalyst layer and
membrane interface.
The governing parameters of fuel cell are highly
dependent on each other. One of these important Parameters
is membrane photonic conductivity. This factor is strongly
dependent on temperature (inversely) and anode water
activity (directly), hence its magnitude at the shoulder
region is higher than at the channel region figure 12.
V=0.4v
V=0.6v
Fig. 13: Current density magnitude at cathode catalyst later
and membrane interface.
According to equation 23, ohmic loss is directly
related to membrane thickness (𝑡𝑚) and current density (I).
It is also inversely related to membrane protonic
conductivity (𝜎𝑚).
𝑅𝑜ℎ𝑚 =𝑡𝑚
𝜎𝑚
⇒ 𝜂𝑜ℎ𝑚 = 𝐼𝑅𝑜ℎ𝑚 (23)
Figures 12 and 13 illustrate the current density
distribution at the interface of cathode catalyst and
membrane. Current density indeed is electron flux in the cell
and while electrons flow through the solid phase (solid
phase of gas diffusion and catalyst layers), they want to
traverse the shortest path to achieve the bipolar plates,
therefore, its value is higher at the shoulder region. In
addition, current density amount dwindles along the flow
direction. As it has been mentioned before, the water
building up along the cathode catalyst layer (especially at
low voltages or high current densities) blocks the pores of
the porous media and consequently prevents the oxygen
reaching the reaction area. This fact leads to current density
reduction along the flow direction.
Simulation Analysis of Proton Exchange Membrane Fuel Cell (PEMFC) by using Computational Fluid Dynamics
(IJSRD/Vol. 4/Issue 06/2016/107)
All rights reserved by www.ijsrd.com 458
V=0.4v at Z=0 mm
V=0.6v at Z=0 mm
V=0.4v at Z=35 mm
V=0.6v at Z=35 mm
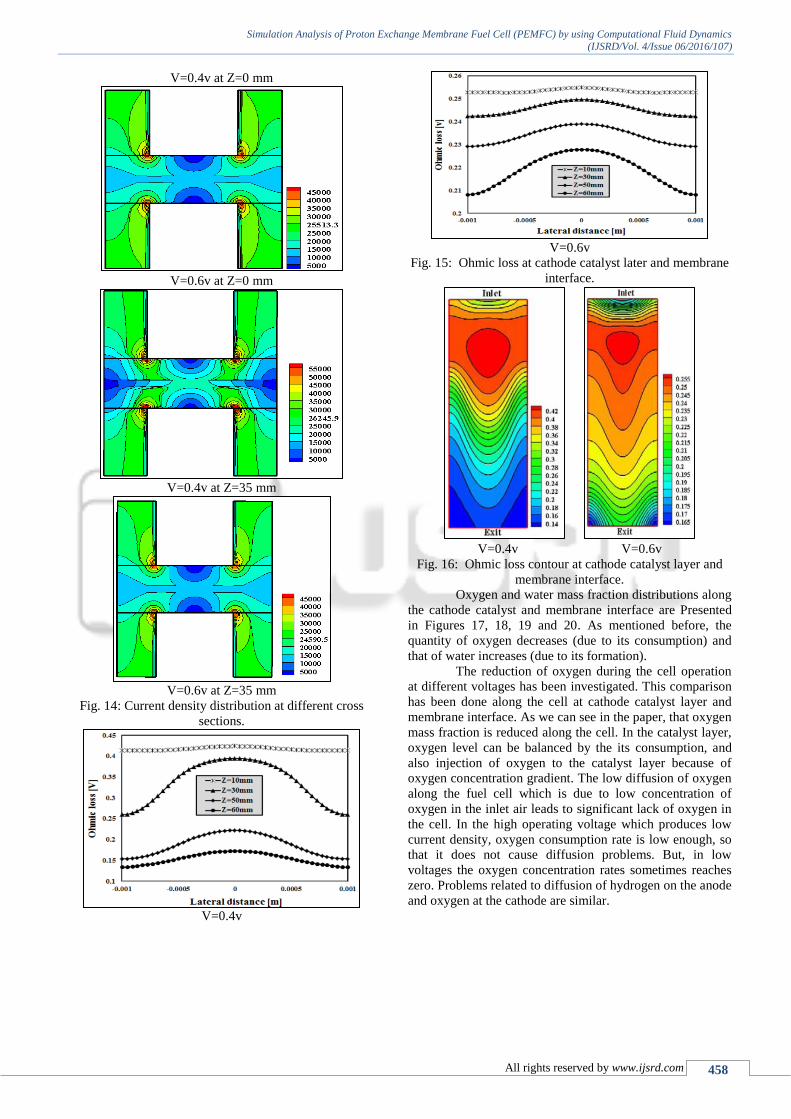
Fig. 14: Current density distribution at different cross
sections.
V=0.4v
V=0.6v
Fig. 15: Ohmic loss at cathode catalyst later and membrane
interface.
V=0.4v V=0.6v
Fig. 16: Ohmic loss contour at cathode catalyst layer and
membrane interface.
Oxygen and water mass fraction distributions along
the cathode catalyst and membrane interface are Presented
in Figures 17, 18, 19 and 20. As mentioned before, the
quantity of oxygen decreases (due to its consumption) and
that of water increases (due to its formation).
The reduction of oxygen during the cell operation
at different voltages has been investigated. This comparison
has been done along the cell at cathode catalyst layer and
membrane interface. As we can see in the paper, that oxygen
mass fraction is reduced along the cell. In the catalyst layer,
oxygen level can be balanced by the its consumption, and
also injection of oxygen to the catalyst layer because of
oxygen concentration gradient. The low diffusion of oxygen
along the fuel cell which is due to low concentration of
oxygen in the inlet air leads to significant lack of oxygen in
the cell. In the high operating voltage which produces low
current density, oxygen consumption rate is low enough, so
that it does not cause diffusion problems. But, in low
voltages the oxygen concentration rates sometimes reaches
zero. Problems related to diffusion of hydrogen on the anode
and oxygen at the cathode are similar.
Simulation Analysis of Proton Exchange Membrane Fuel Cell (PEMFC) by using Computational Fluid Dynamics
(IJSRD/Vol. 4/Issue 06/2016/107)
All rights reserved by www.ijsrd.com 459
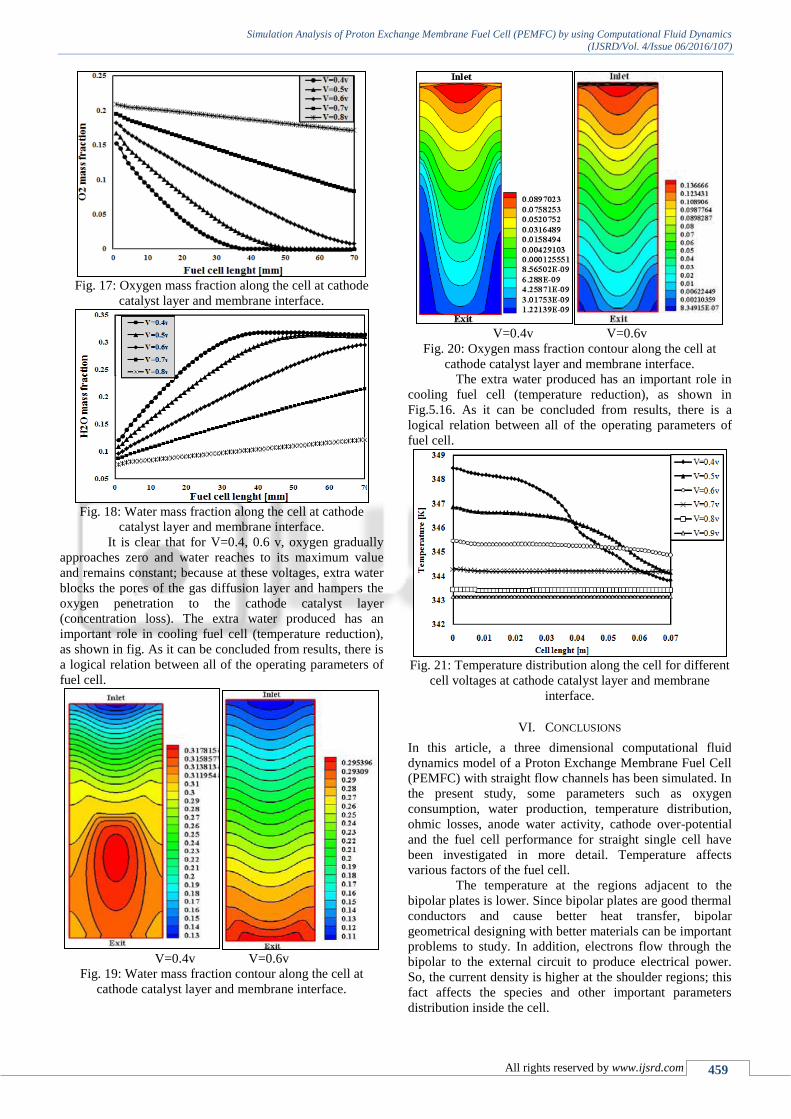
Fig. 17: Oxygen mass fraction along the cell at cathode
catalyst layer and membrane interface.
Fig. 18: Water mass fraction along the cell at cathode
catalyst layer and membrane interface.
It is clear that for V=0.4, 0.6 v, oxygen gradually
approaches zero and water reaches to its maximum value
and remains constant; because at these voltages, extra water
blocks the pores of the gas diffusion layer and hampers the
oxygen penetration to the cathode catalyst layer
(concentration loss). The extra water produced has an
important role in cooling fuel cell (temperature reduction),
as shown in fig. As it can be concluded from results, there is
a logical relation between all of the operating parameters of
fuel cell.
V=0.4v V=0.6v
Fig. 19: Water mass fraction contour along the cell at
cathode catalyst layer and membrane interface.
V=0.4v V=0.6v
Fig. 20: Oxygen mass fraction contour along the cell at
cathode catalyst layer and membrane interface.
The extra water produced has an important role in
cooling fuel cell (temperature reduction), as shown in
Fig.5.16. As it can be concluded from results, there is a
logical relation between all of the operating parameters of
fuel cell.
Fig. 21: Temperature distribution along the cell for different
cell voltages at cathode catalyst layer and membrane
interface.
VI. CONCLUSIONS
In this article, a three dimensional computational fluid
dynamics model of a Proton Exchange Membrane Fuel Cell
(PEMFC) with straight flow channels has been simulated. In
the present study, some parameters such as oxygen
consumption, water production, temperature distribution,
ohmic losses, anode water activity, cathode over-potential
and the fuel cell performance for straight single cell have
been investigated in more detail. Temperature affects
various factors of the fuel cell.
The temperature at the regions adjacent to the
bipolar plates is lower. Since bipolar plates are good thermal
conductors and cause better heat transfer, bipolar
geometrical designing with better materials can be important
problems to study. In addition, electrons flow through the
bipolar to the external circuit to produce electrical power.
So, the current density is higher at the shoulder regions; this
fact affects the species and other important parameters
distribution inside the cell.

Simulation Analysis of Proton Exchange Membrane Fuel Cell (PEMFC) by using Computational Fluid Dynamics
(IJSRD/Vol. 4/Issue 06/2016/107)
All rights reserved by www.ijsrd.com 460
On the other hand, the numerical simulations reveal
that these important operating parameters are highly
dependent to each other and the fuel cell efficiency is
affected by the kind of species distribution.
ACKNOWLEDGMENT
The authors would like to thank to M. R. Nagaraj, Associate
professor, Dept. of mechanical Engineering, PDA College
of Engineering Gulbarga. for an outstanding support.
REFERENCES
[1] Jang J.-H., Yan W.-M., Shih C.-C. Numerical study of
reactant gas transport phenomena and cell performance
of proton exchange membrane fuel cells. J Power
Sources, 2006, 156, 244–252.
[2] Bernardi D.M., Verbrugge M.W. Mathematical Model
of a Gas Dissusion Electrode Bonded to a Polymer
Electrolyte. AIChE J, 1991, 37(8):1151–1163.
[3] Bernardi D.M., Verbrugge M.W. A Mathematical
Model of the Solid- Polymer- Electrolyte Fuel Cell. J
Electrochem Soc, 1992, 39(9):2477–2491.
[4] Fuller T. F., Newman J. Water and Thermal
Management in Solid-Polymer-Electrolyte Fuel Cells. J
Electrochemical Soc, 1993, 140(5):1218– 1225.
[5] Nguyen T.V., White R.E. Water and heat management
model for proton-exchange membrane fuel cells. J
Electrochemical Soc, 1993, 140, 2178–2186.
[6] Gurau V., Liu H., Kakac S. “Two-Dimensional Model
for Proton Exchange Membrane Fuel Cells”. AIChE J.
1998, 44(11):2410–2422.
[7] Dutta S., Shimpalee S., Van Zee J.W. Numerical
prediction of mass-exchange between cathode and
anode channels in a PEM fuel cell. Int J Heat Mass
Transfer, 2001, 44, 2029–2042.
[8] Wang L., Husar A., Zhou T., Liu H. Int J Hydrogen
Energ, 2003, 28(11), 1263-1272.