Simulating the global atmospheric black carbon cycle: a … J. Hendricks et al.: Black carbon from...
21
Atmos. Chem. Phys., 4, 2521–2541, 2004 www.atmos-chem-phys.org/acp/4/2521/ SRef-ID: 1680-7324/acp/2004-4-2521 European Geosciences Union Atmospheric Chemistry and Physics Simulating the global atmospheric black carbon cycle: a revisit to the contribution of aircraft emissions J. Hendricks 1 , B. K ¨ archer 1 , A. D ¨ opelheuer 2 , J. Feichter 3 , U. Lohmann 4,* , and D. Baumgardner 5 1 DLR-Institut f¨ ur Physik der Atmosph¨ are, Oberpfaffenhofen, Germany 2 DLR-Institut f¨ ur Antriebstechnik, K ¨ oln, Germany 3 Max-Planck-Institut f¨ ur Meteorologie, Hamburg, Germany 4 Dalhousie University, Halifax, Canada 5 Centro de Ciencias de la Atm ´ osfera, Universidad Nacional Autonoma de Mexico, Mexico City, Mexico * now at: ETH, Institut f¨ ur Atmosph¨ are und Klima, Z ¨ urich, Switzerland Received: 19 April 2004 – Published in Atmos. Chem. Phys. Discuss.: 22 June 2004 Revised: 13 October 2004 – Accepted: 1 December 2004 – Published: 10 December 2004 Abstract. The black carbon (BC) burden of the upper tro- posphere and lowermost stratosphere (UTLS) is investigated with the general circulation model (GCM) ECHAM4. The special focus is the contribution of aircraft emissions to the UTLS BC loading. Previous studies on the role of aircraft emissions in the global BC cycle either neglect BC sources located at the Earth’s surface or simplify the BC cycle by as- suming pre-defined BC residence times. Here, the global BC cycle including emissions, transport, and removal is explic- itly simulated. The BC emissions considered include sur- face sources as well as BC from aviation. This enables a consistent calculation of the relative contribution of aviation to the global atmospheric BC cycle. As a further extension to the previous studies, the aviation-induced perturbation of the UTLS BC particle number concentration is investigated. The uncertainties associated with the model predictions are evaluated by means of several sensitivity studies. Especially, the sensitivity of the results to different assumptions on the BC hygroscopic properties is analysed. The simulated UTLS BC concentrations are compared to in-situ observations. The simulations suggest that the large-scale contribution of avia- tion to the UTLS BC mass budget typically amounts to only a few percent, even in the most frequented flight regions. The aviation impact far away from these regions is negligible. The simulated aircraft contributions to the UTLS BC par- ticle number concentration are much larger compared to the corresponding mass perturbations. The simulations suggest that aviation can cause large-scale increases in the UTLS BC particle number concentration of more than 30% in regions highly frequented by aircraft. The relative effect shows a pronounced annual variation with the largest relative aviation impact occurring during winter. Correspondence to: J. Hendricks ([email protected]) 1 Introduction Anthropogenic black carbon (BC) emissions cause signifi- cant perturbations of the global atmospheric aerosol burden (e.g. Penner et al., 1993; Cooke and Wilson, 1996; Liousse et al., 1996; Cooke et al., 1999, 2002). Different atmospheric impacts of BC aerosols have been discussed. Important cli- matic effects due to direct impacts on radiation can be ex- pected (e.g. Schult et al., 1997; Haywood and Ramaswamy, 1998; Myhre et al., 1998; Penner et al., 1998; Cooke et al., 1999; Chung and Seinfeld, 2002; Jacobson, 2002). Addition- ally, indirect climatic effects due to impacts on cloud droplet number concentration and related cloud properties have been considered (e.g. Lohmann et al., 2000). In the upper tro- posphere and lowermost stratosphere (UTLS), BC particles may be involved in ice cloud formation and may affect the frequency and optical properties of cirrus clouds (e.g. De- Mott et al., 1997; Jensen and Toon, 1997; Petzold et al., 1998; Str¨ om and Ohlsson, 1998; K¨ archer, 1999; Gierens, 2003; K¨ archer and Lohmann, 2003; Lohmann et al., 2004). Significant amounts of BC aerosols have been observed in the UTLS (e.g. Pueschel et al., 1992; Blake and Kato, 1995; Baumgardner et al., 2003, 2004). Three-dimensional (3-D) model calculations indicate a significant BC loading of the UTLS (e.g. Cooke and Wilson, 1996; Liousse et al., 1996; Cooke et al., 1999, 2002; Koch, 2001; K¨ ohler et al., 2001; Chung and Seinfeld, 2002). Black carbon aerosols are an important combustion product of aircraft engines (e.g. IPCC, 1999). Therefore, it has been debated whether avi- ation may contribute significantly to the BC budget of the UTLS region. Danilin et al. (1998) discussed global sim- ulations on the atmospheric dispersion of aircraft fuel tracer emissions performed with different 2-D and 3-D models con- sidering pre-defined tracer lifetimes. From the fuel tracer dis- tributions, the aircraft-induced increase in atmospheric BC © 2004 Author(s). This work is licensed under a Creative Commons License.
Transcript of Simulating the global atmospheric black carbon cycle: a … J. Hendricks et al.: Black carbon from...

Atmos. Chem. Phys., 4, 2521–2541, 2004www.atmos-chem-phys.org/acp/4/2521/SRef-ID: 1680-7324/acp/2004-4-2521European Geosciences Union
AtmosphericChemistry
and Physics
Simulating the global atmospheric black carbon cycle: a revisit tothe contribution of aircraft emissions
J. Hendricks1, B. Karcher1, A. Dopelheuer2, J. Feichter3, U. Lohmann4,*, and D. Baumgardner5
1DLR-Institut fur Physik der Atmosphare, Oberpfaffenhofen, Germany2DLR-Institut fur Antriebstechnik, Koln, Germany3Max-Planck-Institut fur Meteorologie, Hamburg, Germany4Dalhousie University, Halifax, Canada5Centro de Ciencias de la Atmosfera, Universidad Nacional Autonoma de Mexico, Mexico City, Mexico* now at: ETH, Institut fur Atmosphare und Klima, Zurich, Switzerland
Received: 19 April 2004 – Published in Atmos. Chem. Phys. Discuss.: 22 June 2004Revised: 13 October 2004 – Accepted: 1 December 2004 – Published: 10 December 2004
Abstract. The black carbon (BC) burden of the upper tro-posphere and lowermost stratosphere (UTLS) is investigatedwith the general circulation model (GCM) ECHAM4. Thespecial focus is the contribution of aircraft emissions to theUTLS BC loading. Previous studies on the role of aircraftemissions in the global BC cycle either neglect BC sourceslocated at the Earth’s surface or simplify the BC cycle by as-suming pre-defined BC residence times. Here, the global BCcycle including emissions, transport, and removal is explic-itly simulated. The BC emissions considered include sur-face sources as well as BC from aviation. This enables aconsistent calculation of the relative contribution of aviationto the global atmospheric BC cycle. As a further extensionto the previous studies, the aviation-induced perturbation ofthe UTLS BC particle number concentration is investigated.The uncertainties associated with the model predictions areevaluated by means of several sensitivity studies. Especially,the sensitivity of the results to different assumptions on theBC hygroscopic properties is analysed. The simulated UTLSBC concentrations are compared to in-situ observations. Thesimulations suggest that the large-scale contribution of avia-tion to the UTLS BC mass budget typically amounts to onlya few percent, even in the most frequented flight regions. Theaviation impact far away from these regions is negligible.The simulated aircraft contributions to the UTLS BC par-ticle number concentration are much larger compared to thecorresponding mass perturbations. The simulations suggestthat aviation can cause large-scale increases in the UTLS BCparticle number concentration of more than 30% in regionshighly frequented by aircraft. The relative effect shows apronounced annual variation with the largest relative aviationimpact occurring during winter.
Correspondence to:J. Hendricks([email protected])
1 Introduction
Anthropogenic black carbon (BC) emissions cause signifi-cant perturbations of the global atmospheric aerosol burden(e.g.Penner et al., 1993; Cooke and Wilson, 1996; Liousseet al., 1996; Cooke et al., 1999, 2002). Different atmosphericimpacts of BC aerosols have been discussed. Important cli-matic effects due to direct impacts on radiation can be ex-pected (e.g.Schult et al., 1997; Haywood and Ramaswamy,1998; Myhre et al., 1998; Penner et al., 1998; Cooke et al.,1999; Chung and Seinfeld, 2002; Jacobson, 2002). Addition-ally, indirect climatic effects due to impacts on cloud dropletnumber concentration and related cloud properties have beenconsidered (e.g.Lohmann et al., 2000). In the upper tro-posphere and lowermost stratosphere (UTLS), BC particlesmay be involved in ice cloud formation and may affect thefrequency and optical properties of cirrus clouds (e.g.De-Mott et al., 1997; Jensen and Toon, 1997; Petzold et al., 1998;Strom and Ohlsson, 1998; Karcher, 1999; Gierens, 2003;Karcher and Lohmann, 2003; Lohmann et al., 2004).
Significant amounts of BC aerosols have been observedin the UTLS (e.g.Pueschel et al., 1992; Blake and Kato,1995; Baumgardner et al., 2003, 2004). Three-dimensional(3-D) model calculations indicate a significant BC loadingof the UTLS (e.g.Cooke and Wilson, 1996; Liousse et al.,1996; Cooke et al., 1999, 2002; Koch, 2001; Kohler et al.,2001; Chung and Seinfeld, 2002). Black carbon aerosolsare an important combustion product of aircraft engines (e.g.IPCC, 1999). Therefore, it has been debated whether avi-ation may contribute significantly to the BC budget of theUTLS region. Danilin et al. (1998) discussed global sim-ulations on the atmospheric dispersion of aircraft fuel traceremissions performed with different 2-D and 3-D models con-sidering pre-defined tracer lifetimes. From the fuel tracer dis-tributions, the aircraft-induced increase in atmospheric BC
© 2004 Author(s). This work is licensed under a Creative Commons License.

2522 J. Hendricks et al.: Black carbon from aviation
mass loading was derived considering typical BC emissionindices.Rahmes et al.(1998) performed 2-D simulations onthe aircraft contribution to the atmospheric BC mass load-ing including a detailed representation of processes control-ling the atmospheric BC cycle. TheDanilin et al. (1998)and Rahmes et al.(1998) model studies reveal maximumzonal mean aircraft-induced perturbations in the range of0.1–1 ng(BC)/m3 occurring in the northern mid- and high lat-itude UTLS. However, since the effect of surface BC emis-sions on the UTLS region was not included in the models, therelative impact of aviation BC emissions could not be quan-tified. Detailed knowledge about the total BC loading of theUTLS or about the contribution of BC from surface sourcesto the UTLS BC budget is required to evaluate the relativeimportance of the aviation impact.
Comparing the observational data provided byPueschelet al.(1992) andBlake and Kato(1995) with the model stud-ies byDanilin et al. (1998) andRahmes et al.(1998), onefinds that the BC concentrations measured in the northernhemispheric mid- and high latitude UTLS are comparable tothe simulated aircraft-induced perturbations. However, re-cent observations byBaumgardner et al.(2003, 2004) revealthat UTLS BC concentrations can be significantly larger thanthe simulated aviation-induced BC levels. The observationaldata currently available is too sparse to provide climatolog-ical information on the global BC mass budget. Hence, arobust evaluation of the importance of the simulated aviationimpact on the basis of observations is currently not possible.
Information on the UTLS background BC concentrations,attributed to BC from surface sources, can be gained fromother global model studies focused on the atmospheric dis-persion of BC from surface emissions (e.g.Cooke and Wil-son, 1996; Liousse et al., 1996; Cooke et al., 1999; Koch,2001; Cooke et al., 2002; Kohler et al., 2001; Chung andSeinfeld, 2002). The UTLS background BC concentrationssimulated with the various models can show large differ-ences. Since also the aviation-induced perturbations sim-ulated with the different model approaches discussed byDanilin et al.(1998) andRahmes et al.(1998) differ signifi-cantly, calculations of the relative impact of aviation shouldbe based on a consistent model approach including both sur-face BC emissions as well as BC from aviation. The onlystudy analysing the aviation impact with such a consistentapproach was provided byKohler et al.(2001). The study re-veals that the contribution of aviation to the UTLS BC massloading is small (generally<1%). However,Kohler et al.(2001) stressed that, due to the consideration of pre-definedBC half-lifetimes in their simulations, a reliable quantifica-tion of the aviation impact was not possible. This indicatesthe need for a more physically-based consistent simulation ofthe respective contributions of aviation and surface sources tothe UTLS BC budget.
In the present study, the impact of aviation on the globalBC budget is quantified by means of simulations with a gen-eral circulation model (GCM) considering both 3-D aircraft
BC emissions as well as BC from surface sources. The at-mospheric BC cycle including BC emissions, transport, andremoval by wet and dry deposition is simulated explicitly.Aircraft-related BC is treated separately from BC particlesresulting from surface emissions to track its atmospheric fate.The previous model studies focused on the atmospheric BCmass loading. Given the potential impact of BC particleson ice cloud formation via heterogeneous nucleation, poten-tial aircraft-induced impacts on the BC particle number con-centration in the UTLS region are also investigated here. InSect.2, the model is described in detail. Section3.1 reportson the simulations performed. The major results as well asthe uncertainties associated with the model predictions arediscussed in Sect.3.2. The main conclusions are given inSect.4.
2 Model description
2.1 General description
The ECHAM4 GCM (Roeckner et al., 1996) is applied. Stan-dard prognostic variables are vorticity, divergence, tempera-ture, (logarithm of) surface pressure, water vapor and cloudwater. The model includes physical parameterizations ofradiation, cloud processes, precipitation, convection, diffu-sion, planetary boundary layer dynamics, land-surface pro-cesses as well as gravity wave drag. A spectral transformapproach with triangular truncation at zonal wave number 30(T30) is used. This results in a nominal horizontal resolu-tion of approximately 3.75◦ in latitude and longitude. Themodel domain covers the vertical range from the surface to10 hPa using 19 vertical layers characterized by a hybridσ -p-coordinate system. A semi-implicit leap frog scheme isapplied for time integration. A time step1t of 30 min isused. The horizontal and vertical advection of positive def-inite quantities like water vapor, cloud water or trace con-stituents is calculated applying a semi-Lagrangian scheme(Williamson and Rasch, 1994).
2.2 Aerosols and clouds
The model version employed here includes explicit predic-tions of cloud water, cloud ice, as well as cloud droplet andice crystal number concentration (Lohmann and Roeckner,1996; Lohmann et al., 1999; Lohmann and Karcher, 2002).The convective transport of trace constituents is treated ac-cording toBrinkop and Sausen(1997). Aerosols are repre-sented as described byFeichter et al.(1996) andLohmannet al.(1999). The aerosol module treats the atmospheric cy-cles of sulfate aerosols, carbonaceous particles (organic car-bon as well as BC), sea-salt, and mineral dust aerosols. Par-ticle mass concentrations of the respective aerosol types arepredicted each time step. Emissions of BC particles, repre-sentative of the mid-1980s, are considered as described byCooke and Wilson(1996) resulting in global BC emission
Atmos. Chem. Phys., 4, 2521–2541, 2004 www.atmos-chem-phys.org/acp/4/2521/

J. Hendricks et al.: Black carbon from aviation 2523
rates of 7.96 and 5.98 TgC yr−1 for BC emissions due to fos-sil fuel combustion and biomass burning, respectively. Thehygroscopic properties of BC particles are represented ac-cording toCooke et al.(1999) assuming that the BC surfaceemissions can be characterized as 80% hydrophobic and 20%hydrophilic particles and that hydrophobic BC is transformedto hydrophilic BC according to an exponential decay processshowing an e-folding time of 24 h. BC is removed from theatmosphere by wet and dry deposition. Dry deposition ratesare calculated according to the surface conditions and the BChygroscopic properties. Wet deposition occurs via precipita-tion scavenging of hydrophilic BC. It is assumed that 90%of the in-cloud hydrophilic BC mass is scavenged by clouddroplets. This is consistent with upper limit in-cloud BCscavenging rates reported in the literature (e.g.Hitzenbergeret al., 2001). The BC precipitation flux is then calculatedfrom the in-cloud precipitation formation rate as well as fromthe efficiencies of below-cloud evaporation and below-cloudscavenging of BC by rain or snow. In contrast toLohmannand Karcher(2002), the mass scavenging efficiency of hy-drophilic aerosols by ice is chosen as 5% instead of 10%.With this modification, the sulfate mass concentrations sim-ulated for the tropopause region are in better agreement withrecent observations (Dibb et al., 1998, 2000).
To calculate particle number concentrations from the sim-ulated aerosol mass concentrations, prescribed particle sizedistributions typical of the respective aerosol type are em-ployed. Lognormal size distributions as described byKopkeet al. (1997) and Hess et al.(1998) are used for eachindividual aerosol type. Aged BC particles are mostlyfractal clusters which can be characterized as long, oftenmulti-connected chains consisting of tiny spherical elements.These spherules are referred to as primary BC particles. Fol-lowing Kopke et al.(1997), the particle size distribution ofthe spherules is characterized by a number median diame-ter of d=0.0236µm and a geometric standard deviation ofσ=2.0. A specific density of the subspheres of 2.3 g cm−3
is assumed. To derive the BC particle number concentrationfrom the BC mass concentration, knowledge about the aver-age number of primary particles agglomerated to form an at-mospheric BC particle is required. The numbern of primaryparticles encountered in single atmospheric BC particles canbe highly variable even in the upper troposphere and thestratosphere (e.g.Blake and Kato(1995) or Pueschel et al.(2000) for UTLS BC; Strawa et al.(1999) for stratosphericBC). Observational information onn at these altitudes is toosparse to enable robust assumptions on a representative valueof n. The available measurements suggest thatn has an or-der of magnitude of 10–100. However, small BC particlesare underrepresented in these measurements. Hence, we as-sume that BC particles resulting from surface sources con-tain 10 primary particles on average. With this assumptionthe BC particle number concentration can be derived fromthe BC mass concentration. The potential consequences ofthe choice ofn for the results of the present study are dis-
cussed in Sect.3.2.5. Aircraft-related BC particles can showdifferent sizes and morphologies compared to BC related tosurface sources. The treatment of aircraft-induced particlesin the model is described below.
2.3 Aircraft BC emissions
Aircraft BC emissions are calculated here from the globalaviation fuel consumption data provided bySchmitt andBrunner(1997) for aircraft activity as occurred in 1992. Thedata contains information on the global distribution of air-craft fuel use and its annual cycle. A detailed error analysisof global aviation fuel consumption scenarios (IPCC, 1999)reveals that the fuel consumption data used here accounts foronly 73% of the amount of aviation fuel produced in 1992.Hence, aviation fuel consumption may be underrepresentedin the present study by up to 20–30%. According to the an-nual growth rate of aviation fuel consumption (about 4% peryear in the 1984 to 1992 period;IPCC, 1999), the aviationfuel use has increased by about 30% from the mid-1980s to1992. Hence, an underestimation as described above wouldmake the aviation fuel consumption data more conformablewith the BC surface emissions which are representative ofthe mid-1980s.
BC emission rates are derived from the aircraft fuel con-sumption data using BC emission indices (EIs) typical ofcommercial aircraft operating in 1992. Emission indicesfor BC mass emission rates, EI(M), have been provided byDopelheuer(1997) and Petzold et al.(1999). An updateof these EIs including an altitudinal variation is used here.Representative EIs were determined for different altitudesby means of a correlation method considering variations inengine type and power conditions (Dopelheuer, 2002). Asshown in Fig.1, the EI(M) decreases from values in therange of 0.08 g(BC)/kg(fuel) at the lowest flight levels tovalues around 0.02 g(BC)/kg(fuel) at 11.5 km and increasesagain to 0.08 g(BC)/kg(fuel) at 16 km to account for super-sonic aircraft. The 1992 fleet average EI(M) amounts to0.038 g(BC)/kg(fuel). The correlation method used to deter-mine these EIs is conform to the measured emission data cur-rently available within a maximum deviation of 10%. Hencethe potential uncertainties of the correlation method used tocalculate the EIs appear to be too small to result in significantuncertainties of the BC simulations performed here.
To derive the number concentration of BC particles re-sulting from aviation, aircraft exhaust BC number-to-massratios also representative of the 1992 fleet are employed(Dopelheuer, 2002). The number-to-mass ratios, also re-ferred to as particle number EIs or EI(N), range from4.8×1015 particles/g(BC) at the surface to around 1.6×10¹⁶
particles/g(BC) at cruise altitude (Fig.1). The correla-tion method used to derive the EI(N) reproduces measurednumber-to-mass ratios with an accuracy of±10%. Note, thatthe EI(N) exceed the number-to-mass ratio assumed for par-ticles related to surface sources (Sect.2.2) by an order of
www.atmos-chem-phys.org/acp/4/2521/ Atmos. Chem. Phys., 4, 2521–2541, 2004

2524 J. Hendricks et al.: Black carbon from aviation
Fig. 1. Vertical profiles of aircraft emission indices for the BC mass(solid) and particle number emission (dashed), representative of the1992 aircraft fleet. For details see Sect.2.3andDopelheuer(2002).
magnitude (factor 22 at cruise altitude, factor 7 at surface).This is consistent with measurements of particle size distri-butions of freshly emitted BC. The measurements suggestthat BC generated by biomass burning (e.g.Radke et al.,1988; Penner et al., 1998) or fossil fuel combustion (e.g.Maricq et al., 1999) at the Earth’s surface show a much largerfraction of large BC particles (accumulation mode size range;> ∼100 nm) than BC emitted by aircraft at cruise altitudeswhich mostly shows particle sizes smaller than 100 nm (Pet-zold et al., 1999). This is mainly caused by the more efficientcombustion in aircraft engines.
Annual mean vertically integrated BC emissions due toaviation, derived from the aviation fuel consumption dataand the EIs described above, are displayed in Fig.2. Thefigure reveals that the major fraction of the aircraft BC emis-sions occur at northern midlatitudes, especially over NorthAmerica, the North Atlantic, and Europe. The vertical dis-tribution of the BC emission rates considered (not shown)reveals that 38% by mass and 58% by number of the totalaircraft BC emissions occur at the main flight levels between10 km and 12 km altitude. The seasonal variation consid-ered (not shown) can be large in remote areas but is onlysmall in the main flight regions (mostly within 10%). Thetotal global emission rate of BC from aviation amounts to0.0047 TgC yr−1.
2.4 Aircraft BC mass concentration
To quantify the aircraft contribution to the total BC bur-den in our simulations, aircraft-related BC is numericallyrepresented as an individual trace constituent treated sepa-rately from BC originating from surface sources. The emis-
Fig. 2. Annual mean vertically integrated BC emissions due to avi-ation. The emission rates were derived from aviation fuel consump-tion data and emission indices for the 1992 global fleet (see Sect.2.3for details).
sion rates of BC from aviation are calculated as describedin Sect.2.3. It is likely that aircraft-generated BC particlesbecome hydrophilic due to activation by chemical process-ing or deposition of H2O and water soluble material in con-trails and perhaps also in plumes that do not form contrails(Karcher, 1999). Hence aircraft-induced BC is generally as-sumed to be hydrophilic in the present study. Therefore, themass cycle of BC from aircraft is simulated as described inSect.2.2for hydrophilic BC. The particle number concentra-tion of aviation-induced BC is treated differently from thatof BC particles originating from surface sources. This willbe described in the following.
2.5 Aircraft BC particle number concentration
2.5.1 General remarks
As mentioned in Sect.2.2, the number concentration of BCparticles from surface sources is derived from the mass con-centration assuming a constant number-to-mass ratio. Thisappears to be justified since BC from surface sources canprobably be regarded as aged aerosol in the UTLS character-ized by a quasi-invariant size distribution. However, BC fromaircraft may possess highly variable number-to-mass ratiosranging from those values which are characteristic of freshexhaust (Sect.2.3) to smaller values typical of aged parti-cles. The latter may show a larger degree of agglomerationand may also be mixed with particulate matter not generatedby aircraft. Many processes relevant for the ageing of BCfrom aircraft, for instance, the processing of BC by clouds,are currently not well understood. Many effects of aircraft
Atmos. Chem. Phys., 4, 2521–2541, 2004 www.atmos-chem-phys.org/acp/4/2521/

J. Hendricks et al.: Black carbon from aviation 2525
BC ageing are conceivable, but observational confirmationis lacking. Regarding these uncertainties, a detailed quan-tification of the BC particle number concentrations was notattempted in this study. Nevertheless, maximum and min-imum estimates of the aircraft-induced BC particle numberperturbations were performed (Fig.3).
2.5.2 Maximum estimate
A maximum estimateNmax of the number concentration ofBC particles from aircraft can be obtained by assuming thatthe number-to-mass ratio is not affected by particle ageing.Therefore, the high BC number-to-mass ratio EI(N) typicalfor fresh exhaust (Sect.2.3) applies to the total mass concen-tration simulated for BC from aviationMBCaircraf t :
Nmax = EI (N) × MBCaircraf t (1)
For details on the implementation of Eq. (1), we refer toSect.2.5.4.
2.5.3 Minimum estimate
A minimum estimate of the number concentration of aircraft-generated BC particles can be achieved considering only theparticle fraction which was not affected by ageing processesreducing the particle number-to-mass ratio. To achieve this,MBCaircraf t is subdivided into “fresh” BC with the massconcentrationMf and “aged” BC with the mass concen-tration Ma . “Fresh” BC is generated in the model accord-ing to the BC emission rate. The transformation of “fresh”to “aged” particles is parameterized considering the majorageing processes which potentially reduce the number-to-mass ratio. Considering a maximum efficiency of these age-ing processes results in a minimum estimateMf,min of theamount of “fresh” BC from aviation.
To account for the BC ageing caused by aerosol-aerosolinteractions in aircraft plumes, we follow the approach byKarcher and Meilinger(1998) to parameterize aircraft ex-haust particle ageing. According to this approach, the dom-inant aerosol-aerosol interaction leading to changed BC par-ticle number concentrations in ageing aircraft plumes isthe scavenging of BC particles by larger liquid backgroundaerosols in the accumulation mode size range. This pro-cess, which is still relevant after dispersion of the exhaustto large scales, results in liquid particles showing one or sev-eral BC immersions. Following the approach byKarcher andMeilinger (1998), the number of fresh aircraft BC particles(not scavenged by larger aerosols) is estimated here as:
Nf (t + 1t) = Nf (t) × exp[−Ks,bNl(t)1t]. (2)
Here Nf (t) and Nl(t) are the number concentrations offresh aircraft-generated BC particles and accumulation modebackground particles, respectively,Ks,b is a coagulation co-efficient, and1t is the model time step. A coagulation co-efficient of Ks,b=10−8 cm3s−1 was chosen based onFuchs
Aviation fuel consumption data
EI (M)
Transport Removal
Aircraft BC number concentration
minimum estimate N min
EI (N)
Aircraft BC mass concentration
M BC aircraft
Minimum mass concentration of fresh aircraft BC
M f, min
Maximum mass concentration of aged aircraft BC
M a, max
Exhaust ageing(maximum efficiency)
EI (N)
Aircraft BC number concentration
maximum estimate N max
Fig. 3. Flow chart of the approach to obtain minimum and maxi-mum estimates of the number concentration of BC particles fromaircraft. For a detailed description of the method, we refer toSects.2.4and2.5.
(1964) and on the particle sizes of aircraft-generated BC andbackground aerosols (Petzold et al., 1999; Schroder et al.,2002). The number concentrationNl(t) is calculated fromthe simulated liquid aerosol mass concentration and observedaerosol size distributions (Schroder et al., 2002). In order toobtain a minimum estimate of the aircraft BC particle num-ber concentration, the maximum possible scavenging rateshould be considered. Therefore,Nl was increased by a fac-tor of 5 to represent maximum number concentrations of ac-cumulation mode particles observed in the UTLS (Petzoldet al., 2002; Minikin et al., 2003).
In order to calculateMf,min, it is assumed that the masstransformation rate scales with the rate of number transfor-mation given by Eq. (2). This assumption is justified sincethe size distribution of aircraft-generated BC is dominatedby particles in a comparatively narrow size range (e.g.Pet-zold et al., 1999) and, therefore, impacts of particle size onthe scavenging process are of secondary importance.
Ageing of aircraft-induced BC populations may also oc-cur via cloud processing. BC particles from aircraft can bescavenged by cloud droplets or ice crystals. The BC parti-cles can then be removed by precipitation or can be releasedby re-evaporation of clouds or precipitation. In the case ofre-evaporation, the released aircraft BC particles could beincorporated within larger agglomerates of scavenged par-ticles. Hence, cloud processing potentially results in a re-duction of the aircraft BC particle number-to-mass ratio. Inorder to perform a minimum estimate of the amount of fresh
www.atmos-chem-phys.org/acp/4/2521/ Atmos. Chem. Phys., 4, 2521–2541, 2004
2526 J. Hendricks et al.: Black carbon from aviation
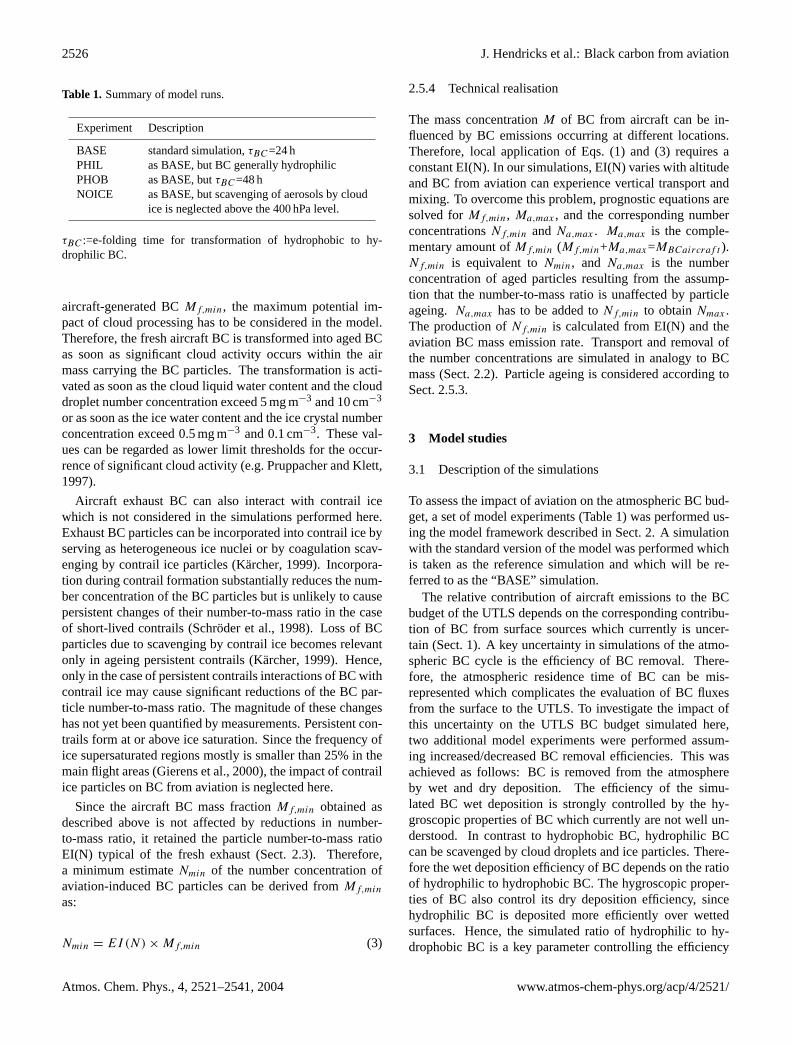
Table 1. Summary of model runs.
Experiment Description
BASE standard simulation,τBC=24 hPHIL as BASE, but BC generally hydrophilicPHOB as BASE, butτBC=48 hNOICE as BASE, but scavenging of aerosols by cloud
ice is neglected above the 400 hPa level.
τBC :=e-folding time for transformation of hydrophobic to hy-drophilic BC.
aircraft-generated BCMf,min, the maximum potential im-pact of cloud processing has to be considered in the model.Therefore, the fresh aircraft BC is transformed into aged BCas soon as significant cloud activity occurs within the airmass carrying the BC particles. The transformation is acti-vated as soon as the cloud liquid water content and the clouddroplet number concentration exceed 5 mg m−3 and 10 cm−3
or as soon as the ice water content and the ice crystal numberconcentration exceed 0.5 mg m−3 and 0.1 cm−3. These val-ues can be regarded as lower limit thresholds for the occur-rence of significant cloud activity (e.g.Pruppacher and Klett,1997).
Aircraft exhaust BC can also interact with contrail icewhich is not considered in the simulations performed here.Exhaust BC particles can be incorporated into contrail ice byserving as heterogeneous ice nuclei or by coagulation scav-enging by contrail ice particles (Karcher, 1999). Incorpora-tion during contrail formation substantially reduces the num-ber concentration of the BC particles but is unlikely to causepersistent changes of their number-to-mass ratio in the caseof short-lived contrails (Schroder et al., 1998). Loss of BCparticles due to scavenging by contrail ice becomes relevantonly in ageing persistent contrails (Karcher, 1999). Hence,only in the case of persistent contrails interactions of BC withcontrail ice may cause significant reductions of the BC par-ticle number-to-mass ratio. The magnitude of these changeshas not yet been quantified by measurements. Persistent con-trails form at or above ice saturation. Since the frequency ofice supersaturated regions mostly is smaller than 25% in themain flight areas (Gierens et al., 2000), the impact of contrailice particles on BC from aviation is neglected here.
Since the aircraft BC mass fractionMf,min obtained asdescribed above is not affected by reductions in number-to-mass ratio, it retained the particle number-to-mass ratioEI(N) typical of the fresh exhaust (Sect.2.3). Therefore,a minimum estimateNmin of the number concentration ofaviation-induced BC particles can be derived fromMf,min
as:
Nmin = EI (N) × Mf,min (3)
2.5.4 Technical realisation
The mass concentrationM of BC from aircraft can be in-fluenced by BC emissions occurring at different locations.Therefore, local application of Eqs. (1) and (3) requires aconstant EI(N). In our simulations, EI(N) varies with altitudeand BC from aviation can experience vertical transport andmixing. To overcome this problem, prognostic equations aresolved forMf,min, Ma,max , and the corresponding numberconcentrationsNf,min andNa,max . Ma,max is the comple-mentary amount ofMf,min (Mf,min+Ma,max=MBCaircraf t ).Nf,min is equivalent toNmin, and Na,max is the numberconcentration of aged particles resulting from the assump-tion that the number-to-mass ratio is unaffected by particleageing. Na,max has to be added toNf,min to obtainNmax .The production ofNf,min is calculated from EI(N) and theaviation BC mass emission rate. Transport and removal ofthe number concentrations are simulated in analogy to BCmass (Sect.2.2). Particle ageing is considered according toSect.2.5.3.
3 Model studies
3.1 Description of the simulations
To assess the impact of aviation on the atmospheric BC bud-get, a set of model experiments (Table1) was performed us-ing the model framework described in Sect.2. A simulationwith the standard version of the model was performed whichis taken as the reference simulation and which will be re-ferred to as the “BASE” simulation.
The relative contribution of aircraft emissions to the BCbudget of the UTLS depends on the corresponding contribu-tion of BC from surface sources which currently is uncer-tain (Sect.1). A key uncertainty in simulations of the atmo-spheric BC cycle is the efficiency of BC removal. There-fore, the atmospheric residence time of BC can be mis-represented which complicates the evaluation of BC fluxesfrom the surface to the UTLS. To investigate the impact ofthis uncertainty on the UTLS BC budget simulated here,two additional model experiments were performed assum-ing increased/decreased BC removal efficiencies. This wasachieved as follows: BC is removed from the atmosphereby wet and dry deposition. The efficiency of the simu-lated BC wet deposition is strongly controlled by the hy-groscopic properties of BC which currently are not well un-derstood. In contrast to hydrophobic BC, hydrophilic BCcan be scavenged by cloud droplets and ice particles. There-fore the wet deposition efficiency of BC depends on the ratioof hydrophilic to hydrophobic BC. The hygroscopic proper-ties of BC also control its dry deposition efficiency, sincehydrophilic BC is deposited more efficiently over wettedsurfaces. Hence, the simulated ratio of hydrophilic to hy-drophobic BC is a key parameter controlling the efficiency
Atmos. Chem. Phys., 4, 2521–2541, 2004 www.atmos-chem-phys.org/acp/4/2521/

J. Hendricks et al.: Black carbon from aviation 2527
of both wet and dry BC removal processes. In the BASEsimulation, 80% of the BC emissions from surface sourcesare assumed as hydrophobic, 20% as hydrophilic (Sect.2.2).With an e-folding time of 24 h, hydrophobic BC is assumedto become hydrophilic. In the first sensitivity experiment,BC particles are generally assumed to be hydrophilic (ex-periment “PHIL”). Consequently, BC is removed more effi-ciently compared to the BASE simulation. In a second sen-sitivity experiment, an e-folding time of 48 h is assumed forthe conversion of hydrophobic into hydrophilic BC (exper-iment “PHOB”). Therefore BC is removed less efficientlycompared to the BASE simulation.
In the global model study byDanilin et al.(1998) on theaviation impact on the UTLS BC load (Sect.1), the impact ofwet removal was neglected above 400 hPa. In order to makethe results of the present study more comparable to the previ-ous study and in order to assess the impact of BC removal inhigh clouds, a third sensitivity experiment (“NOICE”) wasaccomplished. Cloud water in the UTLS is mainly presentin the ice phase. In the NOICE simulation, scavenging ofBC by ice particles is neglected above the 400 hPa pressurelevel. The NOICE simulation will be discussed in Sect.3.2.4where we compare our results to the simulations performedby Danilin et al.(1998).
The model experiments described above are based on sim-ulations assuming a prescribed annual cycle of sea surfacetemperatures according to climatological values for the re-spective month. For each individual experiment, 4-year in-tegrations were performed after a 15-month model spin-up.To provide a robust statistical base for the main conclusions,additional 6 model years were simulated for the BASE ex-periment. The prolonged (10-year) integration leads to verysimilar conclusions than the 4-year BASE simulation. Thedifferences in the UTLS BC load occurring between the 4-year and the 10-year simulations are generally not larger thana few percent. There is no trend detectable in the UTLS.These statements hold for total BC and for aircraft-inducedBC as well. Hence, with regard to the high computationalexpenses of the simulations, prolonged integrations were notperformed for the PHIL, PHOB and NOICE experiments.
3.2 Results and discussion
3.2.1 Global distribution of UTLS BC mass loading
Global distributions of the total BC mass concentration simu-lated for the 250 hPa pressure level are shown in Fig.4. The250 hPa level is chosen since it is located within the mainaircraft flight levels. The figure shows results obtained forwinter and summer conditions in the BASE, the PHIL andthe PHOB experiments.
The BC concentrations simulated in the BASE simulationfor 250 hPa range between about 0.5 and 10 ng/m3. The BCconcentration fields at that pressure level clearly reflect thespatial and temporal variability of the BC surface sources de-
scribed, for instance, byLiousse et al.(1996) andCooke andWilson (1996). As it will be shown in Sect.3.2.4, the UTLSBC mass budget simulated here is dominated by BC origi-nating from the surface.
The southern hemispheric BC sources are dominated bybiomass burning. Due to the strong temporal and spatial vari-ability of biomass burning events, also the BC concentrationssimulated for 250 hPa in the southern hemisphere are charac-terized by a strong spatial and seasonal variability. At severallocations, the southern hemispheric BC fields simulated forspring and autumn conditions (not shown) are very differentfrom the BC fields obtained for the winter and summer sea-sons.
The BC emissions in the northern hemisphere, especiallyin the extratropics, are dominated by fossil fuel combustion.The major emission regions of BC from fossil fuel combus-tion are North America, Europe, and Southeast Asia. Due toupward transport of BC from the boundary layer, the plumesof these emission regions can clearly be identified at 250 hPashowing a significant spatial shift induced by westerly flows.Since the seasonal variation of the fossil fuel combustionsource is small (such variation is not considered here for sur-face sources), these plumes are the persistent features in thenorthern midlatitude BC concentration field at 250 hPa at allseasons. The corresponding concentrations are highest dur-ing summer and lowest during winter which can be attributedto the seasonal cycle in vertical transport efficiency.
As in previous global model studies (e.g.Cooke and Wil-son, 1996; Cooke et al., 2002), the results obtained in thePHIL and PHOB experiments reveal that the BC concentra-tions simulated for the UTLS show a marked sensitivity tothe prescribed hygroscopic properties of BC. When BC is to-tally hydrophilic (case PHIL), the simulated UTLS BC con-centrations are significantly smaller compared to the BASEcase. If a larger fraction of BC is hydrophobic (case PHOB),the UTLS BC concentration increases by factors around 2compared to the reference experiment. These differencesare also reflected in the total atmospheric BC burden which,on average, amounts to 0.213, 0.174 and 0.244 TgC in theBASE, PHIL and PHOB simulations, respectively.
3.2.2 Comparison to observations
The sensitivity experiments described above were performedsince the current knowledge about the BC hygroscopicityand BC-cloud interactions is poor. To evaluate which of theexperiments is most realistic with regard to UTLS BC, themodel results have to be compared to observations. Somedata sets are available focusing on BC concentrations in air-craft plumes (e.g.Petzold et al., 1999). Due to the small spa-tial scales of the plumes, these data cannot be used for evalu-ating large-scale model output. Only a few data sets of UTLSBC measurements not taken in young aircraft plumes are cur-rently available (Pueschel et al., 1992; Blake and Kato, 1995;Baumgardner et al., 2003, 2004). These measurements were
www.atmos-chem-phys.org/acp/4/2521/ Atmos. Chem. Phys., 4, 2521–2541, 2004

2528 J. Hendricks et al.: Black carbon from aviation
Fig. 4. Total BC mass concentration (ng/m3) at 250 hPa (main aircraft flight level) during northern hemispheric (NH) winter (left) andsummer (right) simulated in the experiments BASE(a, b), PHIL (c, d) and PHOB(e, f). The results represent 4-year averages of theDecember to February and the June to August periods, respectively.
carried out at a large variety of locations during differentepisodes. Nevertheless, from a climatological point of view,this data base is too sparse to perform a robust model eval-uation. However, given the lack of additional data, we used
the measurements to obtain a first guess of the model qual-ity. Additional observations of BC in the UTLS are neededto consolidate the model evaluation.
Atmos. Chem. Phys., 4, 2521–2541, 2004 www.atmos-chem-phys.org/acp/4/2521/
J. Hendricks et al.: Black carbon from aviation 2529
BASE
0.01 0.10 1.00 10.00observed [ng/m3]
0.01
0.10
1.00
10.00
mod
elle
d [n
g/m
3 ]
BC modelled / observed
BK95: Central Pacific, Caribbean
BK95: eastern North America
BK95: western North America
BK95: northern high latitudes
BEA03 (LAP): 70N-90N
BEA03 (LAP): 60N-70N
PHIL
0.01 0.10 1.00 10.00observed [ng/m3]
0.01
0.10
1.00
10.00
mod
elle
d [n
g/m
3 ]
BC modelled / observed
PHOB
0.01 0.10 1.00 10.00observed [ng/m3]
0.01
0.10
1.00
10.00
mod
elle
d [n
g/m
3 ]BC modelled / observed
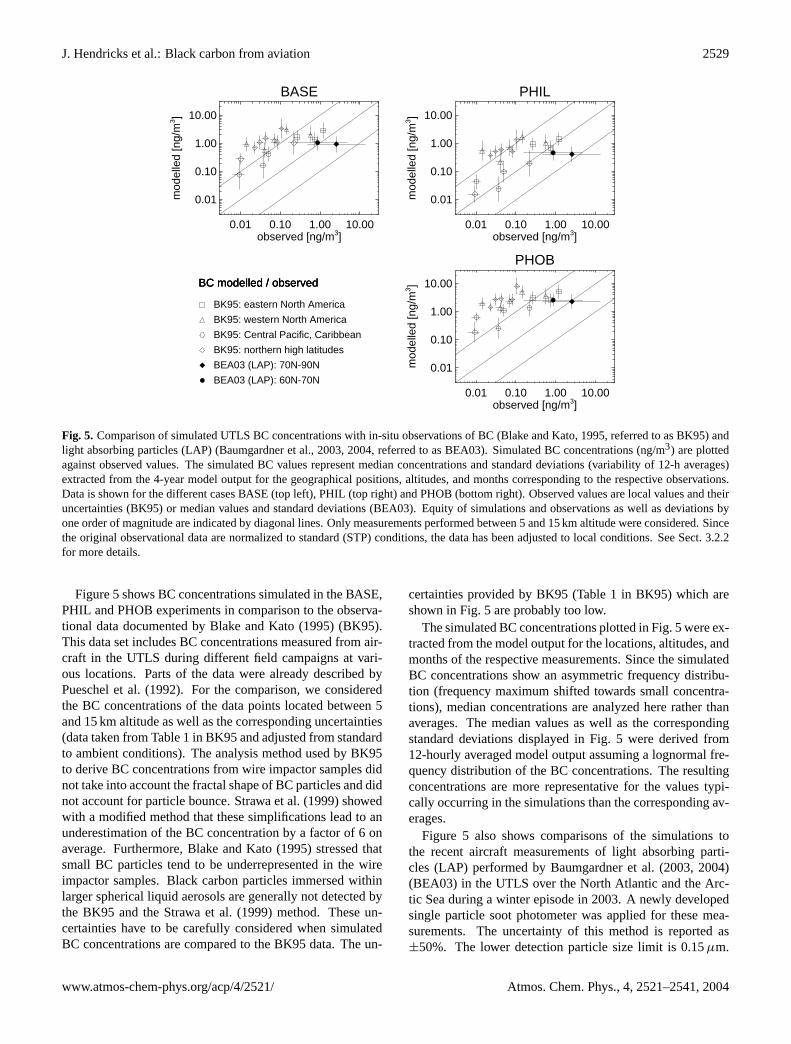
Fig. 5. Comparison of simulated UTLS BC concentrations with in-situ observations of BC (Blake and Kato, 1995, referred to as BK95) andlight absorbing particles (LAP) (Baumgardner et al., 2003, 2004, referred to as BEA03). Simulated BC concentrations (ng/m3) are plottedagainst observed values. The simulated BC values represent median concentrations and standard deviations (variability of 12-h averages)extracted from the 4-year model output for the geographical positions, altitudes, and months corresponding to the respective observations.Data is shown for the different cases BASE (top left), PHIL (top right) and PHOB (bottom right). Observed values are local values and theiruncertainties (BK95) or median values and standard deviations (BEA03). Equity of simulations and observations as well as deviations byone order of magnitude are indicated by diagonal lines. Only measurements performed between 5 and 15 km altitude were considered. Sincethe original observational data are normalized to standard (STP) conditions, the data has been adjusted to local conditions. See Sect.3.2.2for more details.
Figure5 shows BC concentrations simulated in the BASE,PHIL and PHOB experiments in comparison to the observa-tional data documented byBlake and Kato(1995) (BK95).This data set includes BC concentrations measured from air-craft in the UTLS during different field campaigns at vari-ous locations. Parts of the data were already described byPueschel et al.(1992). For the comparison, we consideredthe BC concentrations of the data points located between 5and 15 km altitude as well as the corresponding uncertainties(data taken from Table 1 in BK95 and adjusted from standardto ambient conditions). The analysis method used by BK95to derive BC concentrations from wire impactor samples didnot take into account the fractal shape of BC particles and didnot account for particle bounce.Strawa et al.(1999) showedwith a modified method that these simplifications lead to anunderestimation of the BC concentration by a factor of 6 onaverage. Furthermore,Blake and Kato(1995) stressed thatsmall BC particles tend to be underrepresented in the wireimpactor samples. Black carbon particles immersed withinlarger spherical liquid aerosols are generally not detected bythe BK95 and theStrawa et al.(1999) method. These un-certainties have to be carefully considered when simulatedBC concentrations are compared to the BK95 data. The un-
certainties provided by BK95 (Table 1 in BK95) which areshown in Fig.5 are probably too low.
The simulated BC concentrations plotted in Fig.5were ex-tracted from the model output for the locations, altitudes, andmonths of the respective measurements. Since the simulatedBC concentrations show an asymmetric frequency distribu-tion (frequency maximum shifted towards small concentra-tions), median concentrations are analyzed here rather thanaverages. The median values as well as the correspondingstandard deviations displayed in Fig.5 were derived from12-hourly averaged model output assuming a lognormal fre-quency distribution of the BC concentrations. The resultingconcentrations are more representative for the values typi-cally occurring in the simulations than the corresponding av-erages.
Figure 5 also shows comparisons of the simulations tothe recent aircraft measurements of light absorbing parti-cles (LAP) performed byBaumgardner et al.(2003, 2004)(BEA03) in the UTLS over the North Atlantic and the Arc-tic Sea during a winter episode in 2003. A newly developedsingle particle soot photometer was applied for these mea-surements. The uncertainty of this method is reported as±50%. The lower detection particle size limit is 0.15µm.
www.atmos-chem-phys.org/acp/4/2521/ Atmos. Chem. Phys., 4, 2521–2541, 2004

2530 J. Hendricks et al.: Black carbon from aviation
The technical details are described byBaumgardner et al.(2003, 2004) andStephens et al.(2003). The major fractionof the observed LAP particles was found to be BC. However,a large fraction (>40%) was found to be non-BC particlesmainly composed of metals. For comparing the data to thesimulations, the measured data was averaged over flight seg-ments defined by projecting the flight tracks on the modelgrid. In analogy to the analysis of the simulations, medianLAP concentrations and corresponding standard deviationsare then derived from these averages. Therefore, the datawas subsumed for the areas between 60◦ N and 70◦ N andnorth of 70◦ N, respectively. Only those measurements takenabove 5 km (all measurements were taken below 15 km) wereconsidered. Differences of the resulting BC concentrationsshown in Fig.5 to the values presented byBaumgardner et al.(2004) are due to the use of median concentrations instead ofaverages and due to the inclusion of data taken in the uppertroposphere.
Given the large uncertainties of the BK95 data, a de-tailed quantitative comparison of these data to the simula-tions would be not reasonable. Nevertheless, some qual-itative features can be compared. The spatial variation ofthe BC concentrations simulated in the BASE case is similarto that observed by BK95. Both the measurements and thesimulations show a marked contrast between polluted con-tinental and remote marine air masses. The smallest BCconcentrations occur over the central Pacific whereas largeconcentrations are found over eastern North America. Thedata points over western North America, where continentaland marine influences compete, tend to show medium con-centrations in the BK95 data as well as in the simulation.This is also the case for the northern high latitude data. Nev-ertheless, the differences in the BC concentration occurringbetween polluted continental and remote areas are more pro-nounced in the measurements. This possibly reflects that BCimmersed within larger liquid aerosol is underrepresented inthe BK95 data. Black carbon occurring in remote areas mayhave been transported over long distances. This implies alarge probability that a significant fraction of this BC hasbeen immersed and, therefore, is not detected with the BK95method.
The BC concentrations simulated in the BASE experimentare well accordable with the BEA03 data taken north of70◦ N. Taking into account that about 50% of the LAP is BC,the simulated and observed median BC concentrations nearlymatch. Between 60◦ N and 70◦ N, the simulated BC con-centrations are similar to the LAP concentrations observedby BEA03. However, the simulated concentrations exceedthe observed values after taking into account that only about50% of the observed LAP is BC. Nevertheless, within thegiven variability ranges, the simulations are accordable withthe measured values. It should be addressed whether themeasurements could be biassed due to the lower detectionparticle size limit of 0.15µm. Observations performed byNeusuß et al.(2000a,b, 2002) andMatta et al.(2003) under
a variety of conditions indicate that the BC mass containedin particles smaller than 0.15µm mostly is small. The con-tribution of these particles to total BC was generally below30% during the measurements. Hence, the absence of smallparticles in the observations appears to be of secondary im-portance for this comparison.
The BC concentrations simulated in the PHIL and PHOBexperiments which are also displayed in Fig.5 show spatialvariations quite similar to those simulated in the BASE case.However, the simulated absolute BC loadings show markeddifferences to the BASE experiment. As already discussed inSect.3.2.1, the PHIL and PHOB simulations tend to showsmaller and larger concentrations, respectively. When weconsider that about 50% of the LAP is BC, the PHIL experi-ment is well accordable with the BEA03 measurements takenbetween 60◦ N and 70◦ N but shows too small concentrationsnorth of 70◦ N. Under the same assumption, the PHOB sim-ulation shows too much BC. Hence the BASE simulation ap-pears to be most conformable with the BEA03 data. Giventhe large uncertainty of the BK95 data, we therefore focuson the BASE case in the assessment of the aviation impact(Sects.3.2.4and3.2.5).
3.2.3 Comparison to other global model studies
Comparisons of BC simulations with the observational databy Blake and Kato(1995) have also been performed in otherglobal model studies (Cooke et al., 1999, 2002; Koch, 2001).As in the simulations performed here, the BC concentrationssimulated byCooke et al.(2002) and Koch (2001) showa similar spatial variation as observed byBlake and Kato(1995). Cooke et al.(1999) focused on altitudinal variationsand did not analyse the geographical dependence. Due to thelarge uncertainties inherent in the measurements, the qualityof the UTLS BC concentrations simulated by the differentmodels cannot be evaluated here. Nevertheless, it is worth-while to compare the UTLS BC concentrations obtained withdifferent global model systems.
As mentioned in Sect.1, simulations of the UTLS BC loadare discussed in a couple of global model studies (Cooke andWilson, 1996; Liousse et al., 1996; Cooke et al., 1999, 2002;Koch, 2001; Kohler et al., 2001; Chung and Seinfeld, 2002).Only surface emissions were considered in these studies, ex-cept for Kohler et al.(2001) who considered both surfacesources and aircraft emissions. The UTLS BC concentra-tions obtained with the different model approaches can showsignificant deviations. The zonal mean BC concentrationssimulated for the pressure range between 300 and 200 hPa inthe northern hemisphere vary from values of 1–10 ng/m3 (Li-ousse et al., 1996, and this study) to values of 10–50 ng/m3
(Cooke and Wilson, 1996; Koch, 2001). The studies byChung and Seinfeld(2002), Cooke et al.(1999, 2002) andKohler et al.(2001) show intermediate concentrations. Thecorresponding BC concentrations in the southern hemisphere
Atmos. Chem. Phys., 4, 2521–2541, 2004 www.atmos-chem-phys.org/acp/4/2521/

J. Hendricks et al.: Black carbon from aviation 2531
Fig. 6. Contribution of aviation to the BC mass concentration at 250 hPa (main flight level) during NH winter(a, b) and summer(c, d)as simulated in the BASE experiment. Absolute contributions (0.01 ng/m3)(a, c) and relative contributions (% of total BC mass)(b, d) aredisplayed. The results represent 4-year averages of the December to February and the June to August periods, respectively.
are typically an order of magnitude smaller but mostly showsimilar differences between the various model approaches.
The discrepancies can have manifold reasons. The studiesof Cooke et al.(1999) andCooke et al.(2002) take into ac-count BC emissions from fossil fuel combustion only whichcauses marked differences to the other studies especially inthe tropics and the southern hemisphere where biomass burn-ing is the dominating BC source. The simulations by Cookeet al. show comparatively small BC concentrations in thesouthern hemispheric UTLS. The other studies include BCfrom both biomass burning and fossil fuel combustion. Sincethe total emission rates vary only slightly between these
studies, differences in the emission scenarios probably areof secondary importance for the simulated UTLS BC bud-get. Sensitivity experiments performed in some of the stud-ies demonstrate that the simulated UTLS BC concentrationsare very sensitive to the treatment of BC wet removal (seealso Sect.3.2.1). Hence, parts of the deviations describedabove can probably be attributed to different representationsof the BC hygroscopicity, precipitation scavenging or precip-itation itself. The studies byDanilin et al.(1998) andRogerset al.(2002), where aircraft emission tracer simulations per-formed with a large set of global models were compared, in-dicate that also differences in the transport characteristics of
www.atmos-chem-phys.org/acp/4/2521/ Atmos. Chem. Phys., 4, 2521–2541, 2004

2532 J. Hendricks et al.: Black carbon from aviation
Fig. 7. Left: Vertical distribution of zonal mean total BC mass concentration (ng/m3) during NH winter(a) and summer(c) simulated inthe BASE experiment. Right: Corresponding BC contribution of aviation (0.01 ng/m3)(b, d). The displayed concentrations represent 4-yearaverages of the December to February and the June to August periods, respectively.
the models can be very important. Hence, also the transportscheme applied in the present study is a potential source ofuncertainty (see also Sect.3.2.4).
Due to the lack of extensive observations of BC in theUTLS, it is currently not possible to evaluate the quality ofthe simulations discussed above. Nevertheless, the UTLS BCconcentrations simulated by the different models neglectingaircraft emissions are similar to or even larger than the avail-able observed concentrations. This suggest a very large con-tribution of BC from surface sources to the UTLS BC budget.
Given the distinct differences in UTLS BC simulatedwith the different models, absolute contributions of differentsources to the atmospheric BC cycle are not necessarily com-parable if they were estimated with different models. Thisimplies that a quantitative investigation of the relative impactof aircraft emissions to the atmospheric BC budget should bebased on a consistent model approach including all relevantBC sources. Comparisons of simulations including only theaviation source (Danilin et al., 1998; Rahmes et al., 1998)with the results of other studies focusing on simulations of
BC from surface sources are not reasonable. In the presentstudy, simulations including both BC from aviation and fromsurface sources are performed. Estimates of the absolute andrelative aviation impacts based on these simulations are dis-cussed below.
3.2.4 Contribution of aviation to BC mass loading
Figure6 highlights the absolute and relative contribution ofBC from aviation to the BC mass concentration at 250 hPa(main flight level) as simulated in the BASE case for win-ter and summer conditions. The amount of BC resultingfrom aviation is largest at northern midlatitudes. Maximumcontributions of more than 0.05 ng/m3 occur in the mainflight areas over North America, the North Atlantic and Eu-rope. The aviation contribution at 250 hPa generally exceeds0.02 ng/m3 at northern midlatitudes and decreases stronglyfrom the northern to the southern hemisphere. The abso-lute aviation impact is largest during summer when the in-flow from lower layers carrying higher amounts of aircraftBC (Fig. 7) is largest. Similarly to BC from surface sources
Atmos. Chem. Phys., 4, 2521–2541, 2004 www.atmos-chem-phys.org/acp/4/2521/

J. Hendricks et al.: Black carbon from aviation 2533
Fig. 8. As Fig.7, but annual mean BC mass concentrations obtained in the BASE(a, b) and NOICE(c, d) simulations.
(Sect.3.2.1), BC emitted by aircraft at low altitudes can betransported into the UTLS and can be further dispersed thereby efficient westerly flows. Note that the aircraft-inducedBC perturbations simulated for spring and autumn condi-tions (not shown) exhibit no extraordinary features and fitsmoothly in the annual cycle suggested by the results ob-tained for winter and summer.
Compared to the total BC mass concentrations present at250 hPa (Fig.4), the contribution from aircraft is small. Max-imum relative contributions of 2–3% during winter and 1–2%during summer are simulated. The aviation-induced pertur-bations of UTLS BC are clearly smaller than the inter-annualvariability of the mass concentration of northern hemisphericUTLS BC originating from the surface (standard deviationsof around 0.1–1 ng/m3 in the 10-year BASE simulation).Hence, the simulations reveal that the contribution of avi-ation to the UTLS BC mass budget is of limited impor-tance. This result is similar to the findings of the modelstudy byKjellstrom et al.(1999) for aviation sulfur emis-sions.Kjellstrom et al.(1999) demonstrated that the fractionof the UTLS sulfate mass loading resulting from air traffictypical of 1991/1992 probably is very small, even in the mostfrequented flight regions (<1% north of 40◦ N).
Vertical distributions of zonal mean total and aviation-induced BC mass concentration are displayed in Fig.7. Thezonal means of the simulated total BC mass concentrationsrange from more than 100 ng/m3 in the boundary layer at lowlatitudes and northern midlatitudes to values on the order of1 ng/m3 in the UTLS and the lower and middle troposphereat southern mid- and high latitudes. A distinct seasonal cy-cle of UTLS BC is simulated for the northern midlatitudesshowing the largest concentrations during summer when con-vective upward transport from the boundary layer is most ef-ficient. The contribution of BC from aviation is largest atnorthern midlatitudes where the zonal mean aviation contri-bution ranges from up to 0.1 ng/m3 in the lower troposphereto values around 0.01–0.05 ng/m3 in the UTLS. The verticaldistributions reveal that the relative aircraft-induced BC per-turbation is largest in the UTLS. Despite that mass concentra-tions of BC from aircraft are largest in the lower troposphere,the aviation-induced perturbation is very small compared tothe large lower tropospheric BC loading resulting from othersources.
Annual averages of the zonal mean aircraft-induced BCperturbations simulated in the BASE and the NOICE ex-periments are presented in Figs.8b and d. The BASE
www.atmos-chem-phys.org/acp/4/2521/ Atmos. Chem. Phys., 4, 2521–2541, 2004

2534 J. Hendricks et al.: Black carbon from aviation
experiment shows distinct differences to the correspondingresults of the previous studies byDanilin et al. (1998) andRahmes et al.(1998)(see also Sect.1). In the BASE ex-periment, the aviation-induced BC perturbations amount to0.01–0.05 ng/m3 in the northern hemispheric UTLS. Thecorresponding BC perturbations derived byDanilin et al.(1998) from aircraft fuel tracer simulations with a previousversion of the ECHAM GCM assuming a constant emis-sion index of 0.04 g(BC)/kg(fuel) range between 0.05 and0.2 ng/m3. The smaller values obtained in the present studyare mainly attributed to changes in the BC emission indicesas well as to the different representation of BC removal.In the present study, the emissions index decreases from0.08 g(BC)/kg(fuel) at the surface to values between 0.02 and0.03 g(BC)/kg(fuel) in the main flight altitudes (Sect.2.3;Fig. 1). Since the aviation fuel consumption assumed byDanilin et al.(1998) is similar to that assumed here, the dif-ferences in the BC emission indices lead to less efficientUTLS BC emissions in the present study. In contrast tothe BASE simulation performed here, removal of trace con-stituents by precipitation was neglected byDanilin et al.(1998) above the 400 hPa level. At these altitudes, precip-itation occurs mainly due to the sedimentation of ice crys-tals. The NOICE simulation demonstrates that neglectingthe scavenging of BC by ice above 400 hPa increases theaviation-induced BC perturbation by more than a factor of2 (Figs.8b and d).
Hence the adoption of updated emission indices as well asthe inclusion of in-situ BC removal by precipitation largelyexplain the differences in the aviation-induced BC pertur-bations occurring between the BASE experiment and theECHAM simulation discussed byDanilin et al.(1998). Dif-ferences in the transport characteristics of ECHAM version3 used byDanilin et al.(1998) and ECHAM version 4 whichwas employed here appear to be of secondary importance forthe dispersion of subsonic aircraft emissions (Rogers et al.,2002).
Nevertheless, the ECHAM results presented in theDanilinet al.(1998) model intercomparison show differences to theresults of some other participating models. Since tracer re-moval was handled identically in the models, these discrep-ancies are mainly caused by different tracer transport charac-teristics. The maximum fuel tracer concentrations simulatedby Danilin et al. (1998), which were generally obtained inthe main flight levels, vary by a factor of 10 between thedifferent model approaches. The largest maximum perturba-tions were simulated by some of the 2-D models. The maxi-mum fuel tracer concentrations which correspond to the air-craft BC concentrations obtained in the 2-D model study byRahmes et al.(1998) are also in the upper range of the valuessimulated byDanilin et al. (1998). ECHAM is among themodels showing comparatively small concentrations. Never-theless, the differences documented byDanilin et al.(1998)stay within a factor of 2 when the fuel tracer amount is in-tegrated over the northern hemispheric UTLS. The variation
further decreases to less than 1.5 when the results of the 2-Dmodels are not taken into account. This reveals that differ-ences in the models transport characteristics can cause largelocal differences in the simulated concentrations but that thelarge-scale features of the simulated aviation fuel tracer dis-tributions are much less sensitive.
It can be concluded that the relative contribution of avi-ation to the UTLS BC budget suggested by the simulationsperformed here is only small. The simulated large-scale con-tribution does not exceed a few percent, even in the mostfrequented flight areas. The absolute aviation-induced BCperturbation simulated here is smaller than suggested by pre-vious studies. This is mainly due to the consideration of up-dated BC emission indices as well as the inclusion of precip-itation scavenging of BC within ice clouds. These modifica-tions reduce the aircraft-induced UTLS BC perturbations ob-tained in the present simulations for the northern hemisphericUTLS by factors of about 2–5. Without these changes, thesimulations are consistent with previous simulations (Danilinet al., 1998). The model intercomparison byDanilin et al.(1998) suggests that potential changes in the transport char-acteristics of the model may increase the aircraft-inducedperturbations locally but would not cause large changes ofthe integral effect. The model intercomparison byRogerset al.(2002) reveals that increasing the vertical resolution ofthe model would change the results only slightly.
The UTLS concentrations of BC from surface sources sim-ulated by other global models mostly are larger than thoseobtained here (Sect.3.2.3). This suggests that the relativeimpact of aviation on the UTLS BC budget, if simulatedwith these models, could be even smaller than obtained here.However, such investigations were not performed yet withthese models. OnlyKohler et al.(2001) provided a consis-tent simulation of BC from aviation and surface sources. Therelative contributions of aviation to the UTLS BC budget ob-tained byKohler et al.(2001) (generally<1%) are smallerthan suggested by the simulations performed in the presentstudy.
The simulations performed here reveal that BC scaveng-ing by ice is of high relevance for the UTLS BC budget.Although measurements byStrom and Ohlsson(1998) sug-gest that significant amounts of BC from aircraft are incor-porated into ice crystals and, therefore, can be removed fromthe UTLS via ice sedimentation, the scavenging efficiencyof BC by ice crystals is still uncertain. However, our simu-lations demonstrate that varying the assumptions on the re-moval efficiency of BC by ice sedimentation has a similareffect on the concentrations of BC from aircraft and fromsurface sources (Fig.8). Hence, the relative contribution ofaviation to the UTLS BC budget simulated here appears tobe not very sensitive to the assumptions on BC removal inice clouds.
Atmos. Chem. Phys., 4, 2521–2541, 2004 www.atmos-chem-phys.org/acp/4/2521/

J. Hendricks et al.: Black carbon from aviation 2535
Fig. 9. Particle number concentrations (cm−3) of BC at 250 hPa (main aircraft flight level) during NH winter (left) and summer (right)simulated in the BASE experiment.(a, b): Number concentrations of BC particles resulting from surface sources.(c–f): Number concentra-tions of aviation-induced BC particles obtained when ageing of aviation BC (see Sect.2.5.3) is neglected (c, d) and when efficient ageing ofaviation BC is considered (e, f). The displayed concentrations represent 4-year averages of the December to February and the June to Augustperiods, respectively.
www.atmos-chem-phys.org/acp/4/2521/ Atmos. Chem. Phys., 4, 2521–2541, 2004
2536 J. Hendricks et al.: Black carbon from aviation
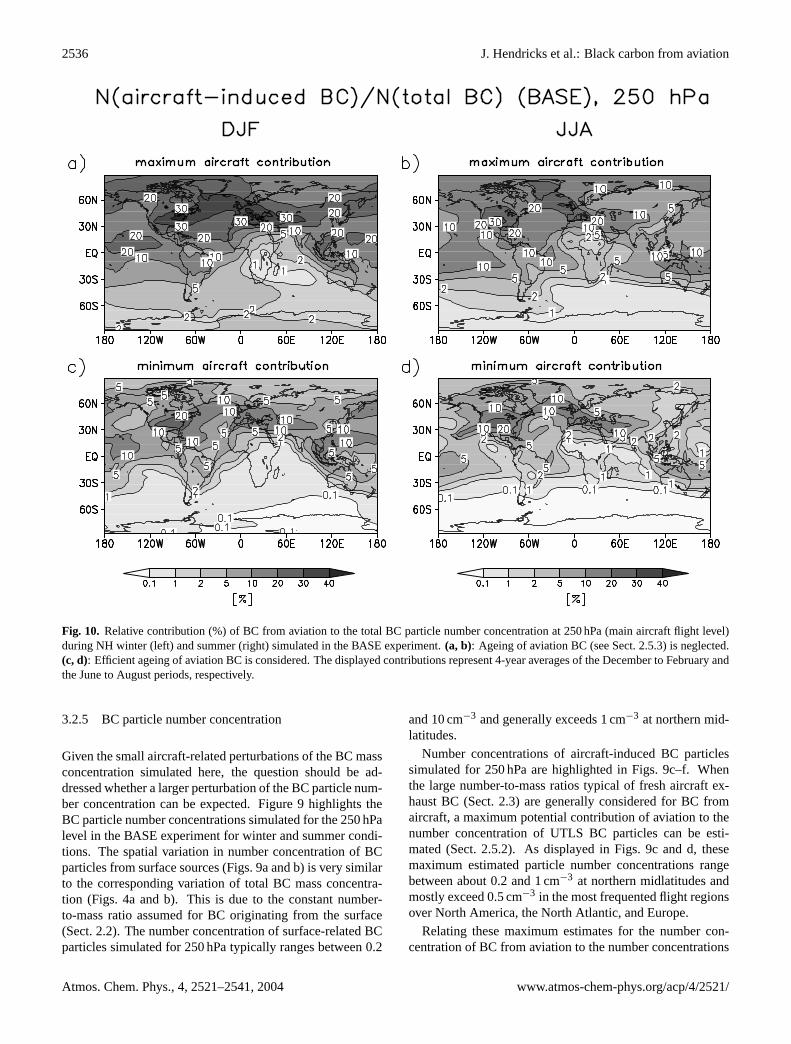
Fig. 10. Relative contribution (%) of BC from aviation to the total BC particle number concentration at 250 hPa (main aircraft flight level)during NH winter (left) and summer (right) simulated in the BASE experiment.(a, b): Ageing of aviation BC (see Sect.2.5.3) is neglected.(c, d): Efficient ageing of aviation BC is considered. The displayed contributions represent 4-year averages of the December to February andthe June to August periods, respectively.
3.2.5 BC particle number concentration
Given the small aircraft-related perturbations of the BC massconcentration simulated here, the question should be ad-dressed whether a larger perturbation of the BC particle num-ber concentration can be expected. Figure9 highlights theBC particle number concentrations simulated for the 250 hPalevel in the BASE experiment for winter and summer condi-tions. The spatial variation in number concentration of BCparticles from surface sources (Figs.9a and b) is very similarto the corresponding variation of total BC mass concentra-tion (Figs.4a and b). This is due to the constant number-to-mass ratio assumed for BC originating from the surface(Sect.2.2). The number concentration of surface-related BCparticles simulated for 250 hPa typically ranges between 0.2
and 10 cm−3 and generally exceeds 1 cm−3 at northern mid-latitudes.
Number concentrations of aircraft-induced BC particlessimulated for 250 hPa are highlighted in Figs.9c–f. Whenthe large number-to-mass ratios typical of fresh aircraft ex-haust BC (Sect.2.3) are generally considered for BC fromaircraft, a maximum potential contribution of aviation to thenumber concentration of UTLS BC particles can be esti-mated (Sect.2.5.2). As displayed in Figs.9c and d, thesemaximum estimated particle number concentrations rangebetween about 0.2 and 1 cm−3 at northern midlatitudes andmostly exceed 0.5 cm−3 in the most frequented flight regionsover North America, the North Atlantic, and Europe.
Relating these maximum estimates for the number con-centration of BC from aviation to the number concentrations
Atmos. Chem. Phys., 4, 2521–2541, 2004 www.atmos-chem-phys.org/acp/4/2521/

J. Hendricks et al.: Black carbon from aviation 2537
Fig. 11. As Fig.9, but vertical distributions of zonal mean BC particle number concentrations (cm−3) are highlighted.
obtained for surface-related BC particles, a maximum esti-mate for the relative contribution of BC from aviation to thetotal BC number concentration can be provided. During win-ter (Fig.10a), the maximum estimated aviation contributionamounts to more than 20% over large parts of the northernhemisphere. The largest contributions range up to 40% andare simulated for the main flight areas. Even during summer(Fig. 10b), when the background BC burden is largest, maxi-mum estimated contributions of 10–30% are obtained for thenorthern hemisphere. As in the case of the BC mass concen-trations, the perturbations simulated for spring and autumn(not shown) fit smoothly into the seasonal cycle suggestedabove. In large parts of the most frequented flight areas, themaximum estimated aircraft-induced perturbations are larger
than the inter-annual variability of the number concentra-tion of surface-related BC particles (standard deviations ofaround 0.1–1 particles/cm3 in the 10-year BASE simulation).Hence, the simulations indicate a high potential of aviation toinduce significant increases in the UTLS BC particle num-ber concentration. If BC particles from aircraft can serve asheterogeneous ice nuclei, this might have important implica-tions for the formation of cirrus clouds (e.g.Jensen and Toon,1997; Karcher and Lohmann, 2003; Lohmann et al., 2004).
As discussed in Sect.2.5.3, a minimum estimate of thenumber concentration of BC from aircraft was performedconsidering the major ageing processes of BC from aviationand assuming the ageing to be very efficient. The resultspresented in Figs.9e, f, 10c, and d reveal that even this
www.atmos-chem-phys.org/acp/4/2521/ Atmos. Chem. Phys., 4, 2521–2541, 2004

2538 J. Hendricks et al.: Black carbon from aviation
minimum particle number concentration would make a rele-vant contribution to the total UTLS BC particle number con-centration. The minimum estimated aircraft contribution at250 hPa frequently exceeds 10% in the northern hemisphereand amounts up to 20% in the main frequented flight areas.
Corresponding to the results shown in Fig.9, vertical dis-tributions of the zonal mean particle number concentrationof BC emitted at the surface as well as of BC resulting fromaviation are displayed in Fig.11. As in the case of mass con-centration, the vertical distributions indicate that the relativeaircraft-induced perturbation of the BC particle number con-centration is largest in the UTLS. In the lower and middletroposphere, the aviation-induced contribution is small com-pared to the large numbers of BC particles originating fromthe surface.
In comparing the estimates of number concentrations ofBC particles originating from aviation and from surfacesources, we recall that a constant number-to-mass ratio isassumed for BC particles originating from the surface. Asdescribed in Sect.2.2, this number-to-mass ratio is derivedfrom the assumption that the surface-related BC particlescontain n=10 spherically shaped primary particles on av-erage. The morphologies of BC particles collected in thetropopause region (Blake and Kato, 1995; Pueschel et al.,2000) and the lower stratosphere (Strawa et al., 1999) revealthat much larger agglomerates can reside at these altitudes.Hence, the averagen may be larger than assumed. If theselarge BC particles mainly originate from surface sources,the number concentrations of the surface-related BC parti-cles could be lower than simulated here. Consequently, therelative impact of aviation on the UTLS BC particle numberwould be larger than estimated above. However, it is not clearwhether the BC morphologies supplied by the limited num-ber of measurements are representative of UTLS BC. Fur-thermore, the origin (aviation or surface) of the observed BCparticles is not known. Due to a lack of observational data onthe UTLS BC particle number concentration, a validation ofthe simulated BC particle numbers is currently impossible.
4 Conclusions
Simulations with the ECHAM4 GCM were performed to as-sess the global BC budget. The special focus was to quantifythe impact of aviation on the global UTLS BC mass and par-ticle number loading. The main findings resulting from thesesimulations are:
1. The BC mass concentrations simulated for the UTLStypically range between 0.1 and 10 ng/m3 and mostlyexceed 1 ng/m3 in the northern midlatitude UTLS.A good agreement with recent observational data onUTLS BC mass loading taken over the North Atlanticand the Arctic Sea (Baumgardner et al., 2003, 2004) wasfound. The model is capable of reproducing the spatial
variation of UTLS BC concentrations observed at dif-ferent locations of the globe in earlier measurements byBlake and Kato(1995). Nevertheless, the large uncer-tainty of these measurements hampers a detailed evalu-ation of the model quality.
2. The UTLS BC mass loading induced by aircraft typ-ically ranges between 0.01 and 0.1 ng/m3 at northernmidlatitudes where the aviation impact is largest. Hencethe contribution of aircraft to the total BC mass load-ing simulated here for the UTLS is small. The relativelarge-scale contribution does not exceed a few percent,even in areas highly frequented by aircraft.
3. The number concentrations of BC particles derivedfrom the UTLS BC mass loading originating from sur-face sources typically range between 0.1 and 10 cm−3
and frequently exceed 1 cm−3 at northern midlatitudes.Observational data suitable to perform a validation ofthe simulated UTLS BC particle number concentrationsare urgently required.
4. The simulations suggest that the perturbations in UTLSBC particle number concentrations resulting from air-craft are larger than the corresponding perturbations ofthe BC mass loading, mainly caused by the small sizesof aircraft-generated BC particles. Large-scale numberconcentrations of UTLS BC resulting from aircraft ofmore than 0.5 cm−3 are simulated for the main flight ar-eas when BC particle number-to-mass ratios typical offresh aircraft exhaust are considered. This correspondsto an aviation contribution to the total BC particle num-ber concentration ranging between 10 and 40%. Evenwhen an efficient ageing of the aircraft particle exhaustis taken into account which leads to a reduction of theBC particle number-to-mass ratio, the aviation contri-bution still amounts to 10–20% in the main flight areas.Hence the simulations indicate a large potential of avi-ation to induce significant perturbations in UTLS BCparticle number concentration.
5. Large-scale impacts of aviation on the BC mass and par-ticle number concentrations are very small in the lowertroposphere.
In the light of these findings, we evaluate the potential cli-matic impacts of BC emissions from aviation as follows:
Direct climatic impacts: A first estimate of the direct im-pact of BC from aviation on the atmospheric radiation bud-get was provided byIPCC(1999). The direct radiative forc-ing attributed to the aviation-induced BC increase was es-timated to be very small. A global mean forcing of only+0.003 (+0.001 to +0.006) W/m2 was calculated consideringthe emissions of the 1992 fleet. The aviation-induced BCperturbation assumed in these calculations was significantlylarger than the BC increase simulated in the present study.
Atmos. Chem. Phys., 4, 2521–2541, 2004 www.atmos-chem-phys.org/acp/4/2521/

J. Hendricks et al.: Black carbon from aviation 2539
Hence, we suggest that the direct impact of BC from avia-tion is even smaller than theIPCC(1999) estimates.
Indirect climatic impacts: It is currently debated whetherBC from aviation may perturb the frequency or the micro-physical and optical properties of cirrus clouds via heteroge-neous ice nucleation on aviation-induced BC particles. Thesimulations performed here confirm that aviation has the po-tential to increase the atmospheric abundance of heteroge-neous ice nuclei, provided that BC particles from aviationnucleate ice efficiently. The number concentrations of BCparticles from aviation simulated here are large enough tocause significant changes in cirrus ice crystal number con-centration and related changes in cirrus optical properties(Gierens, 2003; Haag et al., 2003; Karcher and Lohmann,2003). Therefore, more detailed knowledge about the role ofheterogeneous nucleation in cirrus cloud formation as well asabout the ice nucleating efficiency of different BC types andother atmospheric aerosols should be gained in the future.Regarding the rapid growth rates of aviation fuel consump-tion projected for the future (3% per year until 2015;IPCC,1999), the potential indirect impact of BC from aviation maybecome of increasing importance in the future. Hence, fur-ther studies should consider indirect climatic impacts of BCfrom aircraft.
The present study further reveals some important require-ments for future refinements in global atmospheric BC sim-ulations: i) The BC loading simulated for the UTLS stronglydepends on the cloud scavenging efficiency of BC. Theknowledge about the hygroscopic properties of atmosphericBC particles currently is very sparse. Hence extensive labo-ratory and field measurements of BC hygroscopicity are re-quired. ii) As suggested by the aviation impact simulatedhere, anthropogenic perturbations of the atmospheric BC par-ticle number concentrations can be very different from thecorresponding perturbations of the BC mass loading. There-fore atmospheric aerosol models generally should includeexplicit predictions of aerosol particle number concentra-tions, rather than employing prescribed aerosol size distri-butions. iii) There is a lack of observations of the UTLS BCparticle mass and number concentration. Much more suchobservational data are required to validate global aerosolmodels.
Acknowledgements.We thank V. Grewe, A. Lauer and M. Ponaterfor helpful discussions of the ECHAM4 simulations. This re-search was supported by the “Helmholtz Gemeinschaft DeutscherForschungszentren” (HGF) through the project “Particles andCirrus Clouds” (PAZI-2). The U.S. Office of Naval research fundedthe development of the single particle soot photometer (SP2) andthe NASA Radiation Sciences Program funded the participation ofthe SP2 in the SOLVE II research program. The SP2 was developedby Droplet Measurement Technologies by G. Kok, who was alsoresponsible for making the measurements during SOLVE.
Edited by: K. Carslaw
References
Baumgardner, D., Kok, G., Raga, G., Diskin, G., and Sachse, G.:Black carbon measurements in the arctic UT/LS, Proceedings ofthe European Aerosol Conference 2003, J. Aerosol Sci., 979–980, 2003.
Baumgardner, D., Kok, G., and Raga, G.: Warming of the arcticlower stratosphere by light absorbing particles, Geophys. Res.Lett., 31, L06117, doi:10.1029/2003GL018883, 2004.
Blake, D. F. and Kato, K.: Latitudinal distribution of black carbonsoot in the upper troposphere and lower stratosphere, J. Geophys.Res., 100, 7195–7202, 1995.
Brinkop, S. and Sausen, R.: A finite difference approximation forconvective transports which maintains positive tracer concentra-tions, Beitr. Phys. Atmos., 3, 245–248, 1997.
Chung, S. H. and Seinfeld, J. H.: Global distribution and climateforcing of carbonaceous aerosols, J. Geophys. Res., 107, (D19),4407, doi:10.1029/2001JD001397, 2002.
Cooke, W. F. and Wilson, J. J. N.: A global black carbon aerosolmodel, J. Geophys. Res., 101, 19 395–19 409, 1996.
Cooke, W. F., Liousse, C., Cachier, H., and Feichter, J.: Con-struction of a 1◦×1◦ fossil fuel emission data set for carbona-ceous aerosol and implementation and radiative impact in theECHAM4 model, J. Geophys. Res., 104, 22 137–22 162, 1999.
Cooke, W. F., Ramaswamy, V., and Kasibhatla, P.: A general circu-lation model study of the global carbonaceous aerosol distribu-tion, J. Geophys. Res., 107, (D16), doi:10.1029/2001JD001274,2002.
Danilin, M. Y., Fahey, D. W., Schumann, U., Prather, M. J., Pen-ner, J. E., Ko, M. K. W., Weisenstein, D. K., Jackman, C. H.,Pitari, G., Kohler, I., Sausen, R., Weaver, C. J., Douglass, A. R.,Connell, P. S., Kinnison, D. E., Dentener, F. J., Fleming, E. L.,Berntsen, T. K., Isaksen, I. S. A., Haywood, J. M., and Karcher,B.: Aviation fuel tracer simulation: Model intercomparison andimplications, Geophys. Res. Lett., 25, 3947–3950, 1998.
DeMott, P. J., Rogers, D. C., and Kreidenweis, S. M.: The suscep-tibility of ice formation in upper tropospheric clouds to insolu-ble aerosol components, J. Geophys. Res., 102, 19 575–19 584,1997.
Dibb, J. E., Talbot, R. W., and Loomis, M. B.: Tropospheric sulfatedistribution during SUCCESS: Contribution from jet exhaust andsurface sources, Geophys. Res. Lett., 25, 1375–1378, 1998.
Dibb, J. E., Talbot, R. W., and Scheuer, E. M.: Composition and dis-tribution of aerosols over the North Atlantic during the SubsonicAssessment Ozone and Nitrogen Oxide Experiment (SONEX),J. Geophys. Res., 105, 3709–3717, 2000.
Dopelheuer, A.: Berechnung der Produkte unvollstandiger Ver-brennung aus Luftfahrttriebwerken, Inst. fur Antriebstechnik,Deutsches Zentrum fur Luft- und Raumfahrt, IB-325-09-97,Cologne, Germany, 1997.
Dopelheuer, A.: Anwendungsorientierte Verfahren zur Bestim-mung von CO, HC und Ruß aus Luftfahrttriebwerken, Ph.D. the-sis, Deutsches Zentrum fur Luft- und Raumfahrt, Report 2002-10, ISSN 1434-8454, Cologne, Germany, 109, 2002.
Feichter, J., Kjellstrom, E., Rodhe, H., Dentener, F., Lelieveld, J.,and Roelofs, G.–J.: Simulation of the tropospheric sulfur cycle ina global climate model, Atmos. Environ., 30, 1693–1707, 1996.
Fuchs, N. A.: The Mechanics of Aerosols, Pergamon, 1964.Gierens, K.: On the transition between heterogeneous and homoge-
neous freezing, Atmos. Chem. Phys., 3, 437–446, 2003.
www.atmos-chem-phys.org/acp/4/2521/ Atmos. Chem. Phys., 4, 2521–2541, 2004

2540 J. Hendricks et al.: Black carbon from aviation
Gierens, K., Schumann, U., Helten, M., Smit, H., and Wang, P.-H.:Ice-supersaturated regions and subvisible cirrus in the northernmidlatitude upper troposphere, J. Geophys. Res., 105, 22 743–22 753, 2000.
Haag, W., Karcher, B., Strom, J., Minikin, A., Lohmann, U., Ovar-lez, J., and Stohl, A.: Freezing thresholds and cirrus cloud forma-tion mechanisms inferred from in situ measurements of relativehumidity, Atmos. Chem. Phys., 3, 1791–1806, 2003.
Haywood, J. M. and Ramaswamy, V.: Global sensitivity studiesof the direct radiative forcing due to anthropogenic sulfate andblack carbon aerosols, J. Geophys. Res., 103, 6043–6058, 1998.
Hess, M., Kopke, P., and Schult, I.: Optical properties of aerosolsand clouds: The software package OPAC, Bull. Americ. Met.Soc., 79, 831–844, 1998.
Hitzenberger, R., Berner, A., Giebl, H., Drobesch, K., Kasper-Giebl, A., Loeflund, M., Urban, H., and Puxbaum, H.: Blackcarbon (BC) in alpine aerosols and cloud water – concentrationsand scavenging efficiencies, Atmos. Environ., 35, 5135–5141,2001.
Intergovernmental Panel on Climate Change (IPCC): Aviation andthe Global Atmosphere, edited by: Penner, J. E., Lister, D. H.,Griggs, D. J., Dokken, D. J., and McFarland, M., CambridgeUniv. Press, New York, 1999.
Jacobson, M. Z.: Control of fossil-fuel particulate black car-bon and organic matter, possibly the most effective methodof slowing global warming, J. Geophys. Res., 107, 4410,doi:10.1029/2001JD001376, 2002.
Jensen, E. J. and Toon, O. B.: The potential impact of soot particlesfrom aircraft exhaust on cirrus clouds, Geophys. Res. Lett., 24,249–252, 1997.
Karcher, B.: Aviation-produced aerosols and contrails, Surv. Geo-phys., 20, 113–167, 1999.
Karcher, B. and Meilinger, S. K.: Perturbation of the aerosol layerby aviation-produced aerosols: A parametrization of plume pro-cesses, Geophys. Res. Lett., 25, 4465–4468, 1998.
Karcher, B. and Lohmann, U.: A parameterization of cirrus cloudformation: Heterogeneous freezing, J. Geophys. Res., 108, 4402,doi:10.1029/2002JD003220, 2003.
Kjellstrom, E., Feichter, J., Sausen, R., and Hein, R.: The con-tribution of aircraft emissions to the atmospheric sulfur budget,Atmos. Environ., 33, 3455–3465, 1999.
Koch, D.: Transport and direct radiative forcing of carbonaceousand sulfate aerosols in the GISS GCM, J. Geophys. Res., 106,20 311–20 332, 2001.
Kohler, I., Dameris, M., Ackermann, I., and Hass, H.: Contributionof road traffic emissions to the atmospheric black carbon burdenin the mid-1990s, J. Geophys. Res., 106, 17 997–18 014, 2001.
Kopke, P., Hess, M., Schult, I., and Shettle, E. P.: Global aerosoldata set, Tech. Rep. 243, Max-Planck-Inst. fur Meteorol., Ham-burg Germany, 44, 1997.
Liousse, C., Penner, J. E., Chuang, C., Walton, J. J., Eddleman,H., and Cachier, H.: A global three-dimensional model studyof carbonaceous aerosols, J. Geophys. Res., 101, 19 411–19 432,1996.
Lohmann, U. and Karcher, B.: First interactive simulations of cirrusclouds formed by homogeneous freezing in the ECHAM GCM,J. Geophys. Res., 107, 4105, doi:10.1029/2001JD000767, 2002.
Lohmann, U. and Roeckner, E.: Design and performance of a newcloud microphysical scheme developed for the ECHAM general
circulation model, Clim. Dyn., 12, 557–572, 1996.Lohmann, U., Feichter, J., Chuang, C. C., and Penner, J. E.: Pre-
diction of the number of cloud droplets in the ECHAM GCM, J.Geophys. Res., 104, 9169–9198, 1999.
Lohmann, U., Feichter, J., Penner, J. E., and Leaitch, W. R.: Indi-rect effect of sulfate and carbonaceous aerosols: A mechanistictreatment, J. Geophys. Res., 105, 12 193–12 206, 2000.
Lohmann, U., Karcher, B., and Hendricks, J.: Sensitivitystudies of cirrus clouds formed by heterogeneous freezingin the ECHAM GCM, J. Geophys. Res., 109, D16204,doi:10.1029/2003JD004443, 2004.
Maricq, M. M., Chase, R. E., Podsiadlik, D. H., and Vogt, R.: Ve-hicle exhaust particle size distributions: a comparison of tailpipeand dilution tunnel measurements, SAE Technical Paper 1999-01-1461, SAE, 1999.
Matta, E., Facchini, M. C., Decesari, S., Mircea, M., Cavalli, F.,Fuzzi, S., Putaud, J.-P., and Dell’Acqua, A.: Mass closure onthe chemical species in size-segregated atmospheric aerosol col-lected in an urban area of the Po Valley, Italy, Atmos. Chem.Phys., 3, 623–637, 2003.
Minikin, A., Petzold, A., Strom, J., Krejci, R., Seifert, M., vanVelthoven, P., Schlager, H., and Schumann, U.: Aircraft observa-tions of the upper tropospheric fine particle aerosol in the North-ern and Southern Hemispheres at midlatitudes, Geophys. Res.Lett., 30, 1503, doi:10.1029/2002GL016458, 2003.
Myhre, G., Stordal, F., Restad, K., and Isaksen, I. S. A.: Estimationof the direct radiative forcing due to sulfate and soot aerosols,Tellus, 50B, 463–477, 1998.
Neusuß, C., Pelzing, M., Plewka, A., and Herrmann, H.: A newanalytical approach for size-resolved speciation of organic com-pounds in atmospheric aerosol particles: Methods and first re-sults, J. Geophys. Res., 105, 4513–4527, 2000a.
Neusuß, C., Weise, D., Birmili, W., Wex, H., Wiedensohler, A., andCovert, D. S.: Size-segregated chemical, gravimetric and num-ber distribution-derived mass closure of the aerosol in Sagres,Portugal during ACE-2, Tellus, 52B, 169–184, 2000b.
Neusuß, C., Wex, H., Birmili, W., Wiedensohler, A., Koziar, C.,Busch, B., Bruggemann, E., Gnauck, T., Ebert, M., and Covert,D. S.: Characterization and parameterization of atmospheric par-ticle number-, mass-, and chemical-size distributions in centralEurope during LACE 98 and MINT, J. Geophys. Res., 107, 8127,doi:10.1029/2001JD000514, 2002.
Penner, J. E., Eddleman, H., and Novakov, T.: Towards the devel-opment of a global inventory for black carbon emissions, Atmos.Environ., 27, 1277–1295, 1993.
Penner, J. E., Chuang, C. C., and Grant, K.: Climate forcing by car-bonaceous and sulfate aerosols, Clim. Dyn., 14, 839–851, 1998.
Petzold, A., Strom, J., Ohlsson, S., and Schroder, F. P.: Elementalcomposition and morphology of ice crystal residual particles incirrus clouds and contrails, Atmos. Res., 49, 21–34, 1998.
Petzold, A., Dopelheuer, A., Brock, C. A., and Schroder, F. P.: Insitu observations and model calculations of black carbon emis-sion by aircraft at cruise altitude, J. Geophys. Res., 104, 22 171–22 181, 1999.
Petzold, A., Fiebig, M., Flentje, H., Keil, A., Leiterer, U.,Schroder, F., Stifter, A., Wendisch, M., and Wendling, P.: Ver-tical variability of aerosol properties observed at a continen-tal site during LACE 98, J. Geophys. Res., 107, (D21), 8128,doi:10.1029/2001JD001043, 2002.
Atmos. Chem. Phys., 4, 2521–2541, 2004 www.atmos-chem-phys.org/acp/4/2521/

J. Hendricks et al.: Black carbon from aviation 2541
Pruppacher, H. R. and Klett, J. D.: Microphysics of Clouds andPrecipitation, Kluwer Acad., Dordrecht, The Netherlands, 954,1997.
Pueschel, R. F., Blake, D. F., Snetsinger, K. G., Hansen, A. D. A.,Verma, S., and Kato, K.: Black carbon (soot) aerosol in thelower stratosphere and upper troposphere, Geophys. Res. Lett.,19, 1659–1662, 1992.
Pueschel, R. F., Verma, S., Rohatschek, H., Ferry, G. V., Boiadjieva,N., Howard, S. D., and Strawa, A. W.: Vertical transport of an-thropogenic soot aerosol into the middle atmosphere, J. Geophys.Res., 105, 3727–3736, 2000.
Radke, L. F., Hegg, D. A., Lyons, J. H., Brock, C. A., Hobbs,P. V., Weiss, R., and Rasmussen, R.: Airborne measurements onsmokes from biomass burning, In: Aerosols and Climate, editedby P. V. Hobbs and M. P. McCormick, A. Deepak Publishing,Hampton, VA, 411–422, 1988.
Rahmes, T. F., Omar, A. H., and Wuebbles, D. J.: Atmosphericdistributions of soot particles by current and future aircraft fleetsand resulting radiative forcing on climate, J. Geophys. Res., 103,31 657–31 667, 1998.
Roeckner, E., Arpe, K., Bengtsson, L., Christoph, M., Claussen,M., Dumenil, L., Esch, M., Giorgetta, M., Schlese, U., andSchulzweida, U.: The atmospheric general circulation modelECHAM4: Model description and simulation of the present dayclimate, Tech. Rep., 218, Max–Planck–Inst. fur Meteorol., Ham-burg, Germany, 1996.
Rogers, H., Teyssedre, H., Pitari, G., Grewe, V., van Velthoven,P., and Sundet, J.: Model intercomparison of the transport ofaircraft-like emissions from sub- and supersonic aircraft, Meteo-rol. Zeitschrift, 11, 151–159, 2002.
Schmitt, A. and Brunner, B.: Emissions from aviation and their de-velopment over time, in: Final Report on the BMBF Verbundpro-gramm, Schadstoffe in der Luftfahrt, edited by: Schumann, U.,Chlond, A., Ebel, A., Karcher, B., Pak, H., Schlager, H., Schmitt,A., and Wendling, P., DLR-Mitteilung 97-04, Deutsches Zen-trum fur Luft- und Raumfahrt, Oberpfaffenhofen and Cologne,Germany, 37–52, 1997.
Schroder, F. P., Karcher, B., Petzold, A., Baumann, R., Busen, R.,Hoell, C., and Schuman, U.: Ultrafine aerosol particles in aircraftplumes: In situ observations, Geophys. Res. Lett., 25, 2789–2792, 1998.
Schroder, F., Karcher, B., Fiebig, M., and Petzold, A.: Aerosolstates in the free troposphere, J. Geophys. Res., 107, (D21),8126, doi:10.1029/2001JD000194, 2002.
Schult, I., Feichter, J., and Cooke, W.: Effect of black carbon andsulfate aerosols on the global radiation budget, J. Geophys. Res.,102, 30 107–30 117, 1997.
Stephens, M., Turner, N., and Sandberg, J.: Particle identificationby Laser Induced Incandescence in a solid state laser cavity,Appl. Optics, 42, 3726–3736, 2003.
Strawa, A. W., Drdla, K., Ferry, G. V., Verma, S., Pueschel, R. F.,Yasuda, M., Salawitch, R. J., Gao, R. S., Howard, D. D., Bui,P. T., Loewenstein, M., Elkins, J. W., Perkins, K. K., and Cohen,R.: Carbonaceous aerosol (Soot) measured in the lower strato-sphere during POLARIS and its role in stratospheric photochem-istry, J. Geophys. Res., 104, 26 753–26 766, 1999.
Strom, J., and Ohlsson, S.: In-situ measurements of enhanced crys-tal number densities in cirrus clouds caused by aircraft exhaust,J. Geophys. Res., 103, 11 355–11 361, 1998.
Williamson, D. L. and Rasch, P. J.: Water vapor transport in theNCAR CCM2, Tellus, 46A, 34–51, 1994.
www.atmos-chem-phys.org/acp/4/2521/ Atmos. Chem. Phys., 4, 2521–2541, 2004