
Simplified viscosity evaluating method of high viscosity asphalt binders
10
ORIGINAL ARTICLE Simplified viscosity evaluating method of high viscosity asphalt binders Lihan Li • Han Geng • Yanna Sun Received: 22 July 2013 / Accepted: 26 March 2014 Ó RILEM 2014 Abstract In order to establish a simplified viscosity evaluating method of high viscosity asphalt binders (HVABs), shear rate sweep test in the shear rate range of 1.25 9 10 -6 –1,250 s -1 was performed. Results showed that HVABs exhibited yield pseudo-plastic fluid behavior at 60 °C and the overlapped range of the first Newtonian region was 8 9 10 -5 –2 9 10 -2 s -1 . Based on the results, the simplified shear rate sweep test in the shear rate range of 0.001–0.1 s -1 was proposed and low shear viscosity at 0.01 s -1 (LSV 0.01 ) was suggested as the viscosity evaluating indicator of HVABs, which exhibited both close values to zero shear viscosity and significant correlation with rutting resistance of porous asphalt. Keywords High viscosity asphalt binder Shear rate sweep test Yield stress First Newtonian region Zero shear viscosity Low shear viscosity Capillary viscosity 1 Introduction High viscosity asphalt binders (HVABs) were devel- oped by Japanese companies to improve rutting resistance and durability of porous asphalt [15]. HVABs are compound modified asphalt binders, which are mainly modified by styrene–butadiene– styrene (SBS), mineral oil and petroleum resin [9]. SBS is the main component of HVABs, which is commonly 6–12 % of base binder by weight [21]. According to Japanese specification in 1996, the capillary viscosity of HVABs for porous asphalt at 60 °C should be no less than 2 9 10 4 Pa s and the softening point should be no less than 80 °C[10]. The Chinese specification for asphalt pavement construc- tion has the same requirements for HVABs as the Japanese specification mentioned [16]. As the tech- nology improvement for producing HVABs, capillary viscosity of typical HVABs at 60 °C in Japan and China is higher than 1 9 10 5 Pa s [13, 15]. According to Sybilski’s [19] study, polymer mod- ified binders exhibit the behavior of pseudo-plastic shear-thinning liquid, whose viscosity is dependent on shear rate. Pseudo-plastic shear-thinning liquid and yield pseudo-plastic shear-thinning liquid are typical non-Newtonian liquids. Their behaviors are approxi- mated by power law equation and Herschel–Bulkley equation, which are shown in Eqs. (1) and (2), respectively [12]. Typical log–log plot of the relations between viscosity, shear stress and shear rate for both liquids are shown in Fig. 1 [4]. For pseudo-plastic liquids, shear rate increases in function of power along with the increase of shear stress. In log–log plot, viscosity approximates a constant value as shear rate tends to zero, which is the value of zero shear L. Li H. Geng (&) Y. Sun Key Laboratory of Road and Traffic Engineering of the Ministry of Education, Tongji University, 1239 Siping Road, Shanghai 200092, People’s Republic of China e-mail: [email protected] Materials and Structures DOI 10.1617/s11527-014-0299-2
Transcript of Simplified viscosity evaluating method of high viscosity asphalt binders
ORIGINAL ARTICLE
Simplified viscosity evaluating method of highviscosity asphalt binders
Lihan Li • Han Geng • Yanna Sun
Received: 22 July 2013 / Accepted: 26 March 2014
� RILEM 2014
Abstract In order to establish a simplified viscosity
evaluating method of high viscosity asphalt binders
(HVABs), shear rate sweep test in the shear rate range
of 1.25 9 10-6–1,250 s-1 was performed. Results
showed that HVABs exhibited yield pseudo-plastic
fluid behavior at 60 �C and the overlapped range of the
first Newtonian region was 8 9 10-5–2 9 10-2 s-1.
Based on the results, the simplified shear rate sweep
test in the shear rate range of 0.001–0.1 s-1 was
proposed and low shear viscosity at 0.01 s-1 (LSV0.01)
was suggested as the viscosity evaluating indicator of
HVABs, which exhibited both close values to zero
shear viscosity and significant correlation with rutting
resistance of porous asphalt.
Keywords High viscosity asphalt binder �Shear rate sweep test � Yield stress �First Newtonian region � Zero shear viscosity �Low shear viscosity � Capillary viscosity
1 Introduction
High viscosity asphalt binders (HVABs) were devel-
oped by Japanese companies to improve rutting
resistance and durability of porous asphalt [15].
HVABs are compound modified asphalt binders,
which are mainly modified by styrene–butadiene–
styrene (SBS), mineral oil and petroleum resin [9].
SBS is the main component of HVABs, which is
commonly 6–12 % of base binder by weight [21].
According to Japanese specification in 1996, the
capillary viscosity of HVABs for porous asphalt at
60 �C should be no less than 2 9 104 Pa s and the
softening point should be no less than 80 �C [10]. The
Chinese specification for asphalt pavement construc-
tion has the same requirements for HVABs as the
Japanese specification mentioned [16]. As the tech-
nology improvement for producing HVABs, capillary
viscosity of typical HVABs at 60 �C in Japan and
China is higher than 1 9 105 Pa s [13, 15].
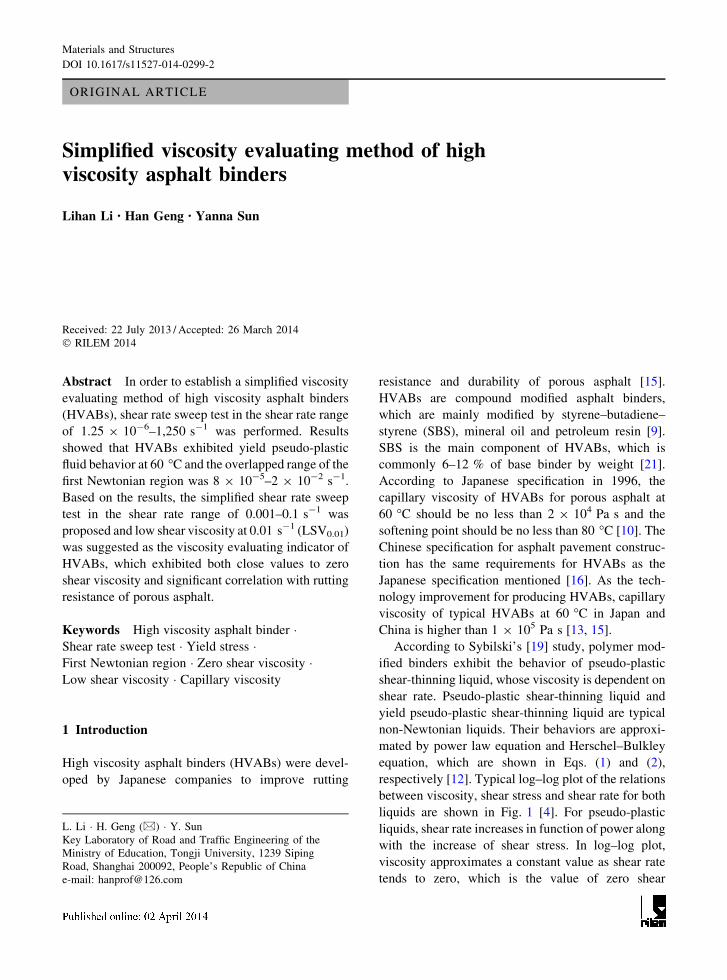
According to Sybilski’s [19] study, polymer mod-
ified binders exhibit the behavior of pseudo-plastic
shear-thinning liquid, whose viscosity is dependent on
shear rate. Pseudo-plastic shear-thinning liquid and
yield pseudo-plastic shear-thinning liquid are typical
non-Newtonian liquids. Their behaviors are approxi-
mated by power law equation and Herschel–Bulkley
equation, which are shown in Eqs. (1) and (2),
respectively [12]. Typical log–log plot of the relations
between viscosity, shear stress and shear rate for both
liquids are shown in Fig. 1 [4]. For pseudo-plastic
liquids, shear rate increases in function of power along
with the increase of shear stress. In log–log plot,
viscosity approximates a constant value as shear rate
tends to zero, which is the value of zero shear
L. Li � H. Geng (&) � Y. Sun
Key Laboratory of Road and Traffic Engineering of the
Ministry of Education, Tongji University, 1239 Siping
Road, Shanghai 200092, People’s Republic of China
e-mail: [email protected]
Materials and Structures
DOI 10.1617/s11527-014-0299-2
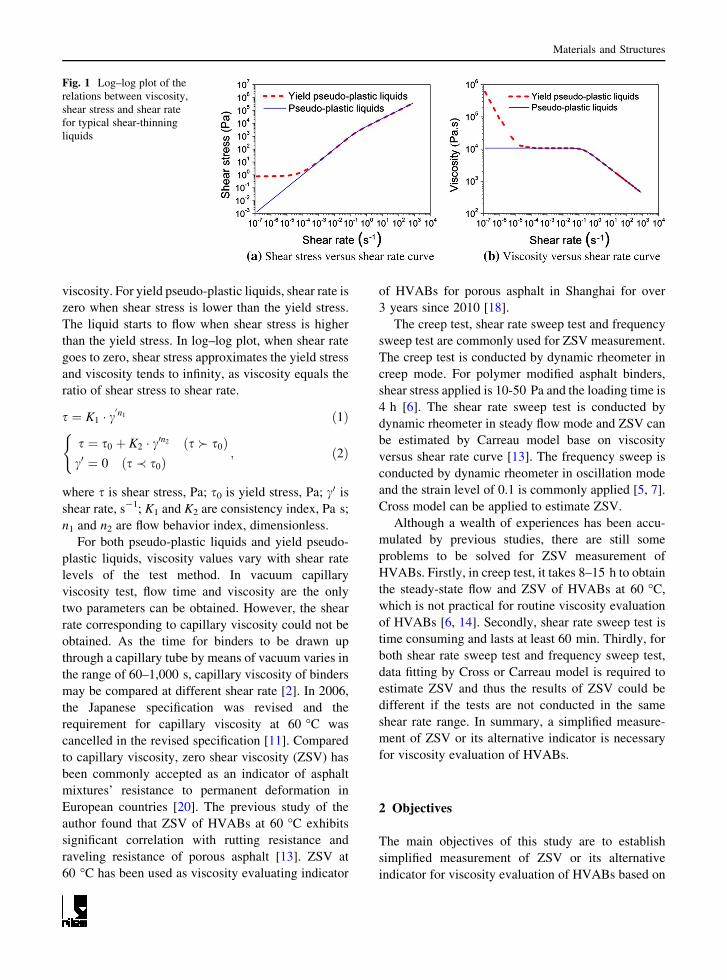
viscosity. For yield pseudo-plastic liquids, shear rate is
zero when shear stress is lower than the yield stress.
The liquid starts to flow when shear stress is higher
than the yield stress. In log–log plot, when shear rate
goes to zero, shear stress approximates the yield stress
and viscosity tends to infinity, as viscosity equals the
ratio of shear stress to shear rate.
s ¼ K1 � c0n1 ð1Þ
s ¼ s0 þ K2 � c0n2 s � s0ð Þc0 ¼ 0 s � s0ð Þ
(; ð2Þ
where s is shear stress, Pa; s0 is yield stress, Pa; c0 is
shear rate, s-1; K1 and K2 are consistency index, Pa s;
n1 and n2 are flow behavior index, dimensionless.
For both pseudo-plastic liquids and yield pseudo-
plastic liquids, viscosity values vary with shear rate
levels of the test method. In vacuum capillary
viscosity test, flow time and viscosity are the only
two parameters can be obtained. However, the shear
rate corresponding to capillary viscosity could not be
obtained. As the time for binders to be drawn up
through a capillary tube by means of vacuum varies in
the range of 60–1,000 s, capillary viscosity of binders
may be compared at different shear rate [2]. In 2006,
the Japanese specification was revised and the
requirement for capillary viscosity at 60 �C was
cancelled in the revised specification [11]. Compared
to capillary viscosity, zero shear viscosity (ZSV) has
been commonly accepted as an indicator of asphalt
mixtures’ resistance to permanent deformation in
European countries [20]. The previous study of the
author found that ZSV of HVABs at 60 �C exhibits
significant correlation with rutting resistance and
raveling resistance of porous asphalt [13]. ZSV at
60 �C has been used as viscosity evaluating indicator
of HVABs for porous asphalt in Shanghai for over
3 years since 2010 [18].
The creep test, shear rate sweep test and frequency
sweep test are commonly used for ZSV measurement.
The creep test is conducted by dynamic rheometer in
creep mode. For polymer modified asphalt binders,
shear stress applied is 10-50 Pa and the loading time is
4 h [6]. The shear rate sweep test is conducted by
dynamic rheometer in steady flow mode and ZSV can
be estimated by Carreau model base on viscosity
versus shear rate curve [13]. The frequency sweep is
conducted by dynamic rheometer in oscillation mode
and the strain level of 0.1 is commonly applied [5, 7].
Cross model can be applied to estimate ZSV.
Although a wealth of experiences has been accu-
mulated by previous studies, there are still some
problems to be solved for ZSV measurement of
HVABs. Firstly, in creep test, it takes 8–15 h to obtain
the steady-state flow and ZSV of HVABs at 60 �C,
which is not practical for routine viscosity evaluation
of HVABs [6, 14]. Secondly, shear rate sweep test is
time consuming and lasts at least 60 min. Thirdly, for
both shear rate sweep test and frequency sweep test,
data fitting by Cross or Carreau model is required to
estimate ZSV and thus the results of ZSV could be
different if the tests are not conducted in the same
shear rate range. In summary, a simplified measure-
ment of ZSV or its alternative indicator is necessary
for viscosity evaluation of HVABs.
2 Objectives
The main objectives of this study are to establish
simplified measurement of ZSV or its alternative
indicator for viscosity evaluation of HVABs based on
Fig. 1 Log–log plot of the
relations between viscosity,
shear stress and shear rate
for typical shear-thinning
liquids
Materials and Structures
the analysis of viscosity (or shear stress) versus shear
rate curve under low shear rate condition, and to verify
the viscosity evaluating indicator based on the corre-
lation analysis between indicators of asphalt binders
and rutting resistance indicator of porous asphalt.
3 Experimental
3.1 Materials
In this study, two neat binders, one styrene–butadiene–
styrene (SBS) binder, one high modulus asphalt binder
(HMABs) and six HVABs were included. Penetration
at 25 �C (Pen), softening point (TR&B), capillary
viscosity (gc) by vacuum capillary viscometer at
60 �C [2], G*/sind at 60 �C [1] and non-recoverable
creep compliance at 0.1 kPa and 60 �C (Jnr0.1) [3] are
shown in Table 1.
Porous asphalt with the nominal maximum aggregate
size of 13.2 mm (PA-13.2) was designed for wheel
tracking test. The traffic volume for the mix design was
equal to 4 9 106 equivalent single axle loads (ESALs).
Asphalt content of the mixture was 4.2 % and air voids
were 20 ± 1 %. Crushed diabase was used as coarse
aggregates (4.75–13.2 mm) and limestone was used as
fine aggregates (0.075–2.36 mm). The voids in the
mineral aggregate (VMA) was 28.3 % and the voids
filled with asphalt (VFA) was 29.4 %. Binders No. 1,
No. 3, No. 4, No. 5, No. 6 and No. 7 were selected for
wheel tracking test. The values of dynamic stability
(DS) by wheel tracking test of porous asphalt are shown
in Table 1. The gradation of porous asphalt is shown in
Table 2. Test method for wheel tracking test is
described in the sections below.
3.2 Shear rate sweep test
Shear rate sweep test was used to obtain viscosity
versus shear rate curve [13]. This test was performed
by AR 1500ex rheometer in steady flow mode, with
25 mm diameter plates, 1,000 lm thickness of asphalt
samples and water bath at 60 �C. In order to obtain
viscosity versus shear rate curve in a wide range, shear
rate range of 1.25 9 10-6–1,250 s-1 was applied. In
the steady flow mode for shear rate sweep test,
successive shear rate was applied and data was
sampled under equilibrium conditions. In the study,
five shear rate levels were applied per decade with
equidifferent progressive increase in logarithmic
coordinates.
Carreau model was used to estimate ZSV of asphalt
binders in the study, which is shown in Eq. (3). The
first Newtonian region was defined as the shear rate
range corresponding to 0.8–1.0 time the value of ZSV.
g� g1g0 � g1
¼ 1
1þ K3 � c0ð Þ2� �n3=2
; ð3Þ
where c0 is shear rate, s-1; g is viscosity, Pa s; g0 is
zero shear viscosity, Pa s; g? is infinite shear rate
viscosity, Pa s; K3 is shear rate coefficient, s; n3 is
shear rate index, dimensionless.
The previous study of the author found that
viscosity of binders tends to infinity when the shear
rate is lower than 10-5 s-1 in shear rate sweep test at
60 �C [13]. The phenomenon indicates that the asphalt
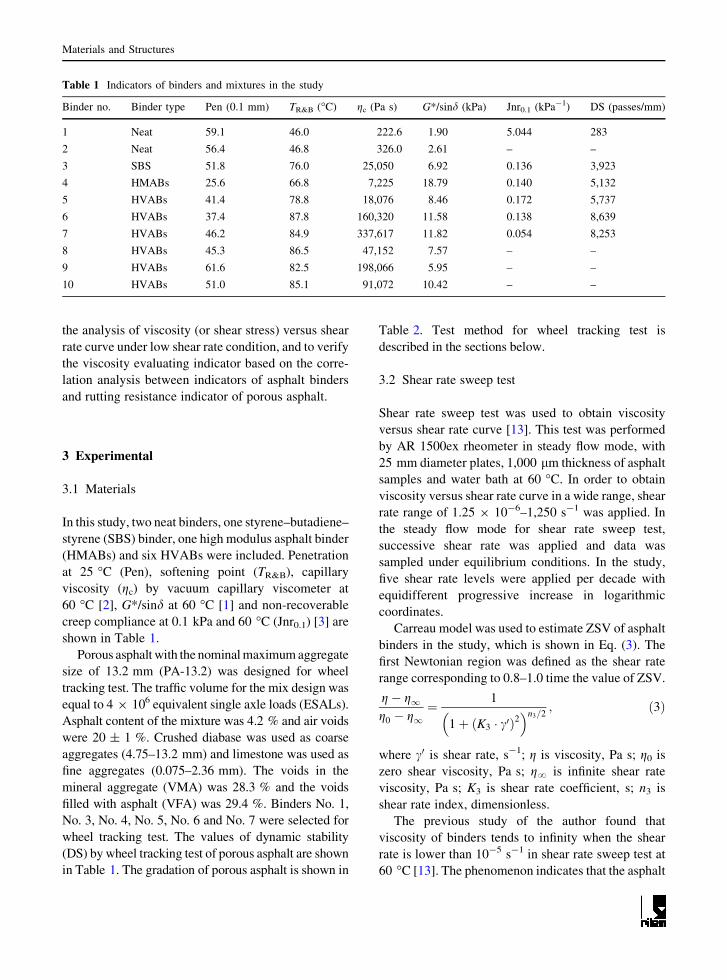
Table 1 Indicators of binders and mixtures in the study
Binder no. Binder type Pen (0.1 mm) TR&B (�C) gc (Pa s) G*/sind (kPa) Jnr0.1 (kPa-1) DS (passes/mm)
1 Neat 59.1 46.0 222.6 1.90 5.044 283
2 Neat 56.4 46.8 326.0 2.61 – –
3 SBS 51.8 76.0 25,050 6.92 0.136 3,923
4 HMABs 25.6 66.8 7,225 18.79 0.140 5,132
5 HVABs 41.4 78.8 18,076 8.46 0.172 5,737
6 HVABs 37.4 87.8 160,320 11.58 0.138 8,639
7 HVABs 46.2 84.9 337,617 11.82 0.054 8,253
8 HVABs 45.3 86.5 47,152 7.57 – –
9 HVABs 61.6 82.5 198,066 5.95 – –
10 HVABs 51.0 85.1 91,072 10.42 – –
Materials and Structures
binders may exhibit yield pseudo-plastic fluid behav-
ior at 60 �C [8]. Herschel–Bulkley model was selected
to estimate yield stress of asphalt binders in the study,
which is shown in Eq. (2).
3.3 Wheel tracking test
The samples for wheel tracking test were compacted in
a steel mold with internal dimensions of 300 9 300 9
50 mm. At least two replicates were compacted for
each binder. The wheel tracking test was performed by
QCZ-2 wheel tracking machine produced by Beijing
Jingu Measuring and Control Technology Institute.
The tire of the machine is made of solid rubber. The
outside diameter, width and thickness of the rubber
tire are 200, 50 and 20 mm respectively. The pressure
of the rubber tire is 0.7 MPa at 60 �C.
Test procedures were conducted according to the
Chinese specification [17].The samples were condi-
tioned at 60 �C for 5 h before testing. The samples
were subjected to the tire with a travel distance of
230 mm and a frequency of 21 cycles per minute (42
passes per minute) for 1 h. DS is the indicator for
rutting resistance evaluation in the test, which is
calculated based on data of the last 15 min according
to Eq. (4).
DS ¼ 60� 45ð Þd2 � d1
; ð4Þ
where DS is dynamic stability of asphalt mixture,
passes/mm; d1 is rutting depth at 45 min, mm; d2 is the
rutting depth at 60 min, mm; N is the frequency of the
tire, 42 passes per minute.
4 Results and discussion
4.1 Yield stress and zero shear viscosity
Shear rate sweep test were performed in the shear rate
range of 1.25 9 10-6–1,250 s-1 at 60 �C. Shear
stress versus shear rate curves fitted by Herschel–
Bulkley model and viscosity versus shear rate curves
fitted by Carreau model are shown in Fig. 2. As
shown, when the shear rate is lower than 10-5 s-1, for
10 binders in the study, the viscosity tends to infinity
and the shear stress approximates a constant value.
This phenomenon indicates that asphalt binders
exhibit yield stress at 60 �C. When the shear rate
was higher than 10-5 s-1, Carreau model agrees well
with viscosity versus shear rate data points of the
binders. Based on the results, it was concluded that
asphalt binders exhibited yield pseudo-plastic fluid
behavior, rather than pseudo-plastic fluid behavior as
previously considered. As the ZSV does not actually
exist for binders with a yield stress, low shear viscosity
in the first Newtonian region shows its potential for
viscosity evaluating of HVABs.
Yield stress and ZSV estimated by regression
analysis are shown in Table 3. The values of ZSV in
the study were estimated by Carreau model based on
part of viscosity versus shear rate curve shown in
Fig. 2. The part of the curve where viscosity tends to
infinity as shear rate decrease was not included for
ZSV estimation. As shown, ZSV of 10 binders in the
study at 60 �C is 184.1–73,880 Pa s and the yield
stress is 0.03–0.81 Pa. For all HVABs with ZSV
higher than 2 9 104 Pa s (Nos. 6–10), the yield stress
is 0.17–0.81 Pa, which is 1.1–26 times higher than that
of the other binders (Nos. 1–5) in the study. The
overlapped range of the first Newtonian region of
HVABs with ZSV higher than 2 9 104 Pa s (Nos.
6–10) is 7.6 9 10-5–2.2 9 10-2 s-1.The overlapped
range of the first Newtonian region of 10 binders in the
study is 5.0 9 10-3–1.0 9 10-2 s-1. The test results
indicate that the low shear rate viscosity (LSV) in the
range of 5.0 9 10-3–1.0 9 10-2 s-1 may exhibit
close viscosity values to ZSV of asphalt binders.
4.2 Low shear viscosity
The LSV in the range of 1.0 9 10-4–1.0 9 10-1 s-1
and LSV to ZSV ratio are shown in Table 4. Statistic
parameters including the average and variance of LSV
to ZSV ratio were calculated. As shown, both the
average and variance of the ratio decrease as the shear
rate increase. When shear rate is 0.01 s-1, the average
of LSV to ZSV ratio is 95.8 % and the variance of the
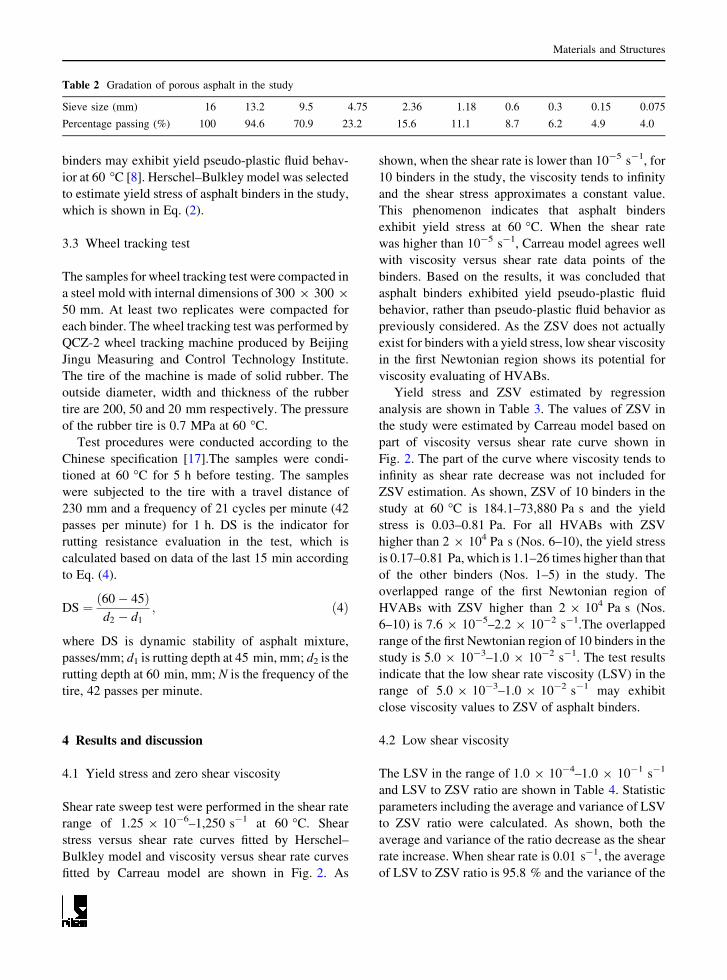
Table 2 Gradation of porous asphalt in the study
Sieve size (mm) 16 13.2 9.5 4.75 2.36 1.18 0.6 0.3 0.15 0.075
Percentage passing (%) 100 94.6 70.9 23.2 15.6 11.1 8.7 6.2 4.9 4.0
Materials and Structures
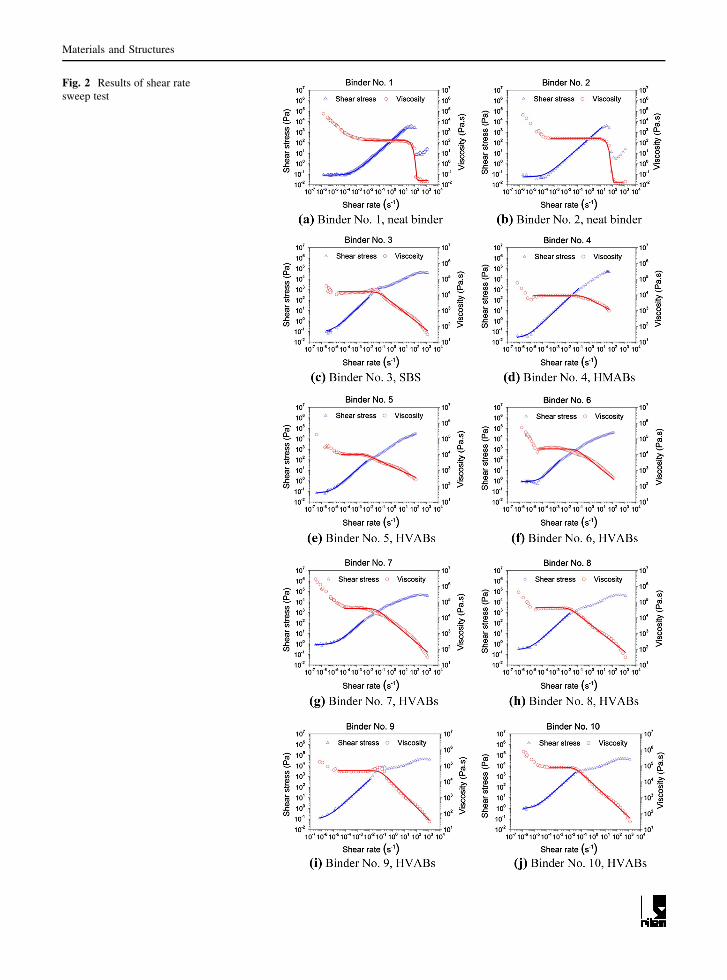
Fig. 2 Results of shear rate
sweep test
Materials and Structures
ratio is 9.1 %. The results showed that low shear
viscosity at 0.01 s-1 (LSV0.01) exhibited close values
to ZSV in the study.
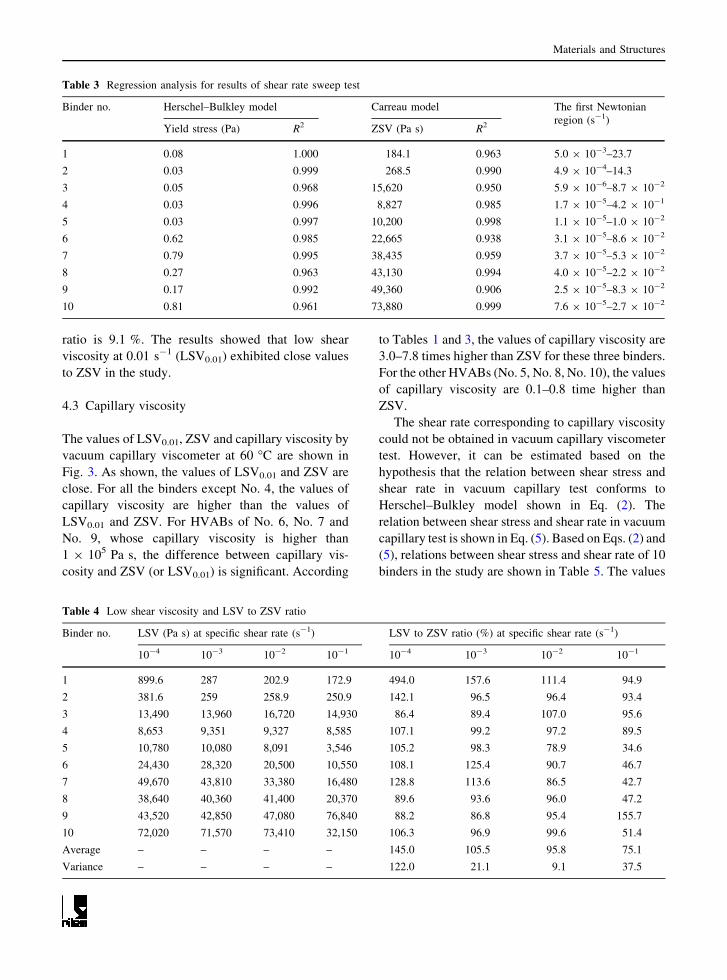
4.3 Capillary viscosity
The values of LSV0.01, ZSV and capillary viscosity by
vacuum capillary viscometer at 60 �C are shown in
Fig. 3. As shown, the values of LSV0.01 and ZSV are
close. For all the binders except No. 4, the values of
capillary viscosity are higher than the values of
LSV0.01 and ZSV. For HVABs of No. 6, No. 7 and
No. 9, whose capillary viscosity is higher than
1 9 105 Pa s, the difference between capillary vis-
cosity and ZSV (or LSV0.01) is significant. According
to Tables 1 and 3, the values of capillary viscosity are
3.0–7.8 times higher than ZSV for these three binders.
For the other HVABs (No. 5, No. 8, No. 10), the values
of capillary viscosity are 0.1–0.8 time higher than
ZSV.
The shear rate corresponding to capillary viscosity
could not be obtained in vacuum capillary viscometer
test. However, it can be estimated based on the
hypothesis that the relation between shear stress and
shear rate in vacuum capillary test conforms to
Herschel–Bulkley model shown in Eq. (2). The
relation between shear stress and shear rate in vacuum
capillary test is shown in Eq. (5). Based on Eqs. (2) and
(5), relations between shear stress and shear rate of 10
binders in the study are shown in Table 5. The values
Table 3 Regression analysis for results of shear rate sweep test
Binder no. Herschel–Bulkley model Carreau model The first Newtonian
region (s-1)Yield stress (Pa) R2 ZSV (Pa s) R2
1 0.08 1.000 184.1 0.963 5.0 9 10-3–23.7
2 0.03 0.999 268.5 0.990 4.9 9 10-4–14.3
3 0.05 0.968 15,620 0.950 5.9 9 10-6–8.7 9 10-2
4 0.03 0.996 8,827 0.985 1.7 9 10-5–4.2 9 10-1
5 0.03 0.997 10,200 0.998 1.1 9 10-5–1.0 9 10-2
6 0.62 0.985 22,665 0.938 3.1 9 10-5–8.6 9 10-2
7 0.79 0.995 38,435 0.959 3.7 9 10-5–5.3 9 10-2
8 0.27 0.963 43,130 0.994 4.0 9 10-5–2.2 9 10-2
9 0.17 0.992 49,360 0.906 2.5 9 10-5–8.3 9 10-2
10 0.81 0.961 73,880 0.999 7.6 9 10-5–2.7 9 10-2
Table 4 Low shear viscosity and LSV to ZSV ratio
Binder no. LSV (Pa s) at specific shear rate (s-1) LSV to ZSV ratio (%) at specific shear rate (s-1)
10-4 10-3 10-2 10-1 10-4 10-3 10-2 10-1
1 899.6 287 202.9 172.9 494.0 157.6 111.4 94.9
2 381.6 259 258.9 250.9 142.1 96.5 96.4 93.4
3 13,490 13,960 16,720 14,930 86.4 89.4 107.0 95.6
4 8,653 9,351 9,327 8,585 107.1 99.2 97.2 89.5
5 10,780 10,080 8,091 3,546 105.2 98.3 78.9 34.6
6 24,430 28,320 20,500 10,550 108.1 125.4 90.7 46.7
7 49,670 43,810 33,380 16,480 128.8 113.6 86.5 42.7
8 38,640 40,360 41,400 20,370 89.6 93.6 96.0 47.2
9 43,520 42,850 47,080 76,840 88.2 86.8 95.4 155.7
10 72,020 71,570 73,410 32,150 106.3 96.9 99.6 51.4
Average – – – – 145.0 105.5 95.8 75.1
Variance – – – – 122.0 21.1 9.1 37.5
Materials and Structures
of shear rate corresponding to capillary viscosity were
calculated by including the shear stress in Eq. (5) into
Eq. (2). Results of shear rate in vacuum capillary test
(cc0) and the minimum of the first Newtonian region
(c0min) are shown in Table 5. The indicator of c0min
represents the minimum shear rate to overcome yield
stress of asphalt binders in the study. As shown, for all
binders in the study except No. 4, the values of cc0 vary
in the range of 1.1 9 10-6–3.1 9 10-3 s-1, which are
0.04–0.99 time the value of c0min. For No. 6, No. 7 and
No. 9 binders, whose capillary viscosity is higher than
1 9 105 Pa s, the values of cc0 are in the range of
1.1 9 10-6–4.4 9 10-6 s-1, which are 0.04–0.14
time the value of c0min. The results indicate that the
100
1000
10000
100000
1000000
1 2 3 4 5 6 7 8 9 10
Vis
cosi
ty (
Pa·
s)
Binder Number
Low shear viscosity at 0.01 1/s
Zero shear viscosity
Capillary viscosity
Fig. 3 Results of LSV0.01,
ZSV and capillary viscosity
Table 5 Shear rate of capillary viscosity
Binder no. Eq. (2) for each binder Eq. (5) for each binder c0c (s-1) c0min (s-1) Ratio of c0c to c0min (s-1)
1 sc ¼ 0:08þ 156:9 c0c� �0:960 sc = 222.6c0c 3.1 9 10-3 5.0 9 10-3 0.62
2 sc ¼ 0:03þ 246:9 c0c� �0:996 sc = 326.0c0c 3.9 9 10-4 4.9 9 10-4 0.80
3 sc ¼ 0:05þ 20501:8 c0c� �1:052 sc = 25,050c0c 3.6 9 10-6 5.9 9 10-6 0.61
4 sc ¼ 0:03þ 11475:4 c0c� �1:055 sc = 7,225c0c 3.7 9 10-5 1.7 9 10-5 2.18
5 sc ¼ 0:03þ 7672:1 c0c� �0:964 sc = 18,076c0c 5.3 9 10-6 1.1 9 10-5 0.48
6 sc ¼ 0:62þ 18000:0 c0c� �0:989 sc = 160,320c0c 4.4 9 10-6 3.1 9 10-5 0.14
7 sc ¼ 0:79þ 29821:3 c0c� �0:975 sc = 337,617c0c 3.0 9 10-6 3.7 9 10-5 0.08
8 sc ¼ 0:27þ 16033:3 c0c� �0:881 sc = 47,152c0c 3.1 9 10-5 4.0 9 10-5 0.78
9 sc ¼ 0:17þ 48291:8 c0c� �1:017 sc = 198,066c0c 1.1 9 10-6 2.5 9 10-5 0.04
10 sc ¼ 0:81þ 56965:3 c0c� �0:964 sc = 91,072c0c 7.5 9 10-5 7.6 9 10-5 0.99
Table 6 Comparison of viscosity test methods
Aspects for
comparison
Shear rate
sweep test
Simplified shear
rate sweep test
Loading mode Steady flow Steady flow
Shear rate range 1.25 9 10-6–
1.25 9 103 s-10.001–0.1 s-1
No. of data points
collected
45 10
Time 60–90 min 10–15 min
Indicators ZSV LSV0.01
Data analysis
method
Model fitting Linear
interpolation
Repeatability CV 1.3–8.3 % CV 2.2–8.5 %
Materials and Structures
shear rate provided by the pressure of vacuum
capillary viscometer test was not high enough to
overcome the yield stress of HVABs. The results may
provide an explanation for the phenomenon that the
values of capillary viscosity were 3.0–7.8 times higher
than ZSV in the study. Based on these results, it can be
concluded that vacuum capillary viscosity test is not
suitable for viscosity evaluating of HVABs, as capil-
lary viscosity of HVABs is significant higher than
ZSV and the shear rate in vacuum capillary viscosity
test is not high enough to overcome the yield stress of
HVABs.
(a) Relation between TR&B ηc and DS
(c) Relation between G*/sinδ 0.1 and DS
and DS (b) Relation between
and DS (d) Relation between Jnr
(e) Relation between ZSV and DS (f) Relation between LSV0.01 and DS
y = 8.892×10-7x5.178
R² = 0.920
α = 0.0024
0
2000
4000
6000
8000
10000
12000
14000
DS
(P
asse
s/m
m)
TR&B
y = 1121.4ln(x) - 5687.8
R² = 0.897
α = 0.0042
0
2000
4000
6000
8000
10000
12000
14000
DS
(P
asse
s/m
m)
ηc (Pa·s)
y = 162.032 x1.486
R² = 0.830
α = 0.0115
0
2000
4000
6000
8000
10000
12000
14000
DS
(P
asse
s/m
m)
G*/sinδ (kPa)
y = 1114.4x-0.789
R² = 0.940
α = 0.0014
0
2000
4000
6000
8000
10000
12000
14000
DS
(P
asse
s/m
m)
Jnr0.1 (kPa-1)
y = 10.098x0.657
R² = 0.954
α = 0.0008
0
2000
4000
6000
8000
10000
12000
14000
DS
(P
asse
s/m
m)
ZSV (Pa•s)
y = 8.708 x0.677
R² = 0.939
α = 0.0014
0
2000
4000
6000
8000
10000
12000
14000
20 40 60 80 100 0 100000 200000 300000 400000
0 10 20 0.000 2.000 4.000 6.000
0 20000 40000 60000 0 20000 40000 60000
DS
(P
asse
s/m
m)
LSV0.01 (Pa•s)
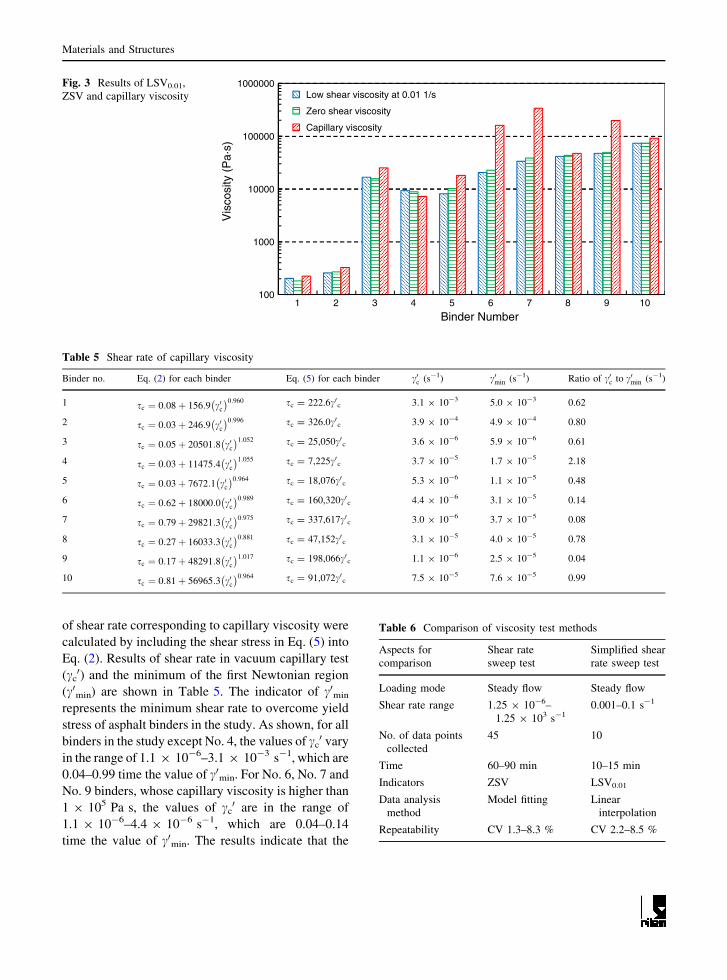
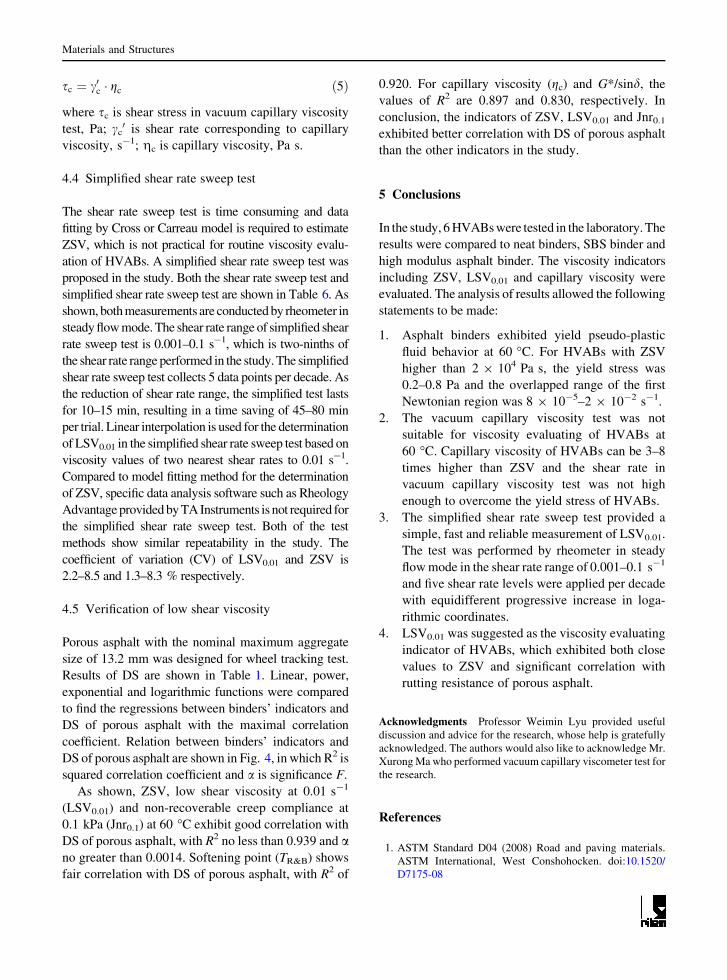
Fig. 4 Relation between
binders’ indicators and
dynamic stability of porous
asphalt. Created by ‘‘Excel
2010’’
Materials and Structures
sc ¼ c0c � gc ð5Þ
where sc is shear stress in vacuum capillary viscosity
test, Pa; cc0 is shear rate corresponding to capillary
viscosity, s-1; gc is capillary viscosity, Pa s.
4.4 Simplified shear rate sweep test
The shear rate sweep test is time consuming and data
fitting by Cross or Carreau model is required to estimate
ZSV, which is not practical for routine viscosity evalu-
ation of HVABs. A simplified shear rate sweep test was
proposed in the study. Both the shear rate sweep test and
simplified shear rate sweep test are shown in Table 6. As
shown, both measurements are conducted by rheometer in
steady flow mode. The shear rate range of simplified shear
rate sweep test is 0.001–0.1 s-1, which is two-ninths of
the shear rate range performed in the study. The simplified
shear rate sweep test collects 5 data points per decade. As
the reduction of shear rate range, the simplified test lasts
for 10–15 min, resulting in a time saving of 45–80 min
per trial. Linear interpolation is used for the determination
of LSV0.01 in the simplified shear rate sweep test based on
viscosity values of two nearest shear rates to 0.01 s-1.
Compared to model fitting method for the determination
of ZSV, specific data analysis software such as Rheology
Advantage provided by TA Instruments is not required for
the simplified shear rate sweep test. Both of the test
methods show similar repeatability in the study. The
coefficient of variation (CV) of LSV0.01 and ZSV is
2.2–8.5 and 1.3–8.3 % respectively.
4.5 Verification of low shear viscosity
Porous asphalt with the nominal maximum aggregate
size of 13.2 mm was designed for wheel tracking test.
Results of DS are shown in Table 1. Linear, power,
exponential and logarithmic functions were compared
to find the regressions between binders’ indicators and
DS of porous asphalt with the maximal correlation
coefficient. Relation between binders’ indicators and
DS of porous asphalt are shown in Fig. 4, in which R2 is
squared correlation coefficient and a is significance F.
As shown, ZSV, low shear viscosity at 0.01 s-1
(LSV0.01) and non-recoverable creep compliance at
0.1 kPa (Jnr0.1) at 60 �C exhibit good correlation with
DS of porous asphalt, with R2 no less than 0.939 and ano greater than 0.0014. Softening point (TR&B) shows
fair correlation with DS of porous asphalt, with R2 of
0.920. For capillary viscosity (gc) and G*/sind, the
values of R2 are 0.897 and 0.830, respectively. In
conclusion, the indicators of ZSV, LSV0.01 and Jnr0.1
exhibited better correlation with DS of porous asphalt
than the other indicators in the study.
5 Conclusions
In the study, 6 HVABs were tested in the laboratory. The
results were compared to neat binders, SBS binder and
high modulus asphalt binder. The viscosity indicators
including ZSV, LSV0.01 and capillary viscosity were
evaluated. The analysis of results allowed the following
statements to be made:
1. Asphalt binders exhibited yield pseudo-plastic
fluid behavior at 60 �C. For HVABs with ZSV
higher than 2 9 104 Pa s, the yield stress was
0.2–0.8 Pa and the overlapped range of the first
Newtonian region was 8 9 10-5–2 9 10-2 s-1.
2. The vacuum capillary viscosity test was not
suitable for viscosity evaluating of HVABs at
60 �C. Capillary viscosity of HVABs can be 3–8
times higher than ZSV and the shear rate in
vacuum capillary viscosity test was not high
enough to overcome the yield stress of HVABs.
3. The simplified shear rate sweep test provided a
simple, fast and reliable measurement of LSV0.01.
The test was performed by rheometer in steady
flow mode in the shear rate range of 0.001–0.1 s-1
and five shear rate levels were applied per decade
with equidifferent progressive increase in loga-
rithmic coordinates.
4. LSV0.01 was suggested as the viscosity evaluating
indicator of HVABs, which exhibited both close
values to ZSV and significant correlation with
rutting resistance of porous asphalt.
Acknowledgments Professor Weimin Lyu provided useful
discussion and advice for the research, whose help is gratefully
acknowledged. The authors would also like to acknowledge Mr.
Xurong Ma who performed vacuum capillary viscometer test for
the research.
References
1. ASTM Standard D04 (2008) Road and paving materials.
ASTM International, West Conshohocken. doi:10.1520/
D7175-08
Materials and Structures
2. ASTM Standard D04 (2010) Road and paving materials.
ASTM International, West Conshohocken. doi:10.1520/
D2171-10
3. ASTM Standard D04 (2010) Road and paving materials.
ASTM International, West Conshohocken. doi:10.1520/
D7405-10A
4. Barnes HA, Hutton JF, Walters K (1989) An introduction to
rheology, vol 3. Elsevier, Amsterdam
5. CEN/TS 15324 (2008) Bitumen and bituminous binders:
determination of equiviscous temperature based on low
shear viscosity using a dynamic shear rheometer in low
frequency oscillation mode. European Committee for
Standardization, London
6. CEN/TS 15325 (2008) Bitumen and bituminous binders:
determination of zero shear viscosity (ZSV) using a shear
stress rheometer in creep mode. European Committee for
Standardization, London
7. De Visscher J, Vanelstraete A (2004) Practical test methods
for measuring the zero shear viscosity of bituminous bind-
ers. Mater Struct 37(5):360–364
8. Desmazes C, Lecomte M, Lesueur D, Phillips M (2000) A
protocol for reliable measurement of zero-shear-viscosity in
order to evaluate the anti-rutting performance of binders. In:
Proceedings of 2nd Eurasphalt & Eurobitume Congress,
Barcelona
9. Izumoto R (2000) Asphalt modifier, process for producing
modified asphalt, and process for producing road pavement
material, publication no. WO2000046304. World Intellec-
tual Property Organization, Geneva
10. Japan Road Association (1996) Technical manual of porous
asphalt pavement. Maruzen Publishing Co., Ltd., Tokyo
11. JMAAS-01 (2007) Japan Modified Asphalt Association
Standard. Japan Modified Asphalt Association, Tokyo
12. Larson RG (1999) The structure and rheology of complex
fluids, vol 2. Oxford University Press, New York
13. Li L-H, Geng H, Sun Y-N (2010) Evaluation method and
indicator for viscosity of high-viscosity asphalt. J Constr
Build Mater 13(3):352–362
14. Meng Y-J, Zhang X-N, Jia J (2008) Research on zero shear
viscosity of asphalt based on different loading modes.
J Traffic Transp Eng 8(4):35–38
15. Nakanishi H (2002) Study on improvement in durability of
function for porous asphalt pavement. Guangxi Commun
Sci Technol 27(102):7–12
16. Research Institute of Highway Ministry of Transport (2004)
Technical specifications for construction of highway asphalt
pavements. Ministry of Transport of People’s Republic of
China, Beijing
17. Research Institute of Highway Ministry of Transport (2011)
Standard test methods of bitumen and bituminous mixtures
for highway engineering. Ministry of Transport of People’s
Republic of China, Beijing
18. Shanghai Municipal Engineering Design Institute (Group)
Co., Ltd. (2010) Technical code for drainage asphalt pave-
ment of road. Shanghai Urban Construction and Commu-
nications Commission, Shanghai
19. Sybilski D (1993) Non-Newtonian viscosity of polymer-
modified bitumens. Mater Struct 26(1):15–23
20. Sybilski D (1996) Zero-shear viscosity of bituminous binder
and its relation to bituminous mixture’s rutting resistance.
Transp Res Rec 1535(1):15–21
21. Wang S, Ma Q, Li J (2012) Study and application progress
of high viscosity modified asphalt used in porous pavement.
Pet Asph 26(1):1–7
Materials and Structures


