Simplified probabilistic state concept characterization of sandy soils and application to...
15
Simplified probabilistic state concept characterization of sandy soils and application to liquefaction resistance assessment Brendon A. Bradley n , Misko Cubrinovski Department of Civil and Natural Resources Engineering, University of Canterbury, Private Bag 4800, Christchurch, New Zealand article info Article history: Received 17 February 2012 Received in revised form 21 December 2012 Accepted 5 February 2013 Available online 5 March 2013 abstract Probabilistic relationships are developed for the simplified characterization of a sandy soil’s state within the state concept framework. The relationships require knowledge of conventional geotechnical characterization parameters (i.e., median particle diameter, fines content and particle shape) and in situ field data (i.e., SPT N 1 values). The salient features of the proposed relationships are illustrated by comparing the reference and in situ states of Toyoura sand, obtained in laboratory tests, with those obtained from the simplified relationships. Sensitivity analyses are utilized to understand the uncertainties in the simplified relationships which have the most significant impact on common problems of flow liquefaction and cyclic mobility resistance of sandy soils. The presented results illustrate that uncertainty in the position of the steady-state line at zero confining stress is the most significant uncertainty in flow liquefaction assessment, followed by in situ void ratio, and slope of the steady-state line. Analyses using the simplified state concept relationships within an elastic-plastic constitutive model illustrate that the in situ relative density is the key uncertainty in cyclic liquefaction resistance. Finally, it is shown that the uncertainty in cyclic liquefaction resistance due to uncertainty in situ void ratio is largely consistent with that obtained from empirical predictions of cyclic liquefaction resistance. & 2013 Elsevier Ltd. All rights reserved. 1. Introduction The state concept provides a fundamental framework for the characterization of sandy soil behaviour, considering both density and confining stress, based on the location of a soil’s state relative to one or more reference lines [1–4]. Such reference lines include: the steady-state line (SS-line) representing the state of soil at the steady state of deformation [2]; the quasi-steady-state line (QSS-line) representing the state of soil at phase transformation [4,5]; the initial-dividing line (ID-line) delineating in situ states which will exhibit flow and non-flow deformation [4]; and the upper-reference line (UR-line) delineating states which exhibit flow deformation with zero residual strength. Several attempts have been made to incorporate the state concept, using one or more of the aforemen- tioned reference lines, into constitutive models for soils e.g., [6–8], as well as procedures for flow liquefaction assessment e.g., [9,10]. One of the practical barriers to the use of the state concept for soil characterization is the difficulty in the estimation of the relevant in situ and reference states, which are ideally obtained by a series of laboratory tests on high-quality undisturbed soil samples. This difficulty is further compounded by the knowledge that reference lines such as the SS-line vary significantly in both position and slope as a function of grain composition, fines content and particle shape, among others [10–16]. The aim of this manuscript is to develop empirical relation- ships between conventional geotechnical parameters which can be obtained from conventional testing procedures and the rele- vant state concept parameters which can be used in various liquefaction-related evaluations. The manuscript first builds upon the experimental data collated and several deterministic correla- tions developed by Cubrinovski and Ishihara [9,17,18], via the representation of empirical relationships in an explicit probabil- istic format. The developed relationships enable estimation of the (e–p 0 projection of the) SS-line, the UR-line, and the in situ stress- density state of a sandy soil. The salient features of the developed equations and their underlying empirical data are presented. Using the SS-line as a first-order approximation of the ID-line and QSS-lines, the implications of the developed correlation equations are then examined for flow liquefaction susceptibility and cyclic mobility resistance, respectively. 2. Simplified state concept relationships A rigorous analysis of the seismic response of soil deposits can be obtained within the state concept framework using Contents lists available at SciVerse ScienceDirect journal homepage: www.elsevier.com/locate/soildyn Soil Dynamics and Earthquake Engineering 0267-7261/$ - see front matter & 2013 Elsevier Ltd. All rights reserved. http://dx.doi.org/10.1016/j.soildyn.2013.02.005 n Corresponding author. Tel þ64 3 364 2987x7395. E-mail address: [email protected] (B.A. Bradley). Soil Dynamics and Earthquake Engineering 48 (2013) 104–118
Transcript of Simplified probabilistic state concept characterization of sandy soils and application to...

Soil Dynamics and Earthquake Engineering 48 (2013) 104–118
Contents lists available at SciVerse ScienceDirect
Soil Dynamics and Earthquake Engineering
0267-72
http://d
n Corr
E-m
journal homepage: www.elsevier.com/locate/soildyn
Simplified probabilistic state concept characterization of sandy soilsand application to liquefaction resistance assessment
Brendon A. Bradley n, Misko Cubrinovski
Department of Civil and Natural Resources Engineering, University of Canterbury, Private Bag 4800, Christchurch, New Zealand
a r t i c l e i n f o
Article history:
Received 17 February 2012
Received in revised form
21 December 2012
Accepted 5 February 2013Available online 5 March 2013
61/$ - see front matter & 2013 Elsevier Ltd. A
x.doi.org/10.1016/j.soildyn.2013.02.005
esponding author. Tel þ64 3 364 2987x7395
ail address: [email protected]
a b s t r a c t
Probabilistic relationships are developed for the simplified characterization of a sandy soil’s state
within the state concept framework. The relationships require knowledge of conventional geotechnical
characterization parameters (i.e., median particle diameter, fines content and particle shape) and in situ
field data (i.e., SPT N1 values). The salient features of the proposed relationships are illustrated by
comparing the reference and in situ states of Toyoura sand, obtained in laboratory tests, with those
obtained from the simplified relationships. Sensitivity analyses are utilized to understand the
uncertainties in the simplified relationships which have the most significant impact on common
problems of flow liquefaction and cyclic mobility resistance of sandy soils. The presented results
illustrate that uncertainty in the position of the steady-state line at zero confining stress is the most
significant uncertainty in flow liquefaction assessment, followed by in situ void ratio, and slope of the
steady-state line. Analyses using the simplified state concept relationships within an elastic-plastic
constitutive model illustrate that the in situ relative density is the key uncertainty in cyclic liquefaction
resistance. Finally, it is shown that the uncertainty in cyclic liquefaction resistance due to uncertainty in
situ void ratio is largely consistent with that obtained from empirical predictions of cyclic liquefaction
resistance.
& 2013 Elsevier Ltd. All rights reserved.
1. Introduction
The state concept provides a fundamental framework for thecharacterization of sandy soil behaviour, considering both densityand confining stress, based on the location of a soil’s state relative toone or more reference lines [1–4]. Such reference lines include: thesteady-state line (SS-line) representing the state of soil at the steadystate of deformation [2]; the quasi-steady-state line (QSS-line)representing the state of soil at phase transformation [4,5]; theinitial-dividing line (ID-line) delineating in situ states which willexhibit flow and non-flow deformation [4]; and the upper-referenceline (UR-line) delineating states which exhibit flow deformationwith zero residual strength. Several attempts have been made toincorporate the state concept, using one or more of the aforemen-tioned reference lines, into constitutive models for soils e.g., [6–8], aswell as procedures for flow liquefaction assessment e.g., [9,10].
One of the practical barriers to the use of the state concept forsoil characterization is the difficulty in the estimation of therelevant in situ and reference states, which are ideally obtainedby a series of laboratory tests on high-quality undisturbed soilsamples. This difficulty is further compounded by the knowledge
ll rights reserved.
.
z (B.A. Bradley).
that reference lines such as the SS-line vary significantly in bothposition and slope as a function of grain composition, finescontent and particle shape, among others [10–16].
The aim of this manuscript is to develop empirical relation-ships between conventional geotechnical parameters which canbe obtained from conventional testing procedures and the rele-vant state concept parameters which can be used in variousliquefaction-related evaluations. The manuscript first builds uponthe experimental data collated and several deterministic correla-tions developed by Cubrinovski and Ishihara [9,17,18], via therepresentation of empirical relationships in an explicit probabil-istic format. The developed relationships enable estimation of the(e–p0 projection of the) SS-line, the UR-line, and the in situ stress-density state of a sandy soil. The salient features of the developedequations and their underlying empirical data are presented.Using the SS-line as a first-order approximation of the ID-lineand QSS-lines, the implications of the developed correlationequations are then examined for flow liquefaction susceptibilityand cyclic mobility resistance, respectively.
2. Simplified state concept relationships
A rigorous analysis of the seismic response of soil depositscan be obtained within the state concept framework using
B.A Bradley, M. Cubrinovski / Soil Dynamics and Earthquake Engineering 48 (2013) 104–118 105
high-quality laboratory testing to determine the in situ state andrelevant reference lines for state concept characterization [6,7,19].However, obtaining such laboratory data requires significantresources and technical expertise and hence is only feasible in asmall number of high importance projects. Even in the absence ofhigh-quality laboratory data, assessment of the seismic response ofsoil deposits can still benefit greatly from the use of advancedmethods of analysis and interpretation utilizing state conceptparameters obtained from conventional geotechnical information.However, ultimately the specification of soil state based on con-ventional geotechnical parameters will entail uncertainty whichshould be adequately considered in informing subsequent engi-neering judgments. For example, Kramer [20] noted that even thedetermination of the SS-line based on laboratory testing of undis-turbed samples entails significant uncertainty, and consequentlyexamined its importance on the reliability of the steady-stateliquefaction procedure proposed by Poulos et al. [10]. Hence, inthe presented results to follow, specific attention is given to thecharacterization of uncertainties. The proposed relationships arecollectively applicable for sandy soils with fines content less than30%, however each individual relationship may be applicable for awider range of soil characteristics.
2.1. Maximum and minimum void ratio, emax and emin
As elaborated upon by Cubrinovski and Ishihara [18] the ‘‘voidratio range’’ index parameter, (emax�emin), representing thedifference between maximum and minimum void ratios (emax
and emin, respectively) of a particular soil, has several advantagesover conventional geotechnical parameters such as median par-ticle diameter, D50, and fines content, Fc. This is because(emax�emin) is a material parameter indicative of the overallgrain-size composition and particle characteristics of a givensandy soil [18]. As such, (emax�emin) provides a better correlationwith in situ and reference state parameters (subsequentlyaddressed) than relative density, Dr, or fines content, Fc. Hence,before presenting correlations between in situ and reference stateconcept parameters as a function of (emax�emin), it is firstnecessary to determine emax and emin based on conventionalgeotechnical parameters.
In order to develop an empirical prediction of emax and emin use ismade of the data compiled of over 300 native sandy soils byCubrinovski and Ishihara [18]. It should be noted that the emax andemin values of the compiled data are based on test methodsstipulated in Japanese soil testing standards [21]. Cubrinovski andIshihara illustrated that there is a correlation of emax with D50 and
10-1 1000.5
1
1.5
2
2.5
Median particle diameter, D50 (mm)
Max
imum
voi
d ra
tio, e
max
Clean SandsSands with finesSands with claysSilty Soils
Toyoura Sand
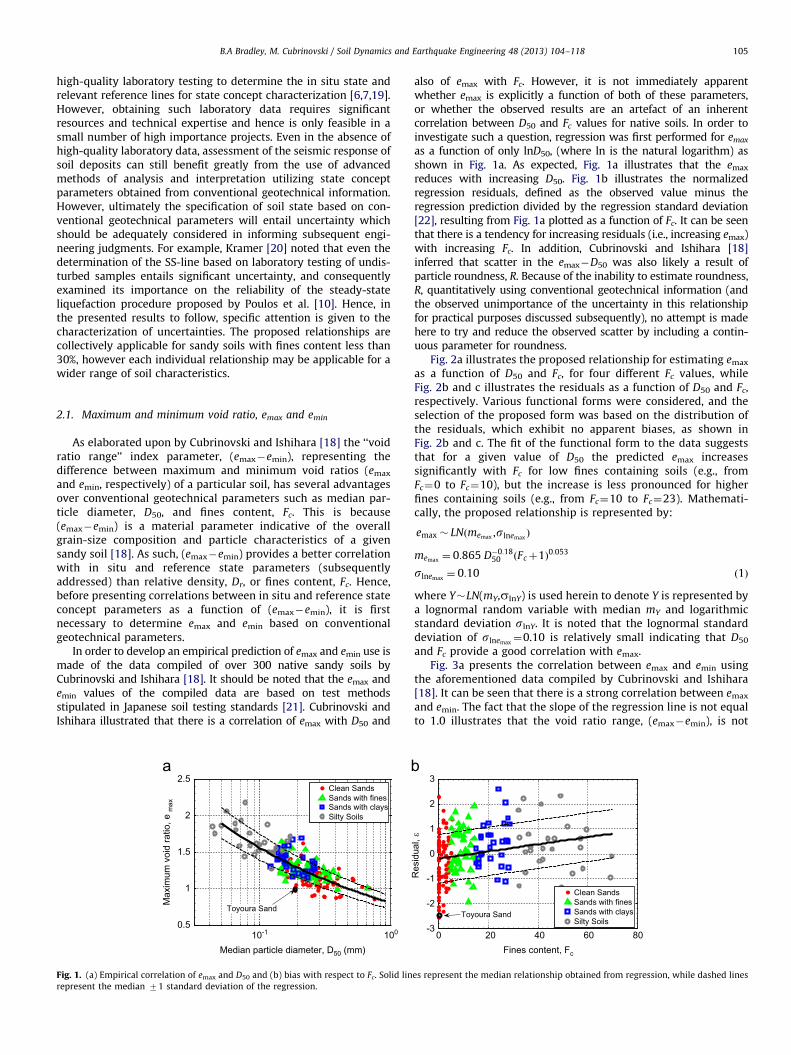
Fig. 1. (a) Empirical correlation of emax and D50 and (b) bias with respect to Fc. Solid lin
represent the median 71 standard deviation of the regression.
also of emax with Fc. However, it is not immediately apparentwhether emax is explicitly a function of both of these parameters,or whether the observed results are an artefact of an inherentcorrelation between D50 and Fc values for native soils. In order toinvestigate such a question, regression was first performed for emax
as a function of only lnD50, (where ln is the natural logarithm) asshown in Fig. 1a. As expected, Fig. 1a illustrates that the emax
reduces with increasing D50. Fig. 1b illustrates the normalizedregression residuals, defined as the observed value minus theregression prediction divided by the regression standard deviation[22], resulting from Fig. 1a plotted as a function of Fc. It can be seenthat there is a tendency for increasing residuals (i.e., increasing emax)with increasing Fc. In addition, Cubrinovski and Ishihara [18]inferred that scatter in the emax�D50 was also likely a result ofparticle roundness, R. Because of the inability to estimate roundness,R, quantitatively using conventional geotechnical information (andthe observed unimportance of the uncertainty in this relationshipfor practical purposes discussed subsequently), no attempt is madehere to try and reduce the observed scatter by including a contin-uous parameter for roundness.
Fig. 2a illustrates the proposed relationship for estimating emax
as a function of D50 and Fc, for four different Fc values, whileFig. 2b and c illustrates the residuals as a function of D50 and Fc,respectively. Various functional forms were considered, and theselection of the proposed form was based on the distribution ofthe residuals, which exhibit no apparent biases, as shown inFig. 2b and c. The fit of the functional form to the data suggeststhat for a given value of D50 the predicted emax increasessignificantly with Fc for low fines containing soils (e.g., fromFc¼0 to Fc¼10), but the increase is less pronounced for higherfines containing soils (e.g., from Fc¼10 to Fc¼23). Mathemati-cally, the proposed relationship is represented by:
emax � LNðmemax ,slnemaxÞ
memax ¼ 0:865 D�0:1850 ðFcþ1Þ0:053
slnemax¼ 0:10 ð1Þ
where Y�LN(mY,slnY) is used herein to denote Y is represented bya lognormal random variable with median mY and logarithmicstandard deviation slnY. It is noted that the lognormal standarddeviation of slnemax
¼0.10 is relatively small indicating that D50
and Fc provide a good correlation with emax.Fig. 3a presents the correlation between emax and emin using
the aforementioned data compiled by Cubrinovski and Ishihara[18]. It can be seen that there is a strong correlation between emax
and emin. The fact that the slope of the regression line is not equalto 1.0 illustrates that the void ratio range, (emax�emin), is not
0 20 40 60 80-3
-2
-1
0
1
2
3
Fines content, Fc
Res
idua
l, ε
Clean SandsSands with finesSands with claysSilty Soils
Toyoura Sand
es represent the median relationship obtained from regression, while dashed lines

10-1 1000.5
1
1.5
2
2.5
Median particle diameter, D50 (mm)
Max
imum
voi
d ra
tio, e
max
Clean SandsSands with finesSands with claysSilty Soils
Fc = 50
Fc = 23
Fc = 10
Fc = 0
Toyoura Sand
emax=0.865(D50)-0.18(Fc+1)0.053
0 0.2 0.4 0.6 0.8 1-4
-3
-2
-1
0
1
2
3
4
Mean particle dia, D50 (cm)
Res
idua
l, ε
0 20 40 60 80-4
-3
-2
-1
0
1
2
3
4
Fines content, FC (%)
Res
idua
l, ε
Toyoura Sand Toyoura Sand
Fig. 2. (a) Empirical correlation of emax as a function of D50 and Fc; regression residuals as a function of (b) D50; and (c) Fc.
0.5 1 1.5 2 2.50.4
0.6
0.8
1
1.2
1.4
Min
imum
voi
d ra
tio, e
min
Maximum void ratio, e max
Clean SandsSands with finesSands with claysSilty Soils
Toyoura Sand
0 20 40 60 80-4
-2
0
2
4
Fines content, Fc (%)
Res
idua
l, ε
Clean SandsSands with finesSands with claysSilty Soils
Toyoura Sand
Fig. 3. (a) Empirical correlation of emin, and mean particle diameter, D50 and (b) bias with respect to fines content, Fc. Solid lines represent the median relationship
obtained from regression, while dashed lines represent the median71 standard deviation of the regression.
B.A Bradley, M. Cubrinovski / Soil Dynamics and Earthquake Engineering 48 (2013) 104–118106
constant and generally increases with increasing emax. Fig. 3billustrates the residuals resulting from the regression in Fig. 3a, inwhich it can be seen that for Fco30% there is a strong depen-dency of the residuals with Fc, but no obvious dependence forFc430% (partly due to a large scatter for such data). Conse-quently, the proposed relationship for estimating emin as afunction of both emax and Fc, is presented in Fig. 4a. Similar tothe developed relationship for emax, the functional form of theproposed relationship for emin was based on examination of biasin the residuals as a function of emax and Fc which are presented inFig. 3b and c, respectively. The mathematical form of the
proposed relationship is given by:
emin �Nðmemin,semin
Þ
memin¼ð0:59þ0:007FcÞemaxþð0:035�0:0133FcÞ if Fc r30
0:76emax�0:33 if Fc 430
(
semin¼
0:030 if Fc r30
0:073 if Fc 430
(ð2Þ
where Y�N(mY,sY) is used to indicate that Y is a normal randomvariable with mean mY and standard deviation sY. Based on the

0.5 1 1.5 2 2.50.4
0.6
0.8
1
1.2
1.4
Min
imum
voi
d ra
tio, e
min
Maximum void ratio, e max
Clean SandsSands with finesSands with claysSilty Soils
Toyoura Sand
emin=(0.59+0.007FC)emax+(0.035-0.0133FC)
Fc = 0
Fc = 10Fc = 23
emin=0.76emax-0.33 (FC>30)
0.5 1 1.5 2 2.5-4
-3
-2
-1
0
1
2
3
4
Maximum void ratio, e max
Res
idua
l, ε
0 20 40 60 80-4
-3
-2
-1
0
1
2
3
4
Fines content, FC (%)
Res
idua
l, ε
Toyoura Sand Toyoura Sand
Fig. 4. (a) Empirical correlation of emin as a function of emax and Fc; regression residuals as a function of (b) D50; and (c) Fc.
10-1 1000.3
0.4
0.5
0.6
0.7
0.8
Median particle diameter, D50 (mm)
Voi
d ra
tio ra
nge,
(em
ax-e
min
)
Clean SandsSands with finesSands with claysSilty Soils Toyoura Sand
Fc = 0
Fc = 10
Fc = 23
Fc = 50
Fig. 5. Empirical prediction of void ratio range, (emax�emin), based on conven-
tional geotechnical parameters D50 and Fc.
Table 1Comparison of simulation and empirical prediction of cyclic resistance ratio, CRR,
for NC¼15 cycles.
N1 Simulated Empirical (Idriss and Boulanger [30])
Median Log. stdev. Median Logn. stdev.
6 0.104 0.15 0.105 0.13
12 0.168 0.26 0.151 0.13
Table 2Comparison of simulation and empirical prediction of cyclic resistance ratio, CRR,
for NC¼15 cycles considering uncertainty in N1 (rlnN1¼ 0:2).
N1 Simulated Empirical (Idriss and Boulanger[30])
Median Log. stdev. Median Logn. stdev.
6 0.104 0.18 0.105 0.15
12 0.173 0.27 0.151 0.17
B.A Bradley, M. Cubrinovski / Soil Dynamics and Earthquake Engineering 48 (2013) 104–118 107
aforementioned observations regarding Fig. 3b it was determinedthat for Fc430% the estimated emin is dependent only on thevalue of emax. It can be seen that the uncertainty in the regressionfor sandy soils is very small (i.e., semin
¼ 0:03 for Fco30%), butrelatively larger for soils with Fc430% (i.e., semin
¼ 0:073). It is alsonoteworthy that the functional form given by Eq. (2) leads toregression lines for clean sands, sands with fines, sands with clays,and silty soils (as shown in Fig. 4a) that are consistent with thoseobtained from Cubrinovski and Ishihara ([18], Fig. 12e) based ondiscrete datasets.
Based on the empirical relationships given by Eqs. (1) and (2), itis possible to estimate the void ratio range, (emax�emin), as afunction of D50 and Fc. Fig. 5 illustrates the median values of such aprediction. It can be seen that (emax�emin) increases with decreas-ing D50 and increasing Fc, and that the values depicted in Fig. 5 forfour descriptive classifications are consistent with typical valuessuggested by Cubrinovski and Ishihara ([18], Table 2.)

B.A Bradley, M. Cubrinovski / Soil Dynamics and Earthquake Engineering 48 (2013) 104–118108
2.2. Position and slope of the steady-state (SS) and upper-reference
(UR) lines
It is generally accepted that the e–p0 projection of the SS-line iswell approximated by a linear relationship between e and logp0
over the range of confining pressures of common interest (e.g.,10op0o400 kPa). If the void ratio of the SS-line corresponding top0 ¼10 kPa is used as the intercept, and the slope is denoted by l,then mathematically the SS-line can be expressed as:
eSSL ¼ ðe10þlÞ�llog p0 ð10op0o400Þ ð3Þ
where log is the base 10 logarithm. Cubrinovski and Ishihara [9]noted that for small confining stresses (i.e., p0o10 kPa) experi-mental results of the SS-line deviate from that given by Eq. (3).Consequently they suggest that a linear relationship between thevoid ratio of the SS-line for p0 ¼10 kPa and p0 ¼0 kPa (referred toherein as e10 and e0, respectively) is more appropriate. Based onexperimental data targeting low confining stresses they observeda strong correlation between e10 and e0 which can be representedby:
e10 ¼ e0�0:01 ð4Þ
Relative to other relationships considered here, the uncer-tainty in Eq. (4) is negligible [9] and therefore is not explicitlypropagated further. Hence, by combining Eqs. (3) and (4),the SS-line can be mathematically described over the range
0 0.2 0.4-50
0
50
100
Void ratio r
Rel
ativ
e de
nsity
at p
'=0,
Dr0
Dr0 = -42+150(emax-emin)
Toyoura sand
Outlying data neglected in an
0 20 40 60 80-4
-2
0
2
4
Fines content, Fc (%)
Res
idua
l, ε
0.2 0.4-4
-2
0
2
4
Void ratio
Res
idua
l, ε
Toyoura sand
Outlying data neglectedin analysis
Fig. 6. (a) Empirical correlation of Dr0 as a function of both emax�emin; regression resid
lines represent the median relationship obtained from regression, while dashed lines r
0op0o400 kPa as:
eSSL ¼e0�0:001p0 p0r10 kPa
ðe0�0:01Þþlð1�log p0Þ 10op0o400 kPa
(ð5Þ
It can be seen that the determination of the SS-line as given byEq. (5) requires the determination of e0 and l, which is the topicof the following paragraphs.
In developing a probabilistic correlation for estimating e0, useis made of data from 52 sandy soils compiled by Cubrinovskiand Ishihara [9]. Here the same approach of Cubrinovski andIshihara [9] is adopted by performing regression on a transformedversion of e0, referred to as the relative density at p0 ¼0, Dr0, anddefined as:
Dr0 ¼ðemax�e0Þ
ðemax�eminÞ� 100 ð%Þ ð6Þ
Fig. 6a illustrates the regression of Dr0 as a function of voidratio range, (emax�emin). The mathematical form of the regressionmodel is given by:
Dr0 �NðmDr0,sDr0Þ
mDr0¼�42þ150ðemax�eminÞ
sDr0¼ 10:4 ð7Þ
It can be seen in Fig. 6a that there is a strong correlation of Dr0
with (emax�emin). In addition to the mean of the regressionrelationship shown in Fig. 6a (which is similar to that obtained
0.6 0.8 1ange, (emax-emin)
Clean SandsSands with finesSands with claysSilty Soilsalysis
0.6 0.8range, (emax-emin)
(R-SR) (A-SA)-4
-2
0
2
4
Res
idua
l, ε
Particle shape
μ-σ
μ+σ
μ
Toyoura sandToyoura sand
uals as a function of (b) Fc; (c) emax�emin; and (d) particle shape. In Fig. 6(a) solid
epresent the median71 standard deviation of the regression.

B.A Bradley, M. Cubrinovski / Soil Dynamics and Earthquake Engineering 48 (2013) 104–118 109
by Cubrinovski and Ishihara [9]), Fig. 6b–d explicitly examine theresiduals of the regression as a function of Fc, (emax�emin), andparticle shape. It can be seen that there are no obvious trends as afunction of these parameters, indicating both the use of anadequate functional form (in the case of Fig. 6c), and also thecapability for (emax�emin) to account for the overall materialproperties of soils given previous experimental evidence that theposition of the SS-line is affected by grain size distribution andfines content [10–12,16].
It is noted here that in addition to e0 being used in defining theposition of the SS-line, it also defines the upper-reference line(UR-line) for the confining stresses of interest here (i.e., eUR¼e0
for p0o400 kPa) which, among other things, is employed in thedefinition of the state index, Is [3,23], and will be utilizedsubsequently.
Using the same data as for the empirical prediction of Dr0 above,Fig. 7a illustrates a probabilistic version of the deterministiccorrelation developed by Cubrinovski and Ishihara [9] for the slopeof the SS-line, l. Based on previous experimental evidence as to theimportance of particle shape on l [10,14,16,20], a discrete classi-fication of particle shape as: (i) rounded (including sub-rounded);or (ii) angular (including sub-angular); is adopted in the proposed
0.2 0.40
0.05
0.1
0.15
0.2
Void ratio ra
Slo
pe o
f ste
ady
stat
e lin
e, λ
Toyoura Sand
Angularλa = -0.006+0.21(em
0 20 40 60 80-3
-2
-1
0
1
2
3
Fines content, Fc (%)
Res
idua
l, ε
Toyoura Sand
Fig. 7. (a) Empirical correlation of l as a function of emax�emin and particle shape; reg
represent the median relationship obtained from regression, while dashed lines repres
convention of previous figures regarding soil type.
equation [9]. The mathematical expressions for the regressionsshown in Fig. 7a are given by:
l�Nðml,slÞ
ml ¼0:006þ0:086ðemax�eminÞ Rounded
�0:006þ0:21ðemax�eminÞ Angular
(
sl ¼0:014 Rounded
0:027 Angular
(ð8Þ
As can be seen in Fig. 7a, the slope of the SS-line increases withincreasing void ratio range, and is generally larger for soilscomprised of angular particles. Fig. 7a and Eq. (8) also illustratethat the standard deviation in the regression for soils withangular particles is approximately twice that of soils withrounded particles, although the aforementioned higher l valuesfor angular soils mean that the coefficient of variation is similarfor both particle shapes. Fig. 7b and c illustrates the residualsfrom the regression analysis in Fig. 7a as a function of Fc and(emax�emin), in which it can be seen that there are no apparenttrends in the residuals as a function of either parameter.
0.6 0.8nge, (emax-emin)
Roundedλr = 0.006+0.086(emax-emin)
ax-emin)
0.2 0.4 0.6 0.8 1-3
-2
-1
0
1
2
3
Void ratio range, (emax-emin)
Res
idua
l, ε
Toyoura Sand
ression residuals as a function of (b) Fc; and (c) emax�emin. In Fig. 7(a) solid lines
ent the median71 standard deviation of the regression. Data symbols follow the

B.A Bradley, M. Cubrinovski / Soil Dynamics and Earthquake Engineering 48 (2013) 104–118110
2.3. In situ state of soil, (p0,einsitu)
The previously developed empirical equations allow estimationof the maximum and minimum void ratios, emax and emin (based onthe JGS procedures [21]), as well as the SS- and UR-lines. In order toassess the state of a particular soil, with respect to these variousreference lines, an estimate is needed of the in situ void ratio andeffective confining stress of the soil. Because the effective confiningstress at a particular depth can be estimated with high accuracyrelative to the other uncertainties considered herein, uncertainty inits estimated value is not considered. Given the complexityassociated with determining void ratio in situ, use is made ofempirical correlations between void ratio (or a related parametersuch as relative density, Dr) and in situ field data. Here attention
0.2 0.40
50
100
150
200
Void ratio rang
CD
= N
1/D
2 r
0 5 10 15 20-4
-2
0
2
4
Fines content, Fc (%)
Res
idua
l,ε
0.1 1.0 10-4
-2
0
2
4
Median particle dia, D50 (cm)
Res
idua
l,ε
Fig. 8. (a) Empirical correlation of CD as a function of emax�emin; and (b) regression r
median relationship obtained from regression, while dashed lines represent the med
Fig. 8(b) to avoid congestion.
is limited to the estimation of in situ void ratio, einsitu, from SPTdata, however it should be noted that empirical correlations forestimating einsitu are also possible using CPT data [15].
Based on 61 different soils, for which high-quality undisturbedlaboratory samples and in situ SPT data was available, Cubri-novski and Ishihara [17] developed an empirical correlationbetween (emax�emin) and the parameter CD ¼N1=D2
r , defined asthe ratio of the normalized (to 1 atm) SPT blowcount, N1, and thesquare of relative density, Dr (expressed as a fraction). The datacompiled by Cubrinovski and Ishihara [17] are for young alluvialsoils, and therefore the potential effects of ageing on CD e.g., [24]are not accounted for in the results to follow.
Using the same data, Fig. 8a illustrates a probabilistic version ofthe empirical correlation developed by Cubrinovski and Ishihara [17].
0.6 0.8 1e, (emax-emin)
CleanSandsSandsWithFinesSiltySandsGravellySandsGravels
CD = 8.26(emax-emin)-1.75
0 20 40 60 80 100-4
-2
0
2
4
Gravel content, PG (%)
Res
idua
l,ε
0 0.2 0.4 0.6 0.8 1-4
-2
0
2
4
Void ratio range, (emax-emin)
Res
idua
l,ε
esiduals as a function of various parameters. In Fig. 8(a) solid lines represent the
ian71 standard deviation of the regression. Regression lines are not shown in

B.A Bradley, M. Cubrinovski / Soil Dynamics and Earthquake Engineering 48 (2013) 104–118 111
It is noted that the proposed relationship is distinguished into twoseparate parts for gravels and for sandy soils. The reason for suchdistinction is due to both the different nature by which the N1 valuesare determined for gravels and sandy soils, and also the differentmagnitude of uncertainty in the data about the regression line.However, given its apparent appropriateness, the same equation forthe median estimate of CD is utilized for both gravels and sandy soils.Mathematically the relationship in Fig. 8a is given by:
CD � LNðmCDslnCDÞ
mCD¼ 8:26ðemax�eminÞ
�1:75
sln CD¼
0:60 if ðemax�eminÞ r0:335 and PG450%
0:38 otherwise
(ð9Þ
As previously discussed, it can be seen that the standarddeviation of the correlation for gravels is notably larger than thatfor sandy soils. It should also be explicitly noted that as there is nodata in Fig. 8 for sandy soils with (emax�emin)o0.37 the use ofEq. (9) with slnCD
¼0.38 for such soils is based on extrapolation.Fig. 8b illustrates the residuals of the data in Fig. 8a as a
function of Fc, D50, (emax�emin) and gravel content, PG, for whichno trends in the residuals are apparent.
2 10 30 50 100 2000.6
0.8
1
1.2
1.4
Mean confining stress, p' (kPa)
Voi
d ra
tio, e
1. emax (Eq. 1)
2. emin (Eq. 2)
3. e0 (Eq. 7)5. λ (Eq. 8)
6. (p',e)insitu (Eq. 9)
UR-line (Eq. 7)
SS-line (Eq. 5)4. e10 (Eq. 4)
Fig. 9. Schematic illustration of the computation of reference state and in situ
state parameters using the proposed simplified methodology. Numbers are used
to illustrate the sequence of the computation, followed by the parameter which is
computed, and the equation utilized. Steps 1–3 enable computation of the
UR_line; and steps 1–5 the SS-line. Step 6 involves computation of the insitu state.
0 100 200 300 400
0.6
0.8
1
1.2
Mean effective stress, p' (kPa)
Voi
d R
atio
, e
Simplified
emaxUR-line
SS-lineInsitustate
SS-line range
emin
Fig. 10. Computation of state concept parameters and in situ state of Toyoura sand usin
properties.
Unlike the previous correlations developed, for which theuncertainty in the developed regression equation is significantlylarger than the uncertainty in the values of the data themselves,there exists significant uncertainty in the estimation of SPT N1
values due to inherent variability in SPT testing procedures.In order to not ‘double-count’ uncertainties in certain applica-tions, it is useful to have an estimate of the uncertainty in theproposed correlation conditional on known (i.e., ‘exact’) values ofthe SPT N1 value. Technical details on the consideration of N1 (andDr) uncertainty are given in Appendix A, with the result being thatthe standard deviation for sandy soils (i.e., (emax�emin)40.335)in Eq. (9) conditional on N1 and Dr is:
slnCD9N1 ,Dr¼ 0:31 ð10Þ
Unless otherwise noted, use is made of the uncertainty in theCD relationship given by Eq. (10) rather than Eq. (9). Thus, forpractical implementation: (i) Eqs. (9) and (10) should be used todetermine CD based on (emax�emin) and PG; then the relativedensity obtained from Dr ¼
ffiffiffiffiffiffiffiffiffiffiffiffiffiffiCD=N1
p; and then finally einsitu from
Dr. It should also be emphasised that Dr is utilized here merely asan intermediate variable (i.e., to obtain einsitu from N1 and(emax�emin)), and therefore the appropriateness, in a generalcontext, of Dr for describing the state of soils with up to Fc¼30%does not hinder the above methodology.
2.4. Summary of simplified probabilistic state concept estimation
procedure
Fig. 9 provides a schematic illustration of the necessary stepsrequired to estimate the relevant reference lines and in situ stateof a soil. It can be seen that steps 1–3 are necessary to enablecomputation of the UR-line, while steps 1–5 are required tocompute the SS-line. Step 6 involves computation of the in situstate, which requires steps 1 and 2 as a prerequisite.
3. Sensitivity and uncertainty of in situ state
3.1. Comparison of with ‘exact’ properties of Toyoura sand
The assessment of in situ state is fundamental to engineeringassessment of soil behaviour under both static and transientexternal loadings. Previous research has illustrated that para-meters such as the state index, Is [3,4], and state parameter, c[16], among others, exhibit a relatively strong correlation with thebehaviour (e.g., strength, stiffness and stress–strain response)
0 100 200 300 400
0.6
0.8
1
1.2
Mean effective stress, p' (kPa)
Voi
d R
atio
, e
'Exact' Toyoura Sandp'=100kPa
N1=12
UR-lineemax
SS-line
emin
Insitustate
g the simplified methodology; and (b) comparison with known Toyoura sand state

B.A Bradley, M. Cubrinovski / Soil Dynamics and Earthquake Engineering 48 (2013) 104–118112
of soils in drained and undrained monotonic and cyclic loading.For example, Verdugo [3] illustrated that soils with similar valuesof Is exhibit similar undrained response and pore pressure gen-eration, while Cubrinovski and Ishihara [19] illustrated that soilswith similar Is values exhibited similar stress–strain character-istics in monotonic drained loading.
Fig. 10 provides a comparison of the determination of in situstate and reference lines for Toyoura sand (D50¼0.19 mm, Fc¼0;sub-rounded particle shape) using the proposed simplified meth-odology (Fig. 10a) compared with ‘exact’ reference lines obtainedfrom laboratory testing (Fig. 10b). For the ‘exact’ results presentedin Fig. 10b the in situ void ratio is still estimated using Eq. (9) (i.e.,based on SPT results, rather than direct estimation of in situ voidratio which is prohibitively costly for many instances). In Fig. 10a,the estimated median values of emax and emin are shown, as wellas the distribution shown at the right of the figure. The medianvalues of the estimated UR-line and SS-line are also shown as wellas the 16th–84th percentile range of the SS-line. Finally, theestimated median and distribution of in situ void ratio for thecase of p0 ¼100 kPa and N1¼12 are also shown. When viewing thedepicted distributions it should be recalled that the differentparameters are correlated, and thus the distributions in Fig. 10ashould be viewed with respect to void ratio only and not withrespect to other reference lines etc. Upon comparison of Fig. 10aand b, it can be first seen that the simplified estimationof reference lines and in situ state yield higher void ratiovalues than the exact results, which is a direct consequence of an
0 100 200 300 400
0.6
0.8
1
1.2
Mean effective stress, p' (kPa)
Voi
d R
atio
, e
Simplified: emax, emin known
UR-lineemax
Insitustate
SS-line rangeSS-line
emin
Fig. 12. (a) Computation of state concept parameters and in situ state; and (b) pr
-2 0 2 4 6 80
0.1
0.2
0.3
0.4
0.5
State index, Is
Pro
babi
lity
dens
ity, p
df
Toyoura Sandp'=100kPaN1=12
'Exact'μ = 2.78σ = 0.74
Simplifiedμ = 3.04σ = 1.36
Fig. 11. Probability density functions (pdf) of in situ state index, Is, for Toyoura
sand based on the exact reference lines and simplified methodology.
over-prediction of emax (as can be seen in Fig. 2). It is also notedthat the uncertainty in the position (i.e., vertical location) of theSS-line is significant relative to the magnitude of its slope, l.
As noted above, the void ratios of in situ state and referencelines in Fig. 10a were larger than those shown in Fig. 10b.However, it should be noted that the distribution of in siturelative density, Dr, in Fig. 10a and b will be identical as a resultof both using Eq. (9). In order to include the effects of confiningstress, which is not considered in Dr, subsequent comparisonsmake use of the proximity (in e–p0 space) of the SS-line and theQSS-lines [4] to approximate the state index, Is [3,4], using theSS-line in place of the QSS-line, specifically:
Is ¼eU�einsitu
eU�eQ�
eU�einsitu
eU�eSð11Þ
where eU, eQ, eS, and einsitu represent the void ratios of the UR-line,QSS-line, SS-line and in situ state at the in situ mean confiningstress, p0insitu. Herein, unless otherwise noted, the approximateform of the state index is implied.
Fig. 11 illustrates the distribution of Is corresponding to thetwo cases presented in Fig. 10a and b, obtained from Monte Carlosimulation, but found to be well represented by a normaldistribution. It can be seen that the simplified estimate of Is issimilar to the ‘exact’ value with medians’ of 3.04 and 2.78,respectively. However, it can be seen that as a result of uncer-tainties in the estimation of the various parameters (namely emax,emin, e0, and l), the standard deviation of 1.36 in Is using thesimplified method is larger than the standard deviation of 0.74with known reference lines.
Fig. 12a illustrates the computation of reference lines andin situ state in the case in which emax and emin are known. Theexamination of such a situation is useful as direct determinationof these parameters via standard testing procedures is moretrivial than the numerous tests required for determine theUR- and SS-lines. In the case of Toyoura sand, in particular, itcan be seen that the simplified estimation of the position of theSS-line is at slightly smaller relative densities than the exactposition, as can be seen from Fig. 6. It can also be seen in Fig. 7,and by comparing Fig. 12a and Fig. 10b, that the slope of thesteady-state line is over-estimated. Similar to Fig. 11, Fig. 12billustrates the distribution of Is in the case of known emax and emin.It is immediately evident that, even with emax and emin known,there is little difference between the simplified estimate inFig. 12b and Fig. 11, with means Is values of 3.12 and 3.04, andstandard deviations of 1.38 and 1.36, respectively. The observa-tion, that the mean Is value is closer to the ‘exact’ value in the caseof unknown emax and emin (i.e., in the case of Fig. 11) than theknown case (i.e., Fig. 12b), is simply the result of subtractive
-2 0 2 4 6 80
0.1
0.2
0.3
0.4
0.5
State index, Is
Pro
babi
lity
dens
ity, p
df
ToyouraSandp'=100kPaN1=12
'Exact'μ = 2.78σ = 0.74
Simplifiedemax, emin known
μ = 3.12σ = 1.38
obability density functions of state index, Is, when emax and emin are known.

B.A Bradley, M. Cubrinovski / Soil Dynamics and Earthquake Engineering 48 (2013) 104–118 113
cancellation. The reason for the observed relative unimportanceof knowing emax and emin is that, as previously noted, the positionof the steady-state line (i.e., Dr0) and in situ void ratio (i.e., einsitu)are estimated in terms of relative densities and are thereforestrongly correlated with the values of emax and emin.
3.2. Sensitivity analysis of state parameters for estimation of in situ
state index
In light of the observed unimportance of knowing emax andemin for a specific combination of N1 and p0 in the previous section,a more comprehensive sensitivity analysis was conducted. In this(deterministic) sensitivity analysis the variation in in situ stateindex was computed using the mean correlation (or median in thecase of lognormal distributions) for all but one of the simplifiedrelationships, for which a fixed deviation (71 and 72 standarddeviations) of the mean correlation was used. Fig. 13 illustratesthe results of the sensitivity analysis using the conventionalparameters of Toyoura sand for N1¼6, 12, 18 (approximatelyDr¼42, 59, and 72%) and p0 ¼50 and 100 kPa. Fig. 13a illustratesthe specific notation used, with the parameter varied shown onthe vertical axis and the value of the measure of interest shownon the horizontal axis. For each (N1, p0) combination considered inFig. 13, the median value of Is computed using the ‘exact’ UR- andSS-lines is also shown for reference. It can be seen that in all sixcases considered the variation due to uncertainty in emin isthe smallest followed closely by emax. It can be seen that the
0 2 4 6 8 10
State index, Is
emax
emin
CD
Dr0
λ
N1=6;p'=50kPa
Exact Simplified Median Estimate
±1σ range±2σ range
0 2 4 6 8 10
N1=12;p'=50kPa
0 2 4 6 8 10
N1=18;p'=50kPa
emax
emin
CD
Dr0
λ
emax
emin
CD
Dr0
λ
e
e
e
e
e
e
State index, Is
State index, Is
Fig. 13. Sensitivity of in situ state index, Is , due to uncertainty in simplified relationsh
importance of uncertainty in the SS-line slope, l, increases withincreasing N1 and p0, being the most significant for N1¼18.Uncertainty in Dr0 is the most significant uncertainty for N1¼6but reduces slightly for N1¼12 and 18. The uncertainty in CD issignificant for all cases.
4. Flow liquefaction evaluation
Estimation of the potential of an in situ soil deposit to exhibitflow failure following liquefaction is an important problem owingto the consequences of such failures. While strictly speaking thedemarcation between contractive and dilative behaviour, andhence flow and non-flow conditions, is represented by theinitial-dividing line (ID-line) [4], the observed similarity betweenthe ID-line and e–p0 projection of the SS-line means that using theSS-line as a first-order approximation of the ID-line is consideredappropriate for preliminary assessment in most cases of concern[9] (and consequently herein the ID-line is taken equal to theSS-line). Because of an absence of sufficient empirical data, theuncertainty resulting from this first-order approximation is notquantified here. Furthermore, in this paper attention is restrictedto the assessment of flow susceptibility, and not assessment ofresidual shear strength, Sr.
In order to provide insight into flow susceptibility using theprevious analyses it is useful to note that based on the (approx-imate) definition of Is, given by Eq. (11), in situ deposits located
0 2 4 6 8 10
N1=6;p'=100kPa
0 2 4 6 8 10
N1=12;p'=100kPa
0 2 4 6 8 10
N1=18;p'=100kPa
max
min
CD
Dr0
λ
max
min
CD
Dr0
λ
max
min
CD
Dr0
λ
State index, Is
State index, Is
State index, Is
ips for various combinations of normalized SPT, N1, and mean effective stress, p0 .

1 2 3 4 5 6 7 8 9 100
0.2
0.4
0.6
0.8
1
Normalised SPT blowcount, N1
Pro
babi
lity
of fl
ow s
usce
ptib
ility
Flow with zeroresidual strength
p'i=50 kPa
p'i=100 kPa
p'i=200 kPa
Insitu mean pressure
Fig. 15. Probability of flow liquefaction susceptibility for Toyoura sand as a function
of N1 and p0 .
B.A Bradley, M. Cubrinovski / Soil Dynamics and Earthquake Engineering 48 (2013) 104–118114
‘above’ the ID-line, which are susceptible to flow under undrainedloading, will have Is values less than 1.0; while in situ depositslocated above the UR-line, which would exhibit flow with zerosteady-state shear strength, have Is values less than zero [9].Hence, in the case of an in situ deposit of Toyoura sand withN1¼12 and p0 ¼100 kPa, as depicted in Fig. 11, the probability thesoil is susceptible to flow is 6.7% and 0.8% based on the simplifiedmethod and ‘exact’ reference lines, respectively. Correspondingly,the probability the soil is susceptible to flow with zero residualstrength is 1.3% and 0.01% for the simplified method and ‘exact’reference lines, respectively. Hence, it can be seen that while theprobabilities of flow susceptibility are low for N1¼12 andp0 ¼100 kPa, the uncertainties introduced via the use of simplifiedstate concept relationships increase flow susceptibility probabil-ities in this case.
Fig. 14 illustrates the sensitivity of Is for Toyoura sand withN1¼3 and p0 ¼100 kPa. Unlike the results presented in Fig. 13 forN1¼6 and 12, it can be seen that, for this looser state, theuncertainty in in situ Is is dominated by uncertainty in the verticalposition of the SS-line due to uncertainty in the relationship forDr0 (i.e., Eq. (7) and Fig. 6). The uncertainties in the SS-line slope,l, and in situ relative density, introduced through CD, are ofsecondary importance, as is estimation of emax and emin. Hence,reducing the uncertainty in in situ state, quantified in terms of Is,primarily requires reducing the uncertainty in the vertical posi-tion of the SS-line through improved prediction of Dr0.
Fig. 15 illustrates the probabilities that an in situ deposit ofToyoura sand (i.e., D50¼0.19 mm, Fc¼0) has the potential for flow(Iso1) as a function of SPT N1 value. As expected, it can be seenthat the probabilities reduce with increasing N1, and are in therange of 60–80% for N1¼3 and 24–42% for N1¼6, with higherprobabilities corresponding to higher in situ effective stress, p0.Also shown in Fig. 15 is the probability the soil has the potentialfor flow with zero residual strength, which can be seen to havevalues of 32% and 7% for N1¼3 and 6, respectively.
Fig. 16 illustrates probabilities of flow susceptibility as afunction of fines content and median particle diameter. InFig. 16a, the value of D50¼0.19 mm used for each case showncorresponds to that of Toyoura sand. It can be seen in Fig. 16a thatfor a given N1 value, the probabilities increase monotonically withincreasing Fc. Fig. 16b illustrates that for a soil with zero fines,flow susceptibility probability also increases monotonically withdecreasing D50. For small N1 values it can be seen that the range ofprobabilities for a given N1 value is quite significant, beingbetween 40% and 72% for N1¼3, for example. It should be notedthat, as demonstrated by Fig. 5, both increasing Fc and decreas-ing D50 generally result in an increase in void ratio range,(emax�emin). With increasing (emax�emin), Fig. 6a illustrates thatthe position of the SS-line corresponds to higher relative
-2 -1 0 1 2 3
State index, Is
emax
emin
CD
Dr0
λ
Toyoura sandN1=3;p'=100kPa
Exact
±2σ range
Simplified Median Estimate
±1σ range
Fig. 14. Deterministic sensitivity analysis of state index, Is, for N1¼3, p0 ¼100 kPa.
densities. Hence, the results presented in Fig. 16 are consistentwith those discussed in Cubrinovski and Ishihara [9].
Fig. 16a and b serve to illustrate a key point that flow potentialis sensitive to soil gradation characteristics in addition to thatwhich can be explained via SPT N1 values alone (and presumablyother in situ test parameters, such as CPT qc1 values). If suchgradation characteristics also influence residual shear strength, Sr,there is potential for improvement in the quantification of Sr,which at present contains significant uncertainty, and is consid-ered solely as a function of N1 e.g., [25], or N1 and verticaleffective stress, s0v e.g., [26].
Finally it is noted that the results presented in Fig. 15 and Fig. 16,do not explicitly account for the potential for void redistribution,which has been inferred as an important mechanism in someinstances e.g., [27]. Void redistribution can however be consideredon a case-by-case basis by adjusting the value of einsitu obtained byEqs. (9) and (10) (with other parameters such as emin, emax, SS- andUR-lines obviously not requiring modification). Alternatively, iftime-domain analyses are performed with a constitutive model thatuses the void ratio as a current variable (e.g., the stress–density(S–D) model [7,19] discussed in the next section, among others),then void redistribution phenomena can be simulated explicitly.
5. Cyclic liquefaction resistance evaluation
In order to examine the application of the simplified probabil-istic state concept relationships for cyclic liquefaction resistanceevaluation, the elastic-plastic stress–density (S–D) model ofCubrinovski and Ishihara [7,19] is utilized. The S–D model usesthe state index, Is, as a current state concept variable as well as aplasticity formulation which incorporates continuous yielding andhypo-plasticity. The S–D model requires four types of relation-ships: (i) elastic; (ii) state index; (iii) stress–strain; and (iv) stress–dilatency. In the subsequent applications, direct use is made of theelastic, stress–strain and stress–dilatency parameters of Toyourasand [7], however robust methods for the simplified determinationof these three sets of parameters are presently being developed.For the state index relationship use is made of the simplifiedSS-line approximation as developed previously. However, forapplication with the S–D model, this simplified SS-line approxima-tion of Eq. (5) is modified for small confining stresses as shown inFig. 17. Specifically, the implementation of the QSS-line withinthe S-D model comprises specification of the void ratio of the

1 2 3 4 5 6 7 8 9 100
0.2
0.4
0.6
0.8
1
Normalised SPT blowcount, N1
Pro
babi
lity
of fl
ow s
usce
ptib
ility
Fc=0
Fc=5
Fc=10Fc=15
Fc=20
Fc=30
D50=0.19mm
1 2 3 4 5 6 7 8 9 100
0.2
0.4
0.6
0.8
1
Normalised SPT blowcount, N1
Pro
babi
lity
of fl
ow s
usce
ptib
ility
D50=0.2mm
D50=0.3mm
D50=0.5mm
D50=1.0mm
No fines, Fc= 0
Fig. 16. Probability of flow liquefaction susceptibility as a function of SPT N1 value and: (a) fines content, Fc; and (b) median particle size for a no fines soil.
0 100 200 300 4000.6
0.8
1
1.2
1.4
Mean confining stress, p' (kPa)
Voi
d ra
tio, e
SS-line (simplified)
SS-line (S-D model)
UR-line
emax
emin
0 10 20 301.05
1.06
1.07
1.08
1.09
1.1
UR-lineSS-line (simplified)
SS-line (S-D model)
Fig. 17. Illustration of the modelling for the QSS-line/SS-line in the stress–density
(S–D) model and its differences from that of the simplified equations.
B.A Bradley, M. Cubrinovski / Soil Dynamics and Earthquake Engineering 48 (2013) 104–118 115
QSS/SS-line at seven discrete values of confining stress (p0 ¼1, 10,30, 50, 100, 200 and 400 kPa). For p0 ¼30–400 kPa, values obtainedfrom Eq. (5) are used directly. However, the void ratio of the QSS/SS-line for p0 ¼10 kPa, e10, is computed from e10¼e0�0.02 (i.e.,different than Eq. (4)) and the void ratio is taken as a constantvalue for p0o10 kPa (i.e., e1¼e10 also). This formulation ensuresfirst that for small confining stresses the current value of Is doesnot become excessively large as the SS-line approaches theUR-line; and second that the value of Is is constant for p0o10 kPato provide a stable development of cyclic mobility phenomena.These modifications are suggested in the absence of material-specific test information, and are based on experience in thecalibration of the S–D model from numerous laboratory tests onreconstituted and high-quality undistributed samples (e.g.,[7,28,29], among others). Finally, it should be noted that use ofthe SS-line within the S–D model, rather than the QSS-line, meansthat the state index-based formulation represents only a stateparameter, rather than a state and fabric parameter [7]. The factthat in situ fabric effects are likely quantifiable only via testing ofhigh-quality undisturbed samples, means use of the SS-line isconsistent with the proposed simplified methodology.
5.1. Sensitivity analysis of liquefaction resistance estimation
Following the prescription of the SS-line for implementationwith the S–D model as discussed in the previous section, it is
possible to examine the sensitivity of liquefaction resistancecurves due to the uncertainties in the proposed simplified stateconcept relationships. At this point it is noted that the stress–dilatency relationship parameter, Sc, is the only non-physicalparameter of the S–D model, and therefore should be obtainedbased on calibration with experimental liquefaction resistancedata [7]. Because the stress–dilatency relationship is a function ofplastic shear strain, it is implicitly affected by the elastic, stress–strain and state concept reference lines of a particular soil. Hence,in the considered sensitivity analyses, variation of the parametersdefining state concept relationships should be followed by amodification of the parameter Sc in order to obtain the sametarget undrained cyclic resistance. Consistent with the simplifiednature of the proposed state concept relationships, the liquefac-tion resistance of a specific soil can be estimated based onempirical prediction equations. Here the relationship of Idrissand Boulanger [30] is adopted, and the median value of cyclicresistance ratio (CRR) estimated using this relationship (corre-sponding to Nc¼15 cycles) used to determine the value of Sc to beused. It was found that when using the median values of thesimplified correlations, a value of Sc¼0.055, corresponding to thatof dry-pluviated Toyoura sand [7], resulted in a CRR in line withthat obtained from the Idriss and Boulanger [30] correlation.
Fig. 18 illustrates the sensitivity of liquefaction resistance touncertainties in state-concept characterization via the CRR, as afunction of number of cycles, Nc, for N1¼6 and N1¼12, and thefive different state concept parameters in the simplified probabil-istic correlations. As noted in the previous paragraph, because thevalue of Sc was adjusted in each case in order to achieve thecorrect CRR for Nc¼15 cycles, it can be seen that there is nouncertainty at this point when considering the variation of emax,emin, Dr0 and l. However, since variation in CD only affects thein situ void ratio of the soil, and not any of the state conceptreference lines, then its variation does not require modification ofSc, and hence it can be seen that there is uncertainty in the CRR forNc¼15 cycles in Fig. 18e and f. Similar to the previously presentedsensitivity analyses performed for in situ Is, it can be seen that thevariation in emax, emin and l have a relatively small effect onliquefaction resistance, although the sensitivity is more pro-nounced in the case of N1¼6 for large CRR (i.e., small Nc). Onthe other hand, it can be seen that the variation in Nc for a givenCRR, or vice versa, is significant due to variation in the in situ voidratio (i.e., via uncertainty in CD), and position of the UR- andSS-lines (i.e., via uncertainty in Dr0). In particular, the effect ofvariability in CD is significant for large CRR values (i.e., small Nc),despite the fact that the parameter Sc is chosen such that thereis no uncertainty in CRR for Nc¼15 cycles. The importance ofthe position of the SS- and UR-lines, and in situ void ratio

100 101 102 100 101 102
100 101 102
100 101 102
100 101 102
100 101 102 100 101 102
100 101 102
100 101 102
100 101 102
0
0.1
0.2
0.3
0.4
Number of Cycles, NC
Number of Cycles, NC Number of Cycles, NC
Number of Cycles, NCNumber of Cycles, NC
Number of Cycles, NC Number of Cycles, NC
Number of Cycles, NCNumber of Cycles, NC
Number of Cycles, NC
CR
R
N1=6;p'=100kPa
Param:emax
±1σ range
Simplified Median Estimate
±2σ range
0
0.1
0.2
0.3
0.4
CR
R
N1=12;p'=100kPa
Param:emax
0
0.1
0.2
0.3
0.4
CR
R
N1=6;p'=100kPa
Param:emin
0
0.1
0.2
0.3
0.4
CR
R
N1=12;p'=100kPa
Param:emin
0
0.1
0.2
0.3
0.4
CR
R
N1=6;p'=100kPa
Param:CD
0
0.1
0.2
0.3
0.4
CR
R
N1=12;p'=100kPa
Param:CD
0.1
0.2
0.3
0.4
CR
R
N1=6;p'=100kPa
Param:Dr0
0
0.1
0.2
0.3
0.4
CR
R
N1=12;p'=100kPa
Param:Dr0
0
0.1
0.2
0.3
0.4
CR
R
N1=6;p'=100kPa
Param:λ
0
0.1
0.2
0.3
0.4
CR
R
N1=12;p'=100kPa
Param:λ
d
Fig. 18. Sensitivity in the cyclic liquefaction resistance of Toyoura Sand due to simplified methodology parameter variability.
B.A Bradley, M. Cubrinovski / Soil Dynamics and Earthquake Engineering 48 (2013) 104–118116
(as determined via Dr0 and CD, respectively) on cyclic liquefactionresistance can be appreciated as these both directly affect thecurrent value of Is as pore pressure increases in undrainedloading. On the other hand, the variation in slope of the SS-line(but for a constant SS-line position) principally affects the value ofIs for large values of p0 but its effect on Is reduces as p0 decreases(i.e., as pore pressures increase).
5.2. Uncertainty in liquefaction resistance due to uncertain in situ
state and comparison with empirical predictions
The previous section illustrated that variability in in situ voidratio is a key contributor to uncertainty in the undrained cyclicresistance of sandy soils. This observation is particularly impor-tant in light of the fact that direct measurement of in situ void

100 101 1020
0.1
0.2
0.3
0.4
0.5
Number of Cycles, NC
Cyc
lic r
esis
tanc
e ra
tio, C
RR
N1=6;p'=100kPa
Individual simulation
Simplified Median Estimate
16th
, 84th
percentiles
Empirical prediction ofliquefaction resistance
0 0.05 0.1 0.15 0.2 0.25 0.30
0.2
0.4
0.6
0.8
1
Cyclic resistance ratio, CRR, for NC=15
Cum
ulat
ive
prob
abili
ty
Empirical prediction(Idriss and Boulanger, 2010)
N1=6;p'=100kPaSimulated CRR
100 101 1020
0.1
0.2
0.3
0.4
0.5
Number of Cycles, NC
Cyc
lic r
esis
tanc
e ra
tio, C
RR
N1=12;p'=100kPa
0 0.05 0.1 0.15 0.2 0.25 0.30
0.2
0.4
0.6
0.8
1
Cyclic resistance ratio, CRR, for NC=15
Cum
ulat
ive
prob
abili
ty
N1=12;p'=100kPa
Fig. 19. Uncertainty the in liquefaction resistance of Toyoura sand due to uncertainty in in situ void ratio and comparison with the empirical prediction of Idriss and
Boulanger [30].
B.A Bradley, M. Cubrinovski / Soil Dynamics and Earthquake Engineering 48 (2013) 104–118 117
ratio is often prohibitively expensive for numerous stratigraphiclayers within a deposit at a single site, even when a project maywarrant accurate determination of state concept reference linesvia laboratory testing. Hence, correlations of in situ void ratioand/or relative density as a function of in situ field test para-meters (i.e., SPT, CPT), either for generic soil types e.g., [17], or forspecific soils e.g., [31] are desired for practical applications, andthe implications of their uncertainty should be understood.
Fig. 19 illustrates the effect of uncertainty in CD on uncertaintyin the cyclic resistance of Toyoura sand for N1¼6 and N1¼12. InFig. 19a and c results from 1000 individual Monte Carlo simula-tions are shown as discrete points, while the median predictionand 16th and 84th percentiles are shown with solid and dashedlines, respectively. It is noted that the number of cycles for a givenloading stress ratio is determined in increments of 0.5 cycles. Theempirical distribution of CRR, as estimated from Idriss andBoulanger [30], is also depicted in Fig. 19a and c, as well as beingshown in cumulative form in Fig. 19b and d compared with thecumulative distribution obtained from simulation. Table 1 pro-vides tabulated results of the median and lognormal standarddeviation (approximately equal to the coefficient of variation) ofthe results in Fig. 19b and d. In the case of N1¼6 (i.e., DrE42%),Fig. 19b illustrates that the uncertainty in the CRR obtained fromsimulation is consistent with the uncertainty in CRR ofslnCRR9N1
¼0.13 from the empirical model of Idriss and Boulanger[30]. On the other hand, it can be seen that for N1¼12 (i.e.,DrE59%), the uncertainty in CRR obtained from simulation islarger than that estimated by the empirical model of Idriss andBoulanger [30] (which is independent of N1).
The results in Fig. 19 and Table 1 are based on the assumptionthat N1 is known exactly. However, as previously mentioned, it iswell acknowledged that there is non-negligible variability in
determination of N1 values. Table 2 illustrates the median andstandard deviation of the CRR for Nc¼15 cycles obtained fromsimulation and the empirical model of Idriss and Boulanger [30]by considering an uncertainty of slnN1
¼0.2 in the median value ofN1 (denoted N1 ). It can be seen that in all cases the considerationof N1 uncertainty leads to an increase in the uncertainty in CRR,however the increase relative to the case of N1 known exactly isrelatively minor. It is also noteworthy that the consideration of N1
uncertainty gives rise to a larger uncertainty in CRR for N1¼12than N1¼6 based on the empirical model of Idriss and Boulanger[30]. This occurs because of the fact that the gradient of theirempirical relationship of CRR with N1 increases with increasingN1. Finally, in summary, it should be recognised that the uncer-tainty in CRR due to uncertainty in the in situ void ratio issignificant, and should be considered, either explicitly or impli-citly in interpretation of the results of such cyclic liquefactionassessments.
6. Conclusions
This manuscript developed probabilistic relationships whichallow for the characterization of a sandy soil’s state within thestate concept framework. The relationships require conventionalgeotechnical parameters, namely median particle diameter, D50,fines content, Fc, particle shape, and SPT N1 value. The developedequations allow estimation of the maximum and minimum voidratios, emax and emin, the position and slope of the steady-stateline (SS-line) and upper-reference line (UR-line). Using the SS-lineas a first order approximation of the quasi-steady-state line (QSS-line) and initial dividing line (ID-line) the application of thedeveloped probabilistic relationships for in situ state index, flow

B.A Bradley, M. Cubrinovski / Soil Dynamics and Earthquake Engineering 48 (2013) 104–118118
susceptibility and cyclic resistance was examined. It was foundthat the uncertainties in estimation of emax and emin are relativelysmall compared with other parameter uncertainties. For flowliquefaction and cyclic resistance it can be concluded that theuncertainty in the position of the SS-line (as determined by thevoid ratio of the SS-line for zero effective stress) and the in situvoid estimated from SPT results are the key uncertainties.Application of the developed relationships to flow liquefactionillustrates that the potential for flow is sensitive to grain compo-sition in terms of both Fc and D50. It was also observed that thecyclic liquefaction resistance due to uncertainty in in situ voidratio was consistent with empirical predictions for loose deposits(N1¼6), but larger than empirical predictions for medium densitydeposits (N1¼12).
The results therefore provide additional insight into thedevelopment of empirical models for soil liquefaction problems,as well as enabling insight from the theoretical basis of the stateconcept even in the absence of high-quality laboratory data.
Acknowledgements
Financial support of the first author by the Japanese Society forthe Promotion of Science (JSPS) is gratefully acknowledged.Constructive comments from two anonymous reviewers is alsogreatly appreciated.
Appendix A
In consideration of the uncertainty in the regression relation-ship between CD and (emax�emin) it is important to distinguishbetween that due to uncertainty in the data itself and that due tothe imperfect nature of the correlation. In particular, it is wellrecognised that there exists non-negligible uncertainty in thedetermination of SPT values. Given the definition of CD ¼N1=D2
r ,and that CD can be assumed to be a lognormal random variable,it can be expanded as follows:
lnCD9ðemax�eminÞ ¼ lnN1�2lnDrþ ElnCD9N1 ,Dr ,ðemax�eminÞð12Þ
where ElnCD9N1 ,Dr ,ðemax�eminÞis the inherent uncertainty in CD for
known N1, Dr obtained from the CD vs. (emax�emin) relationship.Making the reasonable assumption of statistical independencebetween the errors in N1 and Dr, the uncertainty in the aboveequation can be partitioned as follows:
s2lnCD9ðemax�eminÞ
¼ s2lnN1þ4s2
lnDrþs2
ElnCD 9N1 ,Dr ,ðemax�emin Þð13Þ
The value of slnCD¼ s2
lnCD9ðemax�eminÞ¼0.38 was obtained based
on the regression in Eq. (9) without considering the uncertainty inN1 or Dr.
Cubrinovski and Ishihara ([18], Table 3) noted ranges of valuesof emax and emin obtained for Toyoura sand by different personnel.Assuming that such uncertainties in emax and emin for Toyourasand are representative of other sandy soils, the uncertainty in Dr
due to uncertainty in emax and emin can be estimated to be on theorder of slnDr
¼ 0:05. For SPT N values, Orchant et al. [32] notedthat the coefficient of variation of N is between COVN¼0.15–0.45,while Idriss and Boulanger [30] used COVN¼0.15–0.2. Herea value of COVN¼0.2 is adopted, and noting that N and N1
are deterministically related, gives COVN1� slnN1
¼ 0:2. Hence,Eq. (13) can be evaluated to obtain:
sElnCD 9N1 ,Dr ,ðemax�emin Þ¼
ffiffiffiffiffiffiffiffiffiffiffiffiffiffiffiffiffiffiffiffiffiffiffiffiffiffiffiffiffiffiffiffiffiffiffiffiffiffiffiffiffiffiffiffiffiffiffiffiffiffiffiffiffi0:382
�ð0:22þ4� 0:052
Þ
q¼ 0:31 ð14Þ
This is the value given in Eq. (10) in the text (where conditioningon (emax�emin) is implied).
References
[1] Roscoe KH, Poorooshasb HB. A fundamental principle of similarity in modeltests for earth pressure problems. In: Second Asian regional conference osSMFE: Tokyo, Japan; 1963. p. 134–140.
[2] Poulos SJ. The steady state of deformation. Journal of Geotechnical EngineeringDivision, ASCE 1981;107(GT5):553–62.
[3] Verdugo R. Characterization of sandy soil behaviour under large deformation,Dr. Eng. thesis, in Department of Civil Engineering. University of Tokyo:Tokyo; 1992, pp.
[4] Ishihara K. Liquefaction and flow failure during earthquakes. In: Proceedingsof the 33rd rankine lecture. Geotechnique, 1993; 43(3): 351-415.
[5] Alarcon-Guzman A, Leonards GA, Charneau JL. Undrained monotonic andcyclic strength of sands. Journal of Geotechnical Engineering Division, ASCE1988;114(GT10):1089–109.
[6] Jefferies MG. Nor-sand: a simple critical state model for sand. Geotechnique1993;43(3):351–415.
[7] Cubrinovski M, Ishihara K. State concept and modified elastoplasticity forsand modelling. Soils and Foundations 1998;38(4):213–25.
[8] Muir Wood D, Belkhier K, Liu DF. Strain softening and state parameter forsand modelling. Geotechnique 1994;44(2):335–9.
[9] Cubrinovski M, Ishihara K. Flow potential of sandy soils with different graincompositions. Soils and Foundations 2000;40(4):103–19.
[10] Poulos SJ, Castro G, France JW. Liquefaction evaluation procedure. Journal ofGeotechnical Engineering Division, ASCE 1985;111(6):772–92.
[11] Sladen JA, D’Hollander RD, Krahn J. The liquefaction of sands, a collapsesurface approach. Canadian Geotechnical Journal 1985;22(4):564–78.
[12] Pitman TD, Robertson PK, Sego DC. Influence of fines on collapse of loosesands. Canadian Geotechnical Journal 1994;31(5):728–39.
[13] Fear CE, Robertson PK. Estimating the undrained strength of sand: atheoretical framework. Canadian Geotechnical Journal 1995;32(5):859–70.
[14] Castro G, Poulos SJ. Leathers FD. Re-examination of slide of lower SanFernando dam. Journal of Geotechnical Engineering Division, ASCE 1985;111(9):1093–107.
[15] Been K, Crooks JHA, Becker DE, Jefferies MG. The cone penetration in sands:part I, state parameter interpretation. Geotechnique 1986;36(2):239–49.
[16] Been K, Jefferies MG. A state parameter for sands. Geotechnique 1985;35(2):99–112.
[17] Cubrinovski M, Ishihara K. Empirical correlation between SPT N-value andrelative density for sandy soils. Soils and Foundations 1999;39(5):61–71.
[18] Cubrinovski M, Ishihara K. Maximum and minimum void ratio characteristicsof sands. Soils and Foundations 2002;42(6):65–78.
[19] Cubrinovski M, Ishihara K. Modelling of sand behaviour based on stateconcept. Soils and Foundations 1998;38(3):115–27.
[20] Kramer SL. Uncertainty in steady-state liquefaction evaluation procedures. Journalof Geotechnical and Geoenvironmental Engineering 1989;115(10):1402–19.
[21] Japanese Geotechnical Society. Test methods for minimum and maximumdensities for sands. Soil Testing Standards (in Japanese) 2000:136–8.
[22] Ang AHS, Tang WH. Probability concepts in engineering: emphasis onapplications in civil and environmental engineering. John Wiley & Sons.
[23] Ishihara K. Liquefaction and flow failure during earthquakes. 33rd RankineLecture. Geotechnique 1993;43(3):351–415.
[24] Skempton AW. Standard penetration test procedures and the effects in sandsof overburden pressure, relative density, particle size, ageing and over-consolidation. Geotechnique 1986;36(3):425–47.
[25] Seed RB, Harder LF. SPT based analysis of cyclic pore pressure generation andundrained residual strength. In: H. Bolton Seed Memorial Symposium, 1990,351-376.
[26] Olson SM, Stark TD. Liquefied strength ratio from liquefaction flow failurecase histories. Canadian Geotechnical Journal 2002;39(3):629–47.
[27] Kokusho T. Current state of research on flow failure considering voidredistribution in liquefied deposits. Soil Dynamics and Earthquake Engineer-ing 2003;23(7):585–603.
[28] Ishihara K, Cubrinovski M. Characteristics of ground motion in liquefied depositsduring earthquakes. Journal of Earthquake Engineering 2005;9(S1):1–15.
[29] Cubrinovski M, Ishihara K, Furukawazono K. Analysis of full-scale tests onpiles in deposits subjected to liquefaction. In: Second international confer-ence on earthquake geotechnical engineering: Lisbon; 1999. p. 567–72.
[30] Idriss IM, Boulanger RW. SPT-based liquefaction triggering procedures, centerfor geotechnical modeling. Davis, CA: University of California; 2010 259pp.
[31] Cubrinovski M, Ishihara K, Furukawazono K. Analysis of two case histories onliquefaction of reclaimed deposits. In 12th world conference on earthquakeengineering Auckland: New Zealand; 2000. p. 8.
[32] Orchant CJ, Kulhawy FH, Trautman CH. Reliability-based foundation designfor transmission line structures: critical evaluation of in-situ test methods.Palo Alto: Electric Power Research Institute; 1988 214pp.