SIMPLIFIED CALINE4 CARBON MONOXIDE ANALYSIS
47
06 Sunset & Western.xlsx Cadence Environmental Consultants 1/16/11 SIMPLIFIED CALINE4 CARBON MONOXIDE ANALYSIS Project Title: Sunset Target Background Information Nearest Air Monitoring Station measuring CO: Central LA Background 1-hour CO Concentration (ppm): 3.0 Background 8-hour CO Concentration (ppm): 2.1 Persistence Factor: 1 0.7 Analysis Year: 2010 1 0.6 Rural or Suburban; 0.7 Urban Locations; 0.8 Urban sites with a recognized tendency for persistent stagnant meteorological condition and/or persistent traffic congestion. Roadway Data Intersection: Sunset Boulevard & Western Avenue Analysis Condition: Existing (2010) Traffic Volumes No. of Average Speed Roadway Type Lanes A.M. P.M. North-South Roadway: Western Avenue 4 5 5 East-West Roadway: Sunset Boulevard 6 5 5 A.M. Peak Hour Traffic Volumes P.M. Peak Hour Traffic Volumes N N 285 858 123 128 707 122 W < v > E W < v > E 177 ^ ^ 58 386 ^ ^ 93 1,112 > < 900 1,272 > < 1,063 112 v v 73 106 v v 131 < ^ > < ^ > 135 499 97 162 684 64 S S Highest Traffic Volumes (Vehicles per Hour) N-S Road: 2,000 N-S Road: 2,120 E-W Road: 2,721 E-W Road: 3,117 Roadway CO Contributions and Concentrations Emissions = (A x B x C) / 100,000 2 A 1 A 2 A 3 A 4 B C Traffic Emission Roadway E.O.R. 25 Feet 50 Feet 100 Feet Volume Factors 3 E.O.R. 25 Feet 50 Feet 100 Feet A.M. Peak Traffic Hour North-South Road 3.3 2.6 2.2 1.7 2,000 6.387 0.42 0.33 0.28 0.22 East-West Road 9.5 6.1 4.9 3.5 2,721 6.387 1.65 1.06 0.85 0.61 P.M. Peak Traffic Hour North-South Road 3.3 2.6 2.2 1.7 2,120 6.387 0.45 0.35 0.30 0.23 East-West Road 9.5 6.1 4.9 3.5 3,117 6.387 1.89 1.21 0.98 0.70 2 Methodology from Bay Area Air Quality Management District BAAQMD CEQA Guidelines (1996). 3 Emission factors from EMFAC2007 (2006). Total Roadway CO Concentrations Peak Hour Emissions = North-South Concentration + East-West Concentration + Background 1-hour Concentration 4 8-Hour Emissions = ((Highest Peak Hour Concentration - Background 1-hour Concentration) x Persistence Factor) + Background 8-hour Concentration 4 A.M. P.M. Peak Hour Peak Hour 8-Hour Roadway Edge 5.1 5.3 3.7 25 Feet from Roadway Edge 4.4 4.6 3.2 50 Feet from Roadway Edge 4.1 4.3 3.0 100 Feet from Roadway Edge 3.8 3.9 2.7 4 Methodology from Bay Area Air Quality Management District BAAQMD CEQA Guidelines (1996). Estimated CO Concentrations Reference CO Concentrations At Grade At Grade
Transcript of SIMPLIFIED CALINE4 CARBON MONOXIDE ANALYSIS

06 Sunset & Western.xlsx Cadence Environmental Consultants 1/16/11
SIMPLIFIED CALINE4 CARBON MONOXIDE ANALYSIS
Project Title: Sunset Target
Background Information
Nearest Air Monitoring Station measuring CO: Central LABackground 1-hour CO Concentration (ppm): 3.0Background 8-hour CO Concentration (ppm): 2.1Persistence Factor:1 0.7Analysis Year: 2010
1 0.6 Rural or Suburban; 0.7 Urban Locations; 0.8 Urban sites with a recognized tendency for persistent stagnant meteorological condition and/or persistent traffic congestion.
Roadway Data
Intersection: Sunset Boulevard & Western AvenueAnalysis Condition: Existing (2010) Traffic Volumes
No. of Average SpeedRoadway Type Lanes A.M. P.M.
North-South Roadway: Western Avenue 4 5 5East-West Roadway: Sunset Boulevard 6 5 5
A.M. Peak Hour Traffic Volumes P.M. Peak Hour Traffic Volumes
N N285 858 123 128 707 122
W < v > E W < v > E177 ^ ^ 58 386 ^ ^ 93
1,112 > < 900 1,272 > < 1,063112 v v 73 106 v v 131
< ^ > < ^ >135 499 97 162 684 64
S S
Highest Traffic Volumes (Vehicles per Hour)
N-S Road: 2,000 N-S Road: 2,120E-W Road: 2,721 E-W Road: 3,117
Roadway CO Contributions and ConcentrationsEmissions = (A x B x C) / 100,0002
A1 A2 A3 A4 B CTraffic Emission
Roadway E.O.R. 25 Feet 50 Feet 100 Feet Volume Factors3 E.O.R. 25 Feet 50 Feet 100 Feet
A.M. Peak Traffic HourNorth-South Road 3.3 2.6 2.2 1.7 2,000 6.387 0.42 0.33 0.28 0.22East-West Road 9.5 6.1 4.9 3.5 2,721 6.387 1.65 1.06 0.85 0.61
P.M. Peak Traffic HourNorth-South Road 3.3 2.6 2.2 1.7 2,120 6.387 0.45 0.35 0.30 0.23East-West Road 9.5 6.1 4.9 3.5 3,117 6.387 1.89 1.21 0.98 0.70
2 Methodology from Bay Area Air Quality Management District BAAQMD CEQA Guidelines (1996).3 Emission factors from EMFAC2007 (2006).
Total Roadway CO ConcentrationsPeak Hour Emissions = North-South Concentration + East-West Concentration + Background 1-hour Concentration4
8-Hour Emissions = ((Highest Peak Hour Concentration - Background 1-hour Concentration) x Persistence Factor) + Background 8-hour Concentration4
A.M. P.M.Peak Hour Peak Hour 8-Hour
Roadway Edge 5.1 5.3 3.725 Feet from Roadway Edge 4.4 4.6 3.250 Feet from Roadway Edge 4.1 4.3 3.0100 Feet from Roadway Edge 3.8 3.9 2.7
4 Methodology from Bay Area Air Quality Management District BAAQMD CEQA Guidelines (1996).
Estimated CO ConcentrationsReference CO Concentrations
At GradeAt Grade

22 Sunset & St Andrews.xlsx Cadence Environmental Consultants 1/16/11
SIMPLIFIED CALINE4 CARBON MONOXIDE ANALYSIS
Project Title: Sunset Target
Background Information
Nearest Air Monitoring Station measuring CO: Central LABackground 1-hour CO Concentration (ppm): 3.0Background 8-hour CO Concentration (ppm): 2.1Persistence Factor:1 0.7Analysis Year: 2010
1 0.6 Rural or Suburban; 0.7 Urban Locations; 0.8 Urban sites with a recognized tendency for persistent stagnant meteorological condition and/or persistent traffic congestion.
Roadway Data
Intersection: Sunset Boulevard & St. Andrews PlaceAnalysis Condition: Existing (2010) Traffic Volumes
No. of Average SpeedRoadway Type Lanes A.M. P.M.
North-South Roadway: St. Andrews Place 2 5 5East-West Roadway: Sunset Boulevard 6 5 5
A.M. Peak Hour Traffic Volumes P.M. Peak Hour Traffic Volumes
N N122 4 8 120 14 22
W < v > E W < v > E71 ^ ^ 57 82 ^ ^ 57
1,350 > < 1,174 1,706 > < 1,24387 v v 70 66 v v 100
< ^ > < ^ >218 37 76 181 21 104
S S
Highest Traffic Volumes (Vehicles per Hour)
N-S Road: 492 N-S Road: 486E-W Road: 3,022 E-W Road: 3,398
Roadway CO Contributions and ConcentrationsEmissions = (A x B x C) / 100,0002
A1 A2 A3 A4 B CTraffic Emission
Roadway E.O.R. 25 Feet 50 Feet 100 Feet Volume Factors3 E.O.R. 25 Feet 50 Feet 100 Feet
A.M. Peak Traffic HourNorth-South Road 3.7 2.7 2.2 1.7 492 6.387 0.12 0.08 0.07 0.05East-West Road 9.5 6.1 4.9 3.5 3,022 6.387 1.83 1.18 0.95 0.68
P.M. Peak Traffic HourNorth-South Road 3.7 2.7 2.2 1.7 486 6.387 0.11 0.08 0.07 0.05East-West Road 9.5 6.1 4.9 3.5 3,398 6.387 2.06 1.32 1.06 0.76
2 Methodology from Bay Area Air Quality Management District BAAQMD CEQA Guidelines (1996).3 Emission factors from EMFAC2007 (2006).
Total Roadway CO ConcentrationsPeak Hour Emissions = North-South Concentration + East-West Concentration + Background 1-hour Concentration4
8-Hour Emissions = ((Highest Peak Hour Concentration - Background 1-hour Concentration) x Persistence Factor) + Background 8-hour Concentration4
A.M. P.M.Peak Hour Peak Hour 8-Hour
Roadway Edge 4.9 5.2 3.625 Feet from Roadway Edge 4.3 4.4 3.150 Feet from Roadway Edge 4.0 4.1 2.9100 Feet from Roadway Edge 3.7 3.8 2.7
4 Methodology from Bay Area Air Quality Management District BAAQMD CEQA Guidelines (1996).
Estimated CO ConcentrationsReference CO Concentrations
At GradeAt Grade

09 Western & De Longpre.xlsx Cadence Environmental Consultants 1/16/11
SIMPLIFIED CALINE4 CARBON MONOXIDE ANALYSIS
Project Title: Sunset Target
Background Information
Nearest Air Monitoring Station measuring CO: Central LABackground 1-hour CO Concentration (ppm): 3.0Background 8-hour CO Concentration (ppm): 2.1Persistence Factor:1 0.7Analysis Year: 2010
1 0.6 Rural or Suburban; 0.7 Urban Locations; 0.8 Urban sites with a recognized tendency for persistent stagnant meteorological condition and/or persistent traffic congestion.
Roadway Data
Intersection: Western Avenue & De Longpre AvenueAnalysis Condition: Existing (2010) Traffic Volumes
No. of Average SpeedRoadway Type Lanes A.M. P.M.
North-South Roadway: Western Avenue 4 5 5East-West Roadway: De Longpre Avenue 2 5 5
A.M. Peak Hour Traffic Volumes P.M. Peak Hour Traffic Volumes
N N24 1,051 0 16 981 0
W < v > E W < v > E6 ^ ^ 0 11 ^ ^ 00 > < 0 0 > < 0
73 v v 0 65 v v 0< ^ > < ^ >62 669 0 56 990 0
S S
Highest Traffic Volumes (Vehicles per Hour)
N-S Road: 1,855 N-S Road: 2,092E-W Road: 165 E-W Road: 148
Roadway CO Contributions and ConcentrationsEmissions = (A x B x C) / 100,0002
A1 A2 A3 A4 B CTraffic Emission
Roadway E.O.R. 25 Feet 50 Feet 100 Feet Volume Factors3 E.O.R. 25 Feet 50 Feet 100 Feet
A.M. Peak Traffic HourNorth-South Road 11.9 7.0 5.4 3.8 1,855 6.387 1.41 0.83 0.64 0.45East-West Road 3.7 2.7 2.2 1.7 165 6.387 0.04 0.03 0.02 0.02
P.M. Peak Traffic HourNorth-South Road 11.9 7.0 5.4 3.8 2,092 6.387 1.59 0.94 0.72 0.51East-West Road 3.7 2.7 2.2 1.7 148 6.387 0.03 0.03 0.02 0.02
2 Methodology from Bay Area Air Quality Management District BAAQMD CEQA Guidelines (1996).3 Emission factors from EMFAC2007 (2006).
Total Roadway CO ConcentrationsPeak Hour Emissions = North-South Concentration + East-West Concentration + Background 1-hour Concentration4
8-Hour Emissions = ((Highest Peak Hour Concentration - Background 1-hour Concentration) x Persistence Factor) + Background 8-hour Concentration4
A.M. P.M.Peak Hour Peak Hour 8-Hour
Roadway Edge 4.4 4.6 3.225 Feet from Roadway Edge 3.9 4.0 2.850 Feet from Roadway Edge 3.7 3.7 2.6100 Feet from Roadway Edge 3.5 3.5 2.5
4 Methodology from Bay Area Air Quality Management District BAAQMD CEQA Guidelines (1996).
Estimated CO ConcentrationsReference CO Concentrations
At GradeAt Grade

23 Harold & Wilton.xlsx Cadence Environmental Consultants 1/16/11
SIMPLIFIED CALINE4 CARBON MONOXIDE ANALYSIS
Project Title: Sunset Target
Background Information
Nearest Air Monitoring Station measuring CO: Central LABackground 1-hour CO Concentration (ppm): 3.0Background 8-hour CO Concentration (ppm): 2.1Persistence Factor:1 0.7Analysis Year: 2010
1 0.6 Rural or Suburban; 0.7 Urban Locations; 0.8 Urban sites with a recognized tendency for persistent stagnant meteorological condition and/or persistent traffic congestion.
Roadway Data
Intersection: 101 FWY NB Off Ramp, Harold Way & Wilton PlaceAnalysis Condition: Existing (2010) Traffic Volumes
No. of Average SpeedRoadway Type Lanes A.M. P.M.
North-South Roadway: Wilton Place 2 5 5East-West Roadway: Harold Way 2 5 5
A.M. Peak Hour Traffic Volumes P.M. Peak Hour Traffic Volumes
N N16 435 18 13 364 17
W < v > E W < v > E57 ^ ^ 80 24 ^ ^ 2926 > < 6 9 > < 5
237 v v 125 40 v v 46< ^ > < ^ >5 385 32 28 631 35
S S
Highest Traffic Volumes (Vehicles per Hour)
N-S Road: 1,219 N-S Road: 1,144E-W Road: 347 E-W Road: 141
Roadway CO Contributions and ConcentrationsEmissions = (A x B x C) / 100,0002
A1 A2 A3 A4 B CTraffic Emission
Roadway E.O.R. 25 Feet 50 Feet 100 Feet Volume Factors3 E.O.R. 25 Feet 50 Feet 100 Feet
A.M. Peak Traffic HourNorth-South Road 14.0 7.6 5.7 4.0 1,219 6.387 1.09 0.59 0.44 0.31East-West Road 3.7 2.7 2.2 1.7 347 6.387 0.08 0.06 0.05 0.04
P.M. Peak Traffic HourNorth-South Road 14.0 7.6 5.7 4.0 1,144 6.387 1.02 0.56 0.42 0.29East-West Road 3.7 2.7 2.2 1.7 141 6.387 0.03 0.02 0.02 0.02
2 Methodology from Bay Area Air Quality Management District BAAQMD CEQA Guidelines (1996).3 Emission factors from EMFAC2007 (2006).
Total Roadway CO ConcentrationsPeak Hour Emissions = North-South Concentration + East-West Concentration + Background 1-hour Concentration4
8-Hour Emissions = ((Highest Peak Hour Concentration - Background 1-hour Concentration) x Persistence Factor) + Background 8-hour Concentration4
A.M. P.M.Peak Hour Peak Hour 8-Hour
Roadway Edge 4.2 4.1 2.925 Feet from Roadway Edge 3.7 3.6 2.650 Feet from Roadway Edge 3.5 3.4 2.4100 Feet from Roadway Edge 3.3 3.3 2.3
4 Methodology from Bay Area Air Quality Management District BAAQMD CEQA Guidelines (1996).
Estimated CO ConcentrationsReference CO Concentrations
At GradeAt Grade

3/17/2011 4:56:29 PM
Page: 1
File Name: C:\Documents and Settings\Administrator\My Documents\My Dropbox\Cadence Files\2010 Projects\Target Sunset\Technical Data\AQ Data\Existing Uses - 2010.urb924Project Name: Target Sunset - Existing Uses 2010Project Location: Los Angeles CountyOn-Road Vehicle Emissions Based on: Version : Emfac2007 V2.3 Nov 1 2006Off-Road Vehicle Emissions Based on: OFFROAD2007
Combined Summer Emissions Reports (Pounds/Day)
Urbemis 2007 Version 9.2.4
TOTALS (lbs/day, unmitigated) 10.72 11.88 104.06 0.10 15.81 3.10
SUM OF AREA SOURCE AND OPERATIONAL EMISSION ESTIMATES
ROG NOx CO SO2 PM10 PM2.5
TOTALS (lbs/day, unmitigated) 10.44 11.69 102.37 0.10 15.80 3.09
OPERATIONAL (VEHICLE) EMISSION ESTIMATES
ROG NOx CO SO2 PM10 PM2.5
TOTALS (lbs/day, unmitigated) 0.28 0.19 1.69 0.00 0.01 0.01
AREA SOURCE EMISSION ESTIMATES
ROG NOx CO SO2 PM10 PM2.5
Summary Report:
3/17/2011 4:56:29 PM
Page: 2
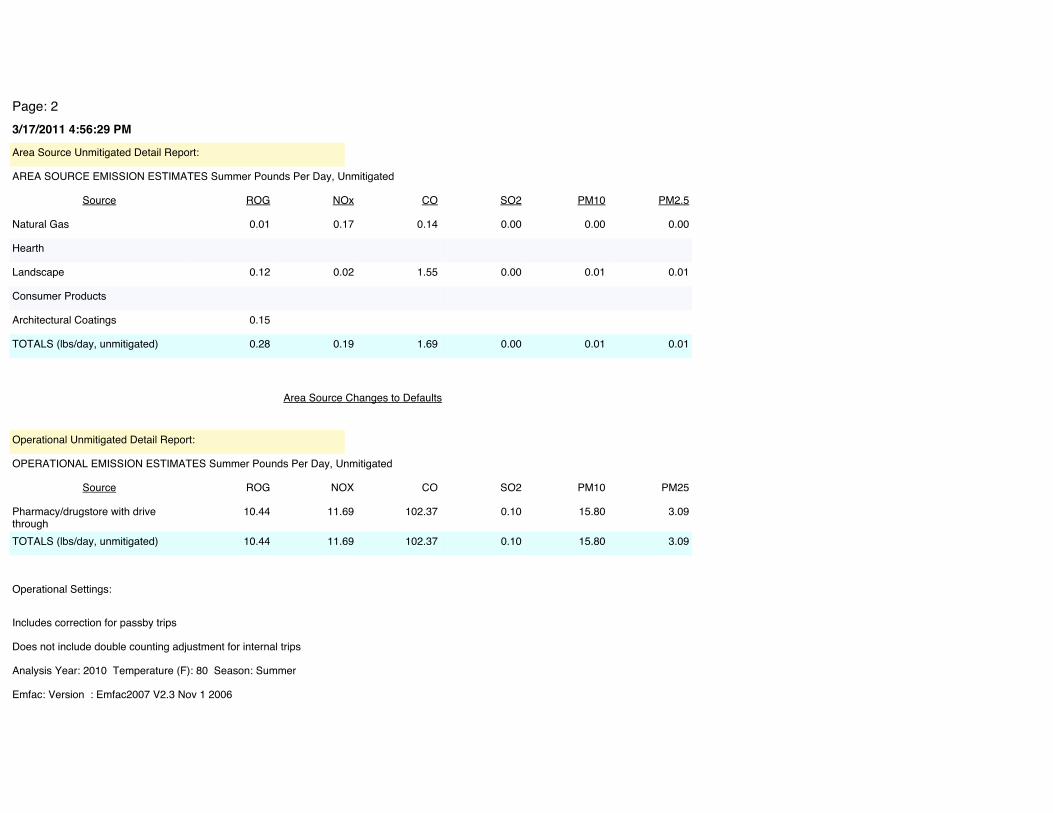
OPERATIONAL EMISSION ESTIMATES Summer Pounds Per Day, Unmitigated
Pharmacy/drugstore with drive through
10.44 11.69 102.37 0.10 15.80 3.09
TOTALS (lbs/day, unmitigated) 10.44 11.69 102.37 0.10 15.80 3.09
Source ROG NOX CO SO2 PM10 PM25
Operational Unmitigated Detail Report:
Architectural Coatings 0.15
Consumer Products
Hearth
Landscape 0.12 0.02 1.55 0.00 0.01 0.01
Natural Gas 0.01 0.17 0.14 0.00 0.00 0.00
TOTALS (lbs/day, unmitigated) 0.28 0.19 1.69 0.00 0.01 0.01
Source ROG NOx CO SO2 PM10 PM2.5
AREA SOURCE EMISSION ESTIMATES Summer Pounds Per Day, Unmitigated
Area Source Unmitigated Detail Report:
Analysis Year: 2010 Temperature (F): 80 Season: Summer
Emfac: Version : Emfac2007 V2.3 Nov 1 2006
Includes correction for passby trips
Does not include double counting adjustment for internal trips
Operational Settings:
Area Source Changes to Defaults
3/17/2011 4:56:29 PM
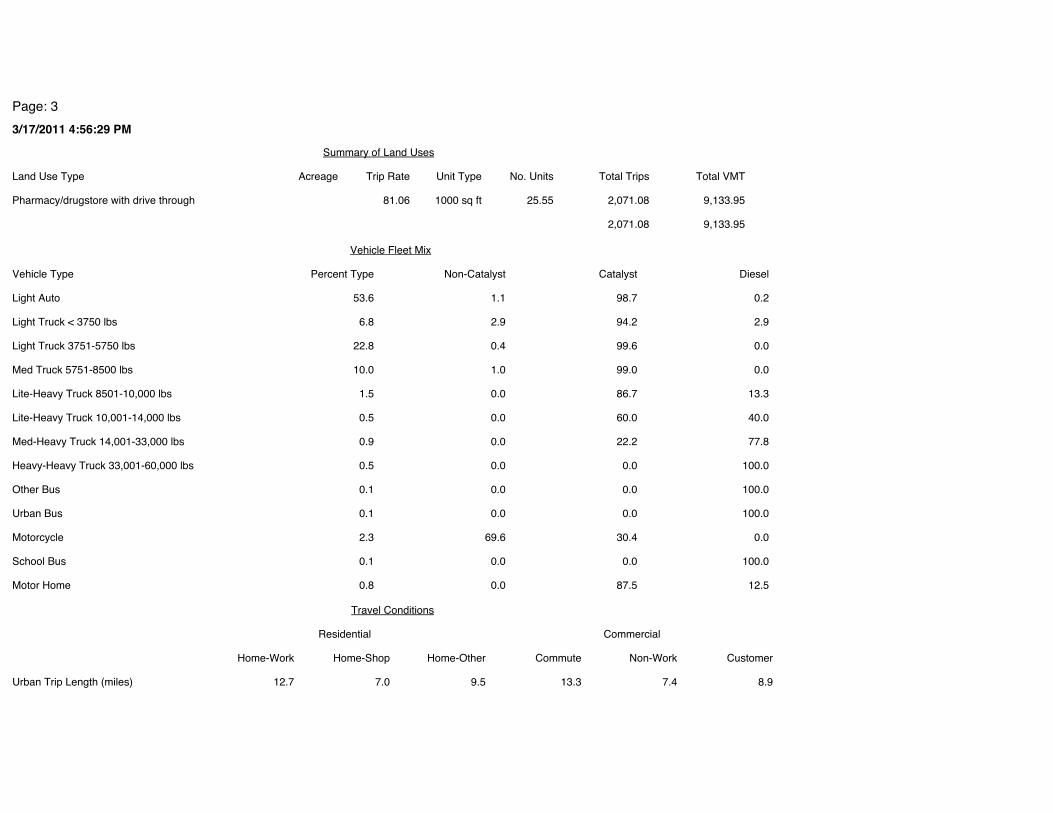
Page: 3
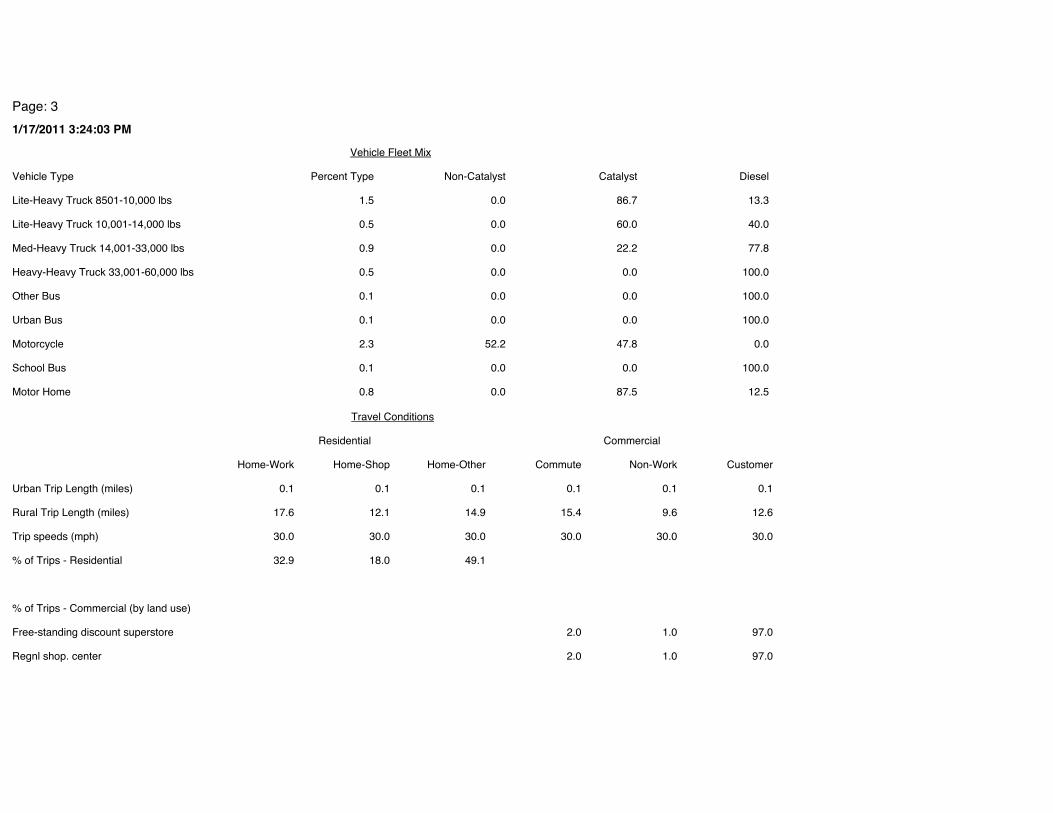
Urban Trip Length (miles) 12.7 7.0 9.5 13.3 7.4 8.9
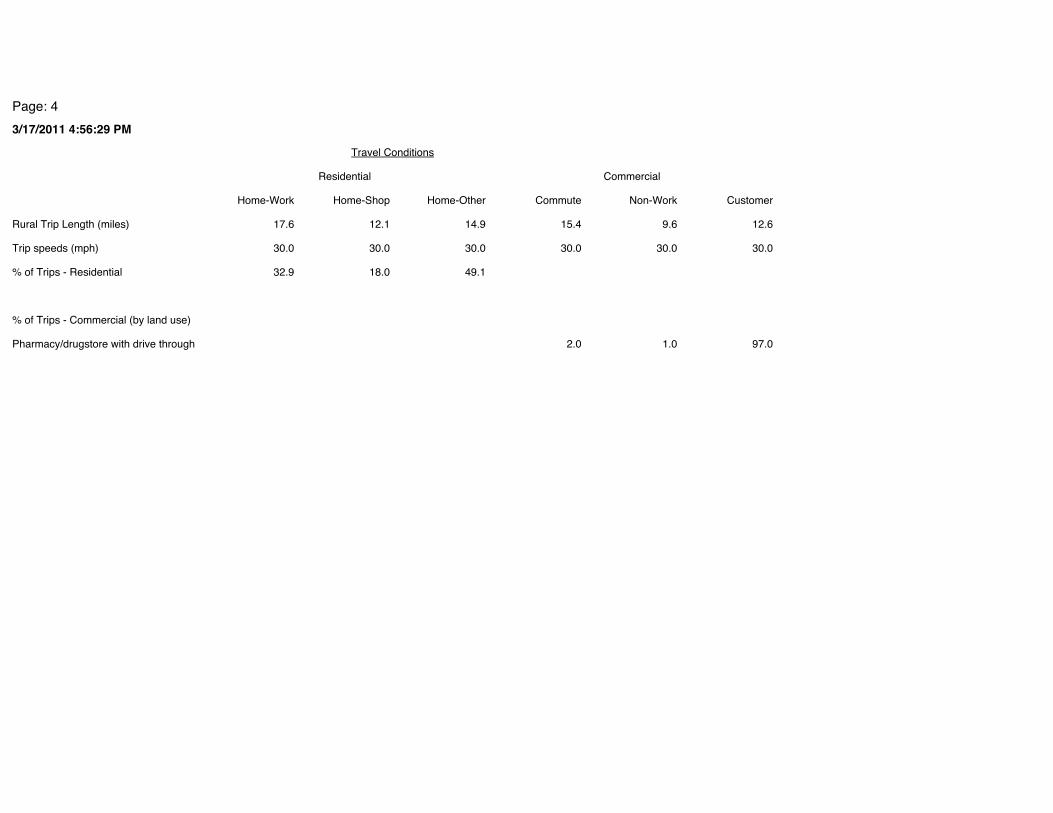
Travel Conditions
Home-Work Home-Shop Home-Other Commute Non-Work Customer
Residential Commercial
Heavy-Heavy Truck 33,001-60,000 lbs 0.5 0.0 0.0 100.0
Med-Heavy Truck 14,001-33,000 lbs 0.9 0.0 22.2 77.8
Motor Home 0.8 0.0 87.5 12.5
Other Bus 0.1 0.0 0.0 100.0
School Bus 0.1 0.0 0.0 100.0
Motorcycle 2.3 69.6 30.4 0.0
Urban Bus 0.1 0.0 0.0 100.0
Light Truck < 3750 lbs 6.8 2.9 94.2 2.9
Light Auto 53.6 1.1 98.7 0.2
Lite-Heavy Truck 10,001-14,000 lbs 0.5 0.0 60.0 40.0
Lite-Heavy Truck 8501-10,000 lbs 1.5 0.0 86.7 13.3
Med Truck 5751-8500 lbs 10.0 1.0 99.0 0.0
Light Truck 3751-5750 lbs 22.8 0.4 99.6 0.0
Vehicle Fleet Mix
Vehicle Type Percent Type Non-Catalyst Catalyst Diesel
Pharmacy/drugstore with drive through 81.06 1000 sq ft 25.55 2,071.08 9,133.95
2,071.08 9,133.95
Summary of Land Uses
Land Use Type Acreage Trip Rate Unit Type No. Units Total Trips Total VMT
3/17/2011 4:56:29 PM
Page: 4
% of Trips - Residential 32.9 18.0 49.1
Pharmacy/drugstore with drive through 2.0 1.0 97.0
% of Trips - Commercial (by land use)
Trip speeds (mph) 30.0 30.0 30.0 30.0 30.0 30.0
Rural Trip Length (miles) 17.6 12.1 14.9 15.4 9.6 12.6
Travel Conditions
Home-Work Home-Shop Home-Other Commute Non-Work Customer
Residential Commercial

3/17/2011 4:56:59 PM
Page: 1
File Name: C:\Documents and Settings\Administrator\My Documents\My Dropbox\Cadence Files\2010 Projects\Target Sunset\Technical Data\AQ Data\Existing Uses - 2010.urb924Project Name: Target Sunset - Existing Uses 2010Project Location: Los Angeles CountyOn-Road Vehicle Emissions Based on: Version : Emfac2007 V2.3 Nov 1 2006Off-Road Vehicle Emissions Based on: OFFROAD2007
Combined Winter Emissions Reports (Pounds/Day)
Urbemis 2007 Version 9.2.4
TOTALS (lbs/day, unmitigated) 12.51 14.20 103.02 0.08 15.80 3.09
SUM OF AREA SOURCE AND OPERATIONAL EMISSION ESTIMATES
ROG NOx CO SO2 PM10 PM2.5
TOTALS (lbs/day, unmitigated) 12.35 14.03 102.88 0.08 15.80 3.09
OPERATIONAL (VEHICLE) EMISSION ESTIMATES
ROG NOx CO SO2 PM10 PM2.5
TOTALS (lbs/day, unmitigated) 0.16 0.17 0.14 0.00 0.00 0.00
AREA SOURCE EMISSION ESTIMATES
ROG NOx CO SO2 PM10 PM2.5
Summary Report:

3/17/2011 4:56:59 PM
Page: 2
OPERATIONAL EMISSION ESTIMATES Winter Pounds Per Day, Unmitigated
Pharmacy/drugstore with drive through
12.35 14.03 102.88 0.08 15.80 3.09
TOTALS (lbs/day, unmitigated) 12.35 14.03 102.88 0.08 15.80 3.09
Source ROG NOX CO SO2 PM10 PM25
Operational Unmitigated Detail Report:
Architectural Coatings 0.15
Consumer Products
Hearth
Landscaping - No Winter Emissions
Natural Gas 0.01 0.17 0.14 0.00 0.00 0.00
TOTALS (lbs/day, unmitigated) 0.16 0.17 0.14 0.00 0.00 0.00
Source ROG NOx CO SO2 PM10 PM2.5
AREA SOURCE EMISSION ESTIMATES Winter Pounds Per Day, Unmitigated
Area Source Unmitigated Detail Report:
Analysis Year: 2010 Temperature (F): 60 Season: Winter
Emfac: Version : Emfac2007 V2.3 Nov 1 2006
Includes correction for passby trips
Does not include double counting adjustment for internal trips
Operational Settings:
Area Source Changes to Defaults

3/17/2011 4:56:59 PM
Page: 3
Urban Trip Length (miles) 12.7 7.0 9.5 13.3 7.4 8.9
Travel Conditions
Home-Work Home-Shop Home-Other Commute Non-Work Customer
Residential Commercial
Heavy-Heavy Truck 33,001-60,000 lbs 0.5 0.0 0.0 100.0
Med-Heavy Truck 14,001-33,000 lbs 0.9 0.0 22.2 77.8
Motor Home 0.8 0.0 87.5 12.5
Other Bus 0.1 0.0 0.0 100.0
School Bus 0.1 0.0 0.0 100.0
Motorcycle 2.3 69.6 30.4 0.0
Urban Bus 0.1 0.0 0.0 100.0
Light Truck < 3750 lbs 6.8 2.9 94.2 2.9
Light Auto 53.6 1.1 98.7 0.2
Lite-Heavy Truck 10,001-14,000 lbs 0.5 0.0 60.0 40.0
Lite-Heavy Truck 8501-10,000 lbs 1.5 0.0 86.7 13.3
Med Truck 5751-8500 lbs 10.0 1.0 99.0 0.0
Light Truck 3751-5750 lbs 22.8 0.4 99.6 0.0
Vehicle Fleet Mix
Vehicle Type Percent Type Non-Catalyst Catalyst Diesel
Pharmacy/drugstore with drive through 81.06 1000 sq ft 25.55 2,071.08 9,133.95
2,071.08 9,133.95
Summary of Land Uses
Land Use Type Acreage Trip Rate Unit Type No. Units Total Trips Total VMT

3/17/2011 4:56:59 PM
Page: 4
% of Trips - Residential 32.9 18.0 49.1
Pharmacy/drugstore with drive through 2.0 1.0 97.0
% of Trips - Commercial (by land use)
Trip speeds (mph) 30.0 30.0 30.0 30.0 30.0 30.0
Rural Trip Length (miles) 17.6 12.1 14.9 15.4 9.6 12.6
Travel Conditions
Home-Work Home-Shop Home-Other Commute Non-Work Customer
Residential Commercial

!"#$%&'()*+,-(.,"%).*"/*0&12&/&#$2#(*/"-*3,(*4-"5".()*4-"6(#3*0&3(
4-"(6#3*7$8(9 !"#$%&'()*+%&0&3(*:#-($1( ,-..
(/0123'!"45%'/'(6&%'7'08#%+ 9(/0123'!"45%'/'(6&%'9'08#%+ :
0;:<=>*+$?%(*;*!"#$%&'()*;"2.3-@#3&"2*+,-(.,"%).
;<='&>';<9'?@6++6>*+
(6&%'08#%"$% 9: :A 7AA 9AA :AA9 7A. 7AB 77A 79B 7CD: 7B7 7:C 7B: 7C, 979
/<'?@6++6>*+
(6&%'08#%"$% 9: :A 7AA 9AA :AA9 7AE. 7,B. 7CDD ,A7B .B,C: 7.B7 9,,7 ,A,A E:EC 7ABBB
F27A'?@6++6>*+
(6&%'08#%"$% 9: :A 7AA 9AA :AA9 . 9: E, .A 7DA: 7B :A BD 7AC 97D
F29-:'?@6++6>*+
(6&%'08#%"$% 9: :A 7AA 9AA :AA9 : C 79 9. 77A: . 77 7. ,B 79B
0;:<=>*+$?%(*;*!"#$%&'()*A5(-$3&"2$%*+,-(.,"%).
;<='&>';<9'?@6++6>*+
(6&%'08#%"$% 9: :A 7AA 9AA :AA9 7A. 7AB 77A 79B 7CD: 7B7 7:C 7B: 7C, 979
/<'?@6++6>*+
(6&%'08#%"$% 9: :A 7AA 9AA :AA9 7AE. 7,B. 7CDD ,A7B .B,C: 7.B7 9,,7 ,A,A E:EC 7ABBB
F27A'?@6++6>*+
(6&%'08#%"$% 9: :A 7AA 9AA :AA9 9 B 77 9A EB: E 79 7C 9B :,
F29-:'?@6++6>*+
(6&%'08#%"$% 9: :A 7AA 9AA :AA9 9 9 , C 9C: 9 , : D ,7
!"#$%&'()*0&12&/&#$2#(*+,-(.,"%).*/"-*3,(*4-"5".()*4-"6(#3
/>*+&#)8&6>*'?@6++6>*+'!G#%+G>5H+
?@6++6>*+ 9: :A 7AA 9AA :AA;<= 7E7-97 7,C-DB 7EE-EC 7::-E: 7DD-B./< 7::C-E. 7DC7-E. 9:CA-E, ,DC:-E, DDA.-:7F27A 7,-A7 EA-BC :D-9D DB-D9 9A.-7CF29-: B-.. D-:7 7:-CB ,,-A7 79A-A,
<I%#"&6>*"5'?@6++6>*+'!G#%+G>5H+
?@6++6>*+ 9: :A 7AA 9AA :AA;<= 7E7-97 7,C-DB 7EE-EC 7::-E: 7DD-B./< 7::C-E. 7DC7-E. 9:CA-E, ,DC:-E, DDA.-:7F27A ,-9: D-CB 7E-CB 9,-CB :A-,DF29-: 9-AA 9-B, E-9: .-9: 9D-:7
36+&"*8%'&>'J%8%I&>#'6*'@%&%#+
36+&"*8%'&>'J%8%I&>#'6*'@%&%#+
36+&"*8%'&>'J%8%I&>#'6*'@%&%#+
36+&"*8%'&>'J%8%I&>#'6*'@%&%#+
36+&"*8%'&>'J%8%I&>#'6*'@%&%#+
36+&"*8%'&>'J%8%I&>#'6*'@%&%#+
36+&"*8%'&>'J%8%I&>#'6*'@%&%#+
36+&"*8%'&>'J%8%I&>#'6*'@%&%#+
36+&"*8%'&>'J%8%I&>#'6*'@%&%#+
36+&"*8%'&>'J%8%I&>#'6*'@%&%#+

3/17/2011 4:51:36 PM
Page: 1
File Name: C:\Documents and Settings\Administrator\My Documents\My Dropbox\Cadence Files\2010 Projects\Target Sunset\Technical Data\AQ Data\Proposed Project - Regional.urb924Project Name: Target Sunset - Proposed Project Regional EmissionsProject Location: Los Angeles CountyOn-Road Vehicle Emissions Based on: Version : Emfac2007 V2.3 Nov 1 2006Off-Road Vehicle Emissions Based on: OFFROAD2007
Combined Summer Emissions Reports (Pounds/Day)
Urbemis 2007 Version 9.2.4
3/17/2011 4:51:36 PM
Page: 2
Construction Unmitigated Detail Report:
CONSTRUCTION EMISSION ESTIMATES Summer Pounds Per Day, Unmitigated
ROG NOx CO SO2 PM10 Dust PM10 Exhaust
PM10 PM2.5 Dust PM2.5 Exhaust
PM2.5
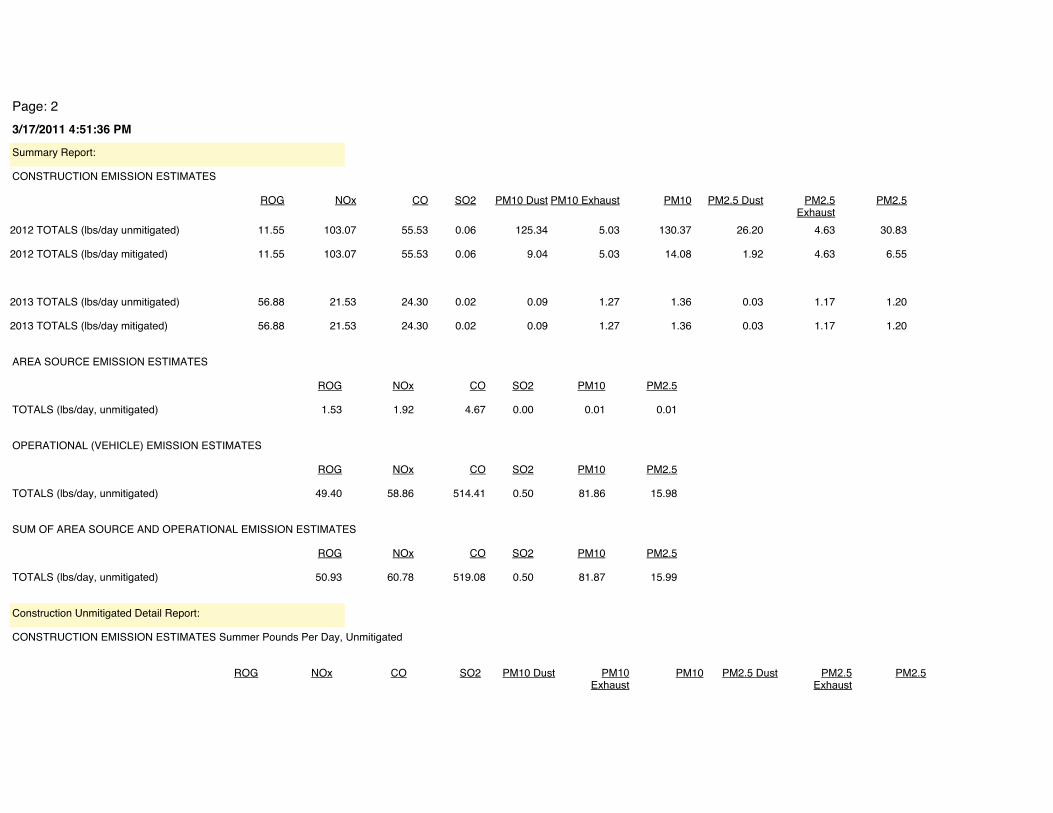
TOTALS (lbs/day, unmitigated) 50.93 60.78 519.08 0.50 81.87 15.99
SUM OF AREA SOURCE AND OPERATIONAL EMISSION ESTIMATES
ROG NOx CO SO2 PM10 PM2.5
TOTALS (lbs/day, unmitigated) 49.40 58.86 514.41 0.50 81.86 15.98
OPERATIONAL (VEHICLE) EMISSION ESTIMATES
ROG NOx CO SO2 PM10 PM2.5
TOTALS (lbs/day, unmitigated) 1.53 1.92 4.67 0.00 0.01 0.01
AREA SOURCE EMISSION ESTIMATES
ROG NOx CO SO2 PM10 PM2.5
2013 TOTALS (lbs/day unmitigated) 56.88 21.53 24.30 0.02 0.09 1.27 1.36 0.03 1.17 1.20
2013 TOTALS (lbs/day mitigated) 56.88 21.53 24.30 0.02 0.09 1.27 1.36 0.03 1.17 1.20
2012 TOTALS (lbs/day mitigated) 11.55 103.07 55.53 0.06 9.04 5.03 14.08 1.92 4.63 6.55
2012 TOTALS (lbs/day unmitigated) 11.55 103.07 55.53 0.06 125.34 5.03 130.37 26.20 4.63 30.83
ROG NOx CO SO2 PM10 Dust PM10 Exhaust PM10 PM2.5 Dust PM2.5 Exhaust
PM2.5
CONSTRUCTION EMISSION ESTIMATES
Summary Report:
3/17/2011 4:51:36 PM
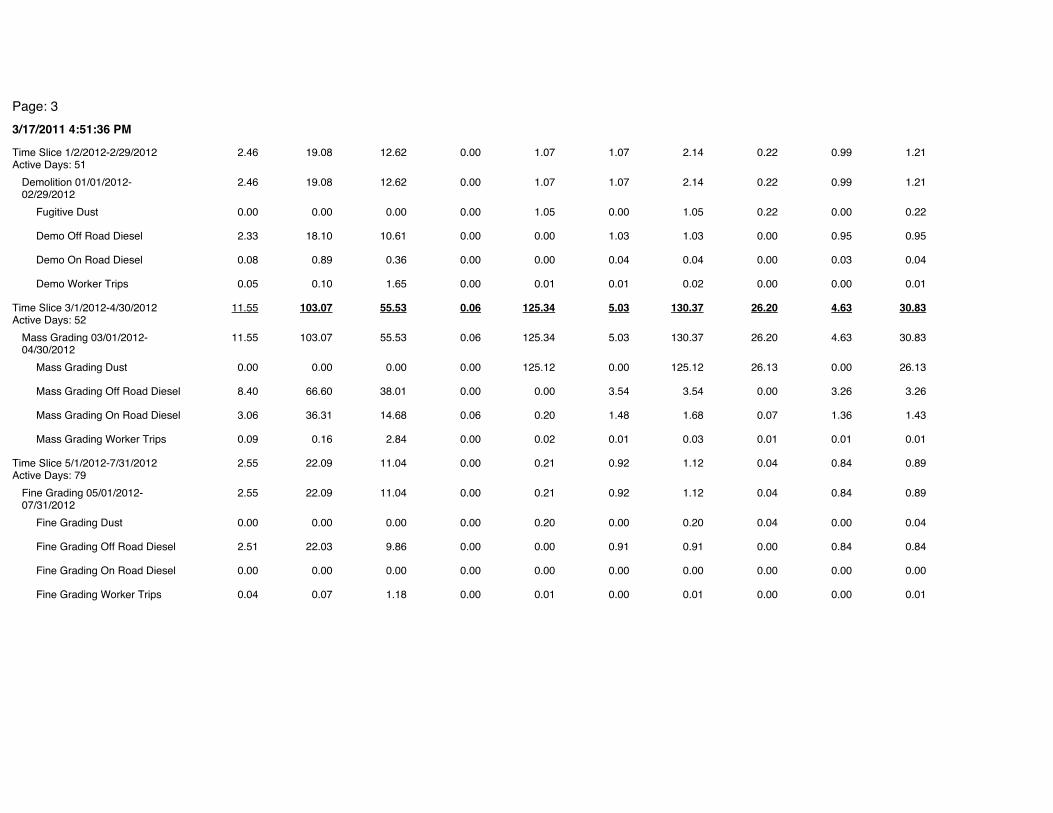
Page: 3
Time Slice 1/2/2012-2/29/2012 Active Days: 51
2.46 19.08 12.62 0.00 2.14 1.211.07 1.07 0.22 0.99
2.14Demolition 01/01/2012-02/29/2012
2.46 19.08 12.62 0.00 1.211.07 1.07 0.22 0.99
Demo On Road Diesel 0.08 0.89 0.36 0.00 0.00 0.04 0.04 0.00 0.03 0.04
Demo Worker Trips 0.05 0.10 1.65 0.00 0.01 0.01 0.02 0.00 0.00 0.01
Fugitive Dust 0.00 0.00 0.00 0.00 1.05 0.00 1.05 0.22 0.00 0.22
Demo Off Road Diesel 2.33 18.10 10.61 0.00 0.00 1.03 1.03 0.00 0.95 0.95
Time Slice 3/1/2012-4/30/2012 Active Days: 52
11.55 103.07 55.53 0.06 130.37 30.83125.34 5.03 26.20 4.63
130.37Mass Grading 03/01/2012-04/30/2012
11.55 103.07 55.53 0.06 30.83125.34 5.03 26.20 4.63
Mass Grading On Road Diesel 3.06 36.31 14.68 0.06 0.20 1.48 1.68 0.07 1.36 1.43
Mass Grading Worker Trips 0.09 0.16 2.84 0.00 0.02 0.01 0.03 0.01 0.01 0.01
Mass Grading Dust 0.00 0.00 0.00 0.00 125.12 0.00 125.12 26.13 0.00 26.13
Mass Grading Off Road Diesel 8.40 66.60 38.01 0.00 0.00 3.54 3.54 0.00 3.26 3.26
Time Slice 5/1/2012-7/31/2012 Active Days: 79
2.55 22.09 11.04 0.00 1.12 0.890.21 0.92 0.04 0.84
1.12Fine Grading 05/01/2012-07/31/2012
2.55 22.09 11.04 0.00 0.890.21 0.92 0.04 0.84
Fine Grading On Road Diesel 0.00 0.00 0.00 0.00 0.00 0.00 0.00 0.00 0.00 0.00
Fine Grading Worker Trips 0.04 0.07 1.18 0.00 0.01 0.00 0.01 0.00 0.00 0.01
Fine Grading Dust 0.00 0.00 0.00 0.00 0.20 0.00 0.20 0.04 0.00 0.04
Fine Grading Off Road Diesel 2.51 22.03 9.86 0.00 0.00 0.91 0.91 0.00 0.84 0.84

3/17/2011 4:51:36 PM
Page: 4
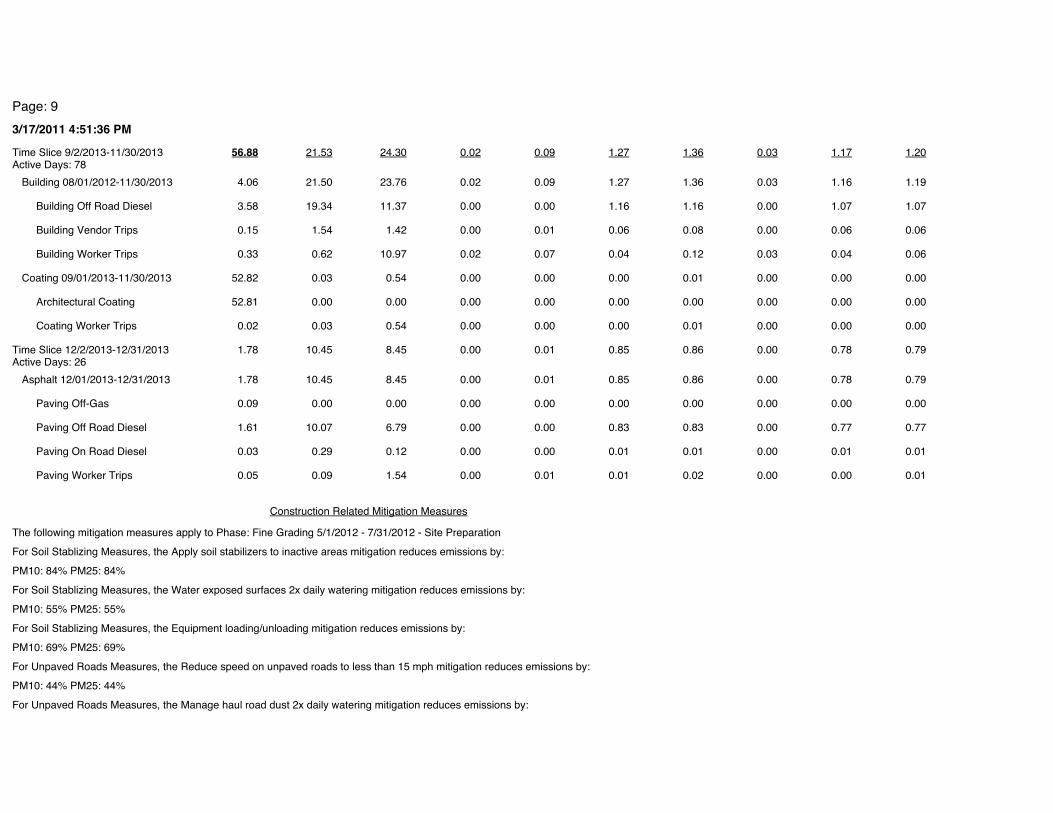
Time Slice 9/2/2013-11/30/2013 Active Days: 78
56.88 21.53 24.30 0.02 1.36 1.200.09 1.27 0.03 1.17
0.01Coating 09/01/2013-11/30/2013 52.82 0.03 0.54 0.00 0.000.00 0.00 0.00 0.00
Coating Worker Trips 0.02 0.03 0.54 0.00 0.00 0.00 0.01 0.00 0.00 0.00
Architectural Coating 52.81 0.00 0.00 0.00 0.00 0.00 0.00 0.00 0.00 0.00
1.36Building 08/01/2012-11/30/2013 4.06 21.50 23.76 0.02 1.190.09 1.27 0.03 1.16
Building Worker Trips 0.33 0.62 10.97 0.02 0.07 0.04 0.12 0.03 0.04 0.06
Building Vendor Trips 0.15 1.54 1.42 0.00 0.01 0.06 0.08 0.00 0.06 0.06
Building Off Road Diesel 3.58 19.34 11.37 0.00 0.00 1.16 1.16 0.00 1.07 1.07
Time Slice 8/1/2012-12/31/2012 Active Days: 131
4.38 23.03 25.07 0.02 1.48 1.310.09 1.39 0.03 1.28
1.48Building 08/01/2012-11/30/2013 4.38 23.03 25.07 0.02 1.310.09 1.39 0.03 1.28
Building Worker Trips 0.36 0.68 11.78 0.02 0.07 0.04 0.12 0.03 0.04 0.06
Building Vendor Trips 0.17 1.73 1.54 0.00 0.01 0.07 0.09 0.00 0.07 0.07
Building Off Road Diesel 3.85 20.62 11.75 0.00 0.00 1.28 1.28 0.00 1.17 1.17
Time Slice 1/1/2013-8/31/2013 Active Days: 209
4.06 21.50 23.76 0.02 1.36 1.190.09 1.27 0.03 1.16
1.36Building 08/01/2012-11/30/2013 4.06 21.50 23.76 0.02 1.190.09 1.27 0.03 1.16
Building Worker Trips 0.33 0.62 10.97 0.02 0.07 0.04 0.12 0.03 0.04 0.06
Building Vendor Trips 0.15 1.54 1.42 0.00 0.01 0.06 0.08 0.00 0.06 0.06
Building Off Road Diesel 3.58 19.34 11.37 0.00 0.00 1.16 1.16 0.00 1.07 1.07

3/17/2011 4:51:36 PM
Page: 5
1 Water Trucks (189 hp) operating at a 0.5 load factor for 8 hours per day
2 Bore/Drill Rigs (291 hp) operating at a 0.75 load factor for 8 hours per day
1 Tractors/Loaders/Backhoes (108 hp) operating at a 0.55 load factor for 7 hours per day1 Forklifts (145 hp) operating at a 0.3 load factor for 8 hours per day
Off-Road Equipment:On Road Truck Travel (VMT): 34.8
2 Crushing/Processing Equip (142 hp) operating at a 0.78 load factor for 8 hours per day1 Concrete/Industrial Saws (10 hp) operating at a 0.73 load factor for 8 hours per day
Phase: Demolition 1/1/2012 - 2/29/2012 - Demolition
Off-Road Equipment:
Building Volume Daily (cubic feet): 2505.6Building Volume Total (cubic feet): 714724.8
Fugitive Dust Level of Detail: DefaultMaximum Daily Acreage Disturbed: 0.01
On Road Truck Travel (VMT): 020 lbs per acre-day
4 Dumpers/Tenders (16 hp) operating at a 0.38 load factor for 8 hours per day
Total Acres Disturbed: 3.88Phase: Fine Grading 5/1/2012 - 7/31/2012 - Site Preparation
Phase Assumptions
Time Slice 12/2/2013-12/31/2013 Active Days: 26
1.78 10.45 8.45 0.00 0.86 0.790.01 0.85 0.00 0.78
0.86Asphalt 12/01/2013-12/31/2013 1.78 10.45 8.45 0.00 0.790.01 0.85 0.00 0.78
Paving On Road Diesel 0.03 0.29 0.12 0.00 0.00 0.01 0.01 0.00 0.01 0.01
Paving Worker Trips 0.05 0.09 1.54 0.00 0.01 0.01 0.02 0.00 0.00 0.01
Paving Off-Gas 0.09 0.00 0.00 0.00 0.00 0.00 0.00 0.00 0.00 0.00
Paving Off Road Diesel 1.61 10.07 6.79 0.00 0.00 0.83 0.83 0.00 0.77 0.77
3/17/2011 4:51:36 PM
Page: 6
1 Pavers (100 hp) operating at a 0.62 load factor for 7 hours per day4 Cement and Mortar Mixers (10 hp) operating at a 0.56 load factor for 6 hours per day
1 Tractors/Loaders/Backhoes (108 hp) operating at a 0.55 load factor for 7 hours per day1 Rollers (95 hp) operating at a 0.56 load factor for 7 hours per day
Phase: Paving 12/1/2013 - 12/31/2013 - Site Finishing
Off-Road Equipment:Acres to be Paved: 0.97
1 Trenchers (63 hp) operating at a 0.75 load factor for 8 hours per day1 Forklifts (145 hp) operating at a 0.3 load factor for 6 hours per day
Phase: Building Construction 8/1/2012 - 11/30/2013 - Building Construction
2 Cranes (399 hp) operating at a 0.43 load factor for 4 hours per dayOff-Road Equipment:
Onsite Cut/Fill: 740 cubic yards/day; Offsite Cut/Fill: 0 cubic yards/dayFugitive Dust Level of Detail: Low
Off-Road Equipment:On Road Truck Travel (VMT): 1416.65
Phase: Mass Grading 3/1/2012 - 4/30/2012 - Grading
Maximum Daily Acreage Disturbed: 3.78Total Acres Disturbed: 3.88
1 Scrapers (313 hp) operating at a 0.72 load factor for 8 hours per day1 Rubber Tired Loaders (164 hp) operating at a 0.54 load factor for 8 hours per day
1 Water Trucks (189 hp) operating at a 0.5 load factor for 8 hours per day2 Tractors/Loaders/Backhoes (108 hp) operating at a 0.55 load factor for 7 hours per day
1 Graders (174 hp) operating at a 0.61 load factor for 6 hours per day4 Excavators (168 hp) operating at a 0.57 load factor for 8 hours per day
1 Rubber Tired Dozers (357 hp) operating at a 0.59 load factor for 6 hours per day1 Rollers (95 hp) operating at a 0.56 load factor for 8 hours per day

3/17/2011 4:51:36 PM
Page: 7
Construction Mitigated Detail Report:
CONSTRUCTION EMISSION ESTIMATES Summer Pounds Per Day, Mitigated
ROG NOx CO SO2 PM10 Dust PM10 Exhaust
PM10 PM2.5 Dust PM2.5 Exhaust
PM2.5
Time Slice 1/2/2012-2/29/2012 Active Days: 51
2.46 19.08 12.62 0.00 2.14 1.211.07 1.07 0.22 0.99
2.14Demolition 01/01/2012-02/29/2012
2.46 19.08 12.62 0.00 1.211.07 1.07 0.22 0.99
Demo On Road Diesel 0.08 0.89 0.36 0.00 0.00 0.04 0.04 0.00 0.03 0.04
Demo Worker Trips 0.05 0.10 1.65 0.00 0.01 0.01 0.02 0.00 0.00 0.01
Fugitive Dust 0.00 0.00 0.00 0.00 1.05 0.00 1.05 0.22 0.00 0.22
Demo Off Road Diesel 2.33 18.10 10.61 0.00 0.00 1.03 1.03 0.00 0.95 0.95
Rule: Residential Exterior Coatings begins 7/1/2008 ends 12/31/2040 specifies a VOC of 100Rule: Residential Exterior Coatings begins 1/1/2005 ends 6/30/2008 specifies a VOC of 250
Rule: Nonresidential Interior Coatings begins 1/1/2005 ends 12/31/2040 specifies a VOC of 250Rule: Nonresidential Exterior Coatings begins 1/1/2005 ends 12/31/2040 specifies a VOC of 250
Rule: Residential Interior Coatings begins 7/1/2008 ends 12/31/2040 specifies a VOC of 50
1 Water Trucks (189 hp) operating at a 0.5 load factor for 8 hours per day5 Welders (45 hp) operating at a 0.45 load factor for 8 hours per day
Rule: Residential Interior Coatings begins 1/1/2005 ends 6/30/2008 specifies a VOC of 100Phase: Architectural Coating 9/1/2013 - 11/30/2013 - Architectural Coatings

3/17/2011 4:51:36 PM
Page: 8
Time Slice 1/1/2013-8/31/2013 Active Days: 209
4.06 21.50 23.76 0.02 1.36 1.190.09 1.27 0.03 1.16
1.36Building 08/01/2012-11/30/2013 4.06 21.50 23.76 0.02 1.190.09 1.27 0.03 1.16
Building Worker Trips 0.33 0.62 10.97 0.02 0.07 0.04 0.12 0.03 0.04 0.06
Building Vendor Trips 0.15 1.54 1.42 0.00 0.01 0.06 0.08 0.00 0.06 0.06
Building Off Road Diesel 3.58 19.34 11.37 0.00 0.00 1.16 1.16 0.00 1.07 1.07
Time Slice 3/1/2012-4/30/2012 Active Days: 52
11.55 103.07 55.53 0.06 14.08 6.559.04 5.03 1.92 4.63
14.08Mass Grading 03/01/2012-04/30/2012
11.55 103.07 55.53 0.06 6.559.04 5.03 1.92 4.63
Mass Grading On Road Diesel 3.06 36.31 14.68 0.06 0.20 1.48 1.68 0.07 1.36 1.43
Mass Grading Worker Trips 0.09 0.16 2.84 0.00 0.02 0.01 0.03 0.01 0.01 0.01
Mass Grading Dust 0.00 0.00 0.00 0.00 8.83 0.00 8.83 1.84 0.00 1.84
Mass Grading Off Road Diesel 8.40 66.60 38.01 0.00 0.00 3.54 3.54 0.00 3.26 3.26
Time Slice 5/1/2012-7/31/2012 Active Days: 79
2.55 22.09 11.04 0.00 0.94 0.850.02 0.92 0.01 0.84
0.94Fine Grading 05/01/2012-07/31/2012
2.55 22.09 11.04 0.00 0.850.02 0.92 0.01 0.84
Fine Grading On Road Diesel 0.00 0.00 0.00 0.00 0.00 0.00 0.00 0.00 0.00 0.00
Fine Grading Worker Trips 0.04 0.07 1.18 0.00 0.01 0.00 0.01 0.00 0.00 0.01
Fine Grading Dust 0.00 0.00 0.00 0.00 0.01 0.00 0.01 0.00 0.00 0.00
Fine Grading Off Road Diesel 2.51 22.03 9.86 0.00 0.00 0.91 0.91 0.00 0.84 0.84
Time Slice 8/1/2012-12/31/2012 Active Days: 131
4.38 23.03 25.07 0.02 1.48 1.310.09 1.39 0.03 1.28
1.48Building 08/01/2012-11/30/2013 4.38 23.03 25.07 0.02 1.310.09 1.39 0.03 1.28
Building Worker Trips 0.36 0.68 11.78 0.02 0.07 0.04 0.12 0.03 0.04 0.06
Building Vendor Trips 0.17 1.73 1.54 0.00 0.01 0.07 0.09 0.00 0.07 0.07
Building Off Road Diesel 3.85 20.62 11.75 0.00 0.00 1.28 1.28 0.00 1.17 1.17
3/17/2011 4:51:36 PM
Page: 9
Time Slice 12/2/2013-12/31/2013 Active Days: 26
1.78 10.45 8.45 0.00 0.86 0.790.01 0.85 0.00 0.78
0.86Asphalt 12/01/2013-12/31/2013 1.78 10.45 8.45 0.00 0.790.01 0.85 0.00 0.78
Paving On Road Diesel 0.03 0.29 0.12 0.00 0.00 0.01 0.01 0.00 0.01 0.01
Paving Worker Trips 0.05 0.09 1.54 0.00 0.01 0.01 0.02 0.00 0.00 0.01
Paving Off-Gas 0.09 0.00 0.00 0.00 0.00 0.00 0.00 0.00 0.00 0.00
Paving Off Road Diesel 1.61 10.07 6.79 0.00 0.00 0.83 0.83 0.00 0.77 0.77
Time Slice 9/2/2013-11/30/2013 Active Days: 78
56.88 21.53 24.30 0.02 1.36 1.200.09 1.27 0.03 1.17
0.01Coating 09/01/2013-11/30/2013 52.82 0.03 0.54 0.00 0.000.00 0.00 0.00 0.00
Coating Worker Trips 0.02 0.03 0.54 0.00 0.00 0.00 0.01 0.00 0.00 0.00
Architectural Coating 52.81 0.00 0.00 0.00 0.00 0.00 0.00 0.00 0.00 0.00
1.36Building 08/01/2012-11/30/2013 4.06 21.50 23.76 0.02 1.190.09 1.27 0.03 1.16
Building Worker Trips 0.33 0.62 10.97 0.02 0.07 0.04 0.12 0.03 0.04 0.06
Building Vendor Trips 0.15 1.54 1.42 0.00 0.01 0.06 0.08 0.00 0.06 0.06
Building Off Road Diesel 3.58 19.34 11.37 0.00 0.00 1.16 1.16 0.00 1.07 1.07
PM10: 84% PM25: 84%For Soil Stablizing Measures, the Water exposed surfaces 2x daily watering mitigation reduces emissions by:
For Soil Stablizing Measures, the Apply soil stabilizers to inactive areas mitigation reduces emissions by:The following mitigation measures apply to Phase: Fine Grading 5/1/2012 - 7/31/2012 - Site Preparation
PM10: 55% PM25: 55%
PM10: 44% PM25: 44%For Unpaved Roads Measures, the Manage haul road dust 2x daily watering mitigation reduces emissions by:
For Unpaved Roads Measures, the Reduce speed on unpaved roads to less than 15 mph mitigation reduces emissions by:
For Soil Stablizing Measures, the Equipment loading/unloading mitigation reduces emissions by:PM10: 69% PM25: 69%
Construction Related Mitigation Measures
3/17/2011 4:51:36 PM
Page: 10
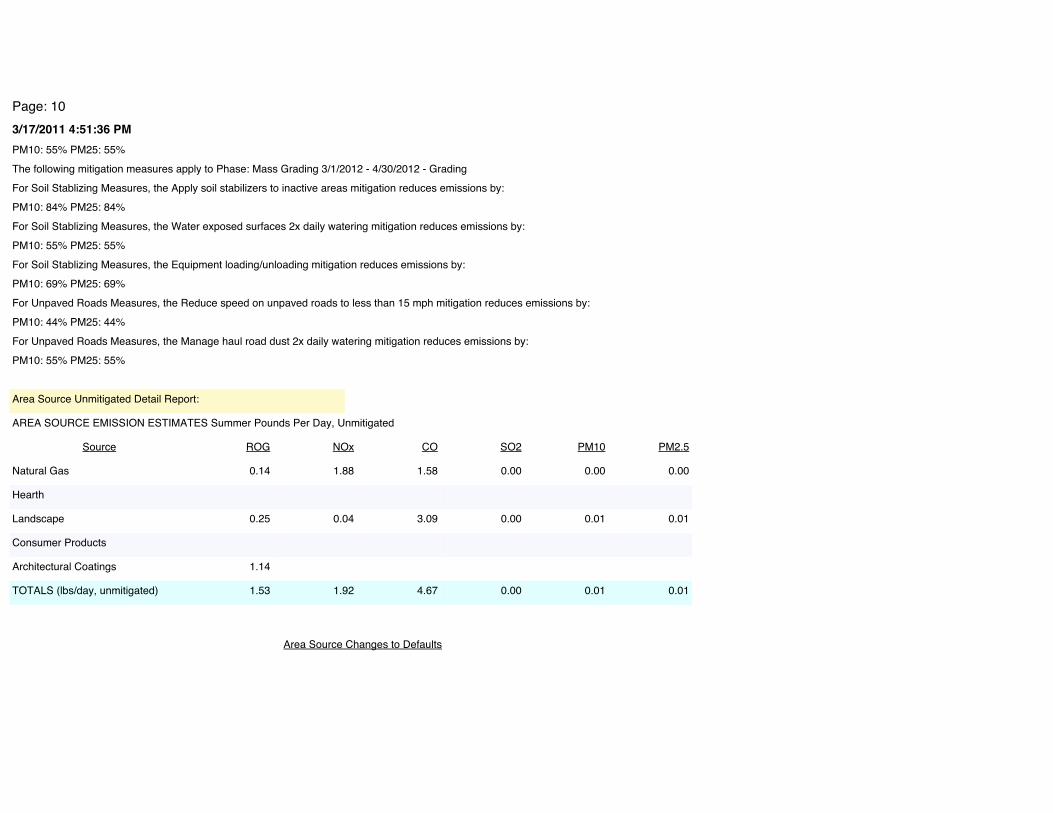
For Unpaved Roads Measures, the Reduce speed on unpaved roads to less than 15 mph mitigation reduces emissions by:PM10: 69% PM25: 69%For Soil Stablizing Measures, the Equipment loading/unloading mitigation reduces emissions by:
PM10: 55% PM25: 55%For Unpaved Roads Measures, the Manage haul road dust 2x daily watering mitigation reduces emissions by:PM10: 44% PM25: 44%
For Soil Stablizing Measures, the Apply soil stabilizers to inactive areas mitigation reduces emissions by:The following mitigation measures apply to Phase: Mass Grading 3/1/2012 - 4/30/2012 - GradingPM10: 55% PM25: 55%
PM10: 55% PM25: 55%For Soil Stablizing Measures, the Water exposed surfaces 2x daily watering mitigation reduces emissions by:PM10: 84% PM25: 84%
Architectural Coatings 1.14
Consumer Products
Hearth
Landscape 0.25 0.04 3.09 0.00 0.01 0.01
Natural Gas 0.14 1.88 1.58 0.00 0.00 0.00
TOTALS (lbs/day, unmitigated) 1.53 1.92 4.67 0.00 0.01 0.01
Source ROG NOx CO SO2 PM10 PM2.5
AREA SOURCE EMISSION ESTIMATES Summer Pounds Per Day, Unmitigated
Area Source Unmitigated Detail Report:
Area Source Changes to Defaults
3/17/2011 4:51:36 PM
Page: 11
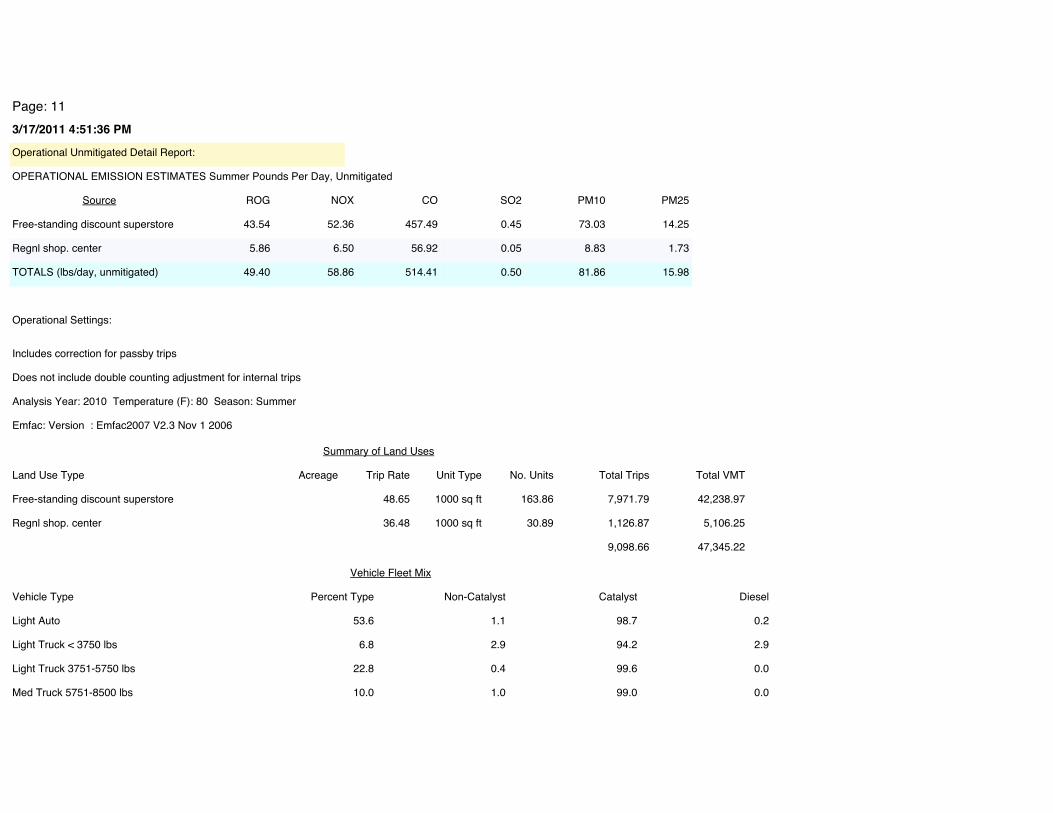
OPERATIONAL EMISSION ESTIMATES Summer Pounds Per Day, Unmitigated
Regnl shop. center 5.86 6.50 56.92 0.05 8.83 1.73
Free-standing discount superstore 43.54 52.36 457.49 0.45 73.03 14.25
TOTALS (lbs/day, unmitigated) 49.40 58.86 514.41 0.50 81.86 15.98
Source ROG NOX CO SO2 PM10 PM25
Operational Unmitigated Detail Report:
Light Truck < 3750 lbs 6.8 2.9 94.2 2.9
Light Auto 53.6 1.1 98.7 0.2
Med Truck 5751-8500 lbs 10.0 1.0 99.0 0.0
Light Truck 3751-5750 lbs 22.8 0.4 99.6 0.0
Vehicle Fleet Mix
Vehicle Type Percent Type Non-Catalyst Catalyst Diesel
Regnl shop. center 36.48 1000 sq ft 30.89 1,126.87 5,106.25
Free-standing discount superstore 48.65 1000 sq ft 163.86 7,971.79 42,238.97
9,098.66 47,345.22
Summary of Land Uses
Land Use Type Acreage Trip Rate Unit Type No. Units Total Trips Total VMT
Analysis Year: 2010 Temperature (F): 80 Season: Summer
Emfac: Version : Emfac2007 V2.3 Nov 1 2006
Includes correction for passby trips
Does not include double counting adjustment for internal trips
Operational Settings:
3/17/2011 4:51:36 PM
Page: 12
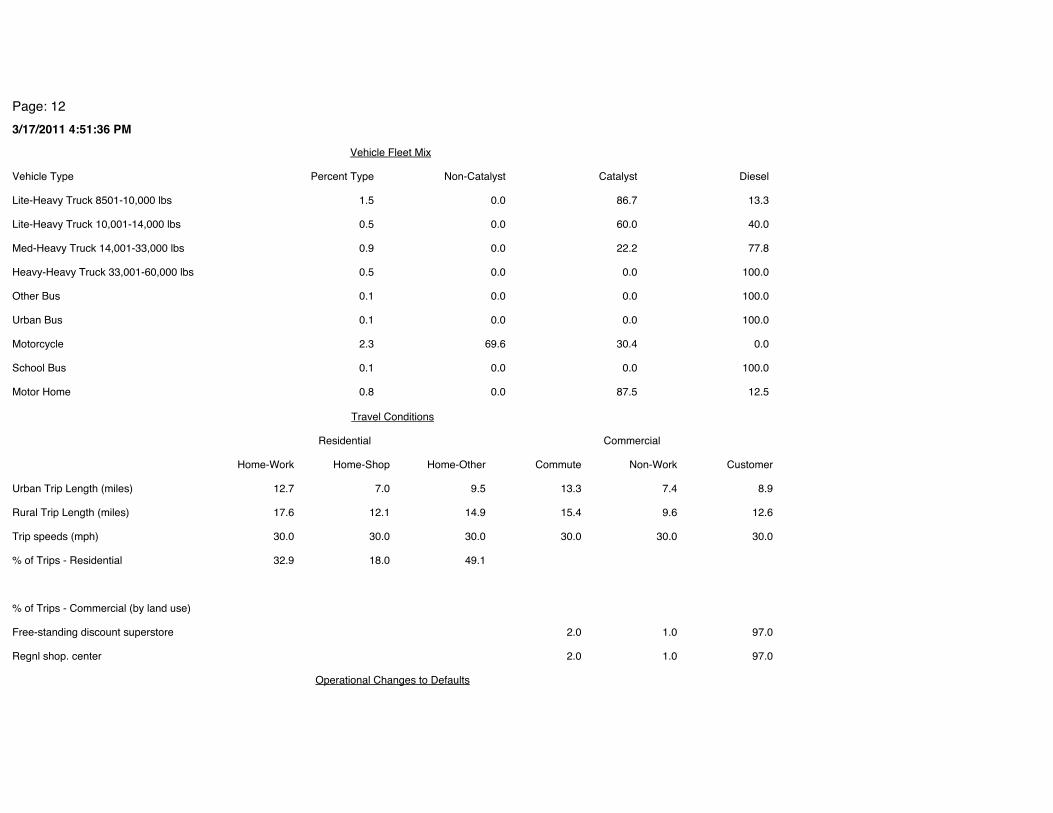
% of Trips - Residential 32.9 18.0 49.1
Regnl shop. center 2.0 1.0 97.0
Free-standing discount superstore 2.0 1.0 97.0
% of Trips - Commercial (by land use)
Trip speeds (mph) 30.0 30.0 30.0 30.0 30.0 30.0
Urban Trip Length (miles) 12.7 7.0 9.5 13.3 7.4 8.9
Rural Trip Length (miles) 17.6 12.1 14.9 15.4 9.6 12.6
Travel Conditions
Home-Work Home-Shop Home-Other Commute Non-Work Customer
Residential Commercial
Other Bus 0.1 0.0 0.0 100.0
Motor Home 0.8 0.0 87.5 12.5
Urban Bus 0.1 0.0 0.0 100.0
School Bus 0.1 0.0 0.0 100.0
Motorcycle 2.3 69.6 30.4 0.0
Lite-Heavy Truck 8501-10,000 lbs 1.5 0.0 86.7 13.3
Heavy-Heavy Truck 33,001-60,000 lbs 0.5 0.0 0.0 100.0
Med-Heavy Truck 14,001-33,000 lbs 0.9 0.0 22.2 77.8
Lite-Heavy Truck 10,001-14,000 lbs 0.5 0.0 60.0 40.0
Vehicle Fleet Mix
Vehicle Type Percent Type Non-Catalyst Catalyst Diesel
Operational Changes to Defaults
3/17/2011 5:33:48 PM
Page: 1
File Name: C:\Documents and Settings\Administrator\My Documents\My Dropbox\Cadence Files\2010 Projects\Target Sunset\Technical Data\AQ Data\Proposed Project - Regional.urb924Project Name: Target Sunset - Proposed Project Regional EmissionsProject Location: Los Angeles CountyOn-Road Vehicle Emissions Based on: Version : Emfac2007 V2.3 Nov 1 2006Off-Road Vehicle Emissions Based on: OFFROAD2007
Combined Winter Emissions Reports (Pounds/Day)
Urbemis 2007 Version 9.2.4
3/17/2011 5:33:48 PM
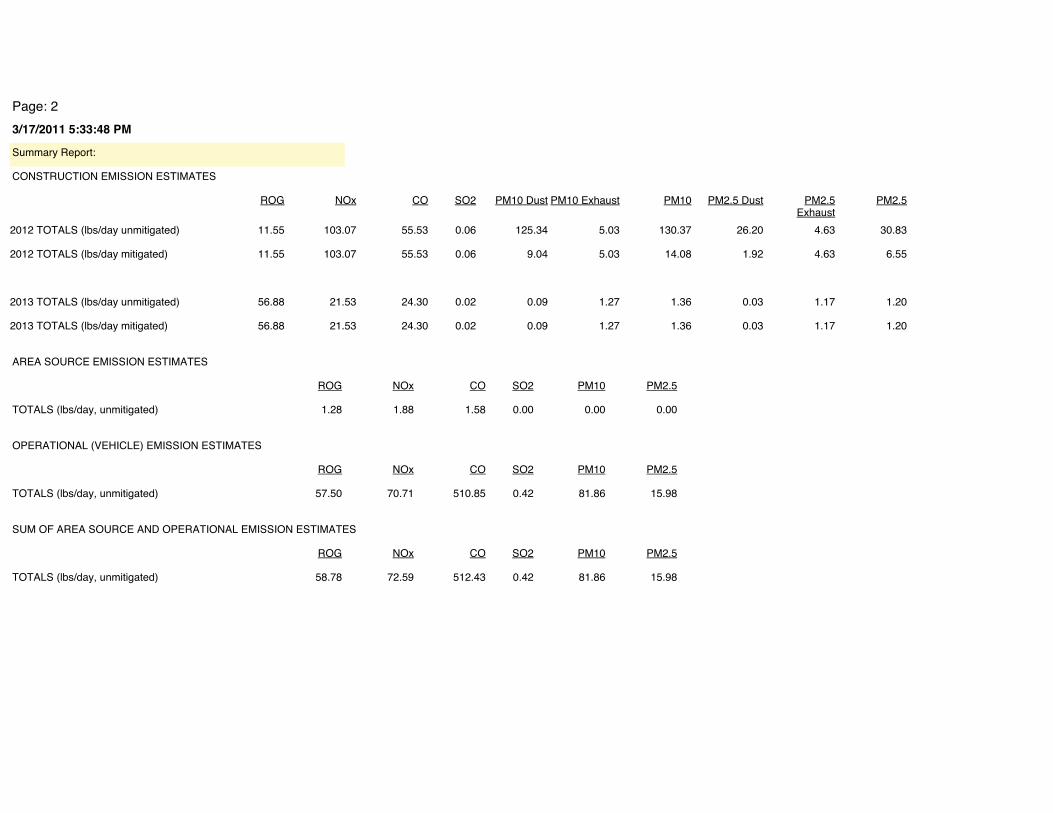
Page: 2
TOTALS (lbs/day, unmitigated) 58.78 72.59 512.43 0.42 81.86 15.98
SUM OF AREA SOURCE AND OPERATIONAL EMISSION ESTIMATES
ROG NOx CO SO2 PM10 PM2.5
TOTALS (lbs/day, unmitigated) 57.50 70.71 510.85 0.42 81.86 15.98
OPERATIONAL (VEHICLE) EMISSION ESTIMATES
ROG NOx CO SO2 PM10 PM2.5
TOTALS (lbs/day, unmitigated) 1.28 1.88 1.58 0.00 0.00 0.00
AREA SOURCE EMISSION ESTIMATES
ROG NOx CO SO2 PM10 PM2.5
2013 TOTALS (lbs/day unmitigated) 56.88 21.53 24.30 0.02 0.09 1.27 1.36 0.03 1.17 1.20
2013 TOTALS (lbs/day mitigated) 56.88 21.53 24.30 0.02 0.09 1.27 1.36 0.03 1.17 1.20
2012 TOTALS (lbs/day mitigated) 11.55 103.07 55.53 0.06 9.04 5.03 14.08 1.92 4.63 6.55
2012 TOTALS (lbs/day unmitigated) 11.55 103.07 55.53 0.06 125.34 5.03 130.37 26.20 4.63 30.83
ROG NOx CO SO2 PM10 Dust PM10 Exhaust PM10 PM2.5 Dust PM2.5 Exhaust
PM2.5
CONSTRUCTION EMISSION ESTIMATES
Summary Report:
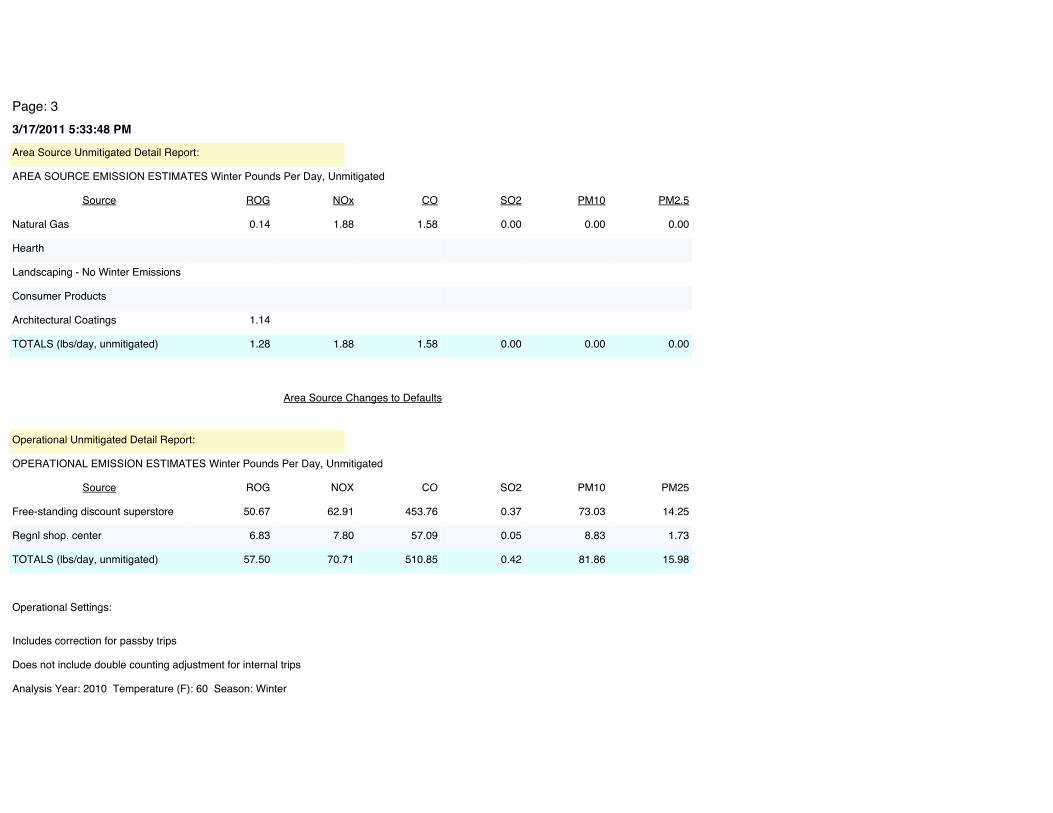
3/17/2011 5:33:48 PM
Page: 3
OPERATIONAL EMISSION ESTIMATES Winter Pounds Per Day, Unmitigated
Regnl shop. center 6.83 7.80 57.09 0.05 8.83 1.73
Free-standing discount superstore 50.67 62.91 453.76 0.37 73.03 14.25
TOTALS (lbs/day, unmitigated) 57.50 70.71 510.85 0.42 81.86 15.98
Source ROG NOX CO SO2 PM10 PM25
Operational Unmitigated Detail Report:
Architectural Coatings 1.14
Consumer Products
Hearth
Landscaping - No Winter Emissions
Natural Gas 0.14 1.88 1.58 0.00 0.00 0.00
TOTALS (lbs/day, unmitigated) 1.28 1.88 1.58 0.00 0.00 0.00
Source ROG NOx CO SO2 PM10 PM2.5
AREA SOURCE EMISSION ESTIMATES Winter Pounds Per Day, Unmitigated
Area Source Unmitigated Detail Report:
Analysis Year: 2010 Temperature (F): 60 Season: Winter
Includes correction for passby trips
Does not include double counting adjustment for internal trips
Operational Settings:
Area Source Changes to Defaults

3/17/2011 5:33:48 PM
Page: 4
Heavy-Heavy Truck 33,001-60,000 lbs 0.5 0.0 0.0 100.0
Med-Heavy Truck 14,001-33,000 lbs 0.9 0.0 22.2 77.8
Motor Home 0.8 0.0 87.5 12.5
Other Bus 0.1 0.0 0.0 100.0
School Bus 0.1 0.0 0.0 100.0
Motorcycle 2.3 69.6 30.4 0.0
Urban Bus 0.1 0.0 0.0 100.0
Light Truck < 3750 lbs 6.8 2.9 94.2 2.9
Light Auto 53.6 1.1 98.7 0.2
Lite-Heavy Truck 10,001-14,000 lbs 0.5 0.0 60.0 40.0
Lite-Heavy Truck 8501-10,000 lbs 1.5 0.0 86.7 13.3
Med Truck 5751-8500 lbs 10.0 1.0 99.0 0.0
Light Truck 3751-5750 lbs 22.8 0.4 99.6 0.0
Vehicle Fleet Mix
Vehicle Type Percent Type Non-Catalyst Catalyst Diesel
Regnl shop. center 36.48 1000 sq ft 30.89 1,126.87 5,106.25
Free-standing discount superstore 48.65 1000 sq ft 163.86 7,971.79 42,238.97
9,098.66 47,345.22
Summary of Land Uses
Land Use Type Acreage Trip Rate Unit Type No. Units Total Trips Total VMT
Emfac: Version : Emfac2007 V2.3 Nov 1 2006
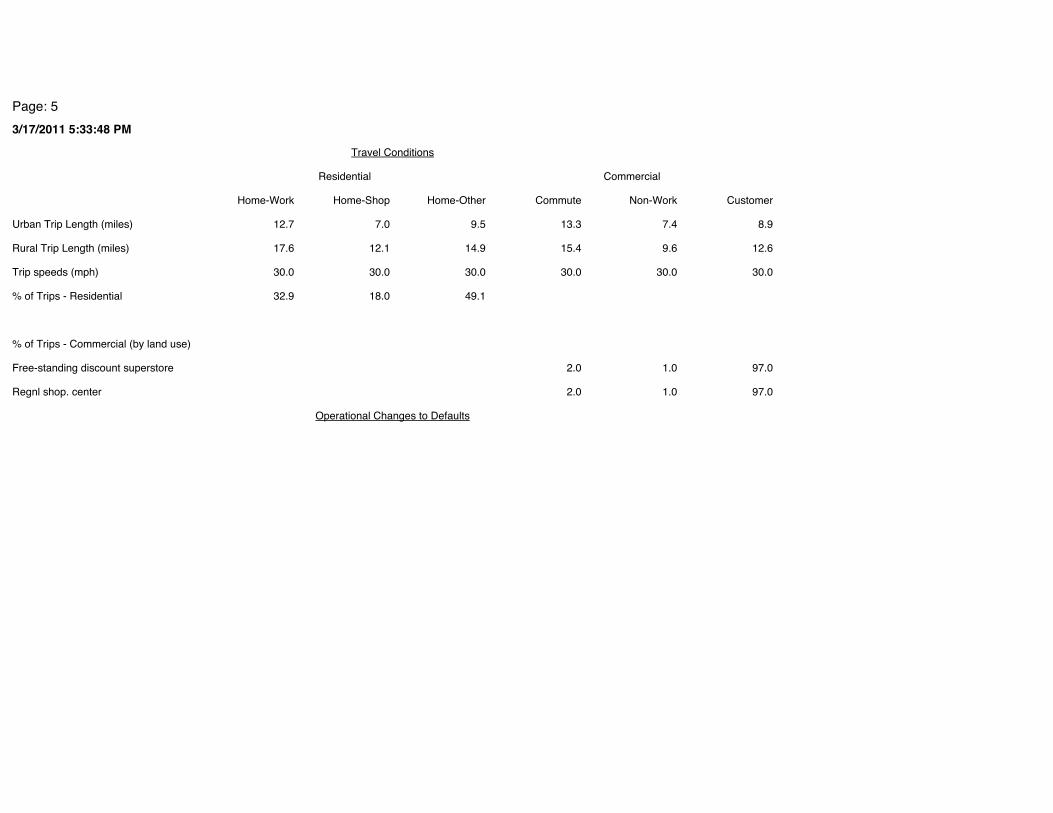
3/17/2011 5:33:48 PM
Page: 5
% of Trips - Residential 32.9 18.0 49.1
Regnl shop. center 2.0 1.0 97.0
Free-standing discount superstore 2.0 1.0 97.0
% of Trips - Commercial (by land use)
Trip speeds (mph) 30.0 30.0 30.0 30.0 30.0 30.0
Urban Trip Length (miles) 12.7 7.0 9.5 13.3 7.4 8.9
Rural Trip Length (miles) 17.6 12.1 14.9 15.4 9.6 12.6
Travel Conditions
Home-Work Home-Shop Home-Other Commute Non-Work Customer
Residential Commercial
Operational Changes to Defaults

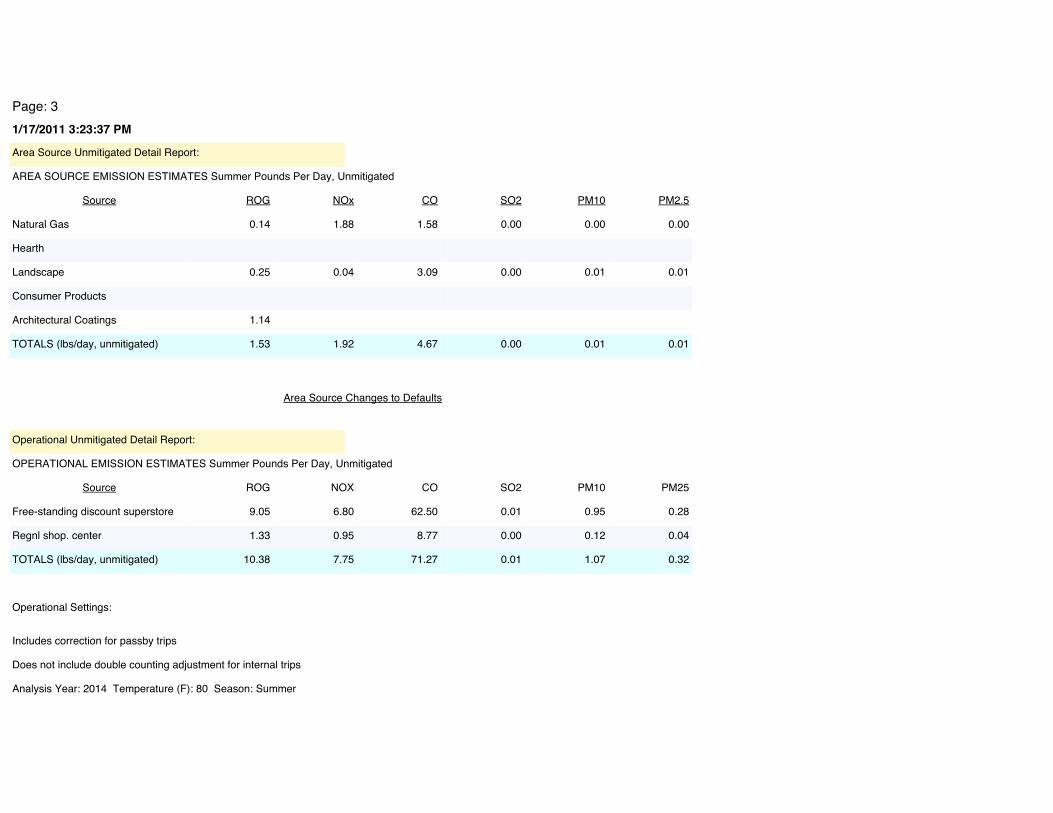
1/17/2011 3:23:37 PM
Page: 1
File Name: C:\Documents and Settings\Administrator\My Documents\My Dropbox\Cadence Files\2010 Projects\Target Sunset\Technical Data\AQ Data\Proposed Project - Localized.urb924Project Name: Target Sunset - Proposed Project Localized EmissionsProject Location: Los Angeles CountyOn-Road Vehicle Emissions Based on: Version : Emfac2007 V2.3 Nov 1 2006Off-Road Vehicle Emissions Based on: OFFROAD2007
Combined Summer Emissions Reports (Pounds/Day)
Urbemis 2007 Version 9.2.4

1/17/2011 3:23:37 PM
Page: 2
TOTALS (lbs/day, unmitigated) 11.91 9.67 75.94 0.01 1.08 0.33
SUM OF AREA SOURCE AND OPERATIONAL EMISSION ESTIMATES
ROG NOx CO SO2 PM10 PM2.5
TOTALS (lbs/day, unmitigated) 10.38 7.75 71.27 0.01 1.07 0.32
OPERATIONAL (VEHICLE) EMISSION ESTIMATES
ROG NOx CO SO2 PM10 PM2.5
TOTALS (lbs/day, unmitigated) 1.53 1.92 4.67 0.00 0.01 0.01
AREA SOURCE EMISSION ESTIMATES
ROG NOx CO SO2 PM10 PM2.5
2013 TOTALS (lbs/day unmitigated) 320.96 19.46 13.61 0.00 0.00 1.17 1.17 0.00 1.07 1.07
2013 TOTALS (lbs/day mitigated) 320.96 19.46 13.61 0.00 0.00 1.17 1.17 0.00 1.07 1.07
2012 TOTALS (lbs/day mitigated) 8.48 66.98 38.71 0.00 8.83 3.56 12.39 1.84 3.27 5.12
2012 TOTALS (lbs/day unmitigated) 8.48 66.98 38.71 0.00 125.12 3.56 128.68 26.13 3.27 29.40
ROG NOx CO SO2 PM10 Dust PM10 Exhaust PM10 PM2.5 Dust PM2.5 Exhaust
PM2.5
CONSTRUCTION EMISSION ESTIMATES
Summary Report:
1/17/2011 3:23:37 PM
Page: 3
OPERATIONAL EMISSION ESTIMATES Summer Pounds Per Day, Unmitigated
Regnl shop. center 1.33 0.95 8.77 0.00 0.12 0.04
Free-standing discount superstore 9.05 6.80 62.50 0.01 0.95 0.28
TOTALS (lbs/day, unmitigated) 10.38 7.75 71.27 0.01 1.07 0.32
Source ROG NOX CO SO2 PM10 PM25
Operational Unmitigated Detail Report:
Architectural Coatings 1.14
Consumer Products
Hearth
Landscape 0.25 0.04 3.09 0.00 0.01 0.01
Natural Gas 0.14 1.88 1.58 0.00 0.00 0.00
TOTALS (lbs/day, unmitigated) 1.53 1.92 4.67 0.00 0.01 0.01
Source ROG NOx CO SO2 PM10 PM2.5
AREA SOURCE EMISSION ESTIMATES Summer Pounds Per Day, Unmitigated
Area Source Unmitigated Detail Report:
Analysis Year: 2014 Temperature (F): 80 Season: Summer
Includes correction for passby trips
Does not include double counting adjustment for internal trips
Operational Settings:
Area Source Changes to Defaults

1/17/2011 3:23:37 PM
Page: 4
Heavy-Heavy Truck 33,001-60,000 lbs 0.5 0.0 0.0 100.0
Med-Heavy Truck 14,001-33,000 lbs 0.9 0.0 22.2 77.8
Motor Home 0.8 0.0 87.5 12.5
Other Bus 0.1 0.0 0.0 100.0
School Bus 0.1 0.0 0.0 100.0
Motorcycle 2.3 52.2 47.8 0.0
Urban Bus 0.1 0.0 0.0 100.0
Light Truck < 3750 lbs 6.7 1.5 97.0 1.5
Light Auto 53.4 0.4 99.4 0.2
Lite-Heavy Truck 10,001-14,000 lbs 0.5 0.0 60.0 40.0
Lite-Heavy Truck 8501-10,000 lbs 1.5 0.0 86.7 13.3
Med Truck 5751-8500 lbs 10.1 1.0 99.0 0.0
Light Truck 3751-5750 lbs 23.0 0.4 99.6 0.0
Vehicle Fleet Mix
Vehicle Type Percent Type Non-Catalyst Catalyst Diesel
Regnl shop. center 36.48 1000 sq ft 30.89 1,126.87 56.91
Free-standing discount superstore 48.65 1000 sq ft 163.86 7,971.79 470.73
9,098.66 527.64
Summary of Land Uses
Land Use Type Acreage Trip Rate Unit Type No. Units Total Trips Total VMT
Emfac: Version : Emfac2007 V2.3 Nov 1 2006
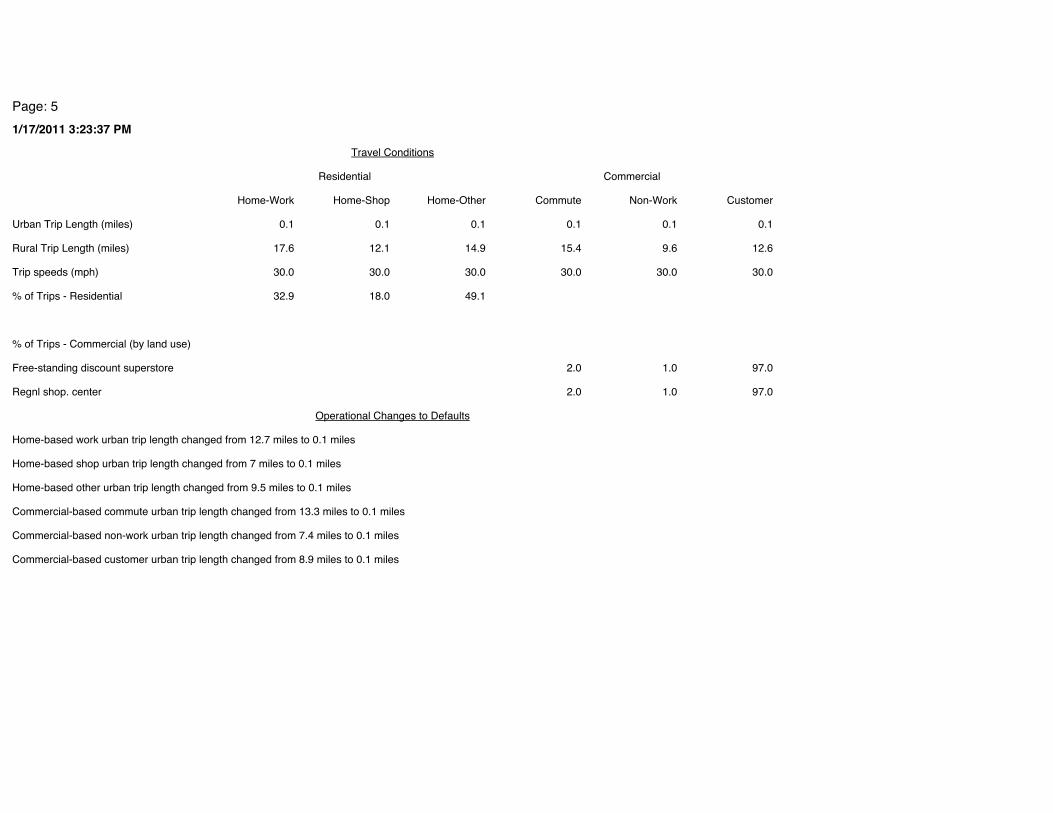
1/17/2011 3:23:37 PM
Page: 5
% of Trips - Residential 32.9 18.0 49.1
Regnl shop. center 2.0 1.0 97.0
Free-standing discount superstore 2.0 1.0 97.0
% of Trips - Commercial (by land use)
Trip speeds (mph) 30.0 30.0 30.0 30.0 30.0 30.0
Urban Trip Length (miles) 0.1 0.1 0.1 0.1 0.1 0.1
Rural Trip Length (miles) 17.6 12.1 14.9 15.4 9.6 12.6
Travel Conditions
Home-Work Home-Shop Home-Other Commute Non-Work Customer
Residential Commercial
Commercial-based customer urban trip length changed from 8.9 miles to 0.1 miles
Commercial-based commute urban trip length changed from 13.3 miles to 0.1 miles
Commercial-based non-work urban trip length changed from 7.4 miles to 0.1 miles
Home-based other urban trip length changed from 9.5 miles to 0.1 miles
Home-based work urban trip length changed from 12.7 miles to 0.1 miles
Home-based shop urban trip length changed from 7 miles to 0.1 miles
Operational Changes to Defaults
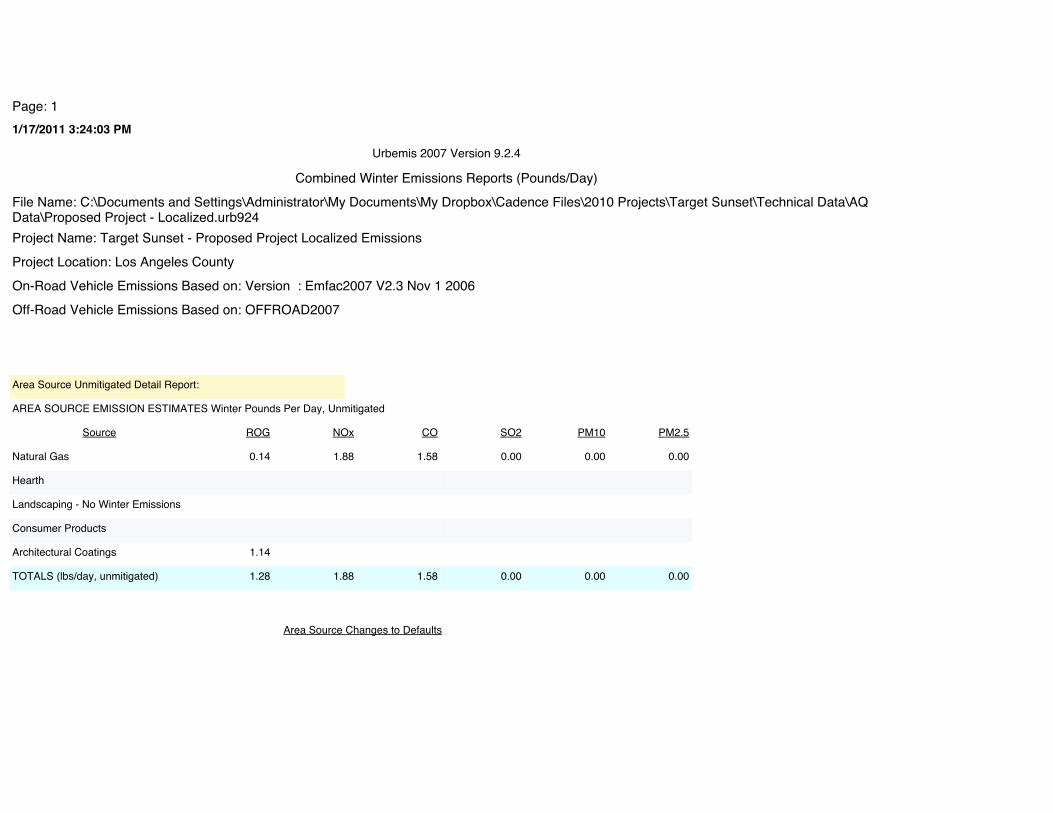
1/17/2011 3:24:03 PM
Page: 1
File Name: C:\Documents and Settings\Administrator\My Documents\My Dropbox\Cadence Files\2010 Projects\Target Sunset\Technical Data\AQ Data\Proposed Project - Localized.urb924Project Name: Target Sunset - Proposed Project Localized EmissionsProject Location: Los Angeles CountyOn-Road Vehicle Emissions Based on: Version : Emfac2007 V2.3 Nov 1 2006Off-Road Vehicle Emissions Based on: OFFROAD2007
Combined Winter Emissions Reports (Pounds/Day)
Urbemis 2007 Version 9.2.4
Architectural Coatings 1.14
Consumer Products
Hearth
Landscaping - No Winter Emissions
Natural Gas 0.14 1.88 1.58 0.00 0.00 0.00
TOTALS (lbs/day, unmitigated) 1.28 1.88 1.58 0.00 0.00 0.00
Source ROG NOx CO SO2 PM10 PM2.5
AREA SOURCE EMISSION ESTIMATES Winter Pounds Per Day, Unmitigated
Area Source Unmitigated Detail Report:
Area Source Changes to Defaults
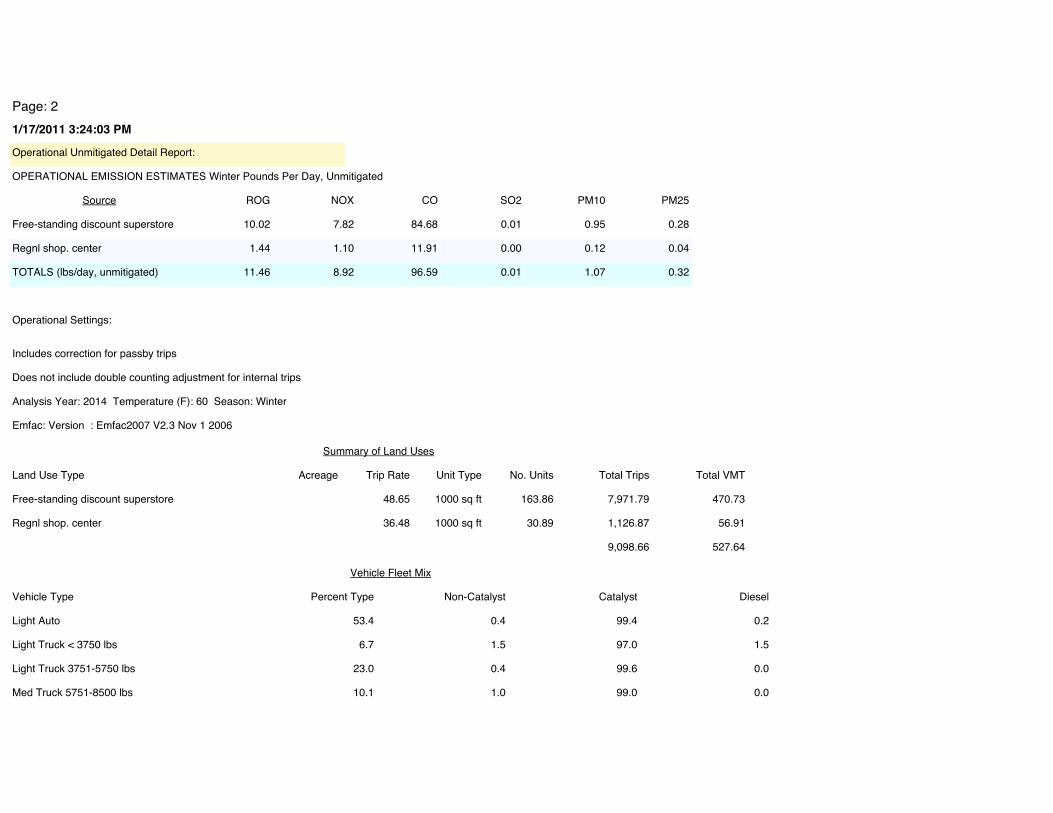
1/17/2011 3:24:03 PM
Page: 2
OPERATIONAL EMISSION ESTIMATES Winter Pounds Per Day, Unmitigated
Regnl shop. center 1.44 1.10 11.91 0.00 0.12 0.04
Free-standing discount superstore 10.02 7.82 84.68 0.01 0.95 0.28
TOTALS (lbs/day, unmitigated) 11.46 8.92 96.59 0.01 1.07 0.32
Source ROG NOX CO SO2 PM10 PM25
Operational Unmitigated Detail Report:
Light Truck < 3750 lbs 6.7 1.5 97.0 1.5
Light Auto 53.4 0.4 99.4 0.2
Med Truck 5751-8500 lbs 10.1 1.0 99.0 0.0
Light Truck 3751-5750 lbs 23.0 0.4 99.6 0.0
Vehicle Fleet Mix
Vehicle Type Percent Type Non-Catalyst Catalyst Diesel
Regnl shop. center 36.48 1000 sq ft 30.89 1,126.87 56.91
Free-standing discount superstore 48.65 1000 sq ft 163.86 7,971.79 470.73
9,098.66 527.64
Summary of Land Uses
Land Use Type Acreage Trip Rate Unit Type No. Units Total Trips Total VMT
Analysis Year: 2014 Temperature (F): 60 Season: Winter
Emfac: Version : Emfac2007 V2.3 Nov 1 2006
Includes correction for passby trips
Does not include double counting adjustment for internal trips
Operational Settings:
1/17/2011 3:24:03 PM
Page: 3
% of Trips - Residential 32.9 18.0 49.1
Regnl shop. center 2.0 1.0 97.0
Free-standing discount superstore 2.0 1.0 97.0
% of Trips - Commercial (by land use)
Trip speeds (mph) 30.0 30.0 30.0 30.0 30.0 30.0
Urban Trip Length (miles) 0.1 0.1 0.1 0.1 0.1 0.1
Rural Trip Length (miles) 17.6 12.1 14.9 15.4 9.6 12.6
Travel Conditions
Home-Work Home-Shop Home-Other Commute Non-Work Customer
Residential Commercial
Other Bus 0.1 0.0 0.0 100.0
Motor Home 0.8 0.0 87.5 12.5
Urban Bus 0.1 0.0 0.0 100.0
School Bus 0.1 0.0 0.0 100.0
Motorcycle 2.3 52.2 47.8 0.0
Lite-Heavy Truck 8501-10,000 lbs 1.5 0.0 86.7 13.3
Heavy-Heavy Truck 33,001-60,000 lbs 0.5 0.0 0.0 100.0
Med-Heavy Truck 14,001-33,000 lbs 0.9 0.0 22.2 77.8
Lite-Heavy Truck 10,001-14,000 lbs 0.5 0.0 60.0 40.0
Vehicle Fleet Mix
Vehicle Type Percent Type Non-Catalyst Catalyst Diesel

1/17/2011 3:24:03 PM
Page: 4
Commercial-based customer urban trip length changed from 8.9 miles to 0.1 miles
Commercial-based commute urban trip length changed from 13.3 miles to 0.1 miles
Commercial-based non-work urban trip length changed from 7.4 miles to 0.1 miles
Home-based other urban trip length changed from 9.5 miles to 0.1 miles
Home-based work urban trip length changed from 12.7 miles to 0.1 miles
Home-based shop urban trip length changed from 7 miles to 0.1 miles
Operational Changes to Defaults

06 Sunset & Western.xlsx Cadence Environmental Consultants 3/17/11
SIMPLIFIED CALINE4 CARBON MONOXIDE ANALYSIS
Project Title: Sunset Target
Background Information
Nearest Air Monitoring Station measuring CO: Central LABackground 1-hour CO Concentration (ppm): 3.0Background 8-hour CO Concentration (ppm): 2.1Persistence Factor:1 0.7Analysis Year: 2010
1 0.6 Rural or Suburban; 0.7 Urban Locations; 0.8 Urban sites with a recognized tendency for persistent stagnant meteorological condition and/or persistent traffic congestion.
Roadway Data
Intersection: Sunset Boulevard & Western AvenueAnalysis Condition: Existing (2010) + Project Traffic Volumes
No. of Average SpeedRoadway Type Lanes A.M. P.M.
North-South Roadway: Western Avenue 4 5 5East-West Roadway: Sunset Boulevard 6 5 5
A.M. Peak Hour Traffic Volumes P.M. Peak Hour Traffic Volumes
N N285 877 123 128 785 122
W < v > E W < v > E177 ^ ^ 58 386 ^ ^ 93
1,116 > < 900 1,317 > < 1,063121 v v 84 145 v v 176
< ^ > < ^ >135 506 97 162 763 64
S S
Highest Traffic Volumes (Vehicles per Hour)
N-S Road: 2,026 N-S Road: 2,277E-W Road: 2,734 E-W Road: 3,201
Roadway CO Contributions and ConcentrationsEmissions = (A x B x C) / 100,0002
A1 A2 A3 A4 B CTraffic Emission
Roadway E.O.R. 25 Feet 50 Feet 100 Feet Volume Factors3 E.O.R. 25 Feet 50 Feet 100 Feet
A.M. Peak Traffic HourNorth-South Road 3.3 2.6 2.2 1.7 2,026 6.387 0.43 0.34 0.28 0.22East-West Road 9.5 6.1 4.9 3.5 2,734 6.387 1.66 1.07 0.86 0.61
P.M. Peak Traffic HourNorth-South Road 3.3 2.6 2.2 1.7 2,277 6.387 0.48 0.38 0.32 0.25East-West Road 9.5 6.1 4.9 3.5 3,201 6.387 1.94 1.25 1.00 0.72
2 Methodology from Bay Area Air Quality Management District BAAQMD CEQA Guidelines (1996).3 Emission factors from EMFAC2007 (2006).
Total Roadway CO ConcentrationsPeak Hour Emissions = North-South Concentration + East-West Concentration + Background 1-hour Concentration4
8-Hour Emissions = ((Highest Peak Hour Concentration - Background 1-hour Concentration) x Persistence Factor) + Background 8-hour Concentration4
A.M. P.M.Peak Hour Peak Hour 8-Hour
Roadway Edge 5.1 5.4 3.825 Feet from Roadway Edge 4.4 4.6 3.250 Feet from Roadway Edge 4.1 4.3 3.0100 Feet from Roadway Edge 3.8 4.0 2.8
4 Methodology from Bay Area Air Quality Management District BAAQMD CEQA Guidelines (1996).
Estimated CO ConcentrationsReference CO Concentrations
At GradeAt Grade

22 Sunset & St Andrews.xlsx Cadence Environmental Consultants 3/17/11
SIMPLIFIED CALINE4 CARBON MONOXIDE ANALYSIS
Project Title: Sunset Target
Background Information
Nearest Air Monitoring Station measuring CO: Central LABackground 1-hour CO Concentration (ppm): 3.0Background 8-hour CO Concentration (ppm): 2.1Persistence Factor:1 0.7Analysis Year: 2010
1 0.6 Rural or Suburban; 0.7 Urban Locations; 0.8 Urban sites with a recognized tendency for persistent stagnant meteorological condition and/or persistent traffic congestion.
Roadway Data
Intersection: Sunset Boulevard & St. Andrews PlaceAnalysis Condition: Existing (2010) + Project Traffic Volumes
No. of Average SpeedRoadway Type Lanes A.M. P.M.
North-South Roadway: St. Andrews Place 2 5 5East-West Roadway: Sunset Boulevard 6 5 5
A.M. Peak Hour Traffic Volumes P.M. Peak Hour Traffic Volumes
N N122 4 8 120 14 22
W < v > E W < v > E71 ^ ^ 57 82 ^ ^ 57
1,359 > < 1,174 1,745 > < 1,24397 v v 70 108 v v 100
< ^ > < ^ >226 37 77 263 21 149
S S
Highest Traffic Volumes (Vehicles per Hour)
N-S Road: 511 N-S Road: 655E-W Road: 3,049 E-W Road: 3,561
Roadway CO Contributions and ConcentrationsEmissions = (A x B x C) / 100,0002
A1 A2 A3 A4 B CTraffic Emission
Roadway E.O.R. 25 Feet 50 Feet 100 Feet Volume Factors3 E.O.R. 25 Feet 50 Feet 100 Feet
A.M. Peak Traffic HourNorth-South Road 3.7 2.7 2.2 1.7 511 6.387 0.12 0.09 0.07 0.06East-West Road 9.5 6.1 4.9 3.5 3,049 6.387 1.85 1.19 0.95 0.68
P.M. Peak Traffic HourNorth-South Road 3.7 2.7 2.2 1.7 655 6.387 0.15 0.11 0.09 0.07East-West Road 9.5 6.1 4.9 3.5 3,561 6.387 2.16 1.39 1.11 0.80
2 Methodology from Bay Area Air Quality Management District BAAQMD CEQA Guidelines (1996).3 Emission factors from EMFAC2007 (2006).
Total Roadway CO ConcentrationsPeak Hour Emissions = North-South Concentration + East-West Concentration + Background 1-hour Concentration4
8-Hour Emissions = ((Highest Peak Hour Concentration - Background 1-hour Concentration) x Persistence Factor) + Background 8-hour Concentration4
A.M. P.M.Peak Hour Peak Hour 8-Hour
Roadway Edge 5.0 5.3 3.725 Feet from Roadway Edge 4.3 4.5 3.250 Feet from Roadway Edge 4.0 4.2 2.9100 Feet from Roadway Edge 3.7 3.9 2.7
4 Methodology from Bay Area Air Quality Management District BAAQMD CEQA Guidelines (1996).
Estimated CO ConcentrationsReference CO Concentrations
At GradeAt Grade

09 Western & De Longpre.xlsx Cadence Environmental Consultants 3/17/11
SIMPLIFIED CALINE4 CARBON MONOXIDE ANALYSIS
Project Title: Sunset Target
Background Information
Nearest Air Monitoring Station measuring CO: Central LABackground 1-hour CO Concentration (ppm): 3.0Background 8-hour CO Concentration (ppm): 2.1Persistence Factor:1 0.7Analysis Year: 2010
1 0.6 Rural or Suburban; 0.7 Urban Locations; 0.8 Urban sites with a recognized tendency for persistent stagnant meteorological condition and/or persistent traffic congestion.
Roadway Data
Intersection: Western Avenue & De Longpre AvenueAnalysis Condition: Existing (2010) + Project Traffic Volumes
No. of Average SpeedRoadway Type Lanes A.M. P.M.
North-South Roadway: Western Avenue 4 5 5East-West Roadway: De Longpre Avenue 2 5 5
A.M. Peak Hour Traffic Volumes P.M. Peak Hour Traffic Volumes
N N24 1,051 0 16 981 0
W < v > E W < v > E13 ^ ^ 0 90 ^ ^ 00 > < 0 0 > < 0
81 v v 0 147 v v 0< ^ > < ^ >82 669 0 137 990 0
S S
Highest Traffic Volumes (Vehicles per Hour)
N-S Road: 1,883 N-S Road: 2,255E-W Road: 200 E-W Road: 390
Roadway CO Contributions and ConcentrationsEmissions = (A x B x C) / 100,0002
A1 A2 A3 A4 B CTraffic Emission
Roadway E.O.R. 25 Feet 50 Feet 100 Feet Volume Factors3 E.O.R. 25 Feet 50 Feet 100 Feet
A.M. Peak Traffic HourNorth-South Road 11.9 7.0 5.4 3.8 1,883 6.387 1.43 0.84 0.65 0.46East-West Road 3.7 2.7 2.2 1.7 200 6.387 0.05 0.03 0.03 0.02
P.M. Peak Traffic HourNorth-South Road 11.9 7.0 5.4 3.8 2,255 6.387 1.71 1.01 0.78 0.55East-West Road 3.7 2.7 2.2 1.7 390 6.387 0.09 0.07 0.05 0.04
2 Methodology from Bay Area Air Quality Management District BAAQMD CEQA Guidelines (1996).3 Emission factors from EMFAC2007 (2006).
Total Roadway CO ConcentrationsPeak Hour Emissions = North-South Concentration + East-West Concentration + Background 1-hour Concentration4
8-Hour Emissions = ((Highest Peak Hour Concentration - Background 1-hour Concentration) x Persistence Factor) + Background 8-hour Concentration4
A.M. P.M.Peak Hour Peak Hour 8-Hour
Roadway Edge 4.5 4.8 3.425 Feet from Roadway Edge 3.9 4.1 2.950 Feet from Roadway Edge 3.7 3.8 2.7100 Feet from Roadway Edge 3.5 3.6 2.5
4 Methodology from Bay Area Air Quality Management District BAAQMD CEQA Guidelines (1996).
Estimated CO ConcentrationsReference CO Concentrations
At GradeAt Grade

23 Harold & Wilton.xlsx Cadence Environmental Consultants 3/17/11
SIMPLIFIED CALINE4 CARBON MONOXIDE ANALYSIS
Project Title: Sunset Target
Background Information
Nearest Air Monitoring Station measuring CO: Central LABackground 1-hour CO Concentration (ppm): 3.0Background 8-hour CO Concentration (ppm): 2.1Persistence Factor:1 0.7Analysis Year: 2010
1 0.6 Rural or Suburban; 0.7 Urban Locations; 0.8 Urban sites with a recognized tendency for persistent stagnant meteorological condition and/or persistent traffic congestion.
Roadway Data
Intersection: 101 FWY NB Off Ramp, Harold Way & Wilton PlaceAnalysis Condition: Existing (2010) + Project Traffic Volumes
No. of Average SpeedRoadway Type Lanes A.M. P.M.
North-South Roadway: Wilton Place 2 5 5East-West Roadway: Harold Way 2 5 5
A.M. Peak Hour Traffic Volumes P.M. Peak Hour Traffic Volumes
N N16 435 18 13 366 17
W < v > E W < v > E57 ^ ^ 80 24 ^ ^ 2926 > < 6 9 > < 5
241 v v 125 55 v v 46< ^ > < ^ >5 387 32 28 648 35
S S
Highest Traffic Volumes (Vehicles per Hour)
N-S Road: 1,225 N-S Road: 1,178E-W Road: 351 E-W Road: 141
Roadway CO Contributions and ConcentrationsEmissions = (A x B x C) / 100,0002
A1 A2 A3 A4 B CTraffic Emission
Roadway E.O.R. 25 Feet 50 Feet 100 Feet Volume Factors3 E.O.R. 25 Feet 50 Feet 100 Feet
A.M. Peak Traffic HourNorth-South Road 14.0 7.6 5.7 4.0 1,225 6.387 1.10 0.59 0.45 0.31East-West Road 3.7 2.7 2.2 1.7 351 6.387 0.08 0.06 0.05 0.04
P.M. Peak Traffic HourNorth-South Road 14.0 7.6 5.7 4.0 1,178 6.387 1.05 0.57 0.43 0.30East-West Road 3.7 2.7 2.2 1.7 141 6.387 0.03 0.02 0.02 0.02
2 Methodology from Bay Area Air Quality Management District BAAQMD CEQA Guidelines (1996).3 Emission factors from EMFAC2007 (2006).
Total Roadway CO ConcentrationsPeak Hour Emissions = North-South Concentration + East-West Concentration + Background 1-hour Concentration4
8-Hour Emissions = ((Highest Peak Hour Concentration - Background 1-hour Concentration) x Persistence Factor) + Background 8-hour Concentration4
A.M. P.M.Peak Hour Peak Hour 8-Hour
Roadway Edge 4.2 4.1 2.925 Feet from Roadway Edge 3.7 3.6 2.650 Feet from Roadway Edge 3.5 3.4 2.4100 Feet from Roadway Edge 3.4 3.3 2.3
4 Methodology from Bay Area Air Quality Management District BAAQMD CEQA Guidelines (1996).
Estimated CO ConcentrationsReference CO Concentrations
At GradeAt Grade
06 Sunset & Western.xlsx Cadence Environmental Consultants 1/17/11
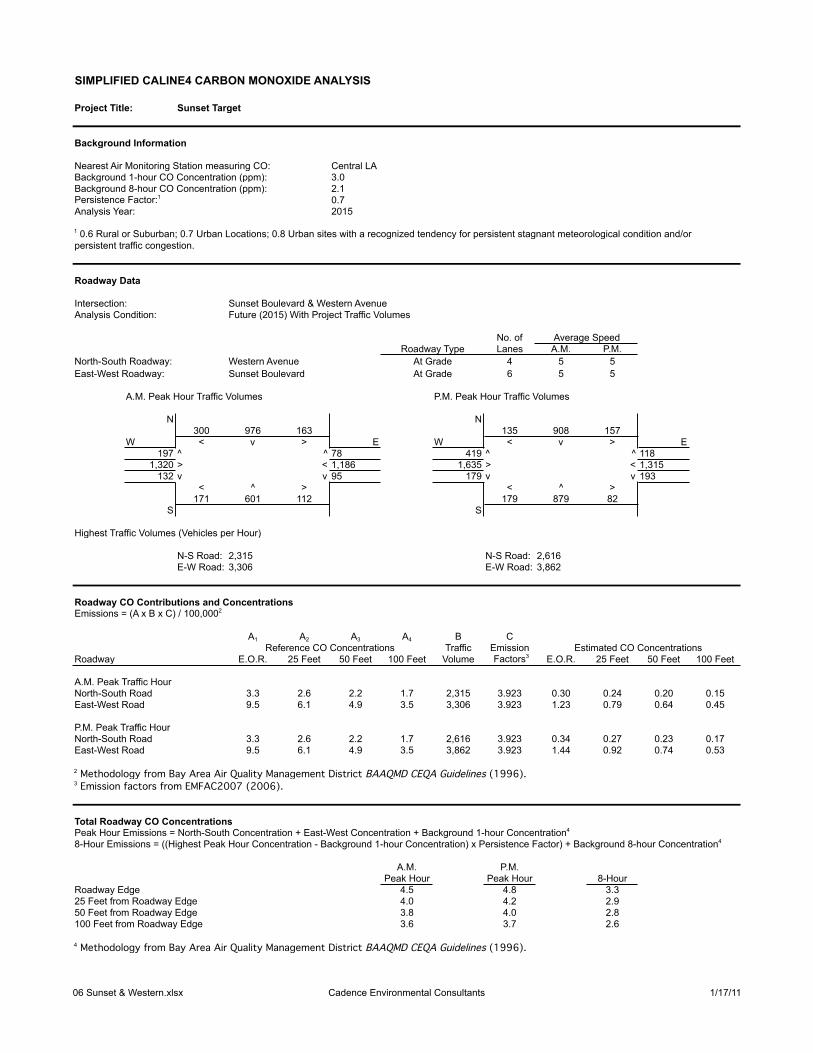
SIMPLIFIED CALINE4 CARBON MONOXIDE ANALYSIS
Project Title: Sunset Target
Background Information
Nearest Air Monitoring Station measuring CO: Central LABackground 1-hour CO Concentration (ppm): 3.0Background 8-hour CO Concentration (ppm): 2.1Persistence Factor:1 0.7Analysis Year: 2015
1 0.6 Rural or Suburban; 0.7 Urban Locations; 0.8 Urban sites with a recognized tendency for persistent stagnant meteorological condition and/or persistent traffic congestion.
Roadway Data
Intersection: Sunset Boulevard & Western AvenueAnalysis Condition: Future (2015) With Project Traffic Volumes
No. of Average SpeedRoadway Type Lanes A.M. P.M.
North-South Roadway: Western Avenue 4 5 5East-West Roadway: Sunset Boulevard 6 5 5
A.M. Peak Hour Traffic Volumes P.M. Peak Hour Traffic Volumes
N N300 976 163 135 908 157
W < v > E W < v > E197 ^ ^ 78 419 ^ ^ 118
1,320 > < 1,186 1,635 > < 1,315132 v v 95 179 v v 193
< ^ > < ^ >171 601 112 179 879 82
S S
Highest Traffic Volumes (Vehicles per Hour)
N-S Road: 2,315 N-S Road: 2,616E-W Road: 3,306 E-W Road: 3,862
Roadway CO Contributions and ConcentrationsEmissions = (A x B x C) / 100,0002
A1 A2 A3 A4 B CTraffic Emission
Roadway E.O.R. 25 Feet 50 Feet 100 Feet Volume Factors3 E.O.R. 25 Feet 50 Feet 100 Feet
A.M. Peak Traffic HourNorth-South Road 3.3 2.6 2.2 1.7 2,315 3.923 0.30 0.24 0.20 0.15East-West Road 9.5 6.1 4.9 3.5 3,306 3.923 1.23 0.79 0.64 0.45
P.M. Peak Traffic HourNorth-South Road 3.3 2.6 2.2 1.7 2,616 3.923 0.34 0.27 0.23 0.17East-West Road 9.5 6.1 4.9 3.5 3,862 3.923 1.44 0.92 0.74 0.53
2 Methodology from Bay Area Air Quality Management District BAAQMD CEQA Guidelines (1996).3 Emission factors from EMFAC2007 (2006).
Total Roadway CO ConcentrationsPeak Hour Emissions = North-South Concentration + East-West Concentration + Background 1-hour Concentration4
8-Hour Emissions = ((Highest Peak Hour Concentration - Background 1-hour Concentration) x Persistence Factor) + Background 8-hour Concentration4
A.M. P.M.Peak Hour Peak Hour 8-Hour
Roadway Edge 4.5 4.8 3.325 Feet from Roadway Edge 4.0 4.2 2.950 Feet from Roadway Edge 3.8 4.0 2.8100 Feet from Roadway Edge 3.6 3.7 2.6
4 Methodology from Bay Area Air Quality Management District BAAQMD CEQA Guidelines (1996).
Estimated CO ConcentrationsReference CO Concentrations
At GradeAt Grade

22 Sunset & St Andrews.xlsx Cadence Environmental Consultants 1/17/11
SIMPLIFIED CALINE4 CARBON MONOXIDE ANALYSIS
Project Title: Sunset Target
Background Information
Nearest Air Monitoring Station measuring CO: Central LABackground 1-hour CO Concentration (ppm): 3.0Background 8-hour CO Concentration (ppm): 2.1Persistence Factor:1 0.7Analysis Year: 2015
1 0.6 Rural or Suburban; 0.7 Urban Locations; 0.8 Urban sites with a recognized tendency for persistent stagnant meteorological condition and/or persistent traffic congestion.
Roadway Data
Intersection: Sunset Boulevard & St. Andrews PlaceAnalysis Condition: Future (2015) With Project Traffic Volumes
No. of Average SpeedRoadway Type Lanes A.M. P.M.
North-South Roadway: St. Andrews Place 2 5 5East-West Roadway: Sunset Boulevard 6 5 5
A.M. Peak Hour Traffic Volumes P.M. Peak Hour Traffic Volumes
N N128 4 8 126 15 23
W < v > E W < v > E75 ^ ^ 60 86 ^ ^ 60
1,574 > < 1,483 2,140 > < 1,484101 v v 74 111 v v 105
< ^ > < ^ >237 39 81 272 22 154
S S
Highest Traffic Volumes (Vehicles per Hour)
N-S Road: 536 N-S Road: 679E-W Road: 3,598 E-W Road: 4,219
Roadway CO Contributions and ConcentrationsEmissions = (A x B x C) / 100,0002
A1 A2 A3 A4 B CTraffic Emission
Roadway E.O.R. 25 Feet 50 Feet 100 Feet Volume Factors3 E.O.R. 25 Feet 50 Feet 100 Feet
A.M. Peak Traffic HourNorth-South Road 3.7 2.7 2.2 1.7 536 3.923 0.08 0.06 0.05 0.04East-West Road 9.5 6.1 4.9 3.5 3,598 3.923 1.34 0.86 0.69 0.49
P.M. Peak Traffic HourNorth-South Road 3.7 2.7 2.2 1.7 679 3.923 0.10 0.07 0.06 0.05East-West Road 9.5 6.1 4.9 3.5 4,219 3.923 1.57 1.01 0.81 0.58
2 Methodology from Bay Area Air Quality Management District BAAQMD CEQA Guidelines (1996).3 Emission factors from EMFAC2007 (2006).
Total Roadway CO ConcentrationsPeak Hour Emissions = North-South Concentration + East-West Concentration + Background 1-hour Concentration4
8-Hour Emissions = ((Highest Peak Hour Concentration - Background 1-hour Concentration) x Persistence Factor) + Background 8-hour Concentration4
A.M. P.M.Peak Hour Peak Hour 8-Hour
Roadway Edge 4.4 4.7 3.325 Feet from Roadway Edge 3.9 4.1 2.950 Feet from Roadway Edge 3.7 3.9 2.7100 Feet from Roadway Edge 3.5 3.6 2.5
4 Methodology from Bay Area Air Quality Management District BAAQMD CEQA Guidelines (1996).
Estimated CO ConcentrationsReference CO Concentrations
At GradeAt Grade

09 Western & De Longpre.xlsx Cadence Environmental Consultants 1/17/11
SIMPLIFIED CALINE4 CARBON MONOXIDE ANALYSIS
Project Title: Sunset Target
Background Information
Nearest Air Monitoring Station measuring CO: Central LABackground 1-hour CO Concentration (ppm): 3.0Background 8-hour CO Concentration (ppm): 2.1Persistence Factor:1 0.7Analysis Year: 2015
1 0.6 Rural or Suburban; 0.7 Urban Locations; 0.8 Urban sites with a recognized tendency for persistent stagnant meteorological condition and/or persistent traffic congestion.
Roadway Data
Intersection: Western Avenue & De Longpre AvenueAnalysis Condition: Future (2015) With Project Traffic Volumes
No. of Average SpeedRoadway Type Lanes A.M. P.M.
North-South Roadway: Western Avenue 4 5 5East-West Roadway: De Longpre Avenue 2 5 5
A.M. Peak Hour Traffic Volumes P.M. Peak Hour Traffic Volumes
N N25 1,176 0 17 1,168 0
W < v > E W < v > E13 ^ ^ 0 91 ^ ^ 00 > < 0 0 > < 0
85 v v 0 150 v v 0< ^ > < ^ >85 813 0 140 1,154 0
S S
Highest Traffic Volumes (Vehicles per Hour)
N-S Road: 2,159 N-S Road: 2,612E-W Road: 208 E-W Road: 398
Roadway CO Contributions and ConcentrationsEmissions = (A x B x C) / 100,0002
A1 A2 A3 A4 B CTraffic Emission
Roadway E.O.R. 25 Feet 50 Feet 100 Feet Volume Factors3 E.O.R. 25 Feet 50 Feet 100 Feet
A.M. Peak Traffic HourNorth-South Road 11.9 7.0 5.4 3.8 2,159 3.923 1.01 0.59 0.46 0.32East-West Road 3.7 2.7 2.2 1.7 208 3.923 0.03 0.02 0.02 0.01
P.M. Peak Traffic HourNorth-South Road 11.9 7.0 5.4 3.8 2,612 3.923 1.22 0.72 0.55 0.39East-West Road 3.7 2.7 2.2 1.7 398 3.923 0.06 0.04 0.03 0.03
2 Methodology from Bay Area Air Quality Management District BAAQMD CEQA Guidelines (1996).3 Emission factors from EMFAC2007 (2006).
Total Roadway CO ConcentrationsPeak Hour Emissions = North-South Concentration + East-West Concentration + Background 1-hour Concentration4
8-Hour Emissions = ((Highest Peak Hour Concentration - Background 1-hour Concentration) x Persistence Factor) + Background 8-hour Concentration4
A.M. P.M.Peak Hour Peak Hour 8-Hour
Roadway Edge 4.0 4.3 3.025 Feet from Roadway Edge 3.6 3.8 2.650 Feet from Roadway Edge 3.5 3.6 2.5100 Feet from Roadway Edge 3.3 3.4 2.4
4 Methodology from Bay Area Air Quality Management District BAAQMD CEQA Guidelines (1996).
Estimated CO ConcentrationsReference CO Concentrations
At GradeAt Grade
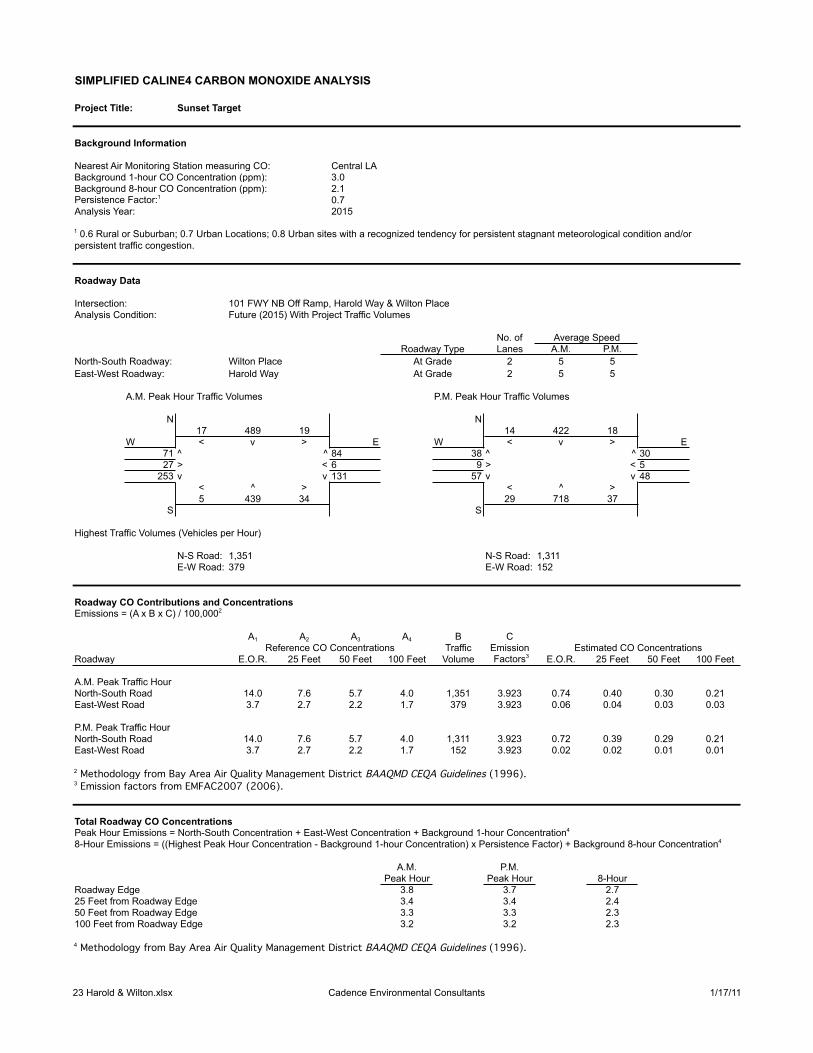
23 Harold & Wilton.xlsx Cadence Environmental Consultants 1/17/11
SIMPLIFIED CALINE4 CARBON MONOXIDE ANALYSIS
Project Title: Sunset Target
Background Information
Nearest Air Monitoring Station measuring CO: Central LABackground 1-hour CO Concentration (ppm): 3.0Background 8-hour CO Concentration (ppm): 2.1Persistence Factor:1 0.7Analysis Year: 2015
1 0.6 Rural or Suburban; 0.7 Urban Locations; 0.8 Urban sites with a recognized tendency for persistent stagnant meteorological condition and/or persistent traffic congestion.
Roadway Data
Intersection: 101 FWY NB Off Ramp, Harold Way & Wilton PlaceAnalysis Condition: Future (2015) With Project Traffic Volumes
No. of Average SpeedRoadway Type Lanes A.M. P.M.
North-South Roadway: Wilton Place 2 5 5East-West Roadway: Harold Way 2 5 5
A.M. Peak Hour Traffic Volumes P.M. Peak Hour Traffic Volumes
N N17 489 19 14 422 18
W < v > E W < v > E71 ^ ^ 84 38 ^ ^ 3027 > < 6 9 > < 5
253 v v 131 57 v v 48< ^ > < ^ >5 439 34 29 718 37
S S
Highest Traffic Volumes (Vehicles per Hour)
N-S Road: 1,351 N-S Road: 1,311E-W Road: 379 E-W Road: 152
Roadway CO Contributions and ConcentrationsEmissions = (A x B x C) / 100,0002
A1 A2 A3 A4 B CTraffic Emission
Roadway E.O.R. 25 Feet 50 Feet 100 Feet Volume Factors3 E.O.R. 25 Feet 50 Feet 100 Feet
A.M. Peak Traffic HourNorth-South Road 14.0 7.6 5.7 4.0 1,351 3.923 0.74 0.40 0.30 0.21East-West Road 3.7 2.7 2.2 1.7 379 3.923 0.06 0.04 0.03 0.03
P.M. Peak Traffic HourNorth-South Road 14.0 7.6 5.7 4.0 1,311 3.923 0.72 0.39 0.29 0.21East-West Road 3.7 2.7 2.2 1.7 152 3.923 0.02 0.02 0.01 0.01
2 Methodology from Bay Area Air Quality Management District BAAQMD CEQA Guidelines (1996).3 Emission factors from EMFAC2007 (2006).
Total Roadway CO ConcentrationsPeak Hour Emissions = North-South Concentration + East-West Concentration + Background 1-hour Concentration4
8-Hour Emissions = ((Highest Peak Hour Concentration - Background 1-hour Concentration) x Persistence Factor) + Background 8-hour Concentration4
A.M. P.M.Peak Hour Peak Hour 8-Hour
Roadway Edge 3.8 3.7 2.725 Feet from Roadway Edge 3.4 3.4 2.450 Feet from Roadway Edge 3.3 3.3 2.3100 Feet from Roadway Edge 3.2 3.2 2.3
4 Methodology from Bay Area Air Quality Management District BAAQMD CEQA Guidelines (1996).
Estimated CO ConcentrationsReference CO Concentrations
At GradeAt Grade


![Detecting Carbon Monoxide Poisoning Detecting Carbon ...2].pdf · Detecting Carbon Monoxide Poisoning Detecting Carbon Monoxide Poisoning. Detecting Carbon Monoxide Poisoning C arbon](https://static.fdocuments.net/doc/165x107/5f551747b859172cd56bb119/detecting-carbon-monoxide-poisoning-detecting-carbon-2pdf-detecting-carbon.jpg)