Simpler Industrial and Business Process...
44
www.lifetime-reliability.com 1 Simpler Industrial and Business Process Redesign. By Mike Sondalini Lifetime Reliability Solutions Electrical Engineering Technical Division
Transcript of Simpler Industrial and Business Process...
www.lifetime-reliability.com 1
Simpler Industrial and Business Process Redesign.
By
Mike Sondalini
Lifetime Reliability Solutions
Electrical Engineering Technical Division
www.lifetime-reliability.com 2
Biography
Qualifications: Tradesman Fitter Machinist
Professional Mechanical Engineer (1st Class Honours) Project Engineer
Maintenance Engineer Master Business Administration
Maintenance Manager
Engineering and Business Work History:
Nova Machinery – Manufacturer Press Brakes & Guillotines
Swan Brewery – Beverage
Riverton Engineering – Sheet Metal Fabrication
Coogee Chemicals – Mining & Agricultural Chemicals Manufacture
Lifetime Reliability Solutions – Lean, Life Cycle Asset Management, ISO 9001 Quality Consulting
www.lifetime-reliability.com 3
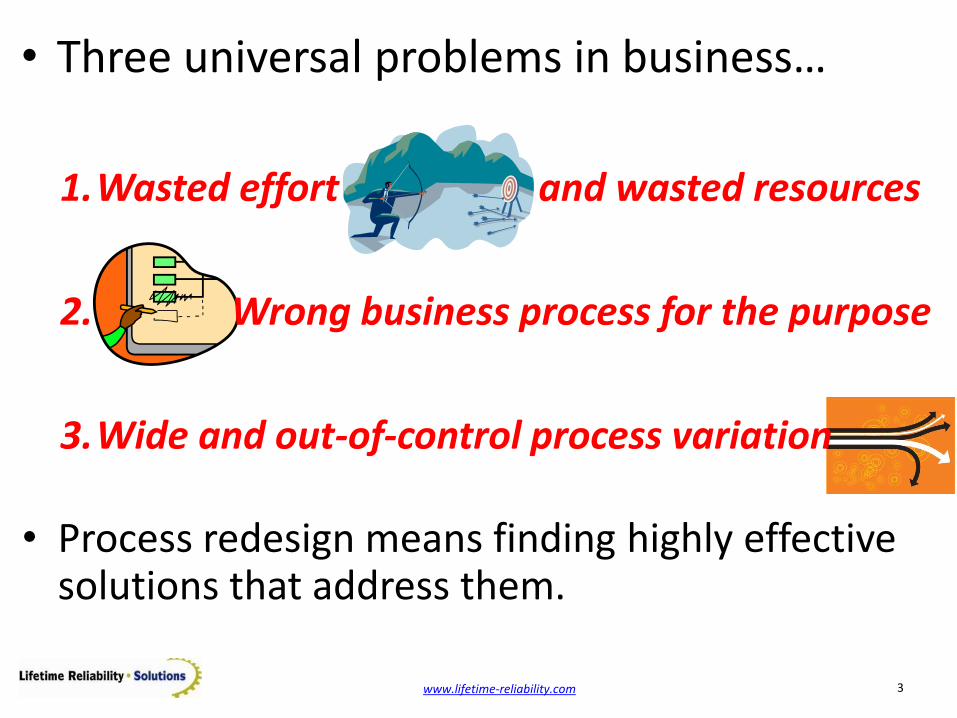
• Three universal problems in business…
1.Wasted effort and wasted resources
2. Wrong business process for the purpose
3.Wide and out-of-control process variation
• Process redesign means finding highly effective solutions that address them.
www.lifetime-reliability.com 4
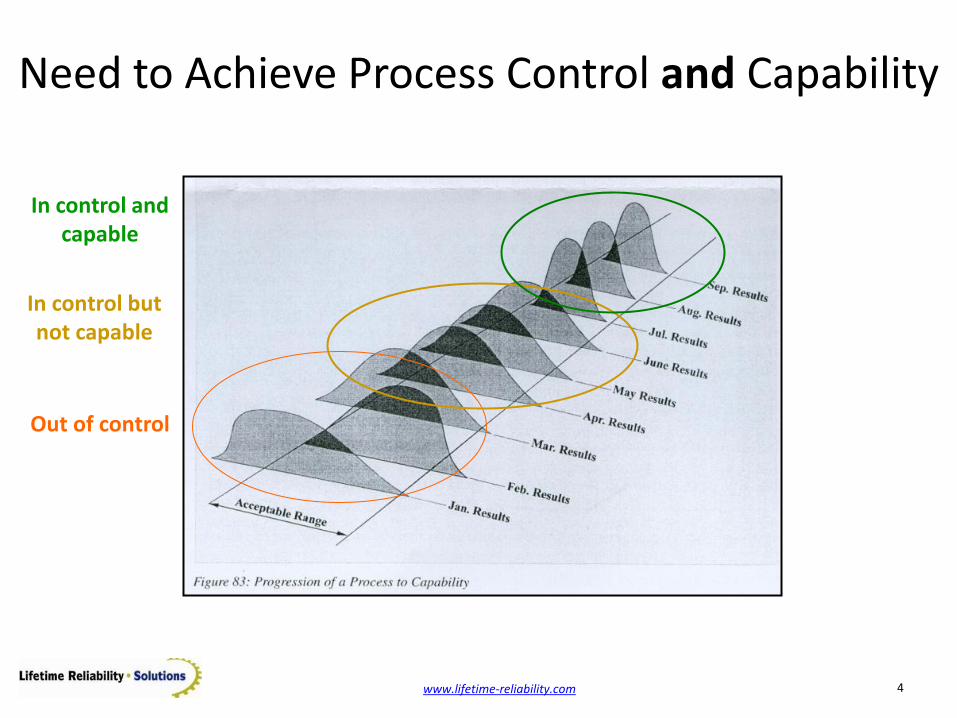
Need to Achieve Process Control and Capability
Out of control
In control but not capable
In control and capable
www.lifetime-reliability.com 5
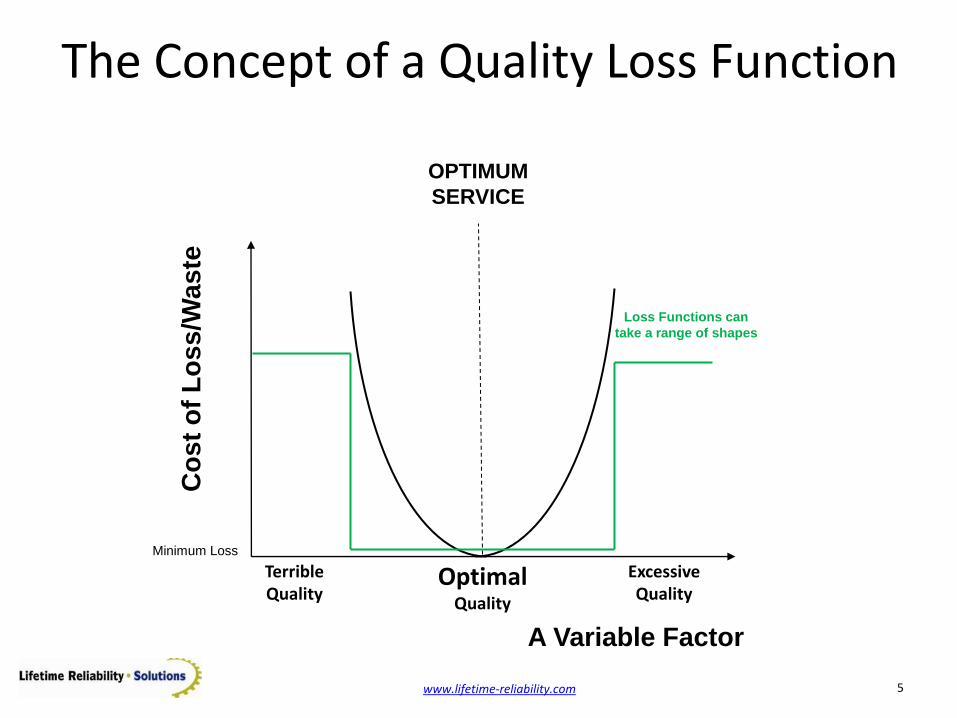
The Concept of a Quality Loss Function
Minimum Loss
A Variable Factor
Co
st
of
Lo
ss
/Wa
ste
OPTIMUM
SERVICE
Loss Functions can
take a range of shapes
Optimal Quality
Excessive Quality
Terrible Quality
www.lifetime-reliability.com 6
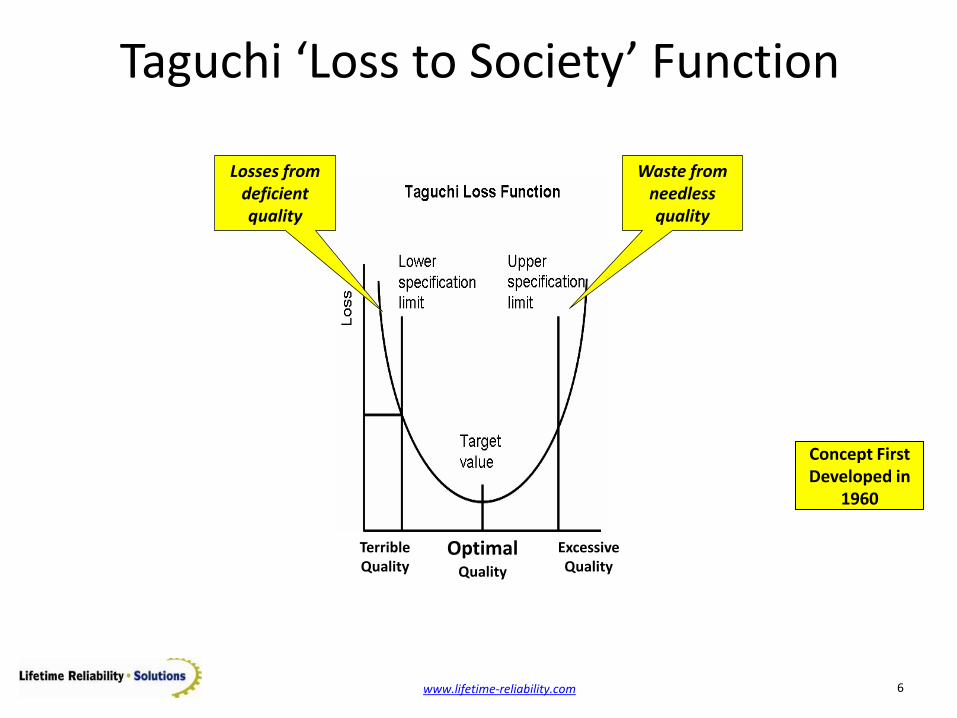
Taguchi ‘Loss to Society’ Function
Waste from needless quality
Losses from deficient quality
Optimal Quality
Excessive Quality
Concept First Developed in
1960
Terrible Quality
www.lifetime-reliability.com 7
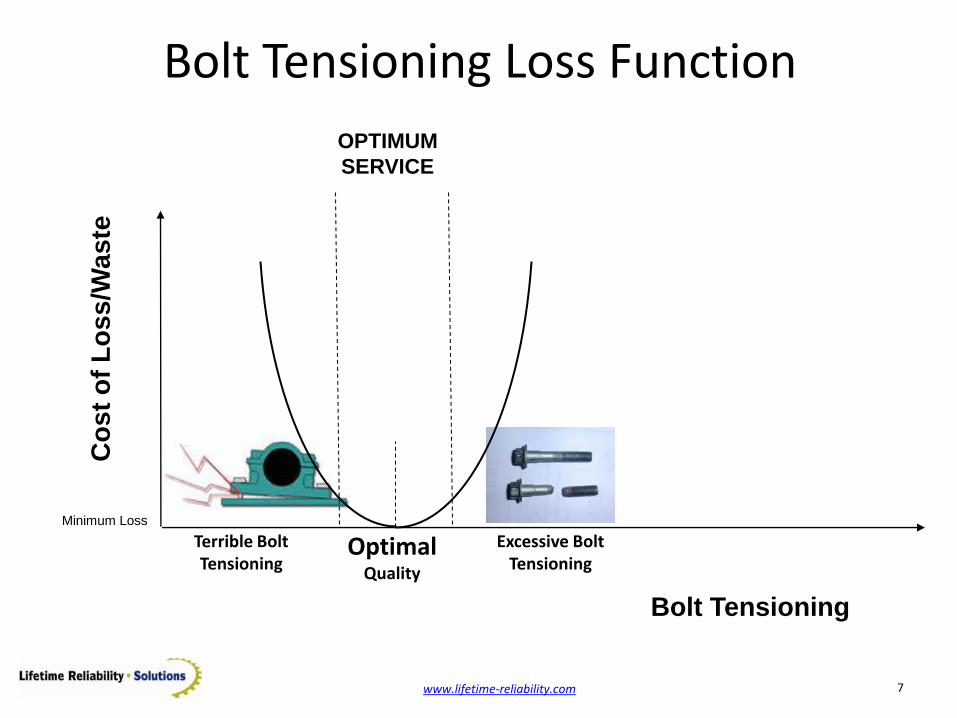
Bolt Tensioning Loss Function
Minimum Loss
Bolt Tensioning
Co
st
of
Lo
ss
/Wa
ste
OPTIMUM
SERVICE
Optimal Quality
Excessive Bolt Tensioning
Terrible Bolt Tensioning
www.lifetime-reliability.com 8
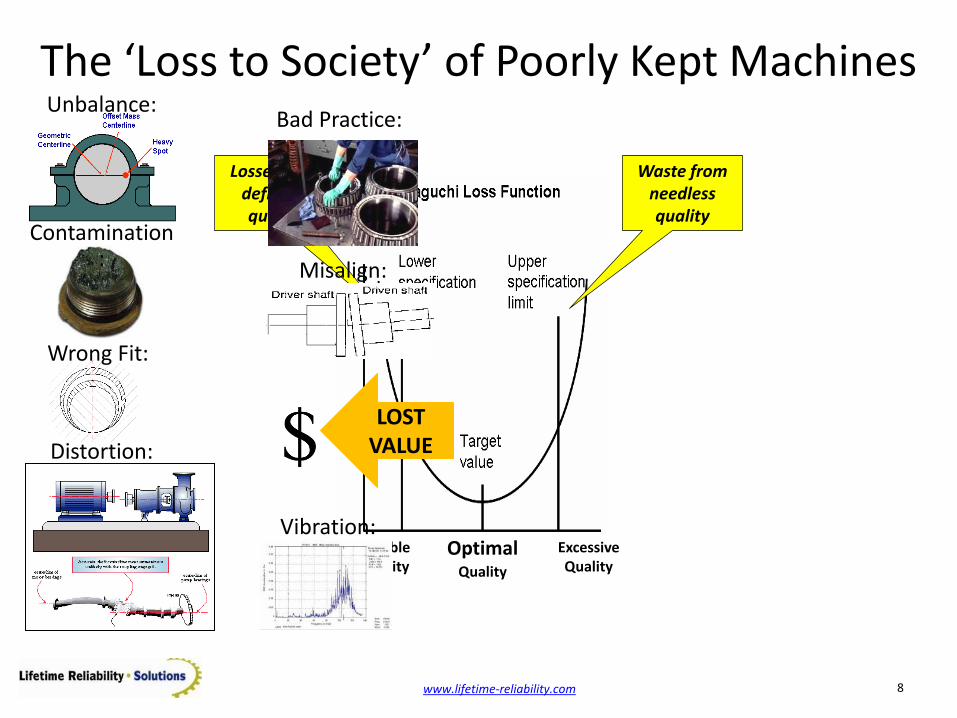
The ‘Loss to Society’ of Poorly Kept Machines
Waste from needless quality
Losses from deficient quality
Optimal Quality
Excessive Quality
Terrible Quality
Unbalance:
Contamination:
Wrong Fit:
Distortion:
Misalign:
Bad Practice:
Vibration:
LOST VALUE
www.lifetime-reliability.com 9
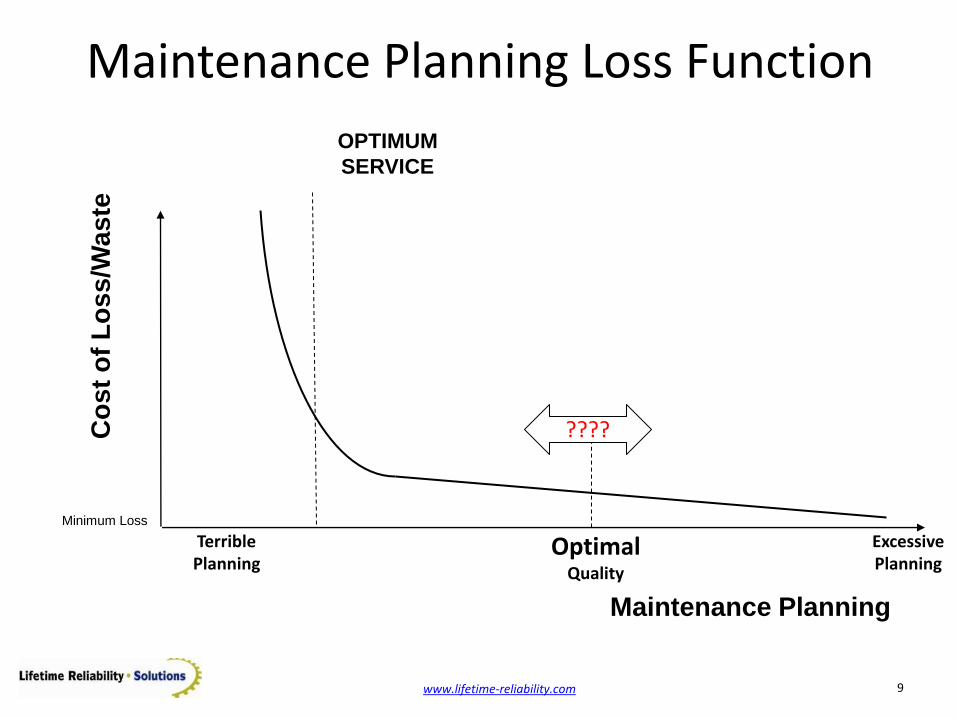
Maintenance Planning Loss Function
Minimum Loss
Maintenance Planning
Co
st
of
Lo
ss
/Wa
ste
OPTIMUM
SERVICE
Optimal Quality
Excessive Planning
Terrible Planning
????
www.lifetime-reliability.com 10
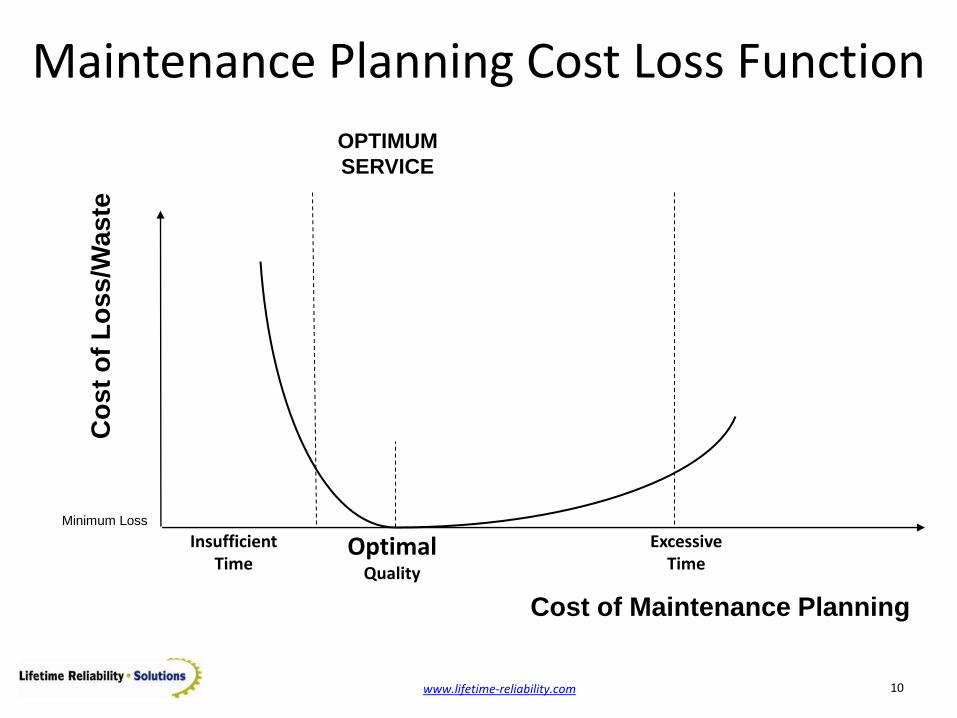
Maintenance Planning Cost Loss Function
Minimum Loss
Cost of Maintenance Planning
Co
st
of
Lo
ss
/Wa
ste
OPTIMUM
SERVICE
Optimal Quality
Excessive Time
Insufficient Time
www.lifetime-reliability.com 11
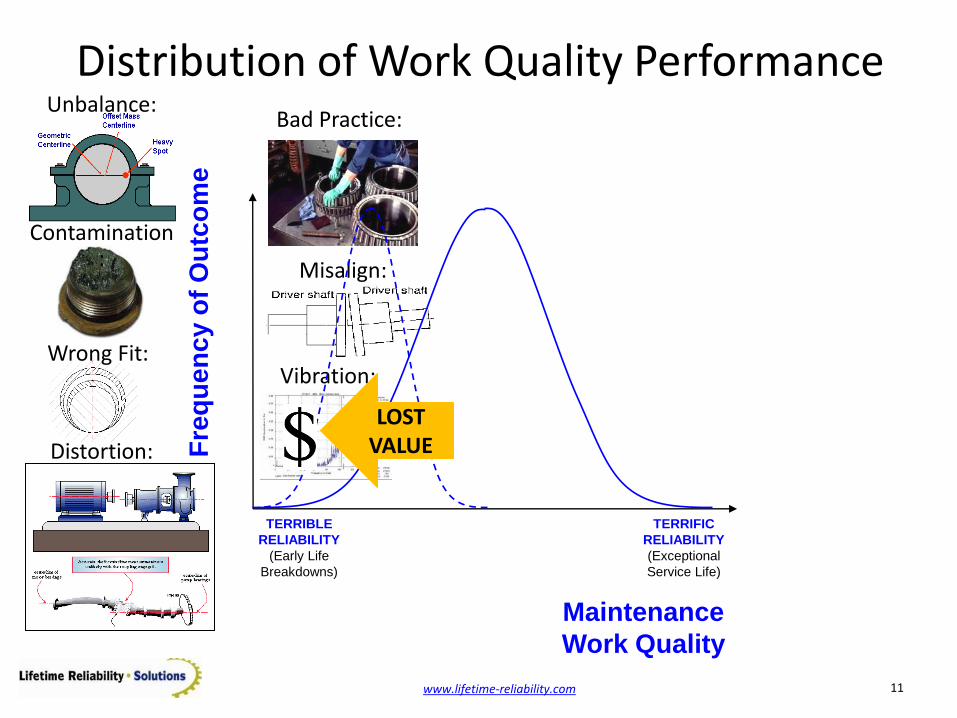
Distribution of Work Quality Performance
Maintenance
Work Quality
Fre
qu
en
cy o
f O
utc
om
e
TERRIBLE
RELIABILITY
(Early Life
Breakdowns)
TERRIFIC
RELIABILITY
(Exceptional
Service Life)
Unbalance:
Contamination:
Wrong Fit:
Distortion:
Misalign:
Bad Practice:
Vibration:
LOST VALUE
www.lifetime-reliability.com 12
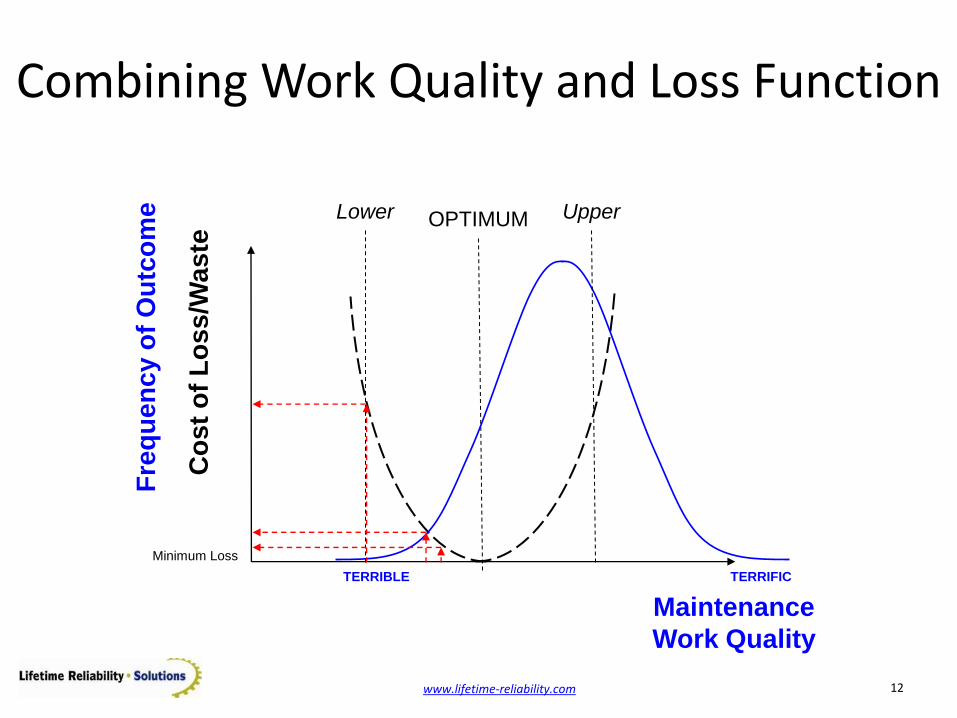
Combining Work Quality and Loss Function
Minimum Loss
Co
st
of
Lo
ss
/Wa
ste
OPTIMUM
TERRIBLE TERRIFIC
Maintenance
Work Quality
Fre
qu
en
cy o
f O
utc
om
e
Lower Upper
www.lifetime-reliability.com 13
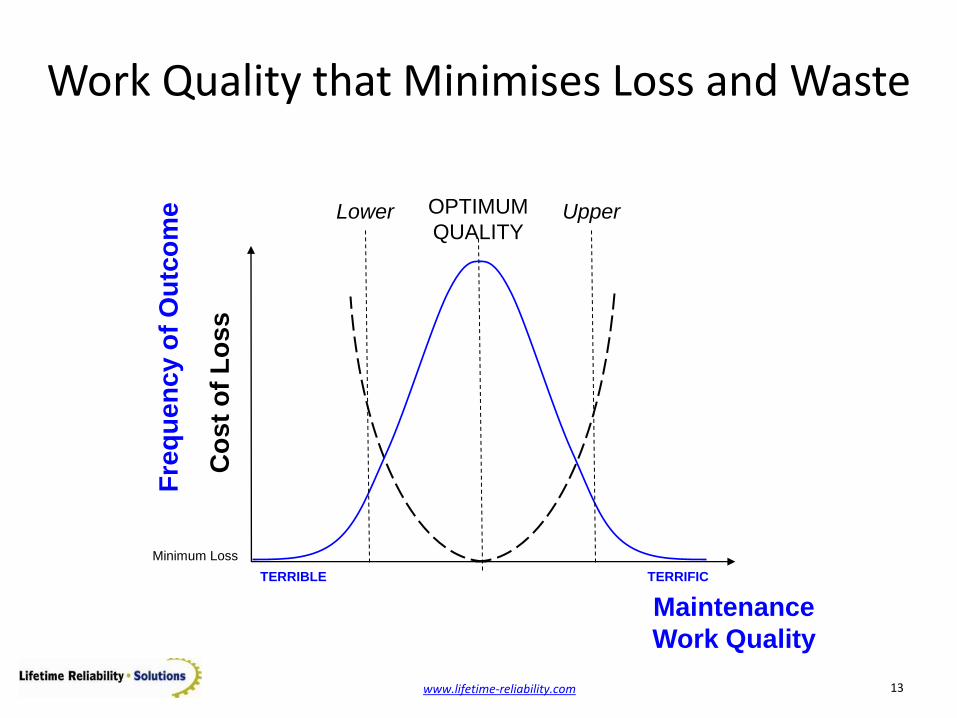
Work Quality that Minimises Loss and Waste
Minimum Loss
Co
st
of
Lo
ss
OPTIMUM
QUALITY
TERRIBLE TERRIFIC
Maintenance
Work Quality
Fre
qu
en
cy o
f O
utc
om
e
Lower Upper
www.lifetime-reliability.com 14
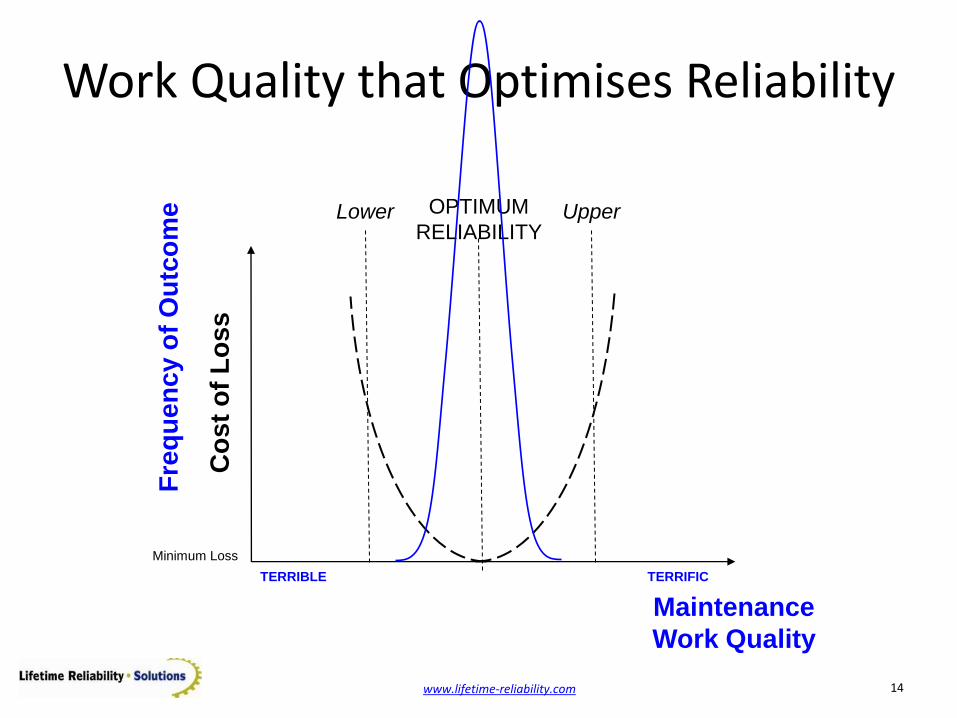
Work Quality that Optimises Reliability
Minimum Loss
Co
st
of
Lo
ss
OPTIMUM
RELIABILITY
Maintenance
Work Quality
Fre
qu
en
cy o
f O
utc
om
e
Lower Upper
TERRIBLE TERRIFIC
www.lifetime-reliability.com 15
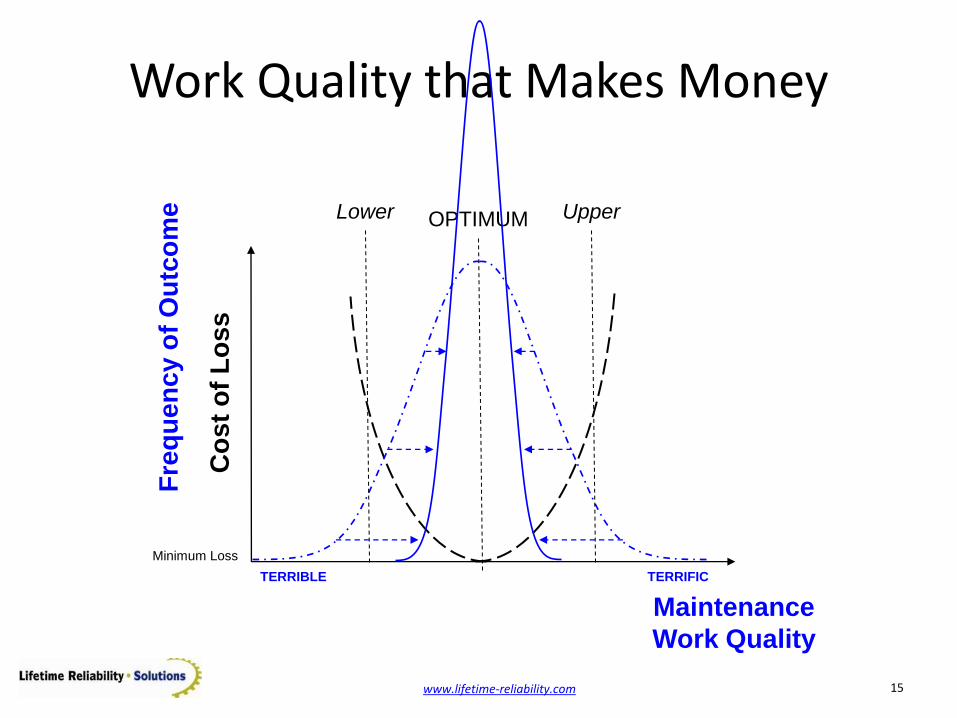
Work Quality that Makes Money
Minimum Loss
Co
st
of
Lo
ss
OPTIMUM
TERRIBLE TERRIFIC
Maintenance
Work Quality
Fre
qu
en
cy o
f O
utc
om
e
Lower Upper
www.lifetime-reliability.com 16
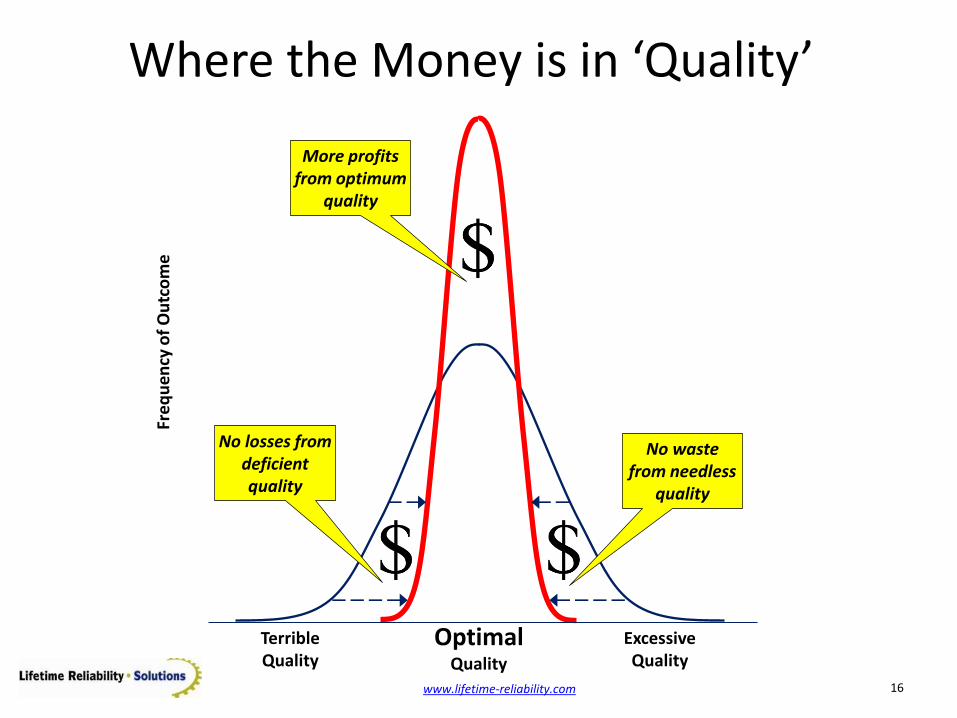
Where the Money is in ‘Quality’
Excessive Quality
Terrible Quality
No waste from needless
quality
No losses from deficient quality
More profits from optimum
quality
Optimal Quality
Fre
qu
ency
of
Ou
tco
me
www.lifetime-reliability.com 17
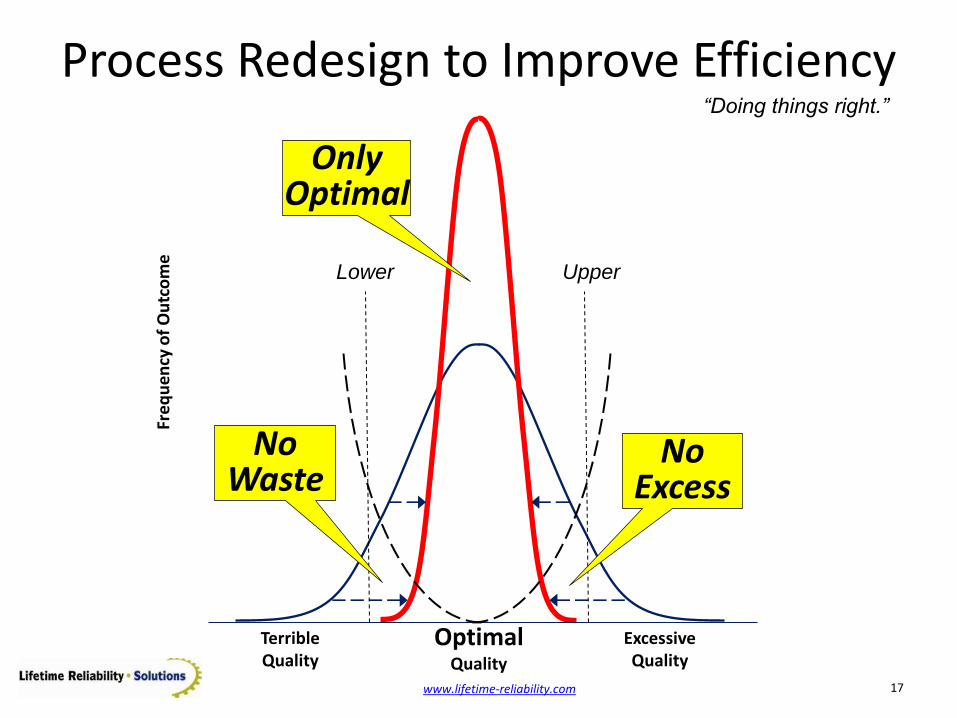
Process Redesign to Improve Efficiency
Excessive Quality
Terrible Quality
Optimal Quality
Lower Upper
Fre
qu
ency
of
Ou
tco
me
No Excess
No Waste
Only Optimal
“Doing things right.”
www.lifetime-reliability.com 18
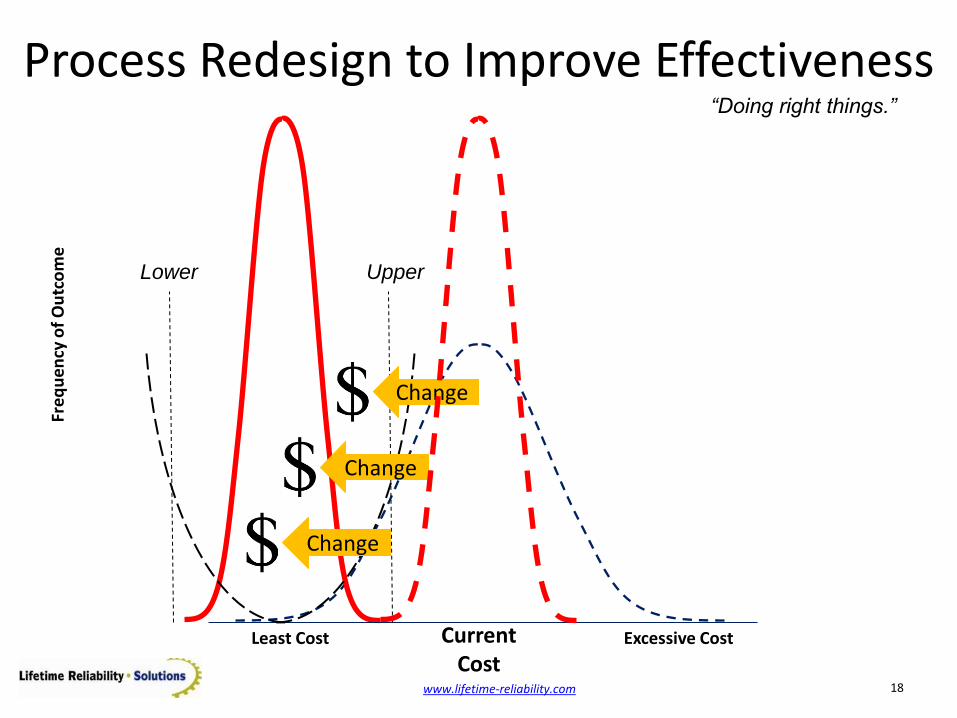
Process Redesign to Improve Effectiveness
Excessive Cost Least Cost Current Cost
Lower Upper
Fre
qu
ency
of
Ou
tco
me
Change
Change
Change
“Doing right things.”
www.lifetime-reliability.com 19
No of Cycles
No
of
Failu
res
1 2 3 4 5 6 7 8 9 10
11
12
13
14
15
16
17
18
19
20
21
22
23
24
25
26
27
28
29
30
31
32
33
34
35
36
37
38
39
40
1
2
3
4
5
6
7
8
9
0
10
11
12
13
14
41
42
43
44
45
46
47
48
49
50
51
52
53
54
55
56
57
58
59
60
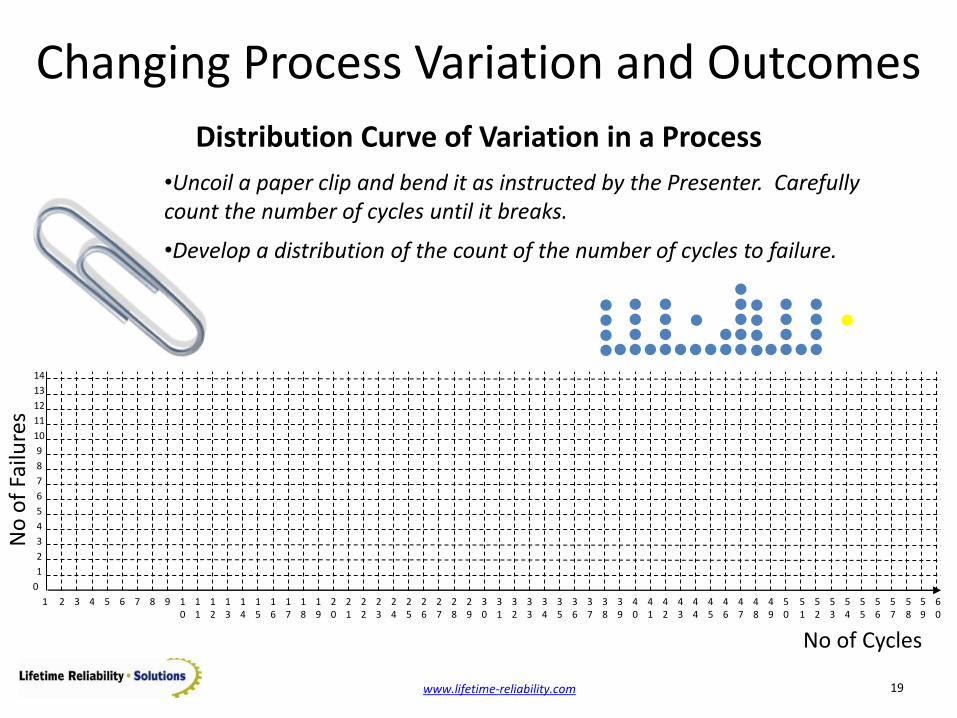
Distribution Curve of Variation in a Process
•Develop a distribution of the count of the number of cycles to failure.
Changing Process Variation and Outcomes
•Uncoil a paper clip and bend it as instructed by the Presenter. Carefully count the number of cycles until it breaks.
www.lifetime-reliability.com 20
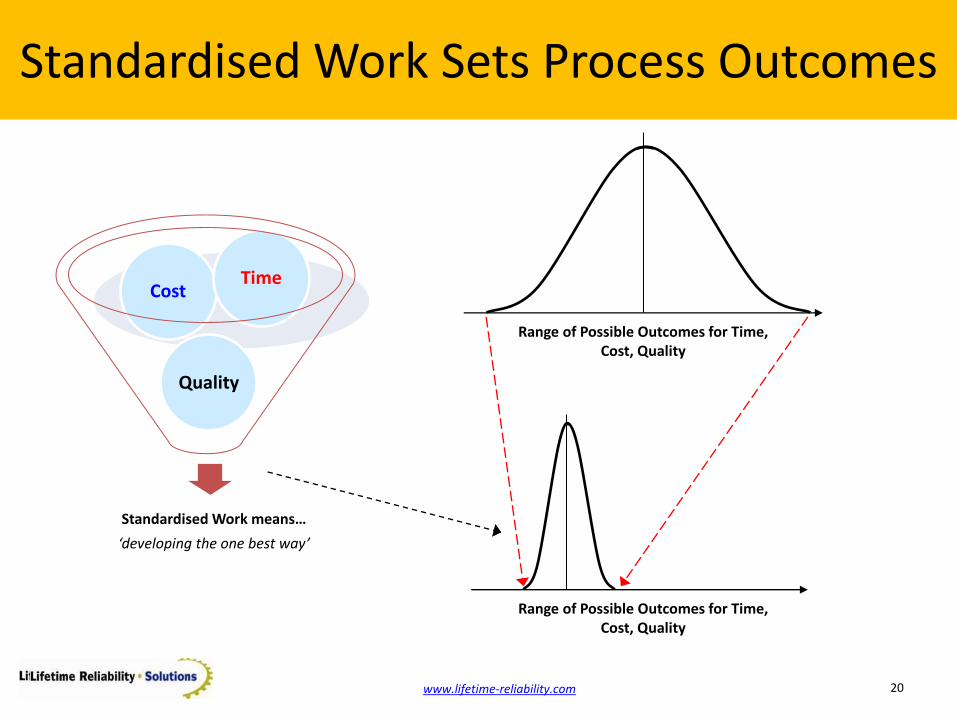
Standardised Work Sets Process Outcomes
Standardised Work means…
‘developing the one best way’
Quality
Cost Time
Range of Possible Outcomes for Time, Cost, Quality
Range of Possible Outcomes for Time, Cost, Quality

www.lifetime-reliability.com 21
We all need clear Targets that we can SEE.
How do You know You have got full marks?
www.lifetime-reliability.com 22
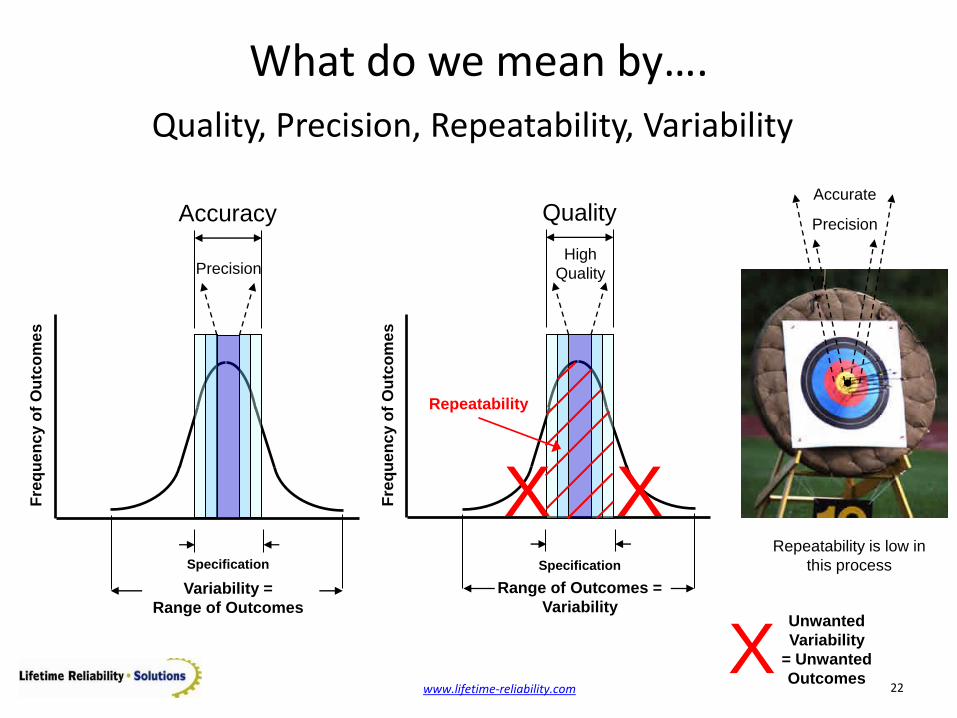
What do we mean by…. F
req
uen
cy o
f O
utc
om
es
Variability =
Range of Outcomes
Specification
Precision
Accuracy
Fre
qu
en
cy o
f O
utc
om
es
Range of Outcomes =
Variability
Specification
High
Quality
Quality
Repeatability
Quality, Precision, Repeatability, Variability
Precision
Accurate
Repeatability is low in
this process
Unwanted
Variability
= Unwanted
Outcomes
X X
X
www.lifetime-reliability.com 23
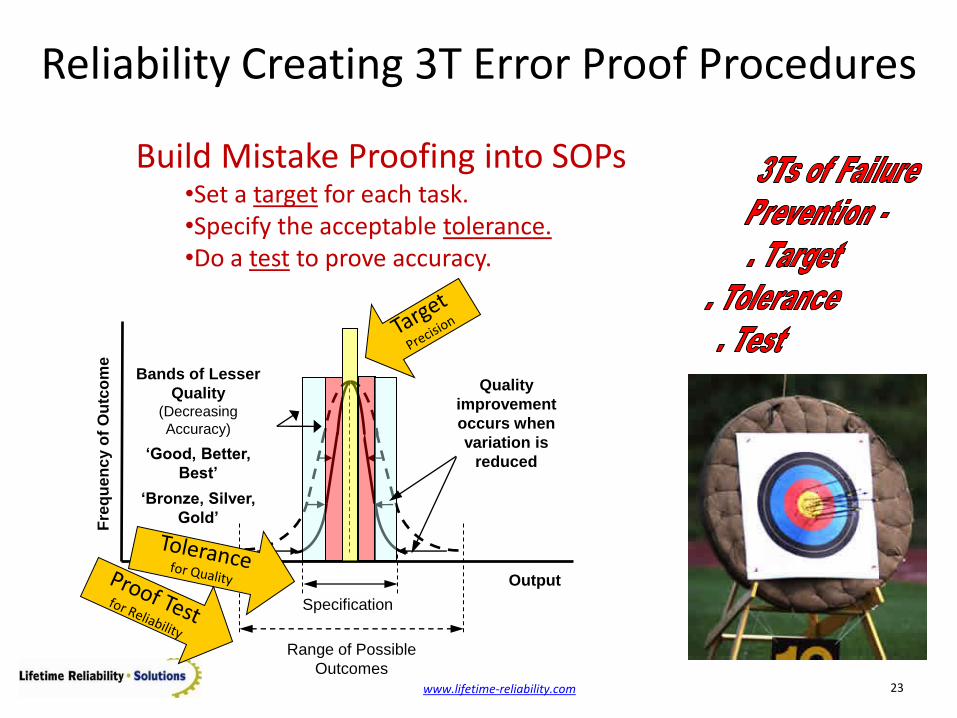
Reliability Creating 3T Error Proof Procedures
Build Mistake Proofing into SOPs •Set a target for each task. •Specify the acceptable tolerance. •Do a test to prove accuracy.
Fre
qu
en
cy o
f O
utc
om
e
Output
Range of Possible
Outcomes
Quality
improvement
occurs when
variation is
reduced
Specification
Bands of Lesser
Quality (Decreasing
Accuracy)
‘Good, Better,
Best’
‘Bronze, Silver,
Gold’
www.lifetime-reliability.com 24
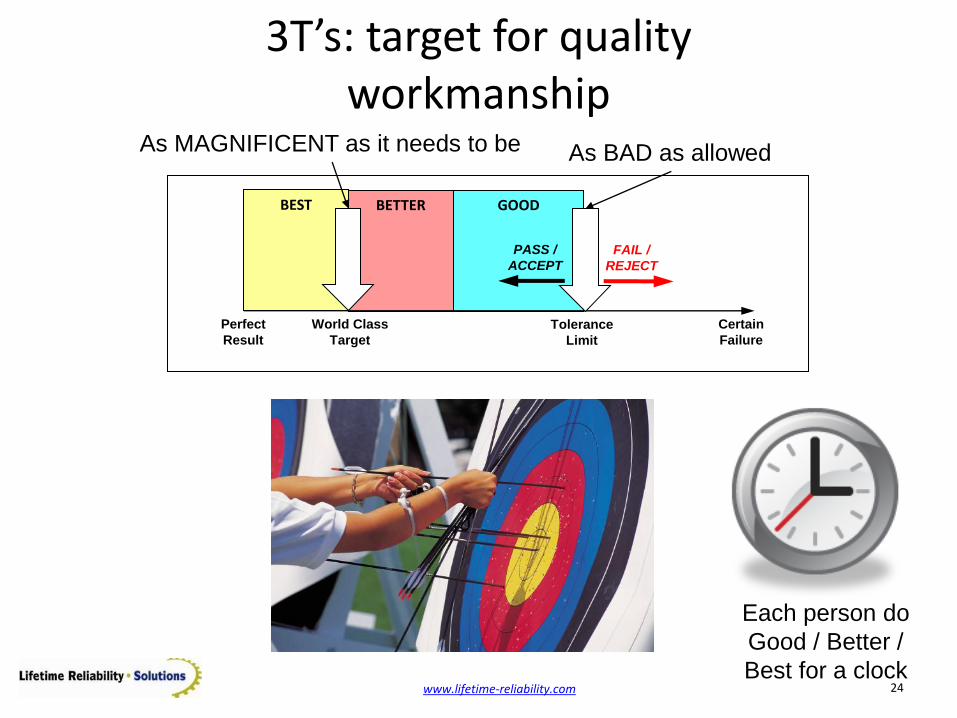
3T’s: target for quality workmanship
GOOD BETTER BEST
Perfect
Result
World Class
Target
Certain
Failure
Tolerance
Limit
PASS /
ACCEPT
FAIL /
REJECT
As BAD as allowed As MAGNIFICENT as it needs to be
Each person do
Good / Better /
Best for a clock
www.lifetime-reliability.com 25
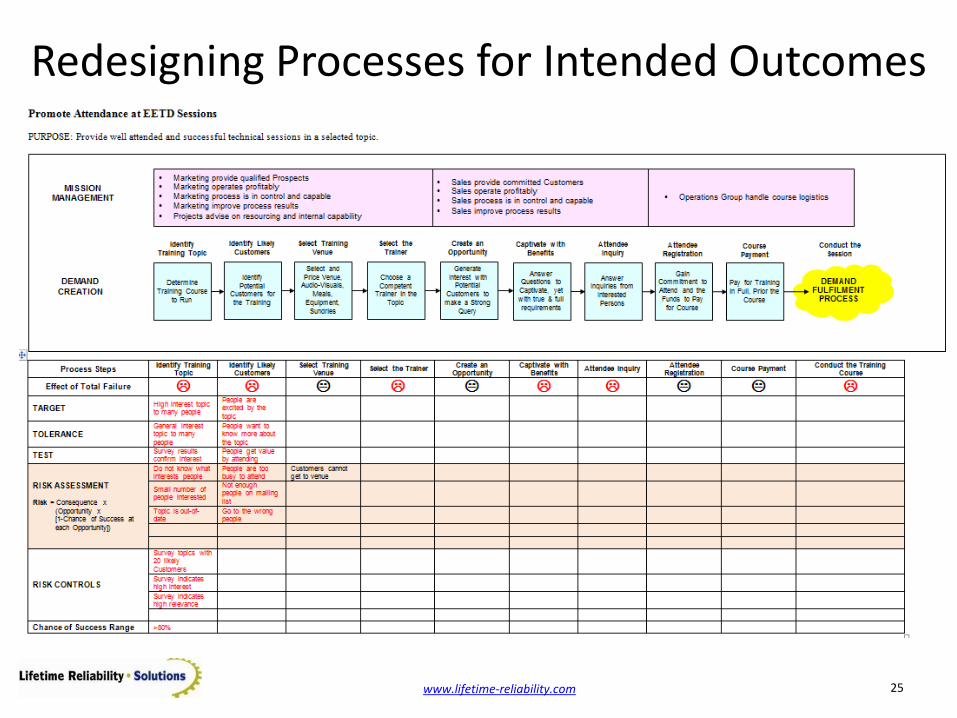
Redesigning Processes for Intended Outcomes
www.lifetime-reliability.com 26
Lean and Six Sigma fails Business when they are used for point solutions. For lasting
success you need systemic solutions.
www.lifetime-reliability.com 27
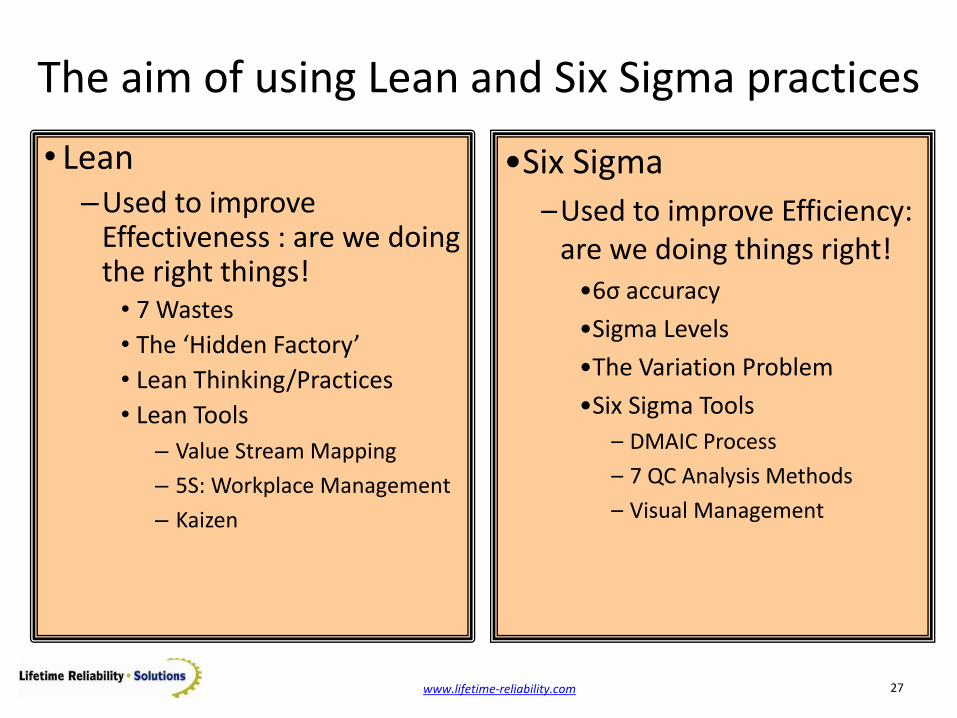
• Lean –Used to improve
Effectiveness : are we doing the right things! • 7 Wastes
• The ‘Hidden Factory’
• Lean Thinking/Practices
• Lean Tools
– Value Stream Mapping
– 5S: Workplace Management
– Kaizen
•Six Sigma
–Used to improve Efficiency: are we doing things right!
•6σ accuracy
•Sigma Levels
•The Variation Problem
•Six Sigma Tools
– DMAIC Process
– 7 QC Analysis Methods
– Visual Management
The aim of using Lean and Six Sigma practices
www.lifetime-reliability.com 28
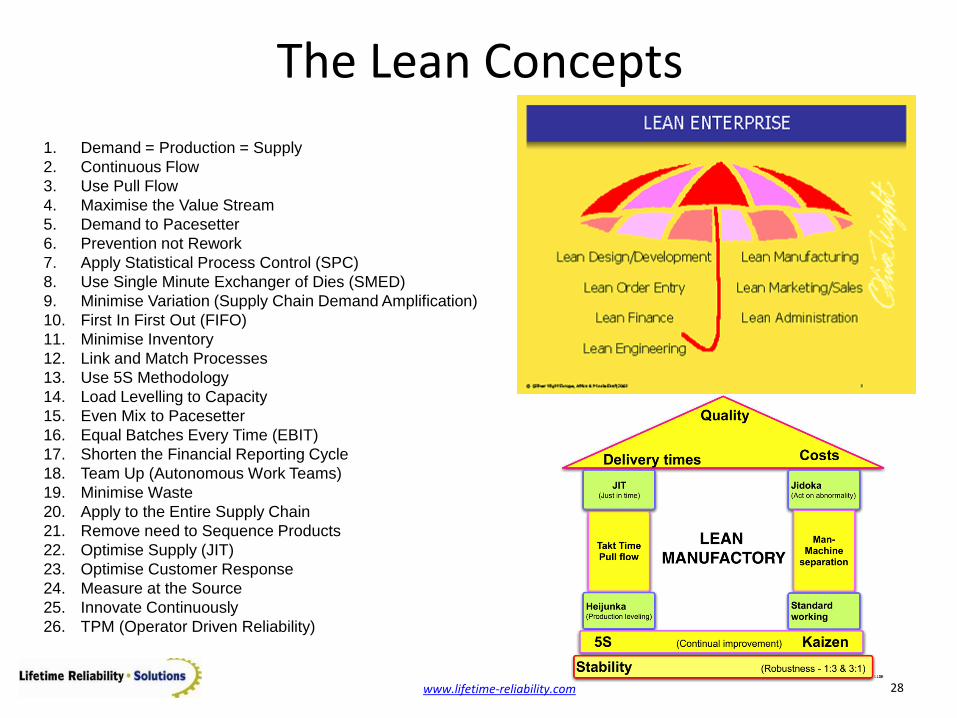
The Lean Concepts
1. Demand = Production = Supply
2. Continuous Flow
3. Use Pull Flow
4. Maximise the Value Stream
5. Demand to Pacesetter
6. Prevention not Rework
7. Apply Statistical Process Control (SPC)
8. Use Single Minute Exchanger of Dies (SMED)
9. Minimise Variation (Supply Chain Demand Amplification)
10. First In First Out (FIFO)
11. Minimise Inventory
12. Link and Match Processes
13. Use 5S Methodology
14. Load Levelling to Capacity
15. Even Mix to Pacesetter
16. Equal Batches Every Time (EBIT)
17. Shorten the Financial Reporting Cycle
18. Team Up (Autonomous Work Teams)
19. Minimise Waste
20. Apply to the Entire Supply Chain
21. Remove need to Sequence Products
22. Optimise Supply (JIT)
23. Optimise Customer Response
24. Measure at the Source
25. Innovate Continuously
26. TPM (Operator Driven Reliability)
www.lifetime-reliability.com 29
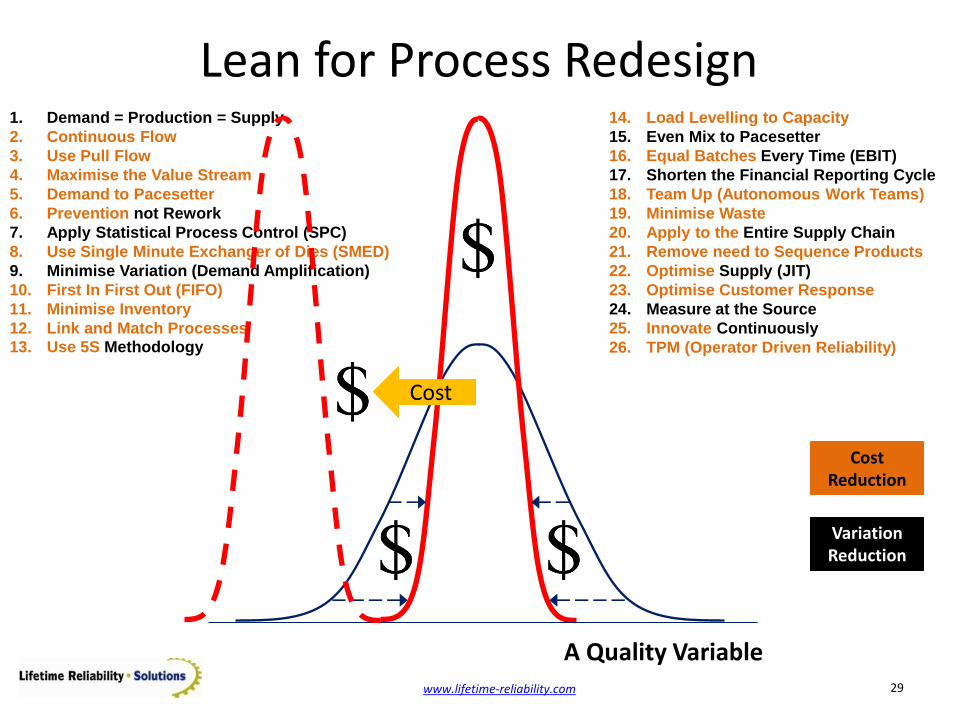
Lean for Process Redesign
A Quality Variable
1. Demand = Production = Supply
2. Continuous Flow
3. Use Pull Flow
4. Maximise the Value Stream
5. Demand to Pacesetter
6. Prevention not Rework
7. Apply Statistical Process Control (SPC)
8. Use Single Minute Exchanger of Dies (SMED)
9. Minimise Variation (Demand Amplification)
10. First In First Out (FIFO)
11. Minimise Inventory
12. Link and Match Processes 13. Use 5S Methodology
14. Load Levelling to Capacity
15. Even Mix to Pacesetter
16. Equal Batches Every Time (EBIT)
17. Shorten the Financial Reporting Cycle
18. Team Up (Autonomous Work Teams)
19. Minimise Waste
20. Apply to the Entire Supply Chain
21. Remove need to Sequence Products
22. Optimise Supply (JIT)
23. Optimise Customer Response
24. Measure at the Source
25. Innovate Continuously
26. TPM (Operator Driven Reliability)
Cost
Cost Reduction
Variation Reduction
www.lifetime-reliability.com 30
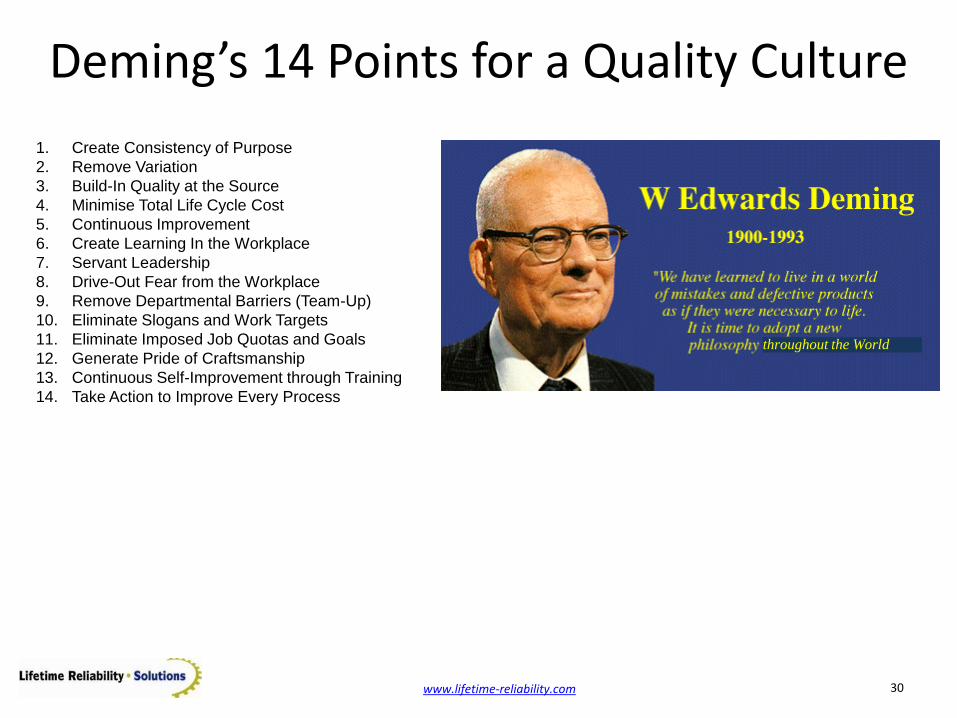
1. Create Consistency of Purpose
2. Remove Variation
3. Build-In Quality at the Source
4. Minimise Total Life Cycle Cost
5. Continuous Improvement
6. Create Learning In the Workplace
7. Servant Leadership
8. Drive-Out Fear from the Workplace
9. Remove Departmental Barriers (Team-Up)
10. Eliminate Slogans and Work Targets
11. Eliminate Imposed Job Quotas and Goals
12. Generate Pride of Craftsmanship
13. Continuous Self-Improvement through Training
14. Take Action to Improve Every Process
Deming’s 14 Points for a Quality Culture
throughout the World
www.lifetime-reliability.com 31
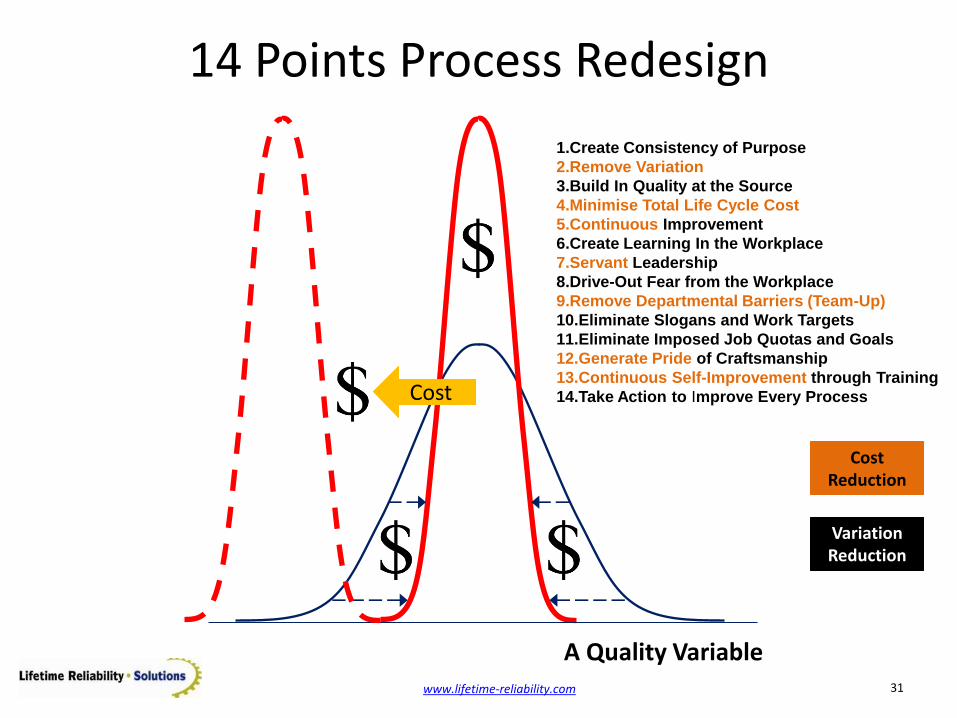
14 Points Process Redesign
A Quality Variable
Cost
1.Create Consistency of Purpose
2.Remove Variation
3.Build In Quality at the Source
4.Minimise Total Life Cycle Cost
5.Continuous Improvement
6.Create Learning In the Workplace
7.Servant Leadership
8.Drive-Out Fear from the Workplace
9.Remove Departmental Barriers (Team-Up)
10.Eliminate Slogans and Work Targets
11.Eliminate Imposed Job Quotas and Goals
12.Generate Pride of Craftsmanship
13.Continuous Self-Improvement through Training
14.Take Action to Improve Every Process
Cost Reduction
Variation Reduction
www.lifetime-reliability.com 32
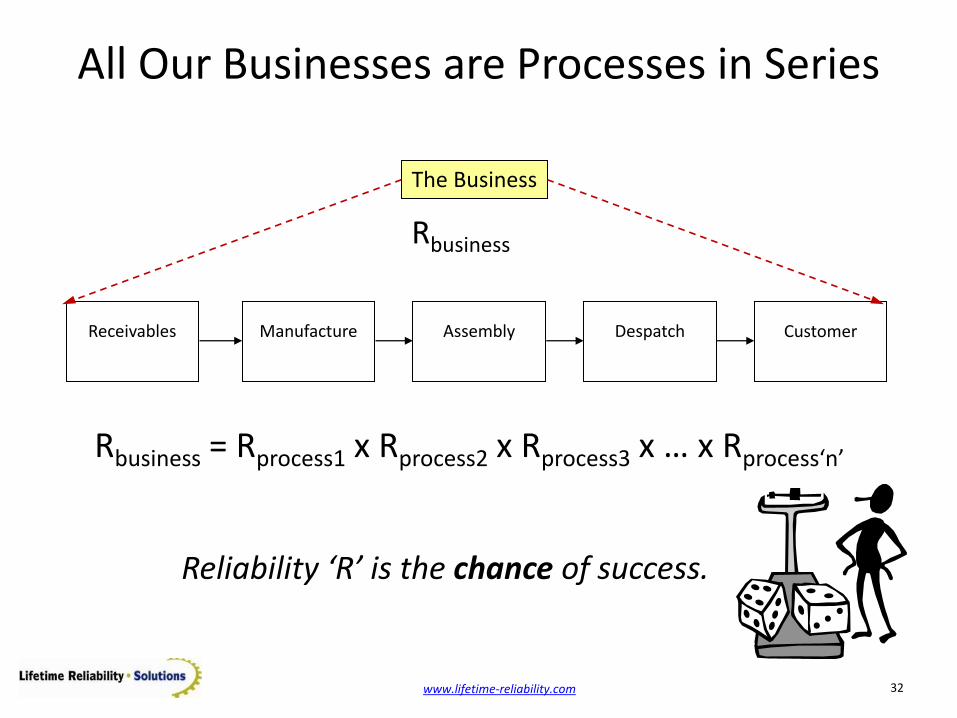
Receivables
Manufacture
Assembly
Despatch
Customer
All Our Businesses are Processes in Series
Rbusiness=
The Business
Rbusiness = Rprocess1 x Rprocess2 x Rprocess3 x … x Rprocess‘n’
Reliability ‘R’ is the chance of success.
www.lifetime-reliability.com 33
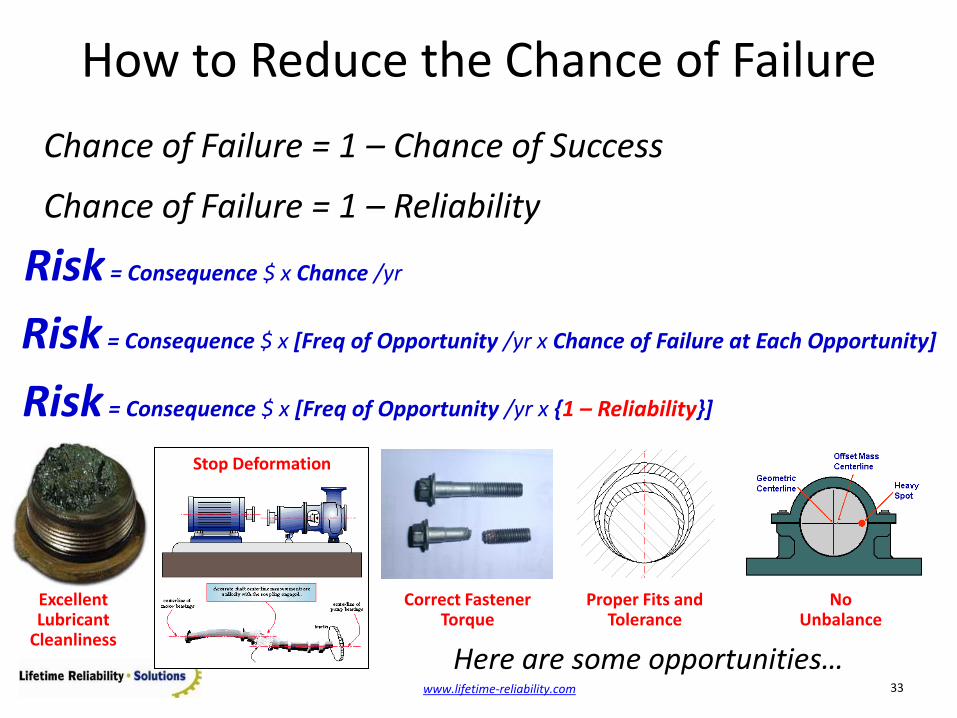
Here are some opportunities…
How to Reduce the Chance of Failure
Chance of Failure = 1 – Chance of Success
Chance of Failure = 1 – Reliability
Risk = Consequence $ x Chance /yr
Risk = Consequence $ x [Freq of Opportunity /yr x Chance of Failure at Each Opportunity]
Risk = Consequence $ x [Freq of Opportunity /yr x {1 – Reliability}]
Excellent Lubricant
Cleanliness
Correct Fastener Torque
Proper Fits and Tolerance
No Unbalance
Stop Deformation
www.lifetime-reliability.com 34
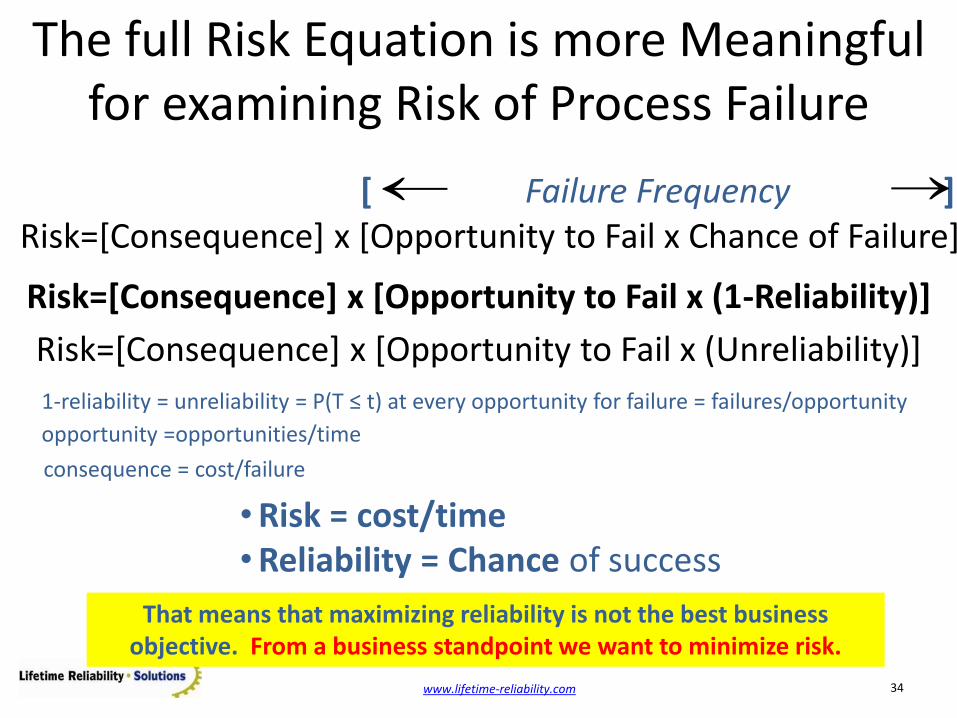
That means that maximizing reliability is not the best business objective. From a business standpoint we want to minimize risk.
Risk=[Consequence] x [Opportunity to Fail x (1-Reliability)]
1-reliability = unreliability = P(T ≤ t) at every opportunity for failure = failures/opportunity
opportunity =opportunities/time
consequence = cost/failure
•Risk = cost/time •Reliability = Chance of success
[ Failure Frequency ]
The full Risk Equation is more Meaningful for examining Risk of Process Failure
Risk=[Consequence] x [Opportunity to Fail x Chance of Failure]
Risk=[Consequence] x [Opportunity to Fail x (Unreliability)]
www.lifetime-reliability.com 35
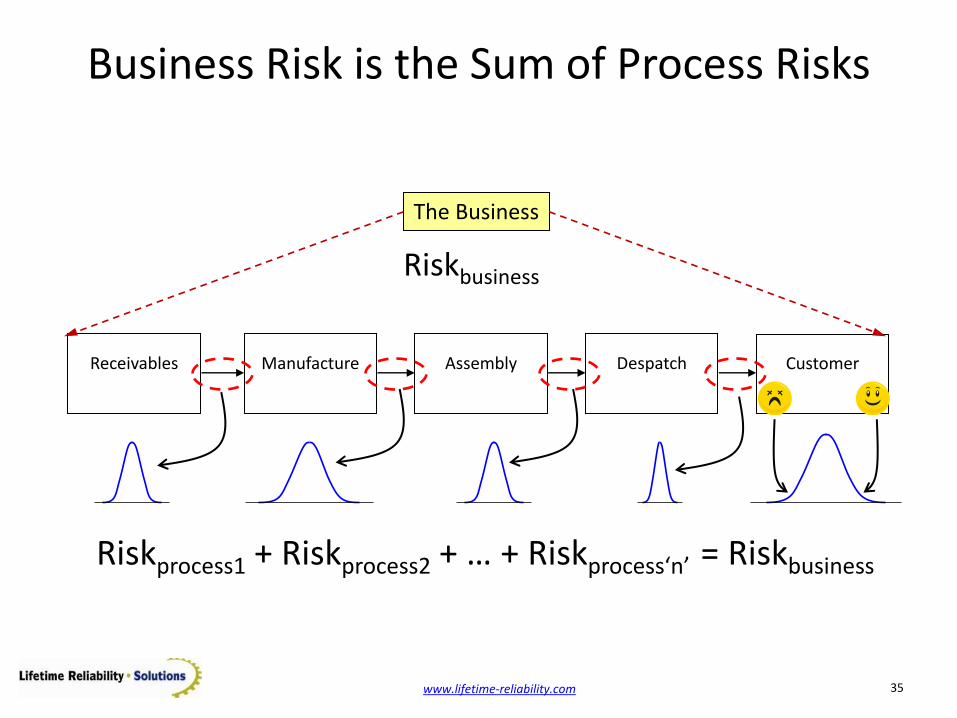
Receivables
Manufacture
Assembly
Despatch
Customer
Business Risk is the Sum of Process Risks
Riskbusiness
=
The Business
Riskprocess1 + Riskprocess2 + … + Riskprocess‘n’ = Riskbusiness
www.lifetime-reliability.com 36
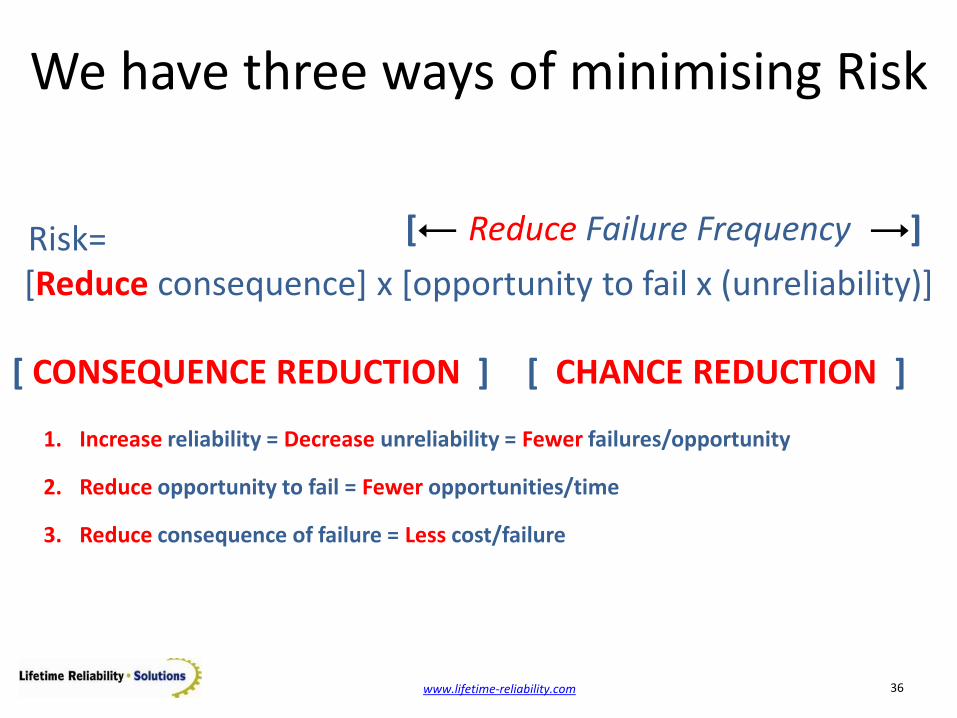
Risk= [Reduce consequence] x [opportunity to fail x (unreliability)]
1. Increase reliability = Decrease unreliability = Fewer failures/opportunity
2. Reduce opportunity to fail = Fewer opportunities/time
3. Reduce consequence of failure = Less cost/failure
[ Reduce Failure Frequency ]
We have three ways of minimising Risk
[ CHANCE REDUCTION ] [ CONSEQUENCE REDUCTION ]
www.lifetime-reliability.com 37
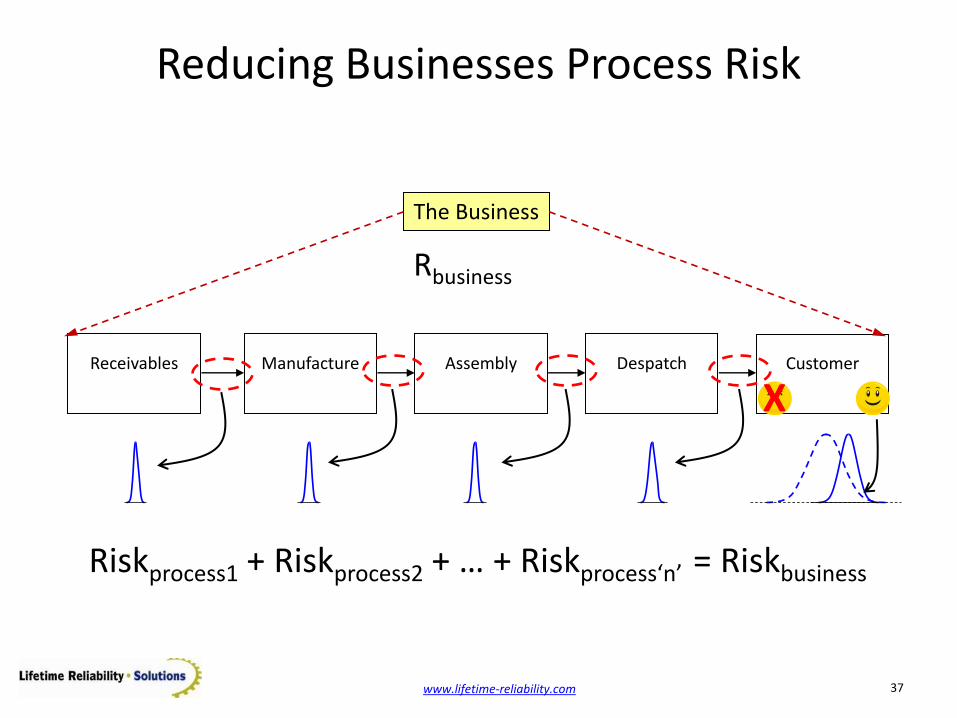
Receivables
Manufacture
Assembly
Despatch
Customer
Reducing Businesses Process Risk
Rbusiness=
The Business
Riskprocess1 + Riskprocess2 + … + Riskprocess‘n’ = Riskbusiness
X
www.lifetime-reliability.com 38
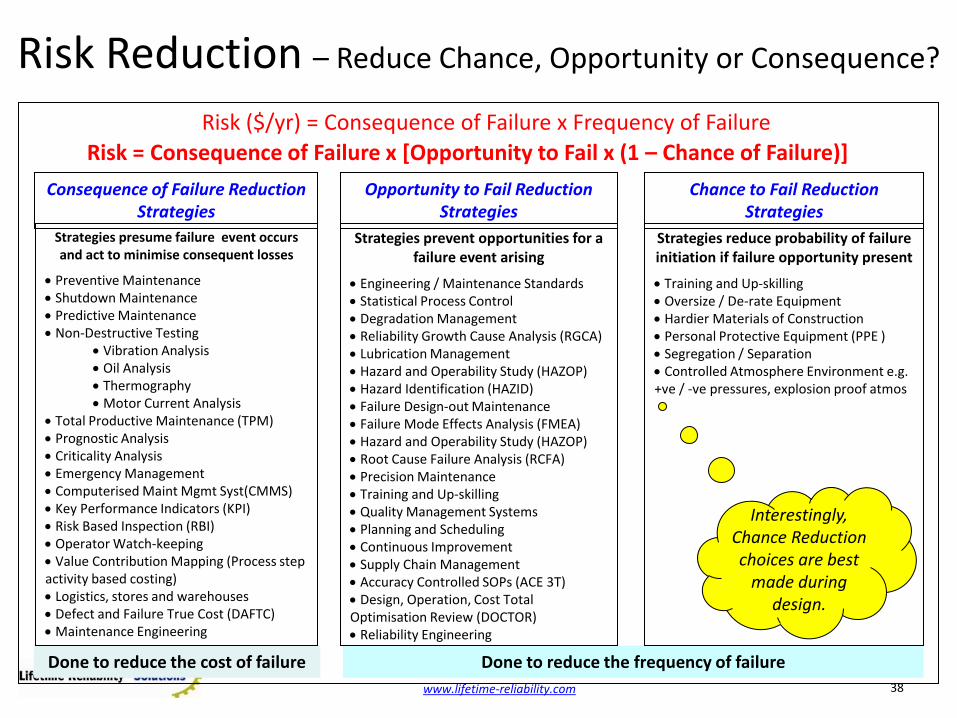
Risk Reduction – Reduce Chance, Opportunity or Consequence?
Done to reduce the cost of failure Done to reduce the frequency of failure
Risk = Consequence of Failure x [Opportunity to Fail x (1 – Chance of Failure)]
Strategies prevent opportunities for a failure event arising
Engineering / Maintenance Standards Statistical Process Control Degradation Management Reliability Growth Cause Analysis (RGCA) Lubrication Management Hazard and Operability Study (HAZOP) Hazard Identification (HAZID) Failure Design-out Maintenance Failure Mode Effects Analysis (FMEA) Hazard and Operability Study (HAZOP) Root Cause Failure Analysis (RCFA) Precision Maintenance Training and Up-skilling Quality Management Systems Planning and Scheduling Continuous Improvement Supply Chain Management Accuracy Controlled SOPs (ACE 3T) Design, Operation, Cost Total Optimisation Review (DOCTOR) Reliability Engineering
Strategies presume failure event occurs and act to minimise consequent losses
Preventive Maintenance Shutdown Maintenance Predictive Maintenance Non-Destructive Testing
Vibration Analysis Oil Analysis Thermography Motor Current Analysis
Total Productive Maintenance (TPM) Prognostic Analysis Criticality Analysis Emergency Management Computerised Maint Mgmt Syst(CMMS) Key Performance Indicators (KPI) Risk Based Inspection (RBI) Operator Watch-keeping Value Contribution Mapping (Process step activity based costing) Logistics, stores and warehouses Defect and Failure True Cost (DAFTC) Maintenance Engineering
Opportunity to Fail Reduction Strategies
Consequence of Failure Reduction Strategies
Strategies reduce probability of failure initiation if failure opportunity present
Training and Up-skilling Oversize / De-rate Equipment Hardier Materials of Construction Personal Protective Equipment (PPE ) Segregation / Separation Controlled Atmosphere Environment e.g. +ve / -ve pressures, explosion proof atmos
Chance to Fail Reduction Strategies
Risk ($/yr) = Consequence of Failure x Frequency of Failure
Interestingly, Chance Reduction choices are best
made during design.

www.lifetime-reliability.com 39
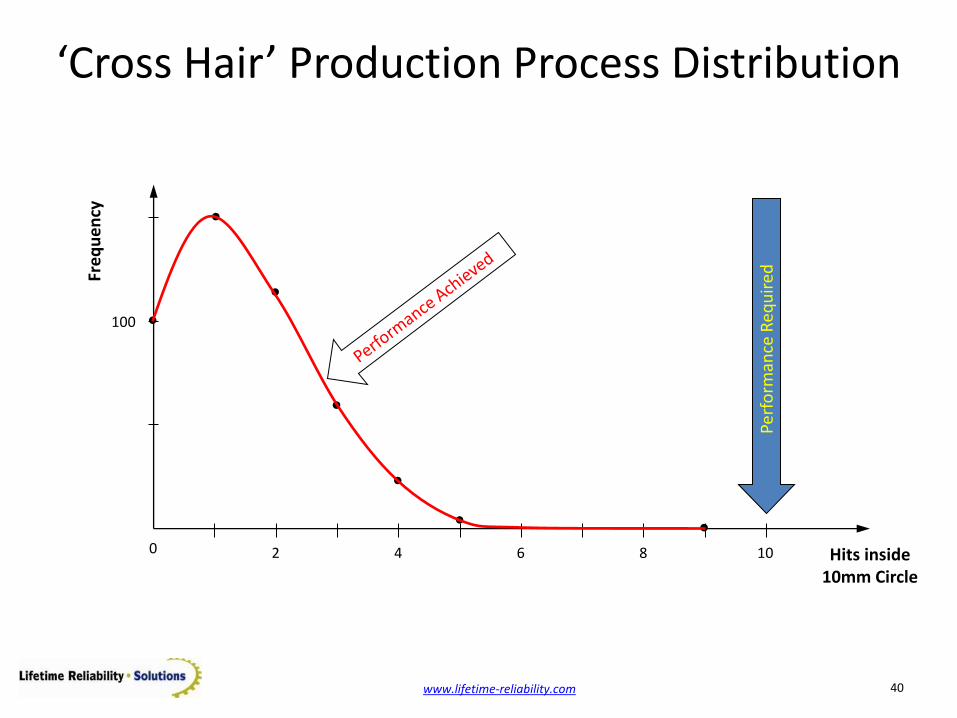
The Cross-Hair Game: Observing Business Process Outcomes
How do you hit the bulls-eye every time?
Cross-hairs and 10 mm diameter
circle
30
0 m
m
www.lifetime-reliability.com 40
‘Cross Hair’ Production Process Distribution
10 8 6 4 2 Hits inside 10mm Circle
Fre
qu
ency
Perf
orm
ance
Req
uir
ed
100
0
www.lifetime-reliability.com 41
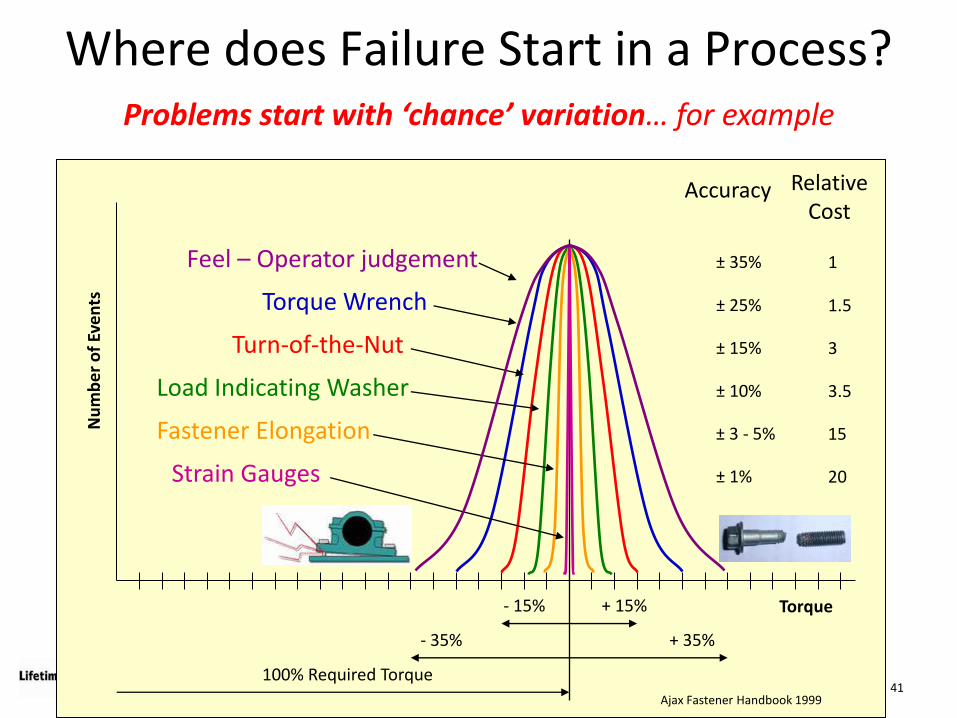
Variation in Torque on a Bolt
Feel – Operator judgement
Torque Wrench
Turn-of-the-Nut
Load Indicating Washer
Fastener Elongation
Strain Gauges
Accuracy Relative Cost
± 35% 1
± 25% 1.5
± 15% 3
± 10% 3.5
± 3 - 5% 15
± 1% 20
Nu
mb
er
of
Eve
nts
Torque
100% Required Torque
- 35% + 35%
- 15% + 15%
Ajax Fastener Handbook 1999
Where does Failure Start in a Process? Problems start with ‘chance’ variation… for example
www.lifetime-reliability.com 42
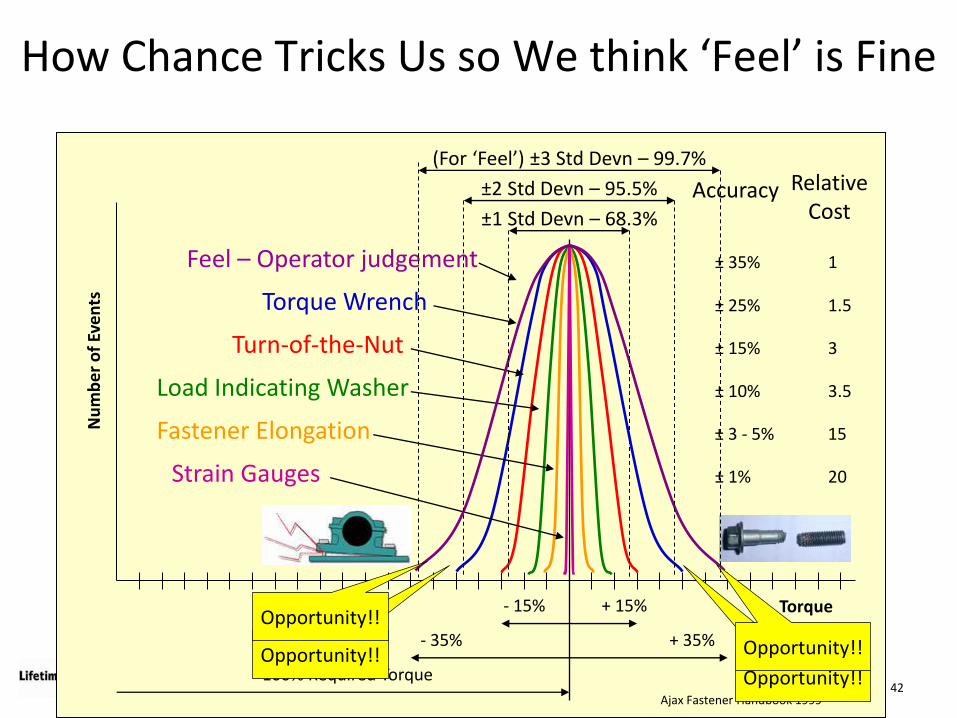
Variation in Torque on a Bolt
Feel – Operator judgement
Torque Wrench
Turn-of-the-Nut
Load Indicating Washer
Fastener Elongation
Strain Gauges
Accuracy Relative Cost
± 35% 1
± 25% 1.5
± 15% 3
± 10% 3.5
± 3 - 5% 15
± 1% 20
Nu
mb
er
of
Eve
nts
Torque
100% Required Torque
- 35% + 35%
- 15% + 15%
Ajax Fastener Handbook 1999
How Chance Tricks Us so We think ‘Feel’ is Fine
±1 Std Devn – 68.3%
Opportunity!! Opportunity!!
Opportunity!!
Opportunity!!
±2 Std Devn – 95.5%
(For ‘Feel’) ±3 Std Devn – 99.7%
www.lifetime-reliability.com 43
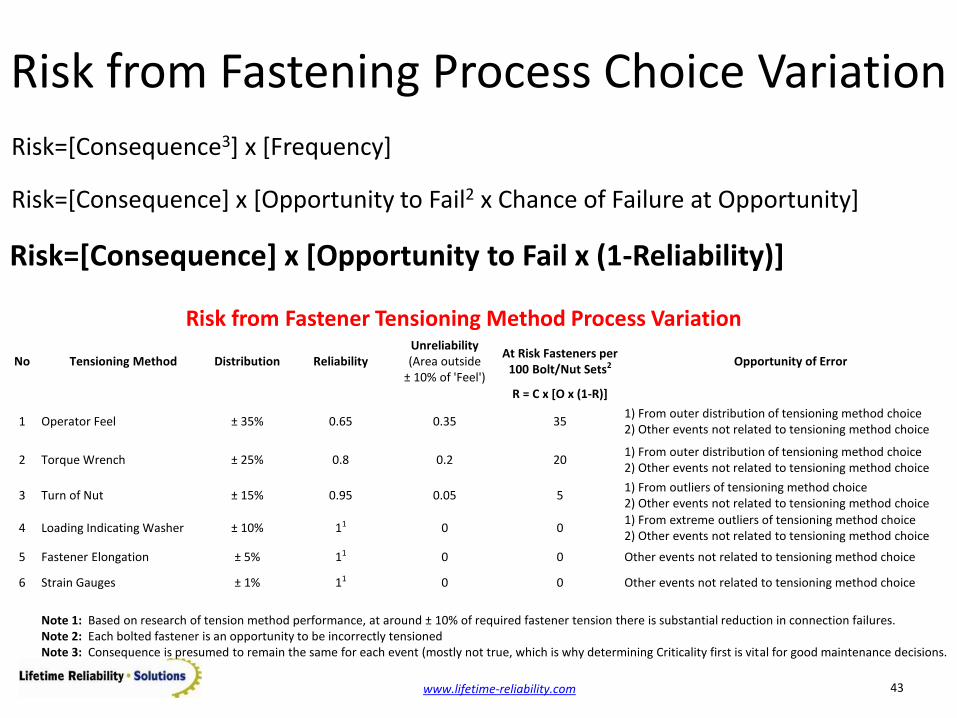
Risk=[Consequence] x [Opportunity to Fail x (1-Reliability)]
Risk from Fastening Process Choice Variation
Risk=[Consequence] x [Opportunity to Fail2 x Chance of Failure at Opportunity]
Risk=[Consequence3] x [Frequency]
No Tensioning Method Distribution Reliability Unreliability (Area outside
± 10% of 'Feel')
At Risk Fasteners per 100 Bolt/Nut Sets2 Opportunity of Error
R = C x [O x (1-R)]
1 Operator Feel ± 35% 0.65 0.35 35 1) From outer distribution of tensioning method choice 2) Other events not related to tensioning method choice
2 Torque Wrench ± 25% 0.8 0.2 20 1) From outer distribution of tensioning method choice 2) Other events not related to tensioning method choice
3 Turn of Nut ± 15% 0.95 0.05 5 1) From outliers of tensioning method choice 2) Other events not related to tensioning method choice
4 Loading Indicating Washer ± 10% 11 0 0 1) From extreme outliers of tensioning method choice 2) Other events not related to tensioning method choice
5 Fastener Elongation ± 5% 11 0 0 Other events not related to tensioning method choice
6 Strain Gauges ± 1% 11 0 0 Other events not related to tensioning method choice
Note 1: Based on research of tension method performance, at around ± 10% of required fastener tension there is substantial reduction in connection failures. Note 2: Each bolted fastener is an opportunity to be incorrectly tensioned Note 3: Consequence is presumed to remain the same for each event (mostly not true, which is why determining Criticality first is vital for good maintenance decisions.
Risk from Fastener Tensioning Method Process Variation
www.lifetime-reliability.com 44
Lean and Six Sigma fails Business if they do not change the Business System.
THANK YOU.
Mike Sondalini
Lifetime Reliability Solutions