
Simon White Max Planck Institut für Astrophysik
47
Modelling the galaxy population Simon White Max Planck Institut für Astrophysik IAU 277 Ouagadougou 1
Transcript of Simon White Max Planck Institut für Astrophysik

Modelling the galaxy population
Simon WhiteMax Planck Institut für Astrophysik
IAU 277Ouagadougou 1
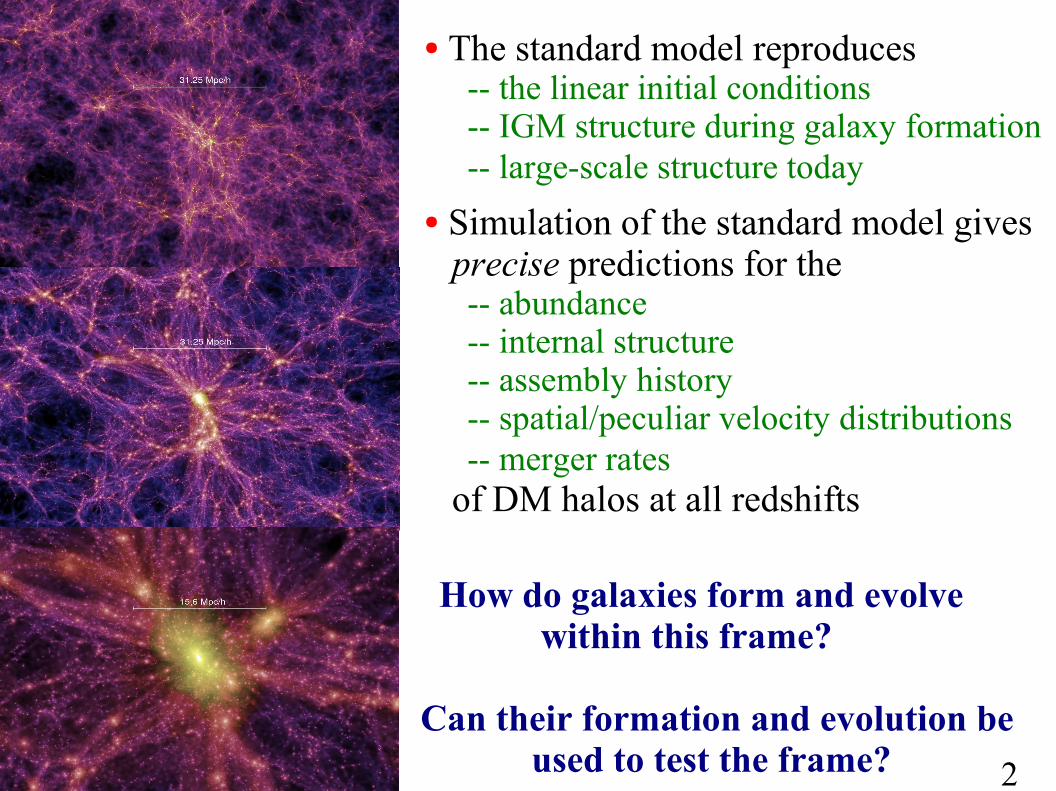
● The standard model reproduces -- the linear initial conditions -- IGM structure during galaxy formation -- large-scale structure today ● Simulation of the standard model gives precise predictions for the -- abundance -- internal structure -- assembly history -- spatial/peculiar velocity distributions -- merger rates of DM halos at all redshifts
How do galaxies form and evolve within this frame?
Can their formation and evolution be used to test the frame? 2

SDSS DR7: 486,840 galaxies with redshifts and ugriz photometry. Masses from SED fitting with a Chabrier IMF
Integrating over all masses gives ρ
* = 3.14 ± 0.10 x 10⁸ h M
⊙ Mpc-3
This is only 3.5% of the baryonsinferred from the WMAP5 data.Galaxy formation is very inefficient!
Li & White 2009
3

Most stars are in galaxies with similar stellar mass to the Milky Way
4

Most stars are in galaxies with similar stellar mass to the Milky WayDark matter (and baryons) are much more broadly distributed across halo mass in the WMAP7 cosmology
5

The problem with matching dwarfs in ΛCDM
A formation efficiency which matches abundance of “Milky Ways” overproduces the number of “Fornax's” by a factor of 30!
nhalo
(M*Ω
m /0.3Ω
b)
Fornax
Halo abundance as a function of 0.3 x associated baryon massAbundance of
galaxies as a function of stellar mass
6

A counting argument to relate halo and galaxy masses
The SDSS/DR7 data give a precise measurement of the abundance ofgalaxies as a function of stellar mass threshold, n( > M
*)
High-resolution simulations allow all halos/subhalos massive enough to host z=0 galaxies to be identified
Define Mh,max
as the maximum mass ever attained by a halo/subhalo
The simulations then give the halo/subhalo abundance, n( > Mh,max
)
Ansatz: Assume the stellar mass of a galaxy to be a monotonically increasing function of the maximum mass ever attained by its halo
We can then derive M*(M
h,max) by setting n( > M
*) = n( > M
h,max)
7

Consistency of ΛCDM for galaxy halos
lensing
satellite motions
Guo et al 2010
halo abundancematching
Relations between dark halo mass and galaxy stellar mass inferred (i) from the motions of satellite galaxies (ii) from gravitational lensing (iii) from matching predicted halo count to observed galaxy countall agree! 8

Consistency of ΛCDM for galaxy clusteringGuo et al 2010
Populating halos/sub- halos by assigning galaxies as inferred by abundance matching to the stellar mass function gives an excellent fit to the observed clustering of stellar mass
no free parameters!
9

● The stellar mass of the central galaxy increases rapidly with halo mass at small halo mass, but slowly at large halo mass● The characteristic halo mass at the bend is 5 x 10¹¹ M
⊙
Mgal
∝ Mh
3
Mgal
∝ Mh
1/3
10

The efficiency of galaxy formation is low!
The ratio of central galaxy stellar mass to maximum past halomass maximises at just 3.5% at halo masses of ~ 1012 M
⊙
This is much less than the global baryon fraction ~ 17%11

“Successful” simulations fail to match this...
Guo et al 2010
● Agertz, Teyssier, Moore (2010)
Agertz et al 2010
12

...and do worse for dwarfs than for giantsSawala et al 2010
13

Formation efficiencies are lower at high z!Wake et al 2010
14

How to proceed with model-building --the semianalytic program--
● Begin with counts! -- luminosity/mass functions, central/satellite abundances
● Use clustering measurements! -- correlations as a function of stellar mass and colour
● Use assembly history information from simulations! -- base on high-resolution DM simulations -- use simulated assembly history/substructure data directly
● Use physically plausible recipes for relevant processes -- tie recipes to detailed simulations when possible -- otherwise use observational phenomenology
● Separate measurement from hypothesis when model-testing15

The Millennium Simulation (2005)
16

17

350 papers making direct use of data from the MS (8-12-2010)Most by authors unassociated with the consortiumMost based on the galaxy catalogues, particularly mock surveys
18

Limitations of the Millennium Simulation
● Limited volume – too small for BAO work, precision cosmology
● Limited resolution – too poor to model formation of dwarfs
● No convergence tests – are galaxy results numerically converged?
● Only one (“wrong”) cosmology
● Users unable to test dependences on parameters/assumptions
19

Millennium-II (2008)
Same cosmology
Same N
1/5 linear size
Same outputs/ post-processing
Resolution testsof MS results and extension to smaller scales
20

MS-II
MS
SDSS/DR7
Galaxy formation model of De Lucia & Blaizot (2007)
Galaxy formation modelling on the MS is affected by resolution for log M
* < 9.5
The current standard models do not fit recent “precision” data
21

New galaxy formation models based on MS+MS-II
Qi Guo et al 2010b
● Implement modelling simultaneously on MS and MS-II
● Test convergence of galaxy properties near resolution limit of MS
● Extend to properties of dwarf galaxies
● Improve/extend treatments of “troublesome” astrophysics
● Adjust parameters to fit new, more precise data
● Test against clustering and redshift evolution
22

Things that work well
23

MS-II
MS
The stellar mass function of galaxies
24

Luminosity functions of galaxies
25

Luminosity function of Milky Way satellites
Luminosity functions of satellitesaround 1500 “Milky Ways”i.e. isolated disk galaxies withlog M
* = 10.8
no reionisation
“Gnedin”
“Okamoto”
10% 50%
90%
26

Galaxy colour distributions
SDSS
27

1
Scaling relations
Stellar mass – disk size
Stellar mass – bulge size
Stellar mass – gas metallicity
Tully-Fisher
SDSS
SDSS
Springob
Blanton/Geha
Tremonti
Lee
28

Clustering of massive galaxies
Data from SDSS/DR7
MSMS-II
29

0.018 < z < 0.028
degrees
degrees
SDSS data
30
Coma cluster

0.018 < z < 0.028
degrees
degrees
Coma cluster with R
200
SDSS data
31

h-1 Mpc
h-1 Mpc
MS cluster
32

h-1 Mpc
h-1 Mpc
MS clusterhalos only
33

h-1 Mpc
h-1 Mpc
MS clustergalaxies insubhalos
34

h-1 Mpc
h-1 Mpc
MS clusterAll galaxies including “orphans”
35

0.018 < z < 0.028
degrees
degrees
Coma cluster with R
200
SDSS data
36

Projected galaxy number density profiles of clusters
log Mgal
> 10.0
14.0 < log Mclus
< 14.3
Note: good agreement of MS with MS-II is only when orphans are included
Orphan treatment is physically consistent and needed to fit SDSS
orphans
37

Galaxy stellar mass versus maximum past halo mass
centralssatellites
abundance matching
38

39
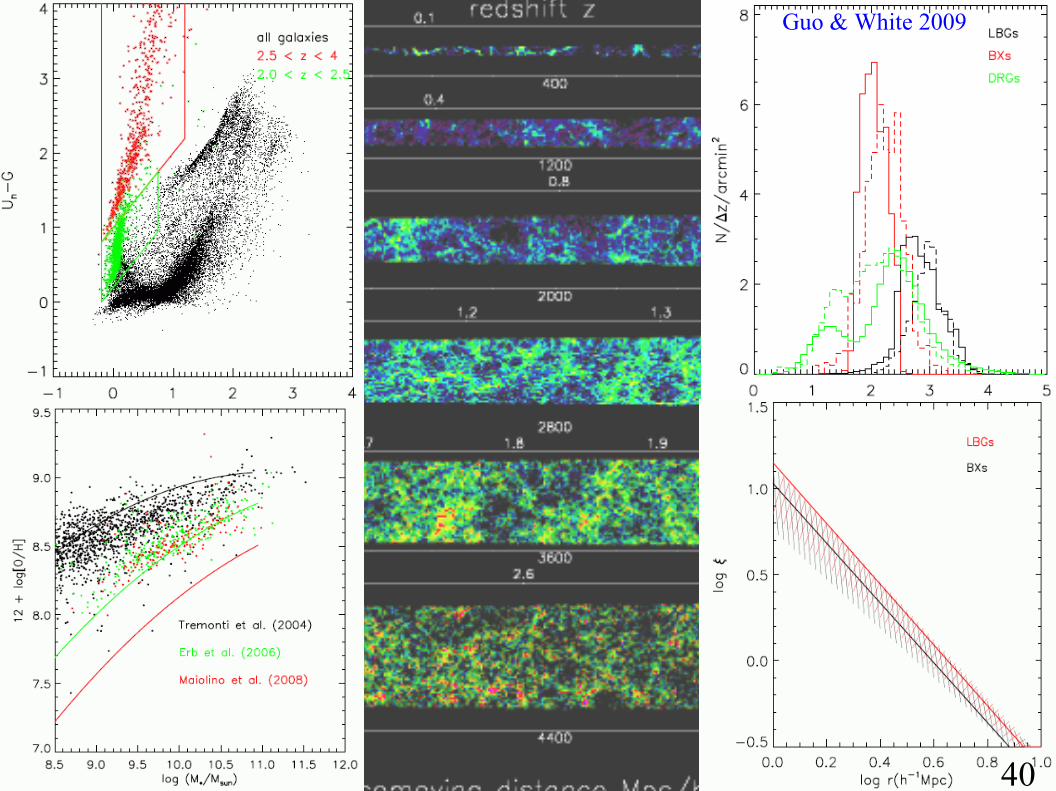
Guo & White 2009
40

Guo & White 2009
41

Things that work less well
42

Clustering of less massive galaxies
MS-II MS
small scales too high
large scales good
Note agreement
--- σ8 = 0.9 is too high ---
43

The cosmic star formation density history
--- observed SFR are inconsistent with observed stellar masses --- --- star formation peaks too early in the model ---
44

Colours of dwarf galaxies
log M*
SDSS MS-II
Too many passive low mass galaxies in the MS-II
--- formation is too fast/too early ---
45

Evolution of stellar mass function
Lower mass galaxies log M
* < 10.5
form too early
46

Conclusions
“Precision” modelling of the formation and evolution of the galaxy population is now possible
Viable models should address abundances and scaling relations and clustering and evolution
Viable models require strong SN? feedback at low masses and strong AGN? feedback at high masses to match observed LF's
The Millennium Simulation amplitude σ8 = 0.9 is too high
In current models star formation occurs too early in low-mass systems
Need a better understanding of star formation and a lower fluctuation amplitude
47


