SIME DARBY PROPERTY BERHAD Investor Presentation€¦ · Investor Presentation . Sime Darby Pure...
49
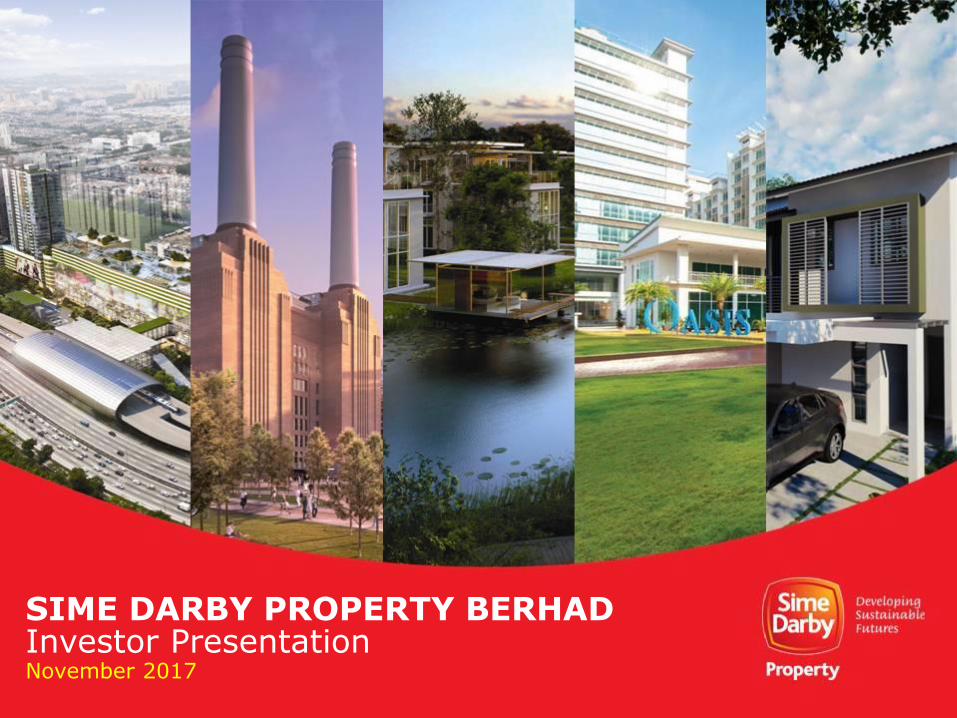
1 SIME DARBY PROPERTY BERHAD November 2017 Investor Presentation
Transcript of SIME DARBY PROPERTY BERHAD Investor Presentation€¦ · Investor Presentation . Sime Darby Pure...
1
SIME DARBY PROPERTY BERHAD
November 2017Investor Presentation
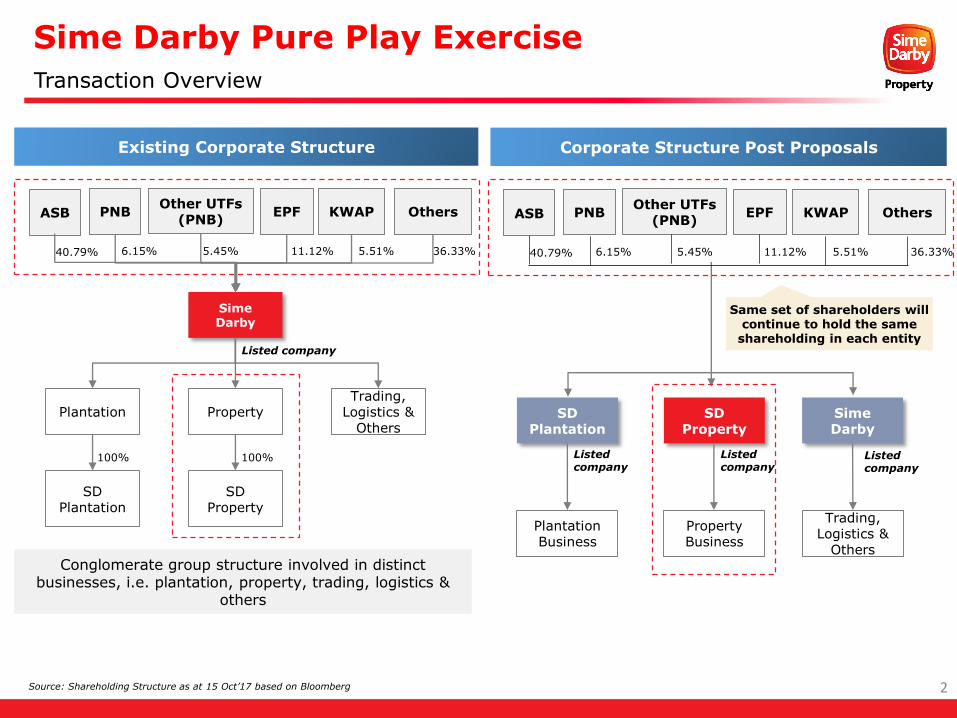
Sime Darby Pure Play Exercise
2
Transaction Overview
Source: Shareholding Structure as at 15 Oct’17 based on Bloomberg
Sime Darby
Plantation PropertyTrading,
Logistics & Others
SD Plantation
SD Property
100% 100%
Other UTFs (PNB)
PNB OthersEPF KWAP
Conglomerate group structure involved in distinct businesses, i.e. plantation, property, trading, logistics &
others
Listed company
Existing Corporate Structure
11.12% 5.51%6.15% 5.45%
SD Plantation
SD Property
Trading, Logistics &
Others
Plantation Business
Property Business
Sime Darby
Listed company
Listed company
Listed company
Same set of shareholders will continue to hold the same
shareholding in each entity
Corporate Structure Post Proposals
36.33%
ASB
40.79%
Other UTFs (PNB)
PNB OthersEPF KWAP
11.12% 5.51%6.15% 5.45% 36.33%
ASB
40.79%
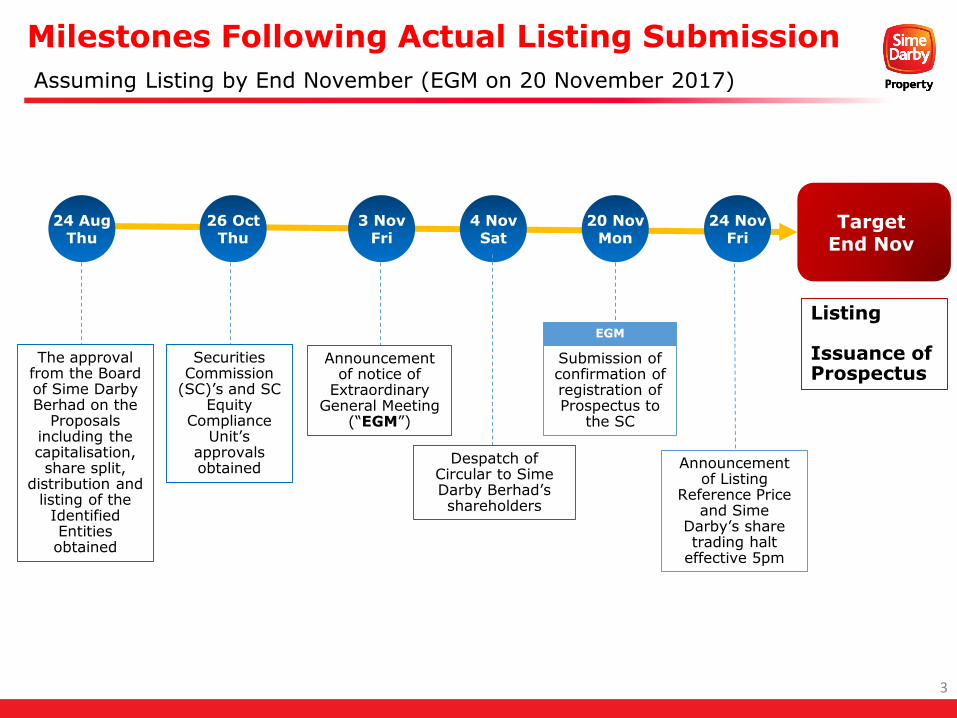
Milestones Following Actual Listing Submission
3
Assuming Listing by End November (EGM on 20 November 2017)
26 OctThu
Securities Commission
(SC)’s and SC Equity
Compliance Unit’s
approvals obtained
20 NovMon
EGM
Target End Nov
4 NovSat
Submission of confirmation of registration of Prospectus to
the SC
Listing
Issuance of Prospectus
Despatch of Circular to Sime Darby Berhad’sshareholders
24 AugThu
The approval from the Board of Sime Darby Berhad on the
Proposals including the capitalisation, share split,
distribution and listing of the
Identified Entities obtained
3 NovFri
Announcement of notice of
Extraordinary General Meeting
(“EGM”)
24 NovFri
Announcement of Listing
Reference Price and Sime
Darby’s share trading halt
effective 5pm
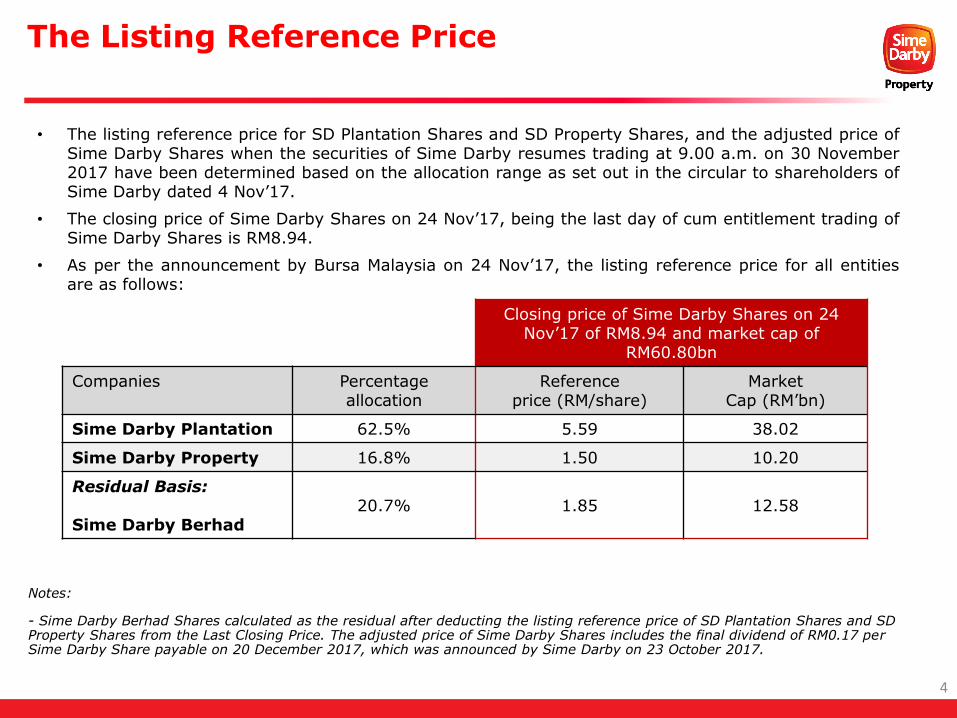
The Listing Reference Price
4
Closing price of Sime Darby Shares on 24 Nov’17 of RM8.94 and market cap of
RM60.80bn
Companies Percentage allocation
Reference price (RM/share)
MarketCap (RM’bn)
Sime Darby Plantation 62.5% 5.59 38.02
Sime Darby Property 16.8% 1.50 10.20
Residual Basis:
Sime Darby Berhad20.7% 1.85 12.58
Notes:
- Sime Darby Berhad Shares calculated as the residual after deducting the listing reference price of SD Plantation Shares and SD Property Shares from the Last Closing Price. The adjusted price of Sime Darby Shares includes the final dividend of RM0.17 per Sime Darby Share payable on 20 December 2017, which was announced by Sime Darby on 23 October 2017.
• The listing reference price for SD Plantation Shares and SD Property Shares, and the adjusted price ofSime Darby Shares when the securities of Sime Darby resumes trading at 9.00 a.m. on 30 November2017 have been determined based on the allocation range as set out in the circular to shareholders ofSime Darby dated 4 Nov’17.
• The closing price of Sime Darby Shares on 24 Nov’17, being the last day of cum entitlement trading ofSime Darby Shares is RM8.94.
• As per the announcement by Bursa Malaysia on 24 Nov’17, the listing reference price for all entitiesare as follows:
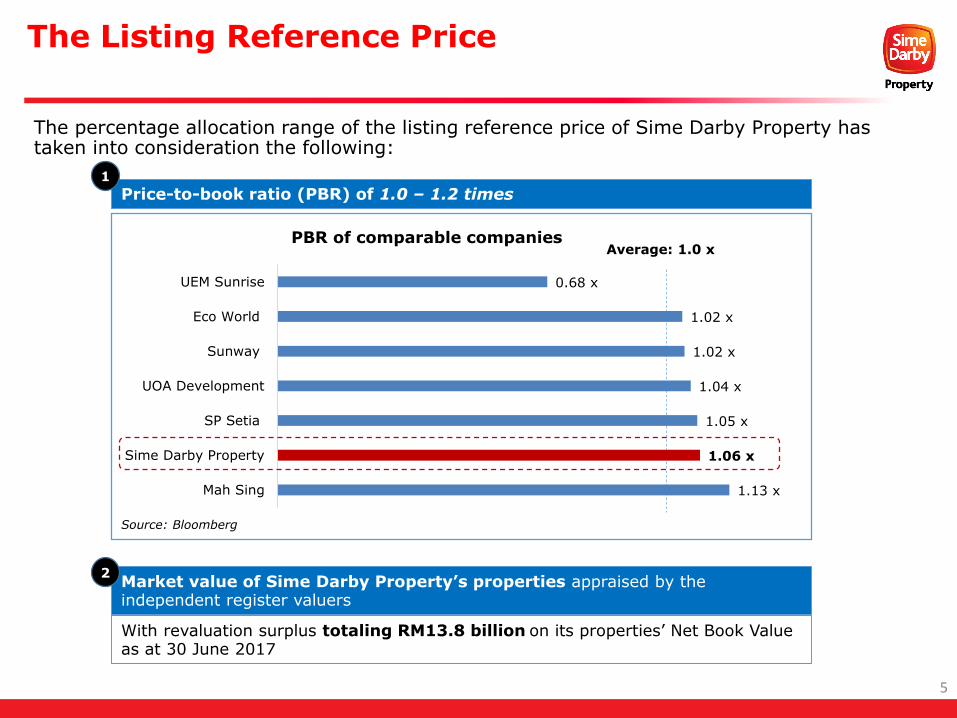
Price-to-book ratio (PBR) of 1.0 – 1.2 times
The Listing Reference Price
5
The percentage allocation range of the listing reference price of Sime Darby Property has taken into consideration the following:
1
Source: Bloomberg
Market value of Sime Darby Property’s properties appraised by the independent register valuers
2
With revaluation surplus totaling RM13.8 billion on its properties’ Net Book Value as at 30 June 2017
1.13 x
1.06 x
1.05 x
1.04 x
1.02 x
1.02 x
0.68 x
Mah Sing
Sime Darby Property
SP Setia
UOA Development
Sunway
Eco World
UEM Sunrise
PBR of comparable companies Average: 1.0 x
Sime Darby Property Berhad
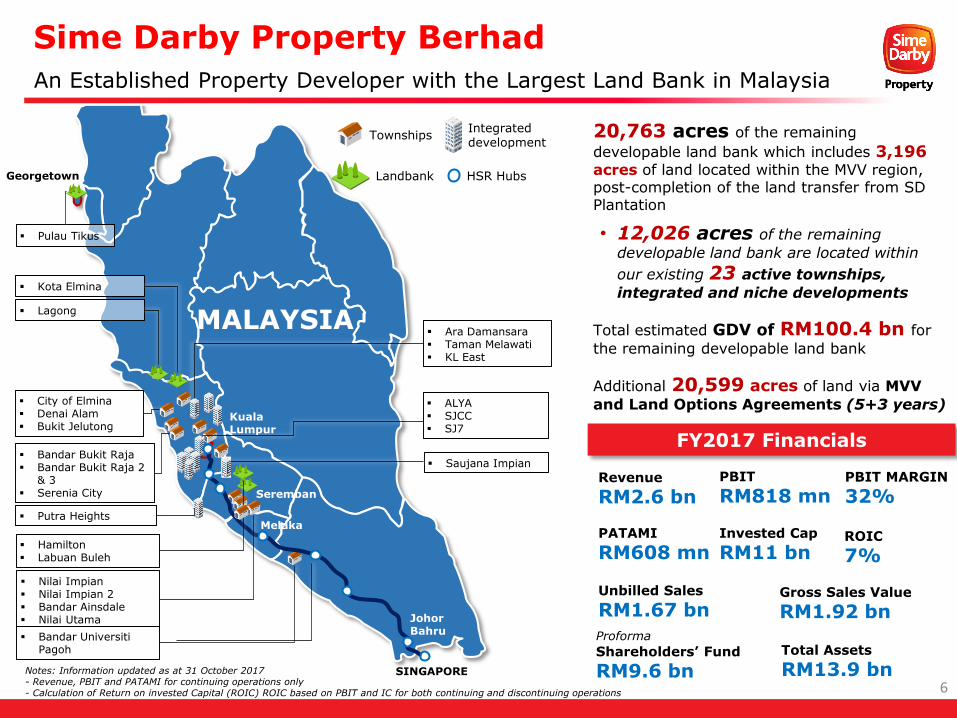
Revenue
RM2.6 bn
FY2017 Financials
Total Assets
RM13.9 bnShareholders’ Fund
RM9.6 bn
PATAMI
RM608 mn
Notes: Information updated as at 31 October 2017- Revenue, PBIT and PATAMI for continuing operations only- Calculation of Return on invested Capital (ROIC) ROIC based on PBIT and IC for both continuing and discontinuing operations
PBIT
RM818 mn
20,763 acres of the remaining
developable land bank which includes 3,196acres of land located within the MVV region, post-completion of the land transfer from SD Plantation
• 12,026 acres of the remaining
developable land bank are located within
our existing 23 active townships,
integrated and niche developments
Total estimated GDV of RM100.4 bn for
the remaining developable land bank
Additional 20,599 acres of land via MVV
and Land Options Agreements (5+3 years)
Lagong
Kota Elmina
Saujana Impian
Pulau Tikus
Georgetown
Melaka
Johor Bahru
Kuala Lumpur
Seremban
MALAYSIA
SINGAPORE
Hamilton Labuan Buleh
City of Elmina Denai Alam Bukit Jelutong
Ara Damansara Taman Melawati KL East
Putra Heights
ALYA SJCC SJ7
Nilai Impian Nilai Impian 2 Bandar Ainsdale Nilai Utama
Bandar Universiti Pagoh
Bandar Bukit Raja Bandar Bukit Raja 2
& 3 Serenia City
TownshipsIntegrated development
Landbank HSR Hubs
An Established Property Developer with the Largest Land Bank in Malaysia
PBIT MARGIN
32%
ROIC
7%
6
Invested Cap
RM11 bn
Unbilled Sales
RM1.67 bnGross Sales Value
RM1.92 bnProforma

Key Investment Highlights
7
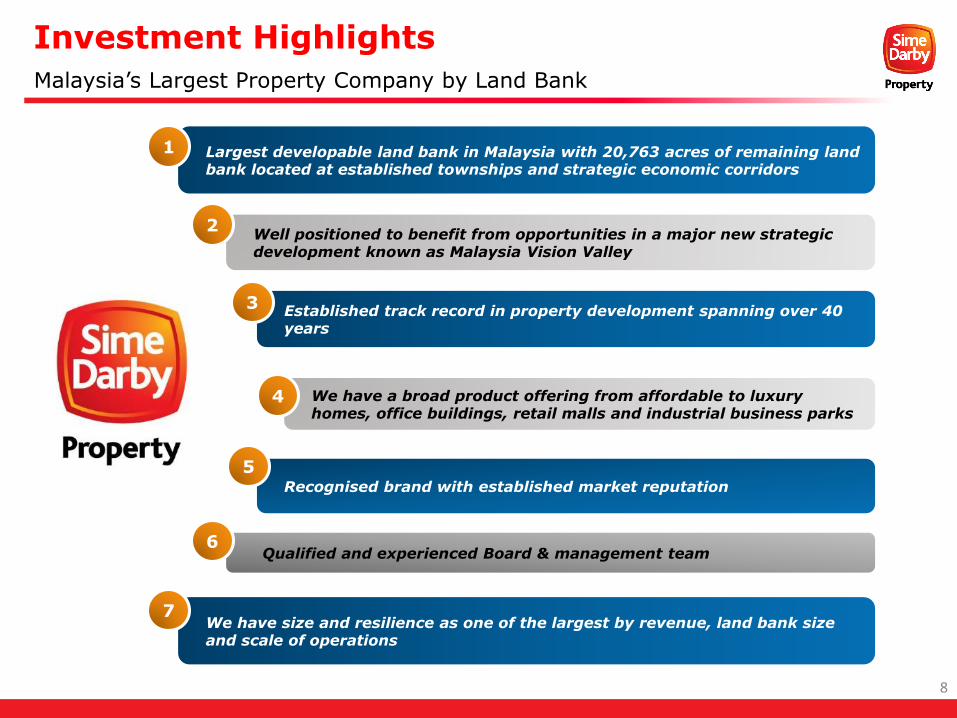
Established track record in property development spanning over 40 years
Largest developable land bank in Malaysia with 20,763 acres of remaining land bank located at established townships and strategic economic corridors
Well positioned to benefit from opportunities in a major new strategic development known as Malaysia Vision Valley
We have a broad product offering from affordable to luxury homes, office buildings, retail malls and industrial business parks
Recognised brand with established market reputation
1
2
4
3
5
Malaysia’s Largest Property Company by Land Bank
Investment Highlights
Qualified and experienced Board & management team6
8
We have size and resilience as one of the largest by revenue, land bank size and scale of operations
7
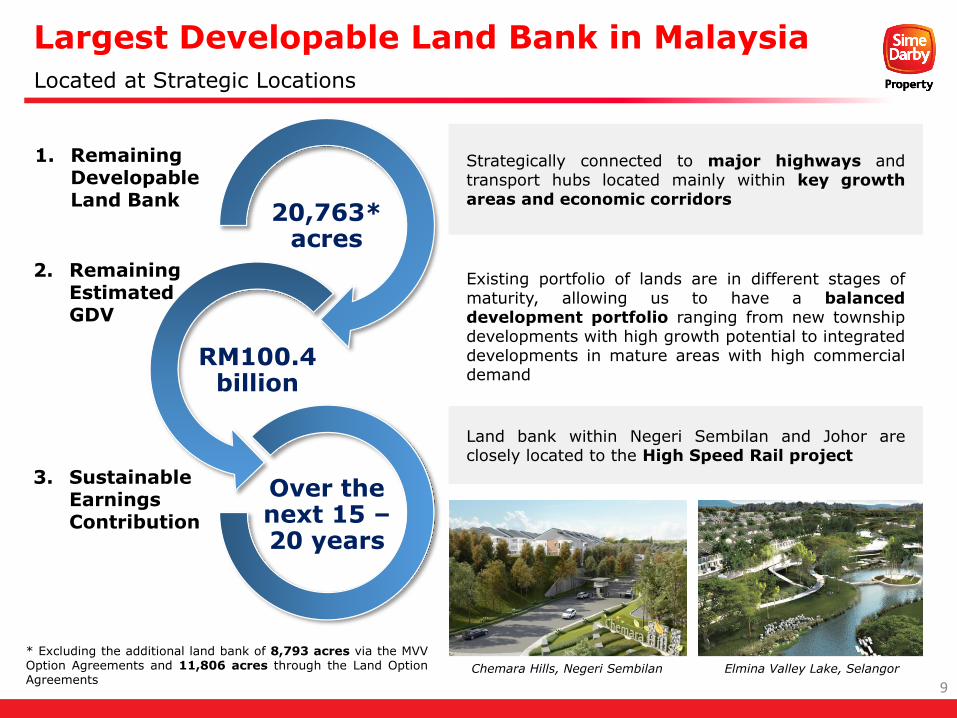
Located at Strategic Locations
20,763* acres
RM100.4 billion
Over the next 15 –20 years
1. Remaining Developable Land Bank
2. Remaining Estimated GDV
3. Sustainable Earnings Contribution
Strategically connected to major highways andtransport hubs located mainly within key growthareas and economic corridors
Existing portfolio of lands are in different stages ofmaturity, allowing us to have a balanceddevelopment portfolio ranging from new townshipdevelopments with high growth potential to integrateddevelopments in mature areas with high commercialdemand
Land bank within Negeri Sembilan and Johor areclosely located to the High Speed Rail project
* Excluding the additional land bank of 8,793 acres via the MVVOption Agreements and 11,806 acres through the Land OptionAgreements
Largest Developable Land Bank in Malaysia
9Chemara Hills, Negeri Sembilan Elmina Valley Lake, Selangor
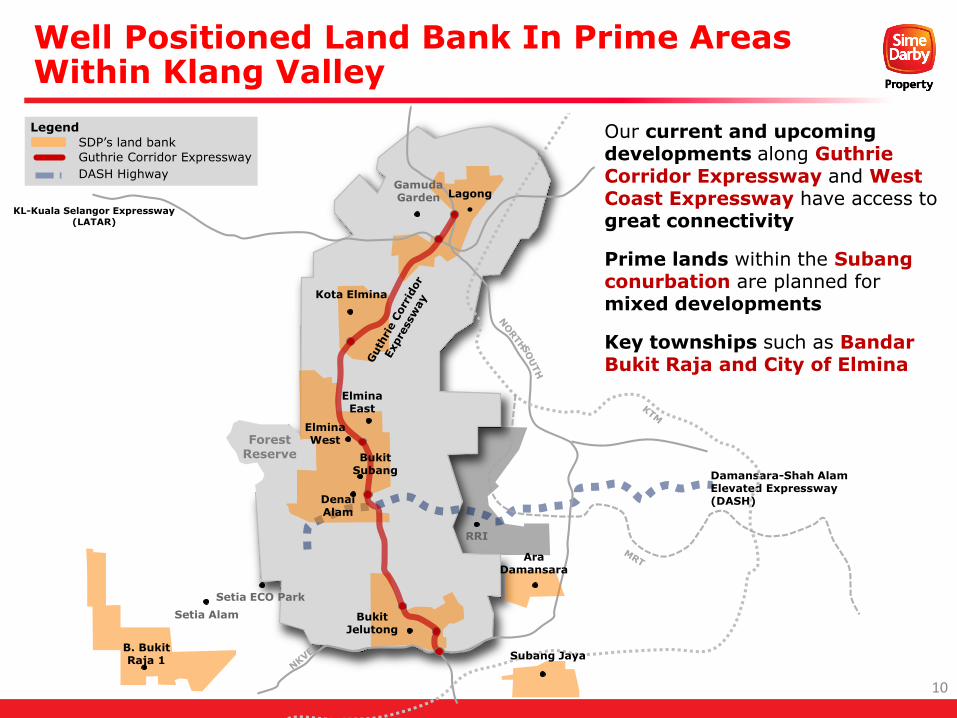
Well Positioned Land Bank In Prime Areas Within Klang Valley
Forest Reserve
Damansara-Shah Alam Elevated Expressway (DASH)
KL-Kuala Selangor Expressway(LATAR)
ElminaEast
Bukit Subang
DenaiAlam
RRI
B. BukitRaja 1 Subang Jaya
AraDamansara
BukitJelutong
Setia ECO Park
Setia Alam
ElminaWest
Kota Elmina
LagongGamuda Garden
SDP’s land bank
Guthrie Corridor Expressway
Legend
DASH Highway
Our current and upcoming developments along Guthrie Corridor Expressway and West Coast Expressway have access to great connectivity
Prime lands within the Subang conurbation are planned for mixed developments
Key townships such as Bandar Bukit Raja and City of Elmina
10
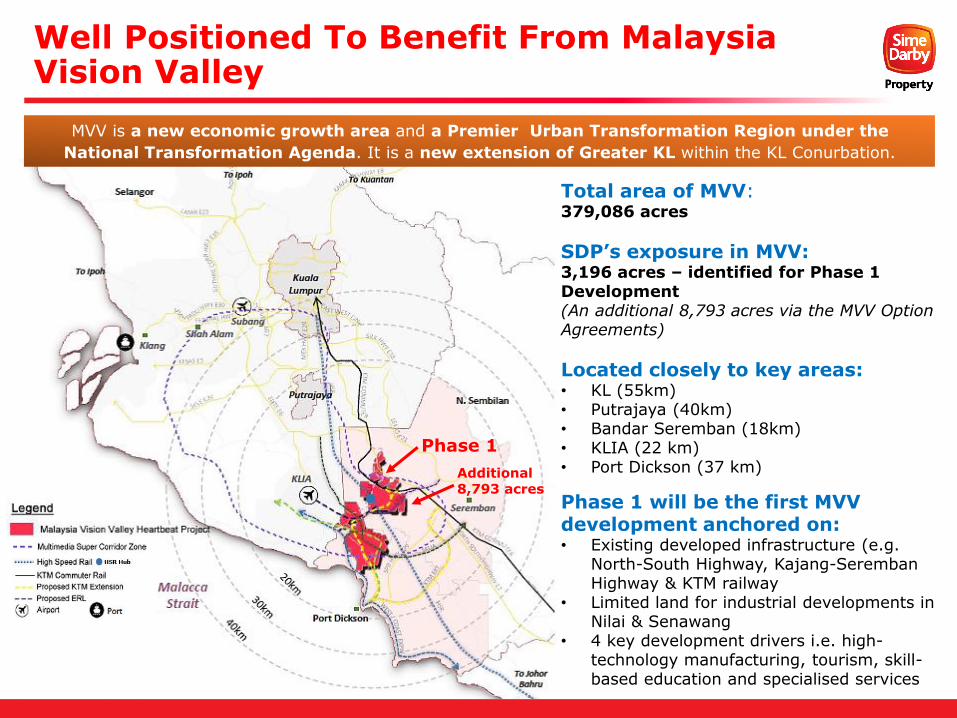
Well Positioned To Benefit From Malaysia Vision Valley
HSR Hub
Total area of MVV: 379,086 acres
SDP’s exposure in MVV: 3,196 acres – identified for Phase 1 Development(An additional 8,793 acres via the MVV Option Agreements)
Located closely to key areas:• KL (55km)• Putrajaya (40km)• Bandar Seremban (18km) • KLIA (22 km)• Port Dickson (37 km)
MVV is a new economic growth area and a Premier Urban Transformation Region under the
National Transformation Agenda. It is a new extension of Greater KL within the KL Conurbation.
Phase 1 will be the first MVV development anchored on:• Existing developed infrastructure (e.g.
North-South Highway, Kajang-Seremban Highway & KTM railway
• Limited land for industrial developments in Nilai & Senawang
• 4 key development drivers i.e. high-technology manufacturing, tourism, skill-based education and specialised services
Phase 1
Additional 8,793 acres
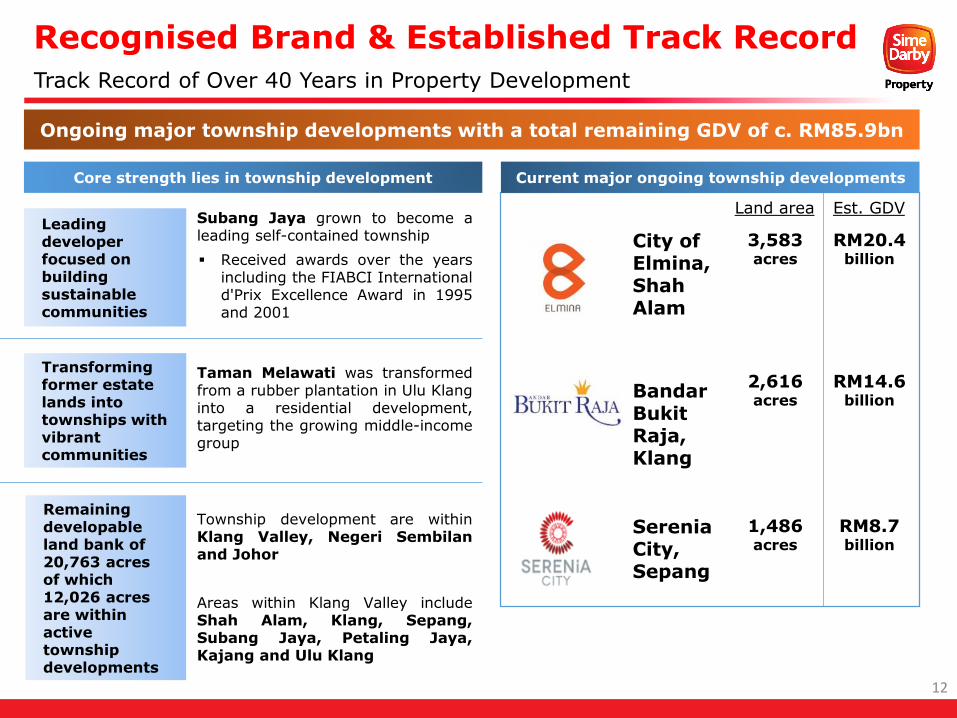
City of Elmina, Shah Alam
3,583 acres
RM20.4billion
Bandar Bukit Raja, Klang
2,616 acres
RM14.6billion
Serenia City, Sepang
1,486acres
RM8.7billion
Track Record of Over 40 Years in Property Development
Ongoing major township developments with a total remaining GDV of c. RM85.9bn
Current major ongoing township developments
Subang Jaya grown to become aleading self-contained township
Received awards over the yearsincluding the FIABCI Internationald'Prix Excellence Award in 1995and 2001
Taman Melawati was transformedfrom a rubber plantation in Ulu Klanginto a residential development,targeting the growing middle-incomegroup
Township development are withinKlang Valley, Negeri Sembilanand Johor
Areas within Klang Valley includeShah Alam, Klang, Sepang,Subang Jaya, Petaling Jaya,Kajang and Ulu Klang
Core strength lies in township development
Leading developer focused on building sustainable communities
Transforming former estate lands into townships with vibrant communities
Remaining developable land bank of 20,763 acres of which 12,026 acres are within active township developments
Recognised Brand & Established Track Record
12
Land area Est. GDV
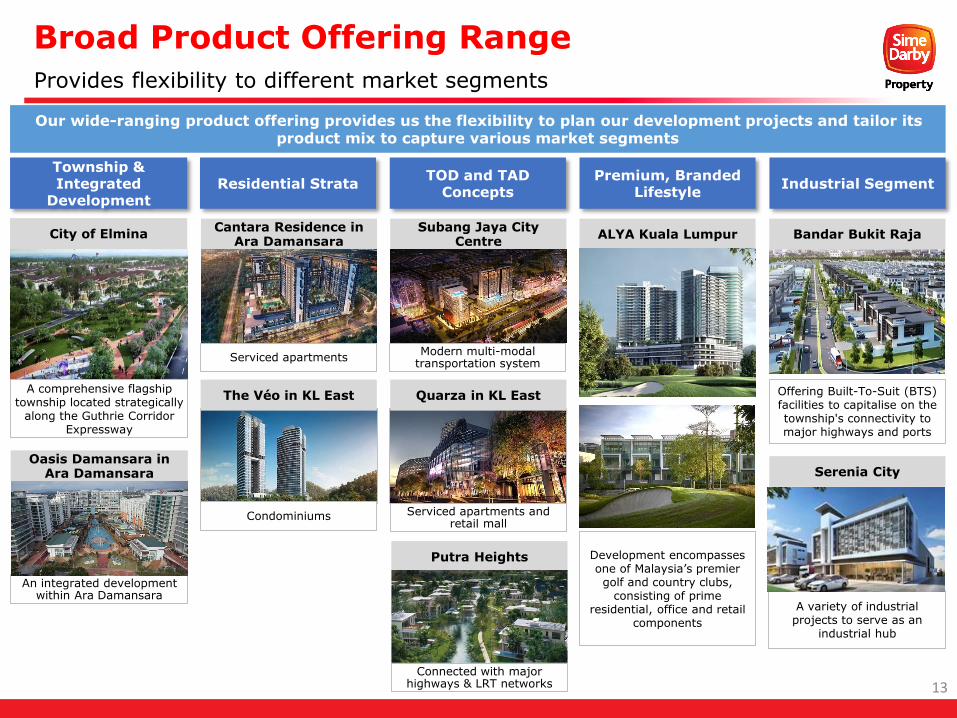
Provides flexibility to different market segments
Broad Product Offering Range
Our wide-ranging product offering provides us the flexibility to plan our development projects and tailor its product mix to capture various market segments
Township & Integrated
Development
Premium, Branded Lifestyle
TOD and TAD Concepts
Industrial SegmentResidential Strata
Oasis Damansara in Ara Damansara
An integrated development within Ara Damansara
Cantara Residence in Ara Damansara
Serviced apartments
ALYA Kuala Lumpur
Development encompasses one of Malaysia’s premier golf and country clubs,
consisting of prime residential, office and retail
components
Subang Jaya City Centre
Modern multi-modal transportation system
Putra Heights
Bandar Bukit Raja
Offering Built-To-Suit (BTS) facilities to capitalise on the township's connectivity to major highways and ports
Connected with major highways & LRT networks
Serviced apartments and retail mall
Condominiums
A variety of industrial projects to serve as an
industrial hub
Quarza in KL EastThe Véo in KL East
City of Elmina
A comprehensive flagship township located strategically
along the Guthrie Corridor Expressway
Serenia City
13
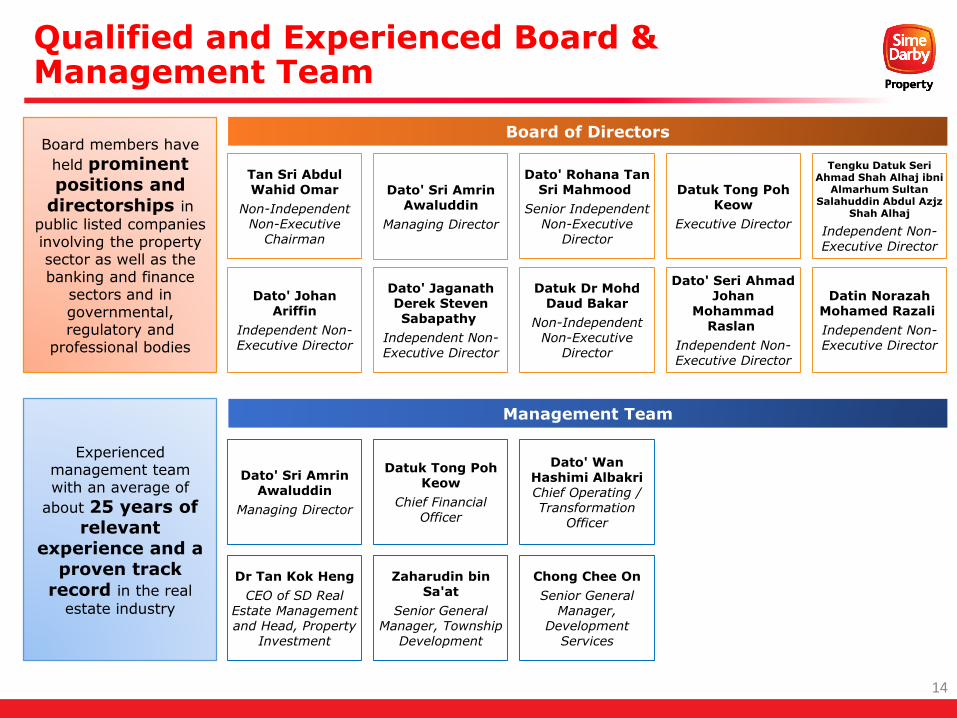
Qualified and Experienced Board & Management Team
Tan Sri Abdul Wahid Omar
Non-Independent Non-Executive
Chairman
Dato' Sri Amrin Awaluddin
Managing Director
Dato' Wan Hashimi Albakri Chief Operating / Transformation
Officer
Datuk Tong Poh Keow
Chief Financial Officer
Dato' Sri Amrin Awaluddin
Managing Director
Dr Tan Kok Heng
CEO of SD Real Estate Management and Head, Property
Investment
Chong Chee On
Senior General Manager,
Development Services
Zaharudin bin Sa'at
Senior General Manager, Township
Development
Dato' Rohana Tan Sri Mahmood
Senior Independent Non-Executive
Director
Datuk Tong Poh Keow
Executive Director
Dato' Johan Ariffin
Independent Non-Executive Director
Tengku Datuk Seri Ahmad Shah Alhaj ibni
Almarhum Sultan Salahuddin Abdul Azjz
Shah Alhaj
Independent Non-Executive Director
Dato' Jaganath Derek Steven Sabapathy
Independent Non-Executive Director
Dato' Seri Ahmad Johan
Mohammad Raslan
Independent Non-Executive Director
Datuk Dr Mohd Daud Bakar
Non-Independent Non-Executive
Director
Datin Norazah Mohamed Razali
Independent Non-Executive Director
Board of DirectorsBoard members have
held prominent positions and
directorships in
public listed companies involving the property sector as well as the banking and finance
sectors and in governmental, regulatory and
professional bodies
Management Team
Experienced management team with an average of
about 25 years of relevant
experience and a proven track
record in the real
estate industry
14

Strategies and Growth Plans
15
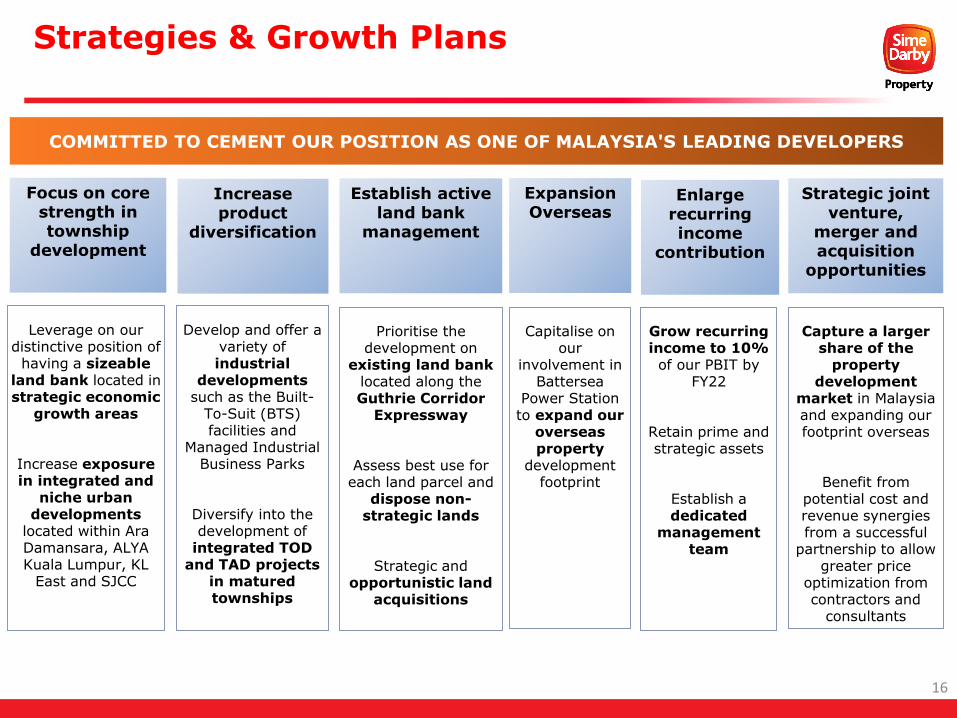
Strategies & Growth Plans
COMMITTED TO CEMENT OUR POSITION AS ONE OF MALAYSIA'S LEADING DEVELOPERS
Leverage on our distinctive position of
having a sizeable land bank located instrategic economic
growth areas
Increase exposure in integrated and
niche urban developments
located within Ara Damansara, ALYA Kuala Lumpur, KL
East and SJCC
Focus on core strength in township
development
Increase product
diversification
Establish active land bank
management
Expansion Overseas
Enlarge recurring income
contribution
Prioritise the development on
existing land bank located along the Guthrie Corridor
Expressway
Assess best use for each land parcel and
dispose non-strategic lands
Strategic and opportunistic land
acquisitions
Capitalise on our
involvement in Battersea
Power Station to expand our
overseas property
development footprint
Grow recurring income to 10% of our PBIT by
FY22
Retain prime and strategic assets
Establish a dedicated
management team
Develop and offer a variety of industrial
developments such as the Built-
To-Suit (BTS) facilities and
Managed Industrial Business Parks
Diversify into the development of
integrated TOD and TAD projects
in matured townships
Strategic joint venture,
merger and acquisition
opportunities
Capture a larger share of the
property development
market in Malaysia and expanding our footprint overseas
Benefit from potential cost and revenue synergies from a successful
partnership to allow greater price
optimization from contractors and
consultants
16
Focus on Core Strength in Township Development & Increase Exposure in Integrated Urban Development
17
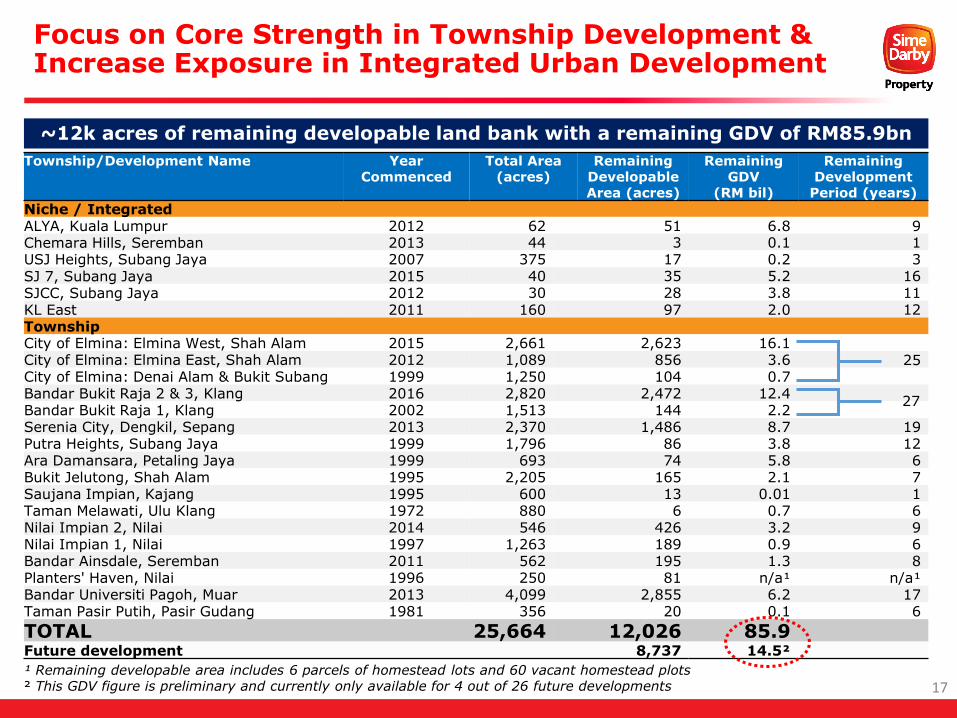
~12k acres of remaining developable land bank with a remaining GDV of RM85.9bn
¹ Remaining developable area includes 6 parcels of homestead lots and 60 vacant homestead plots² This GDV figure is preliminary and currently only available for 4 out of 26 future developments
Township/Development Name YearCommenced
Total Area (acres)
Remaining Developable Area (acres)
RemainingGDV
(RM bil)
Remaining Development
Period (years)
Niche / IntegratedALYA, Kuala Lumpur 2012 62 51 6.8 9Chemara Hills, Seremban 2013 44 3 0.1 1USJ Heights, Subang Jaya 2007 375 17 0.2 3SJ 7, Subang Jaya 2015 40 35 5.2 16SJCC, Subang Jaya 2012 30 28 3.8 11KL East 2011 160 97 2.0 12TownshipCity of Elmina: Elmina West, Shah Alam 2015 2,661 2,623 16.1City of Elmina: Elmina East, Shah Alam 2012 1,089 856 3.6 25City of Elmina: Denai Alam & Bukit Subang 1999 1,250 104 0.7Bandar Bukit Raja 2 & 3, Klang 2016 2,820 2,472 12.4Bandar Bukit Raja 1, Klang 2002 1,513 144 2.2Serenia City, Dengkil, Sepang 2013 2,370 1,486 8.7 19Putra Heights, Subang Jaya 1999 1,796 86 3.8 12Ara Damansara, Petaling Jaya 1999 693 74 5.8 6Bukit Jelutong, Shah Alam 1995 2,205 165 2.1 7Saujana Impian, Kajang 1995 600 13 0.01 1Taman Melawati, Ulu Klang 1972 880 6 0.7 6Nilai Impian 2, Nilai 2014 546 426 3.2 9Nilai Impian 1, Nilai 1997 1,263 189 0.9 6Bandar Ainsdale, Seremban 2011 562 195 1.3 8Planters' Haven, Nilai 1996 250 81 n/a¹ n/a¹Bandar Universiti Pagoh, Muar 2013 4,099 2,855 6.2 17Taman Pasir Putih, Pasir Gudang 1981 356 20 0.1 6
TOTAL 25,664 12,026 85.9Future development 8,737 14.5²
27
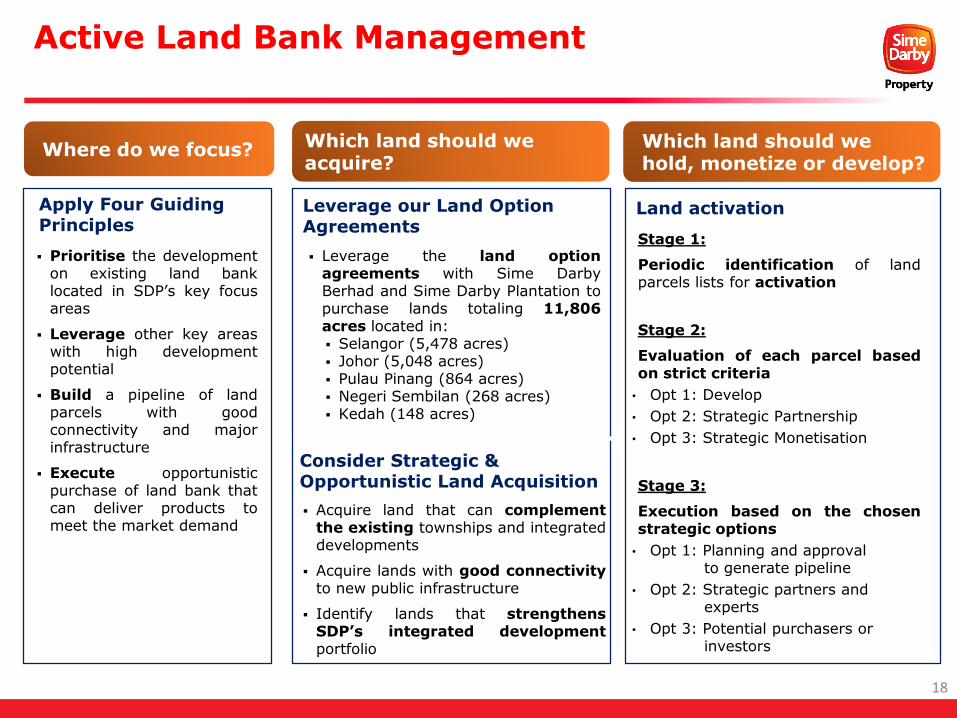
Active Land Bank Management
Apply Four Guiding Principles
Where do we focus?
Prioritise the developmenton existing land banklocated in SDP’s key focusareas
Leverage other key areaswith high developmentpotential
Build a pipeline of landparcels with goodconnectivity and majorinfrastructure
Execute opportunisticpurchase of land bank thatcan deliver products tomeet the market demand
Land activation
Which land should we acquire?
Which land should we hold, monetize or develop?
Stage 1:
Periodic identification of landparcels lists for activation
Stage 2:
Evaluation of each parcel basedon strict criteria
• Opt 1: Develop
• Opt 2: Strategic Partnership
• Opt 3: Strategic Monetisation
Stage 3:
Execution based on the chosenstrategic options
• Opt 1: Planning and approvalto generate pipeline
• Opt 2: Strategic partners andexperts
• Opt 3: Potential purchasers orinvestors
Leverage our Land Option Agreements
Consider Strategic & Opportunistic Land Acquisition
Leverage the land optionagreements with Sime DarbyBerhad and Sime Darby Plantation topurchase lands totaling 11,806acres located in: Selangor (5,478 acres) Johor (5,048 acres) Pulau Pinang (864 acres) Negeri Sembilan (268 acres) Kedah (148 acres)
Acquire land that can complementthe existing townships and integrateddevelopments
Acquire lands with good connectivityto new public infrastructure
Identify lands that strengthensSDP’s integrated developmentportfolio
18
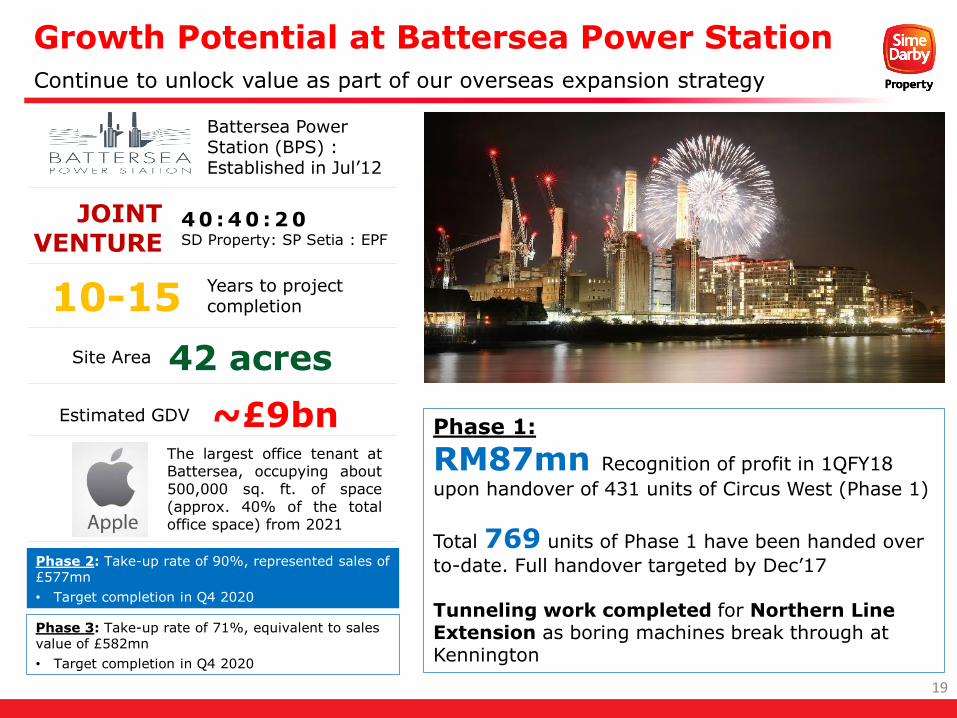
Growth Potential at Battersea Power Station
19
Continue to unlock value as part of our overseas expansion strategy
Battersea Power Station (BPS) : Established in Jul’12
JOINT VENTURE
4 0 : 4 0 : 2 0SD Property: SP Setia : EPF
10-15Years to project completion
42 acresSite Area
~£9bnEstimated GDV
Phase 2: Take-up rate of 90%, represented sales of £577mn
• Target completion in Q4 2020
The largest office tenant atBattersea, occupying about500,000 sq. ft. of space(approx. 40% of the totaloffice space) from 2021
Phase 3: Take-up rate of 71%, equivalent to sales value of £582mn
• Target completion in Q4 2020
Phase 1:
RM87mn Recognition of profit in 1QFY18
upon handover of 431 units of Circus West (Phase 1)
Total 769 units of Phase 1 have been handed over
to-date. Full handover targeted by Dec’17
Tunneling work completed for Northern Line Extension as boring machines break through at Kennington
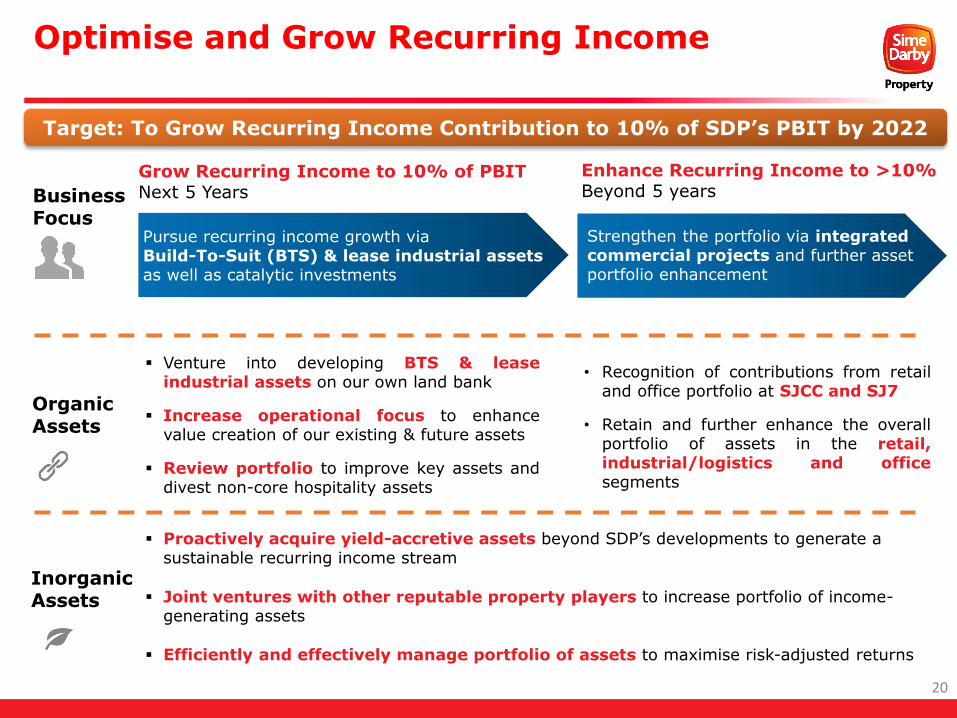
Optimise and Grow Recurring Income
Business Focus
Organic Assets
Inorganic Assets
Grow Recurring Income to 10% of PBITNext 5 Years
Enhance Recurring Income to >10%Beyond 5 years
Target: To Grow Recurring Income Contribution to 10% of SDP’s PBIT by 2022
Venture into developing BTS & leaseindustrial assets on our own land bank
Increase operational focus to enhancevalue creation of our existing & future assets
Review portfolio to improve key assets anddivest non-core hospitality assets
• Recognition of contributions from retailand office portfolio at SJCC and SJ7
• Retain and further enhance the overallportfolio of assets in the retail,industrial/logistics and officesegments
Pursue recurring income growth via Build-To-Suit (BTS) & lease industrial assets as well as catalytic investments
Strengthen the portfolio via integrated commercial projects and further asset portfolio enhancement
Proactively acquire yield-accretive assets beyond SDP’s developments to generate a sustainable recurring income stream
Joint ventures with other reputable property players to increase portfolio of income-generating assets
Efficiently and effectively manage portfolio of assets to maximise risk-adjusted returns
20
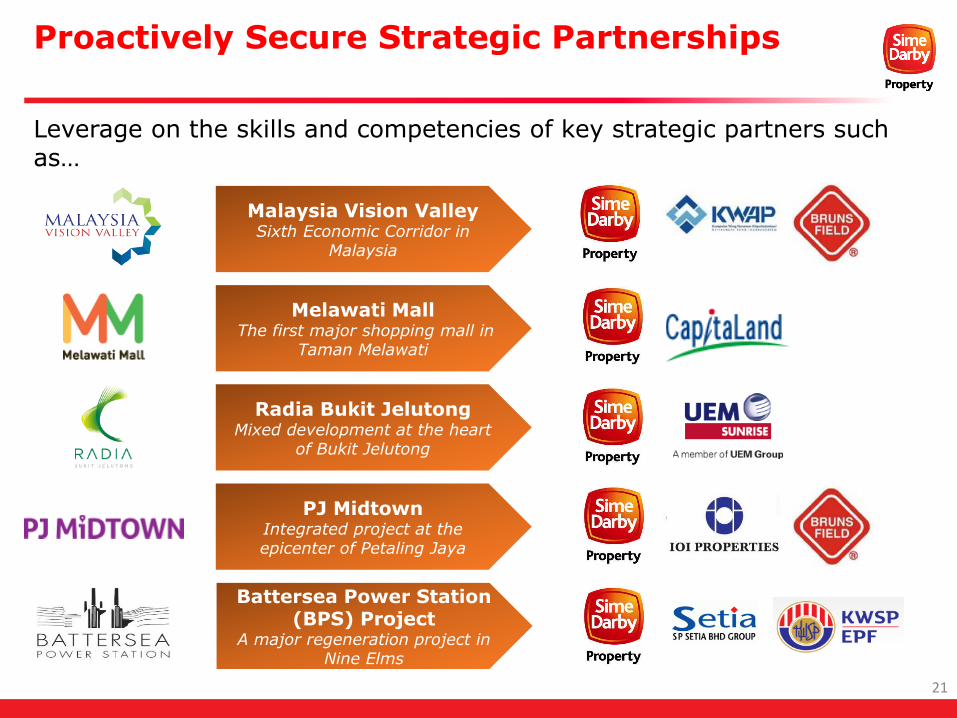
Proactively Secure Strategic Partnerships
Leverage on the skills and competencies of key strategic partners such as…
Malaysia Vision ValleySixth Economic Corridor in
Malaysia
PJ MidtownIntegrated project at the epicenter of Petaling Jaya
Battersea Power Station (BPS) Project
A major regeneration project in Nine Elms
Melawati MallThe first major shopping mall in
Taman Melawati
Radia Bukit JelutongMixed development at the heart
of Bukit Jelutong
21

Financial Overview
- First Quarter of FY2018
22
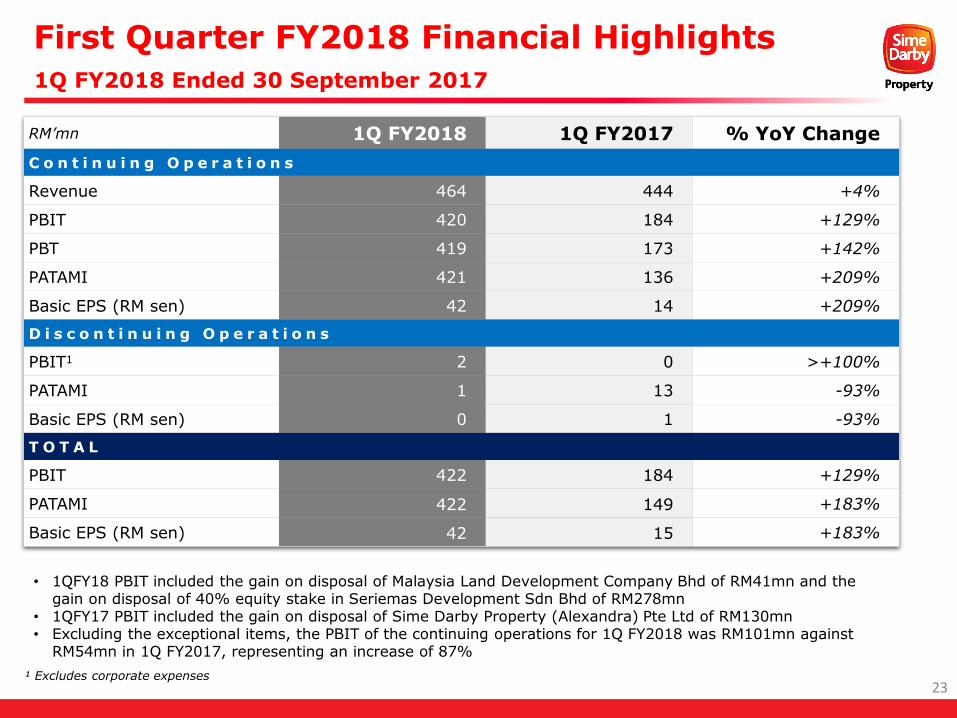
¹ Excludes corporate expenses
RM’mn 1Q FY2018 1Q FY2017 % YoY Change
C o n t i n u i n g O p e r a t i o n s
Revenue 464 444 +4%
PBIT 420 184 +129%
PBT 419 173 +142%
PATAMI 421 136 +209%
Basic EPS (RM sen) 42 14 +209%
D i s c o n t i n u i n g O p e r a t i o n s
PBIT1 2 0 >+100%
PATAMI 1 13 -93%
Basic EPS (RM sen) 0 1 -93%
T O T A L
PBIT 422 184 +129%
PATAMI 422 149 +183%
Basic EPS (RM sen) 42 15 +183%
First Quarter FY2018 Financial Highlights
1Q FY2018 Ended 30 September 2017
• 1QFY18 PBIT included the gain on disposal of Malaysia Land Development Company Bhd of RM41mn and the gain on disposal of 40% equity stake in Seriemas Development Sdn Bhd of RM278mn
• 1QFY17 PBIT included the gain on disposal of Sime Darby Property (Alexandra) Pte Ltd of RM130mn• Excluding the exceptional items, the PBIT of the continuing operations for 1Q FY2018 was RM101mn against
RM54mn in 1Q FY2017, representing an increase of 87%
23
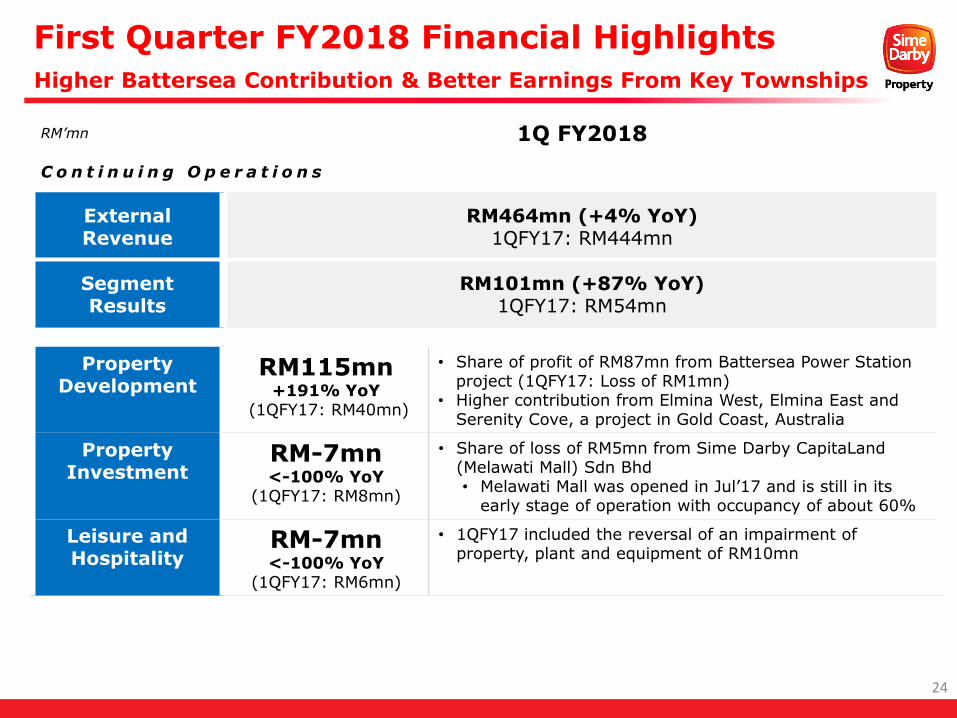
RM’mn 1Q FY2018
C o n t i n u i n g O p e r a t i o n s
External Revenue
RM464mn (+4% YoY)1QFY17: RM444mn
Segment Results
RM101mn (+87% YoY)1QFY17: RM54mn
Property Development
RM115mn+191% YoY
(1QFY17: RM40mn)
• Share of profit of RM87mn from Battersea Power Station project (1QFY17: Loss of RM1mn)
• Higher contribution from Elmina West, Elmina East and Serenity Cove, a project in Gold Coast, Australia
Property Investment
RM-7mn<-100% YoY
(1QFY17: RM8mn)
• Share of loss of RM5mn from Sime Darby CapitaLand (Melawati Mall) Sdn Bhd• Melawati Mall was opened in Jul’17 and is still in its
early stage of operation with occupancy of about 60%
Leisure and Hospitality
RM-7mn<-100% YoY
(1QFY17: RM6mn)
• 1QFY17 included the reversal of an impairment of property, plant and equipment of RM10mn
First Quarter FY2018 Financial Highlights
Higher Battersea Contribution & Better Earnings From Key Townships
24
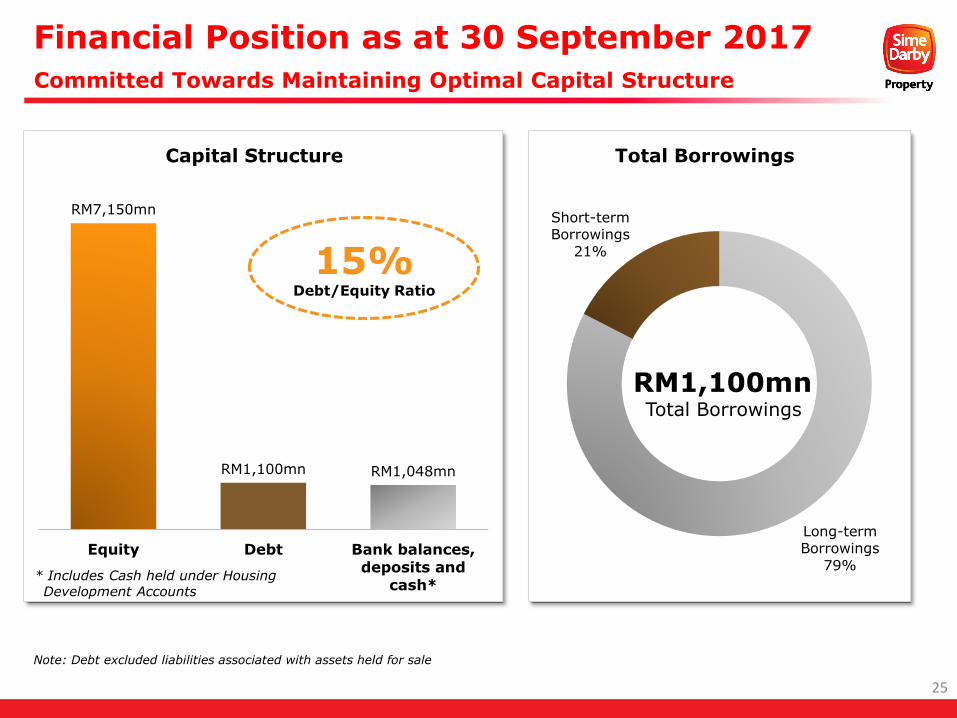
* Includes Cash held under Housing Development Accounts
Long-term Borrowings
79%
Short-term Borrowings
21%
Total Borrowings
RM1,100mnTotal Borrowings
RM7,150mn
RM1,100mn RM1,048mn
Equity Debt Bank balances,deposits and
cash*
Capital Structure
15%Debt/Equity Ratio
Financial Position as at 30 September 2017
Committed Towards Maintaining Optimal Capital Structure
Note: Debt excluded liabilities associated with assets held for sale
25

Financial Overview
- Historical (FY2015-17)
26
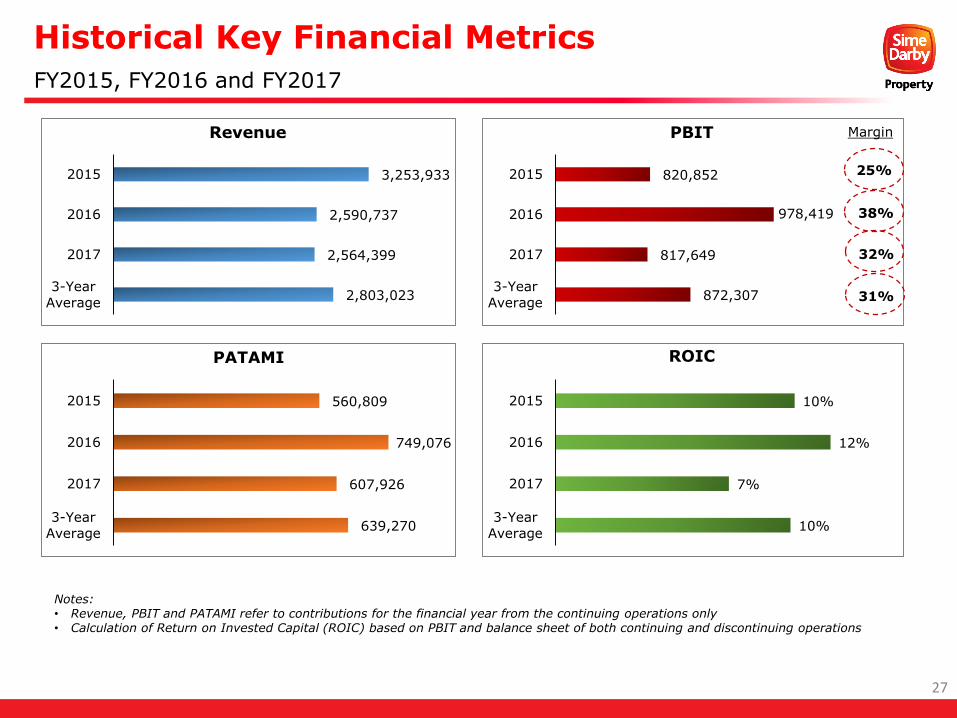
Historical Key Financial Metrics
FY2015, FY2016 and FY2017
Notes: • Revenue, PBIT and PATAMI refer to contributions for the financial year from the continuing operations only• Calculation of Return on Invested Capital (ROIC) based on PBIT and balance sheet of both continuing and discontinuing operations
27
2,803,023
2,564,399
2,590,737
3,253,933
3-Year
Average
2017
2016
2015
Revenue
639,270
607,926
749,076
560,809
3-Year
Average
2017
2016
2015
PATAMI
872,307
817,649
978,419
820,852
3-Year
Average
2017
2016
2015
PBIT
10%
7%
12%
10%
3-Year
Average
2017
2016
2015
ROIC
25%
38%
32%
31%
Margin
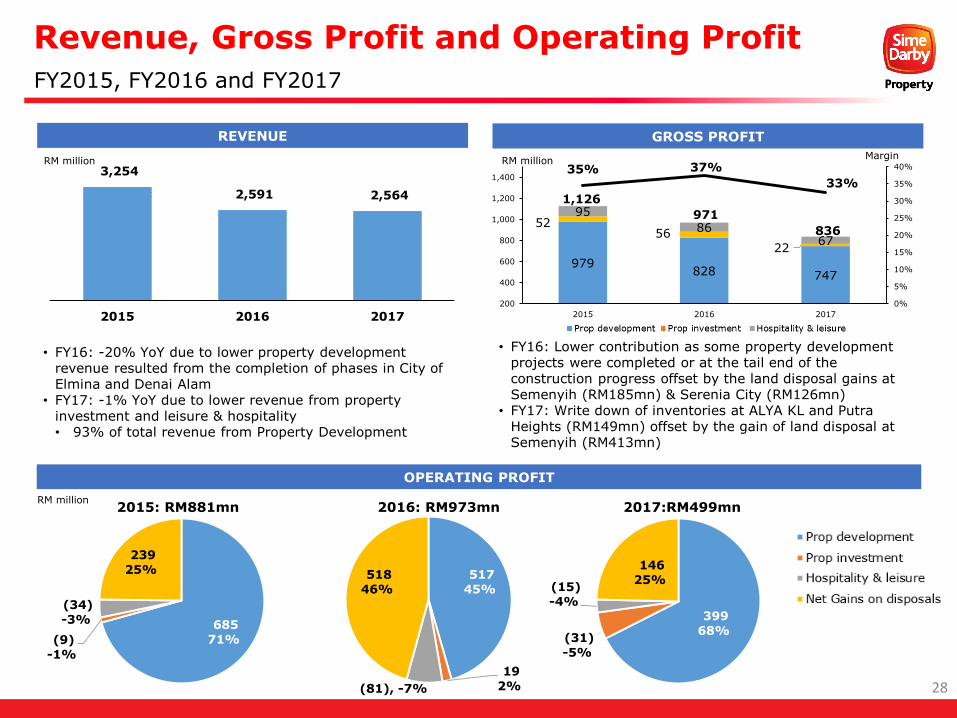
Revenue, Gross Profit and Operating Profit
FY2015, FY2016 and FY2017
RM million
REVENUE GROSS PROFIT
OPERATING PROFIT
RM million3,254
2,591 2,564
2015 2016 2017
• FY16: -20% YoY due to lower property development revenue resulted from the completion of phases in City of Elmina and Denai Alam
• FY17: -1% YoY due to lower revenue from property investment and leisure & hospitality• 93% of total revenue from Property Development
• FY16: Lower contribution as some property development projects were completed or at the tail end of the construction progress offset by the land disposal gains at Semenyih (RM185mn) & Serenia City (RM126mn)
• FY17: Write down of inventories at ALYA KL and Putra Heights (RM149mn) offset by the gain of land disposal at Semenyih (RM413mn)
RM million
28
979828 747
5256
22
95
8667
35% 37%
33%
0%
5%
10%
15%
20%
25%
30%
35%
40%
200
400
600
800
1,000
1,200
1,400
2015 2016 2017
Margin
1,126
971
836
685
71%(9)
-1%
(34)
-3%
239
25% 517
45%
19
2%(81), -7%
518
46%
399
68%(31)
-5%
(15)
-4%
146
25%
2015: RM881mn 2016: RM973mn 2017:RM499mn
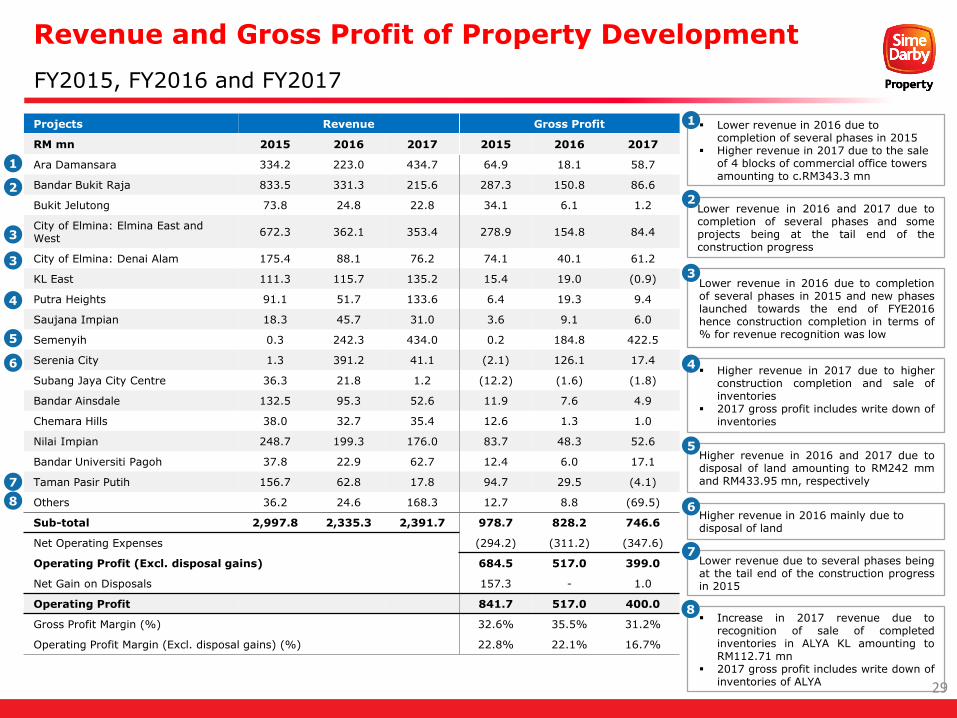
Increase in 2017 revenue due torecognition of sale of completedinventories in ALYA KL amounting toRM112.71 mn
2017 gross profit includes write down ofinventories of ALYA
Revenue and Gross Profit of Property Development
FY2015, FY2016 and FY2017
Projects Revenue Gross Profit
RM mn 2015 2016 2017 2015 2016 2017
Ara Damansara 334.2 223.0 434.7 64.9 18.1 58.7
Bandar Bukit Raja 833.5 331.3 215.6 287.3 150.8 86.6
Bukit Jelutong 73.8 24.8 22.8 34.1 6.1 1.2
City of Elmina: Elmina East and West
672.3 362.1 353.4 278.9 154.8 84.4
City of Elmina: Denai Alam 175.4 88.1 76.2 74.1 40.1 61.2
KL East 111.3 115.7 135.2 15.4 19.0 (0.9)
Putra Heights 91.1 51.7 133.6 6.4 19.3 9.4
Saujana Impian 18.3 45.7 31.0 3.6 9.1 6.0
Semenyih 0.3 242.3 434.0 0.2 184.8 422.5
Serenia City 1.3 391.2 41.1 (2.1) 126.1 17.4
Subang Jaya City Centre 36.3 21.8 1.2 (12.2) (1.6) (1.8)
Bandar Ainsdale 132.5 95.3 52.6 11.9 7.6 4.9
Chemara Hills 38.0 32.7 35.4 12.6 1.3 1.0
Nilai Impian 248.7 199.3 176.0 83.7 48.3 52.6
Bandar Universiti Pagoh 37.8 22.9 62.7 12.4 6.0 17.1
Taman Pasir Putih 156.7 62.8 17.8 94.7 29.5 (4.1)
Others 36.2 24.6 168.3 12.7 8.8 (69.5)
Sub-total 2,997.8 2,335.3 2,391.7 978.7 828.2 746.6
Net Operating Expenses (294.2) (311.2) (347.6)
Operating Profit (Excl. disposal gains) 684.5 517.0 399.0
Net Gain on Disposals 157.3 - 1.0
Operating Profit 841.7 517.0 400.0
Gross Profit Margin (%) 32.6% 35.5% 31.2%
Operating Profit Margin (Excl. disposal gains) (%) 22.8% 22.1% 16.7%
Higher revenue in 2016 mainly due to disposal of land
Lower revenue in 2016 and 2017 due tocompletion of several phases and someprojects being at the tail end of theconstruction progress
Lower revenue in 2016 due to completion of several phases in 2015
Higher revenue in 2017 due to the sale of 4 blocks of commercial office towers amounting to c.RM343.3 mn
1
2
5
8
1
2
Higher revenue in 2017 due to higherconstruction completion and sale ofinventories
2017 gross profit includes write down ofinventories
Higher revenue in 2016 and 2017 due todisposal of land amounting to RM242 mmand RM433.95 mn, respectively
Lower revenue in 2016 due to completionof several phases in 2015 and new phaseslaunched towards the end of FYE2016hence construction completion in terms of% for revenue recognition was low
3
3
3
4
46
5
6
Lower revenue due to several phases beingat the tail end of the construction progressin 2015
7
7
8
29
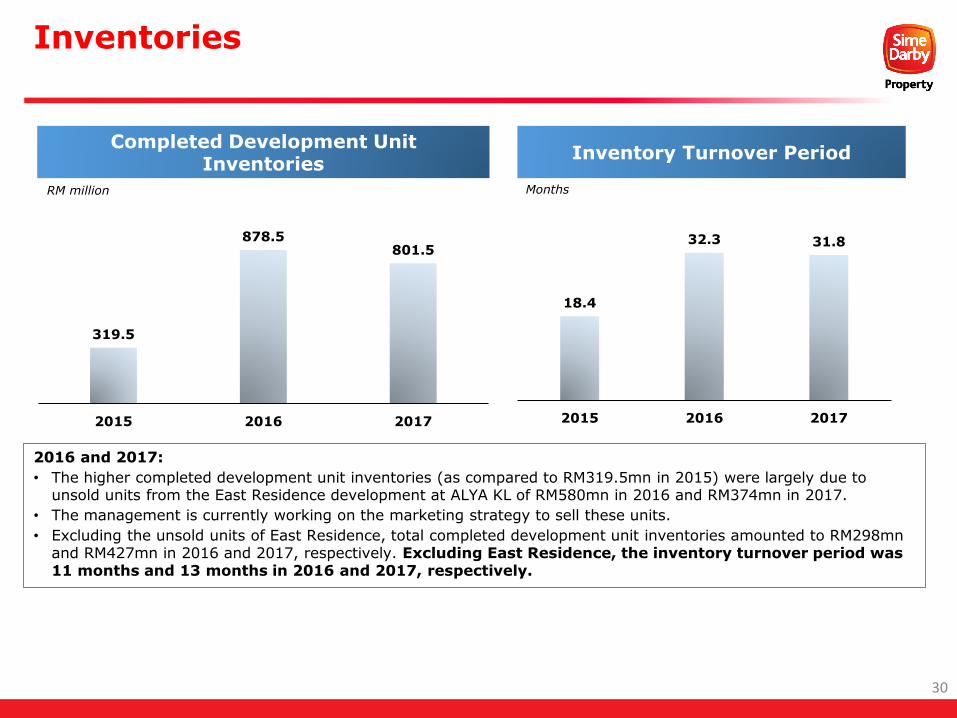
Inventories
319.5
878.5801.5
2015 2016 2017
Completed Development Unit Inventories
RM million
Inventory Turnover Period
18.4
32.3 31.8
2015 2016 2017
Months
2016 and 2017:
• The higher completed development unit inventories (as compared to RM319.5mn in 2015) were largely due to unsold units from the East Residence development at ALYA KL of RM580mn in 2016 and RM374mn in 2017.
• The management is currently working on the marketing strategy to sell these units.
• Excluding the unsold units of East Residence, total completed development unit inventories amounted to RM298mn and RM427mn in 2016 and 2017, respectively. Excluding East Residence, the inventory turnover period was 11 months and 13 months in 2016 and 2017, respectively.
30
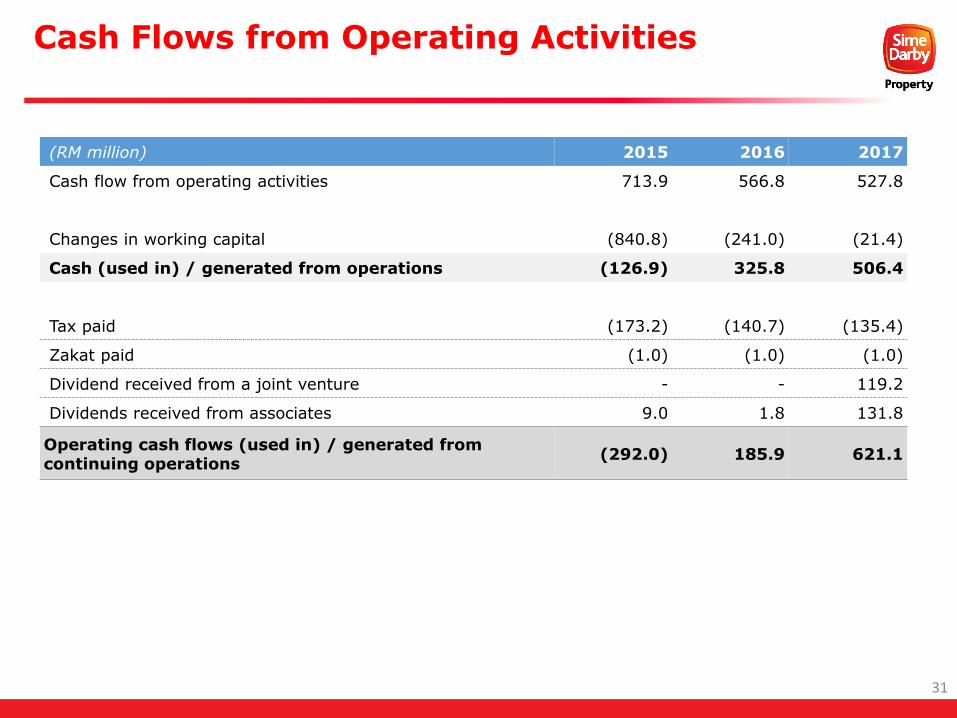
Cash Flows from Operating Activities
(RM million) 2015 2016 2017
Cash flow from operating activities 713.9 566.8 527.8
Changes in working capital (840.8) (241.0) (21.4)
Cash (used in) / generated from operations (126.9) 325.8 506.4
Tax paid (173.2) (140.7) (135.4)
Zakat paid (1.0) (1.0) (1.0)
Dividend received from a joint venture - - 119.2
Dividends received from associates 9.0 1.8 131.8
Operating cash flows (used in) / generated from continuing operations
(292.0) 185.9 621.1
31
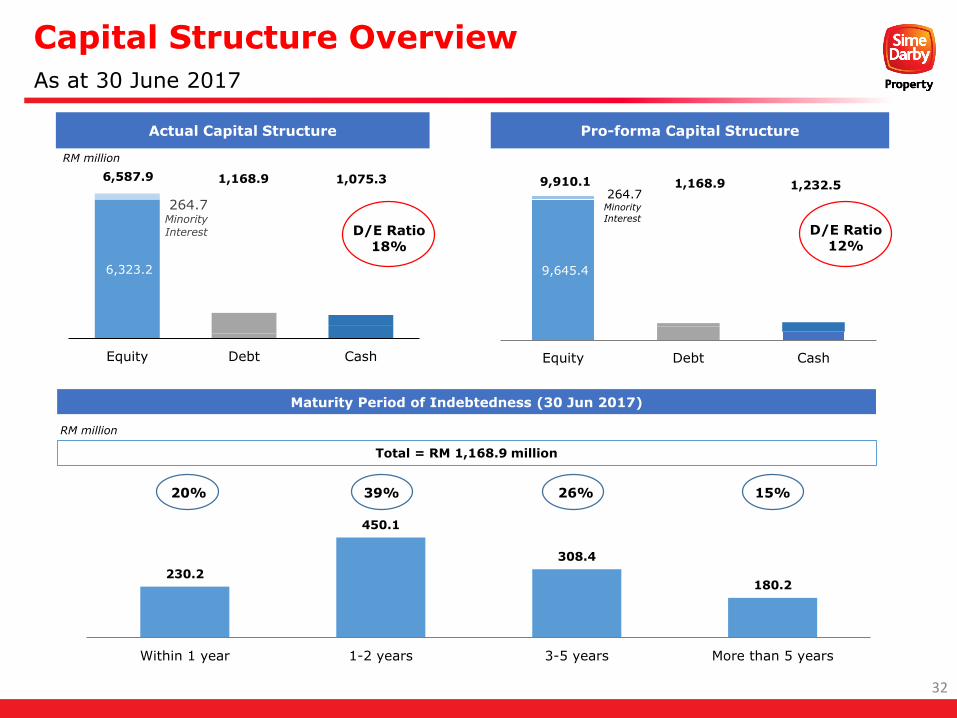
6,323.2
264.7 Minority Interest
Equity Debt Cash
9,645.4
264.7 Minority
Interest
9,910.1 1,168.9 1,232.5
Equity Debt Cash
Capital Structure Overview
As at 30 June 2017
Pro-forma Capital Structure
Maturity Period of Indebtedness (30 Jun 2017)
RM million
Total = RM 1,168.9 million
230.2
450.1
308.4
180.2
Within 1 year 1-2 years 3-5 years More than 5 years
RM million
32
20% 39% 26% 15%
Actual Capital Structure
6,587.9 1,168.9 1,075.3
D/E Ratio18%
D/E Ratio12%
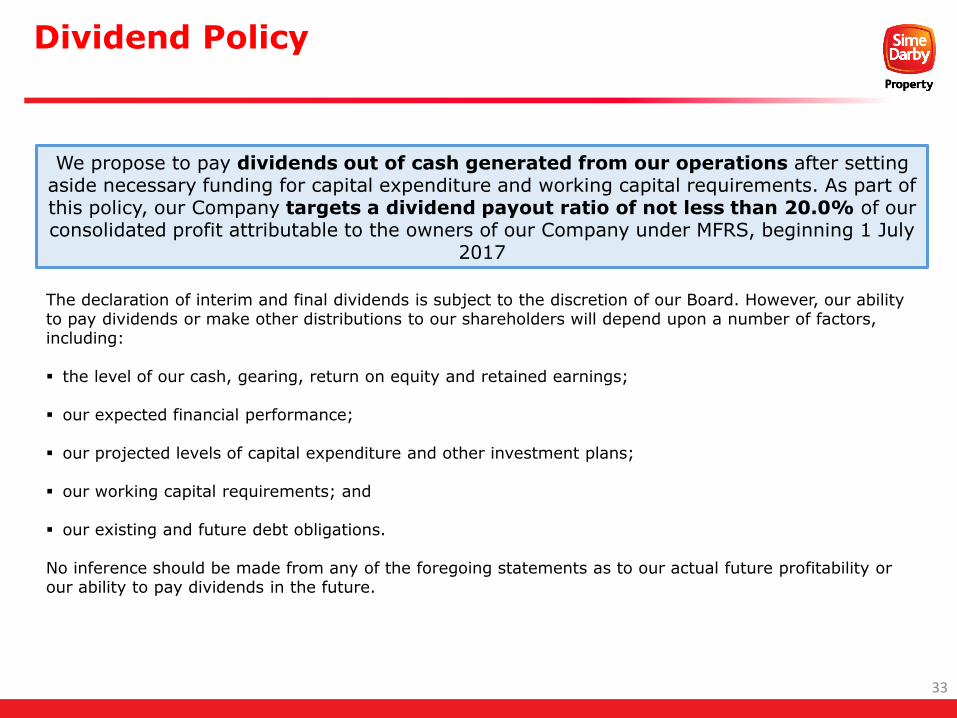
Dividend Policy
The declaration of interim and final dividends is subject to the discretion of our Board. However, our ability to pay dividends or make other distributions to our shareholders will depend upon a number of factors, including:
the level of our cash, gearing, return on equity and retained earnings;
our expected financial performance;
our projected levels of capital expenditure and other investment plans;
our working capital requirements; and
our existing and future debt obligations.
No inference should be made from any of the foregoing statements as to our actual future profitability or our ability to pay dividends in the future.
We propose to pay dividends out of cash generated from our operations after setting aside necessary funding for capital expenditure and working capital requirements. As part of this policy, our Company targets a dividend payout ratio of not less than 20.0% of our consolidated profit attributable to the owners of our Company under MFRS, beginning 1 July
2017
33

Industry Outlook
34
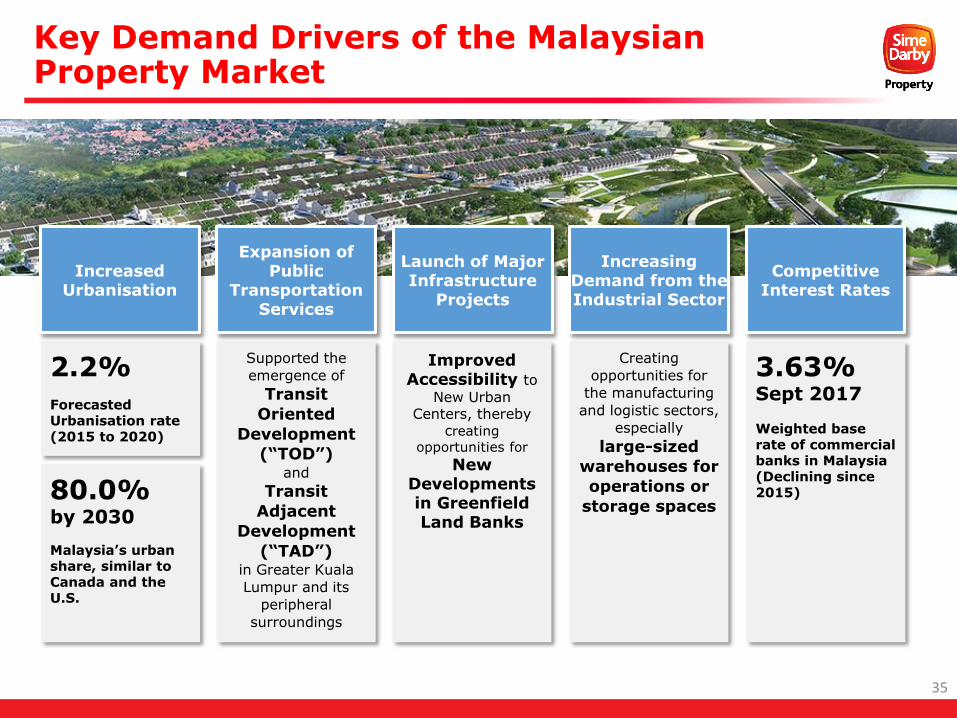
Key Demand Drivers of the Malaysian Property Market
Expansion of Public
Transportation Services
Competitive Interest Rates
Launch of Major Infrastructure
Projects
Increased Urbanisation
Increasing Demand from the Industrial Sector
2.2%
Forecasted Urbanisation rate (2015 to 2020)
80.0% by 2030
Malaysia’s urban share, similar to Canada and the U.S.
Supported the
emergence of
Transit
Oriented
Development
(“TOD”) and
Transit
Adjacent
Development
(“TAD”) in Greater Kuala
Lumpur and its
peripheral
surroundings
Improved Accessibility to
New Urban Centers, thereby
creating
opportunities for
New Developments in Greenfield Land Banks
Creating
opportunities for
the manufacturing
and logistic sectors,
especially
large-sized
warehouses for
operations or
storage spaces
3.63% Sept 2017
Weighted base rate of commercial banks in Malaysia(Declining since 2015)
35
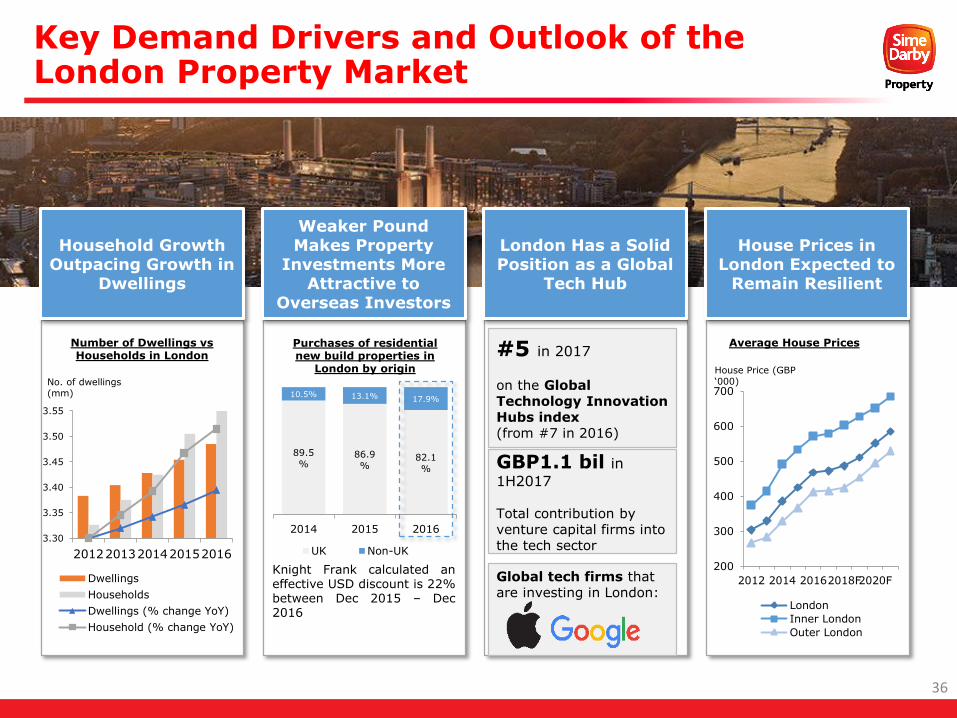
Key Demand Drivers and Outlook of the London Property Market
Global tech firms that are investing in London:
Weaker Pound Makes Property
Investments More Attractive to
Overseas Investors
Household Growth Outpacing Growth in
Dwellings
London Has a Solid Position as a Global
Tech Hub
3.30
3.35
3.40
3.45
3.50
3.55
20122013201420152016
Dwellings
Households
Dwellings (% change YoY)
Household (% change YoY)
Number of Dwellings vs Households in London
No. of dwellings (mm)
Knight Frank calculated aneffective USD discount is 22%between Dec 2015 – Dec2016
89.5
%86.9
%82.1
%
10.5% 13.1% 17.9%
2014 2015 2016
UK Non-UK
Purchases of residential new build properties in
London by origin
#5 in 2017
on the Global Technology Innovation Hubs index (from #7 in 2016)
GBP1.1 bil in
1H2017
Total contribution by venture capital firms into the tech sector
House Prices in London Expected to
Remain Resilient
200
300
400
500
600
700
2012 2014 20162018F2020F
London
Inner London
Outer London
House Price (GBP ‘000)
Average House Prices
36

Thank You

Appendix
38
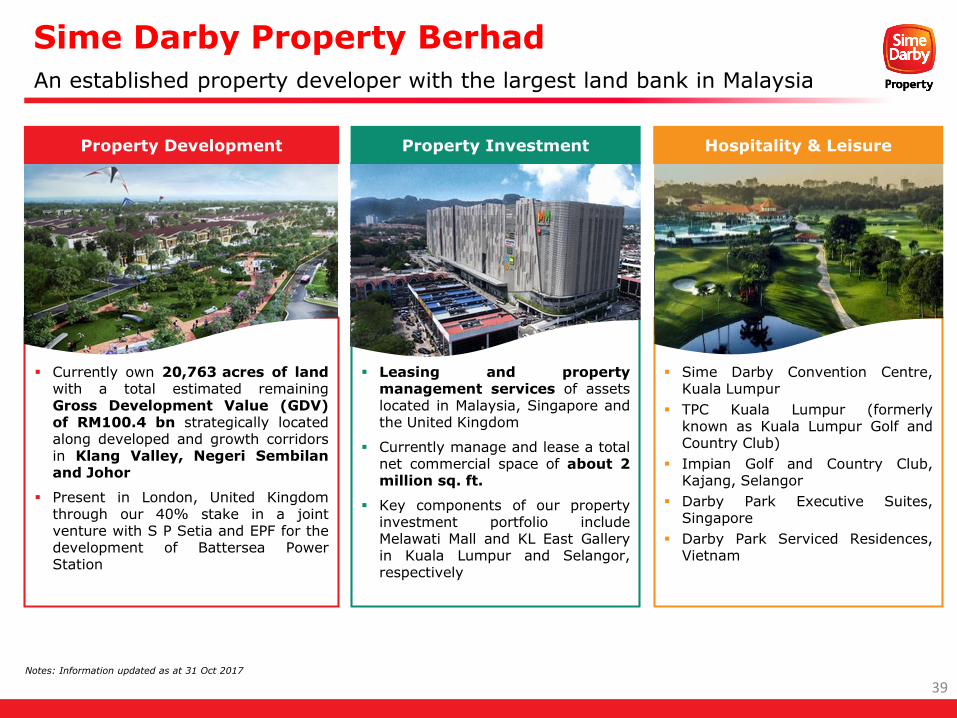
Sime Darby Property Berhad
An established property developer with the largest land bank in Malaysia
Leasing and propertymanagement services of assetslocated in Malaysia, Singapore andthe United Kingdom
Currently manage and lease a totalnet commercial space of about 2million sq. ft.
Key components of our propertyinvestment portfolio includeMelawati Mall and KL East Galleryin Kuala Lumpur and Selangor,respectively
Sime Darby Convention Centre,Kuala Lumpur
TPC Kuala Lumpur (formerlyknown as Kuala Lumpur Golf andCountry Club)
Impian Golf and Country Club,Kajang, Selangor
Darby Park Executive Suites,Singapore
Darby Park Serviced Residences,Vietnam
Currently own 20,763 acres of landwith a total estimated remainingGross Development Value (GDV)of RM100.4 bn strategically locatedalong developed and growth corridorsin Klang Valley, Negeri Sembilanand Johor
Present in London, United Kingdomthrough our 40% stake in a jointventure with S P Setia and EPF for thedevelopment of Battersea PowerStation
Property Investment Hospitality & LeisureProperty Development
39Notes: Information updated as at 31 Oct 2017
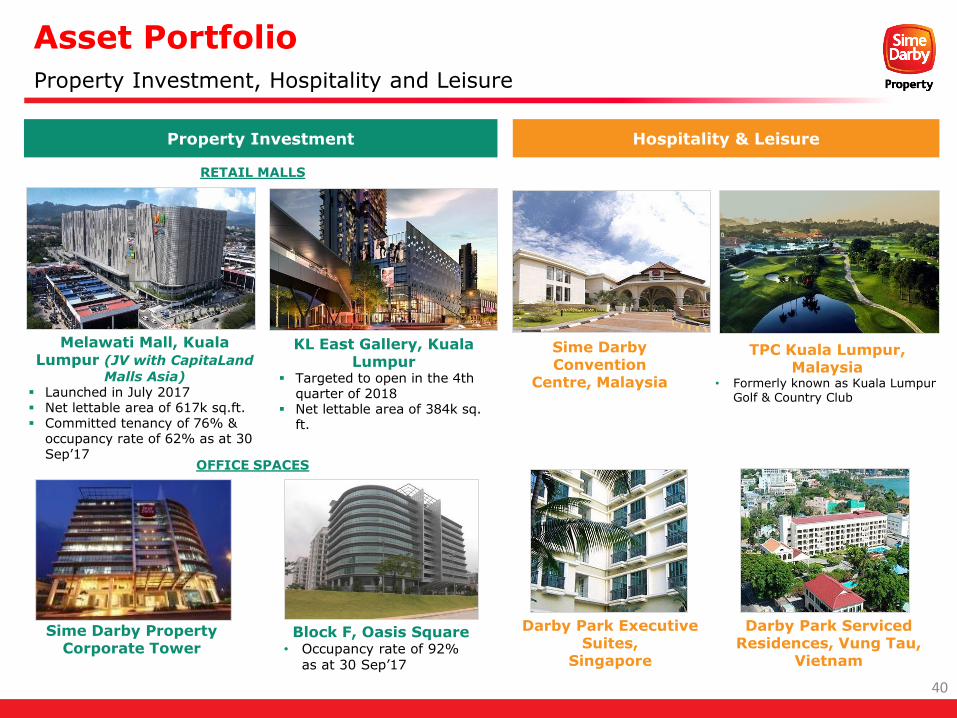
Melawati Mall, Kuala Lumpur (JV with CapitaLand
Malls Asia) Launched in July 2017 Net lettable area of 617k sq.ft. Committed tenancy of 76% &
occupancy rate of 62% as at 30 Sep’17
KL East Gallery, Kuala Lumpur
Targeted to open in the 4th quarter of 2018
Net lettable area of 384k sq. ft.
Sime Darby Convention
Centre, Malaysia
TPC Kuala Lumpur, Malaysia
• Formerly known as Kuala Lumpur Golf & Country Club
Darby Park Executive Suites,
Singapore
Darby Park Serviced Residences, Vung Tau,
Vietnam
Sime Darby Property Corporate Tower
Block F, Oasis Square• Occupancy rate of 92%
as at 30 Sep’17
Asset Portfolio
Property Investment, Hospitality and Leisure
Property Investment Hospitality & Leisure
RETAIL MALLS
OFFICE SPACES
40
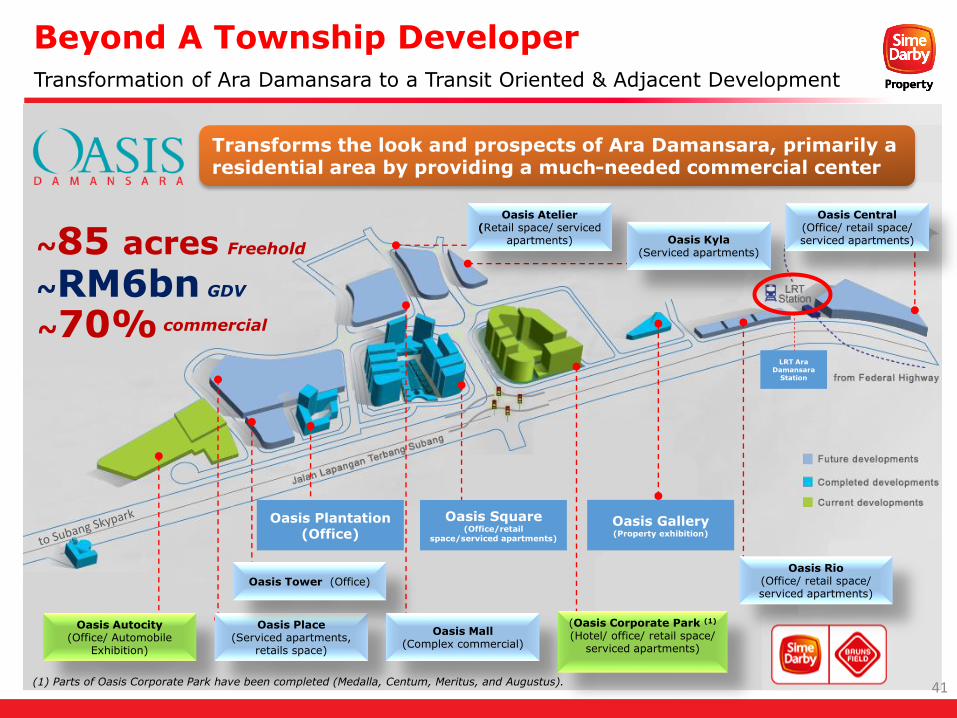
Beyond A Township Developer
Transforms the look and prospects of Ara Damansara, primarily a residential area by providing a much-needed commercial center
~RM6bn~70% commercial
GDV
~85 acres
Oasis Autocity(Office/ Automobile
Exhibition)
Oasis Place(Serviced apartments,
retails space)
Oasis Tower (Office)
Oasis Plantation (Office)
Oasis Mall (Complex commercial)
Oasis Square (Office/ retail space/ serviced apartments)
Oasis Atelier(Retail space/ serviced
apartments) Oasis Kyla (Serviced apartments)
(Oasis Corporate Park (1)
(Hotel/ office/ retail space/ serviced apartments)
Oasis Rio (Office/ retail space/ serviced apartments)
Oasis Gallery (Property exhibition)
Oasis Central (Office/ retail space/ serviced apartments)
(1) Parts of Oasis Corporate Park have been completed (Medalla, Centum, Meritus, and Augustus).
Transformation of Ara Damansara to a Transit Oriented & Adjacent Development
41
Oasis Plantation(Office)
Oasis Square(Office/retail
space/serviced apartments)
Oasis Gallery(Property exhibition)
LRT Ara Damansara
Station
Freehold
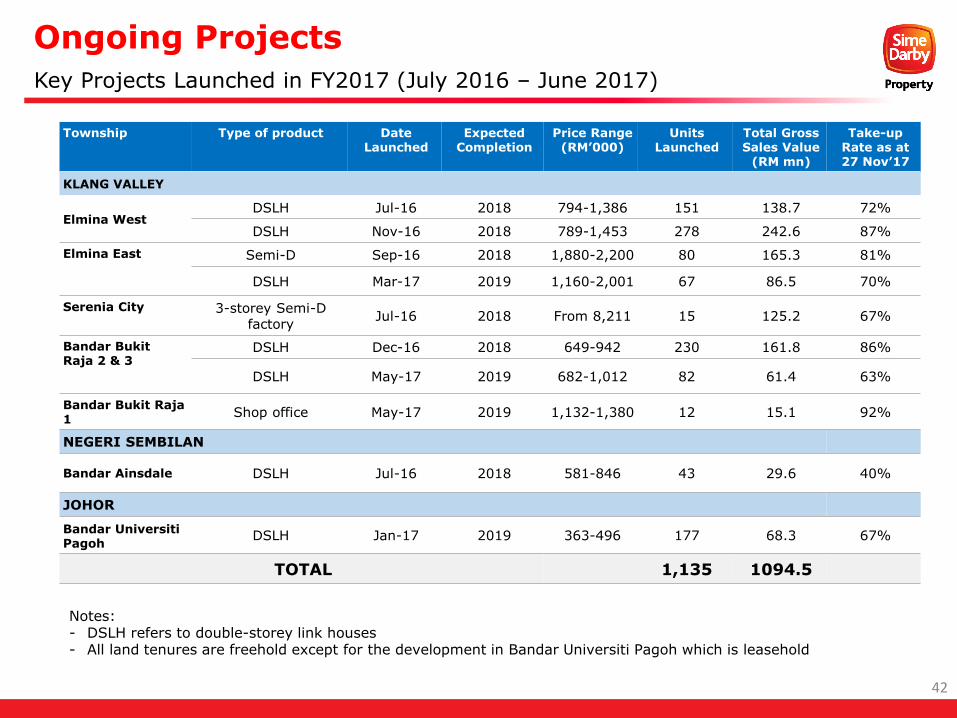
Township Type of product Date Launched
ExpectedCompletion
Price Range (RM’000)
Units Launched
Total Gross Sales Value
(RM mn)
Take-up Rate as at 27 Nov’17
KLANG VALLEY
Elmina WestDSLH Jul-16 2018 794-1,386 151 138.7 72%
DSLH Nov-16 2018 789-1,453 278 242.6 87%
Elmina East Semi-D Sep-16 2018 1,880-2,200 80 165.3 81%
DSLH Mar-17 2019 1,160-2,001 67 86.5 70%
Serenia City 3-storey Semi-D factory
Jul-16 2018 From 8,211 15 125.2 67%
Bandar Bukit Raja 2 & 3
DSLH Dec-16 2018 649-942 230 161.8 86%
DSLH May-17 2019 682-1,012 82 61.4 63%
Bandar Bukit Raja 1
Shop office May-17 2019 1,132-1,380 12 15.1 92%
NEGERI SEMBILAN
Bandar Ainsdale DSLH Jul-16 2018 581-846 43 29.6 40%
JOHOR
Bandar UniversitiPagoh
DSLH Jan-17 2019 363-496 177 68.3 67%
TOTAL 1,135 1094.5
Ongoing Projects
Key Projects Launched in FY2017 (July 2016 – June 2017)
Notes: - DSLH refers to double-storey link houses- All land tenures are freehold except for the development in Bandar Universiti Pagoh which is leasehold
42
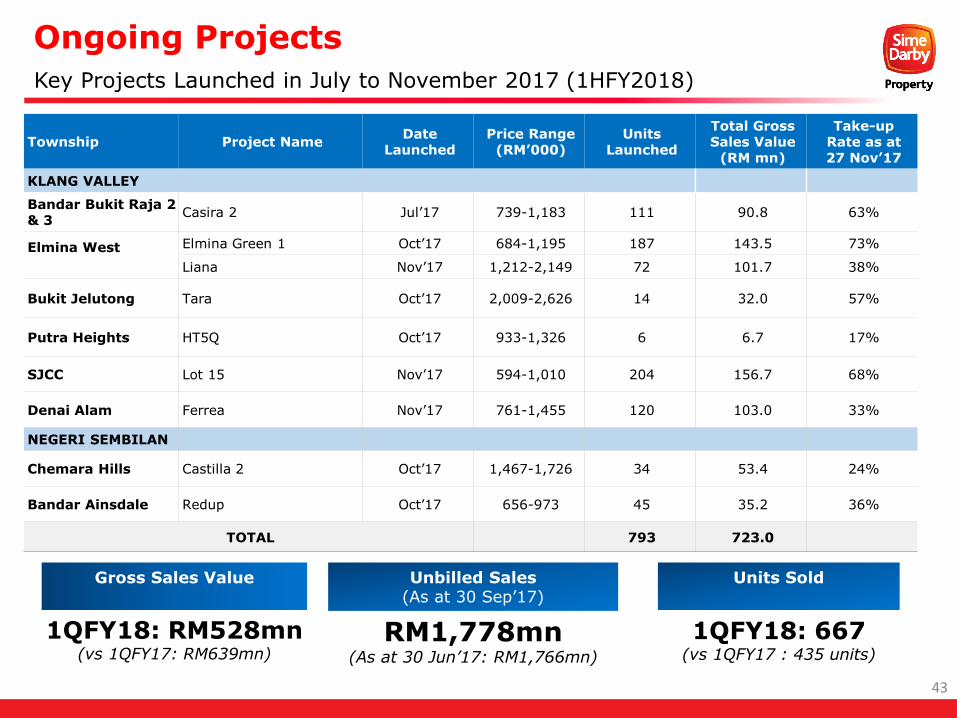
Township Project NameDate
LaunchedPrice Range
(RM’000)Units
Launched
Total Gross Sales Value
(RM mn)
Take-up Rate as at 27 Nov’17
KLANG VALLEY
Bandar Bukit Raja 2 & 3
Casira 2 Jul’17 739-1,183 111 90.8 63%
Elmina West Elmina Green 1 Oct’17 684-1,195 187 143.5 73%
Liana Nov’17 1,212-2,149 72 101.7 38%
Bukit Jelutong Tara Oct’17 2,009-2,626 14 32.0 57%
Putra Heights HT5Q Oct’17 933-1,326 6 6.7 17%
SJCC Lot 15 Nov’17 594-1,010 204 156.7 68%
Denai Alam Ferrea Nov’17 761-1,455 120 103.0 33%
NEGERI SEMBILAN
Chemara Hills Castilla 2 Oct’17 1,467-1,726 34 53.4 24%
Bandar Ainsdale Redup Oct’17 656-973 45 35.2 36%
TOTAL 793 723.0
Ongoing Projects
Key Projects Launched in July to November 2017 (1HFY2018)
43
Gross Sales Value Unbilled Sales (As at 30 Sep’17)
Units Sold
1QFY18: 667(vs 1QFY17 : 435 units)
RM1,778mn(As at 30 Jun’17: RM1,766mn)
1QFY18: RM528mn(vs 1QFY17: RM639mn)
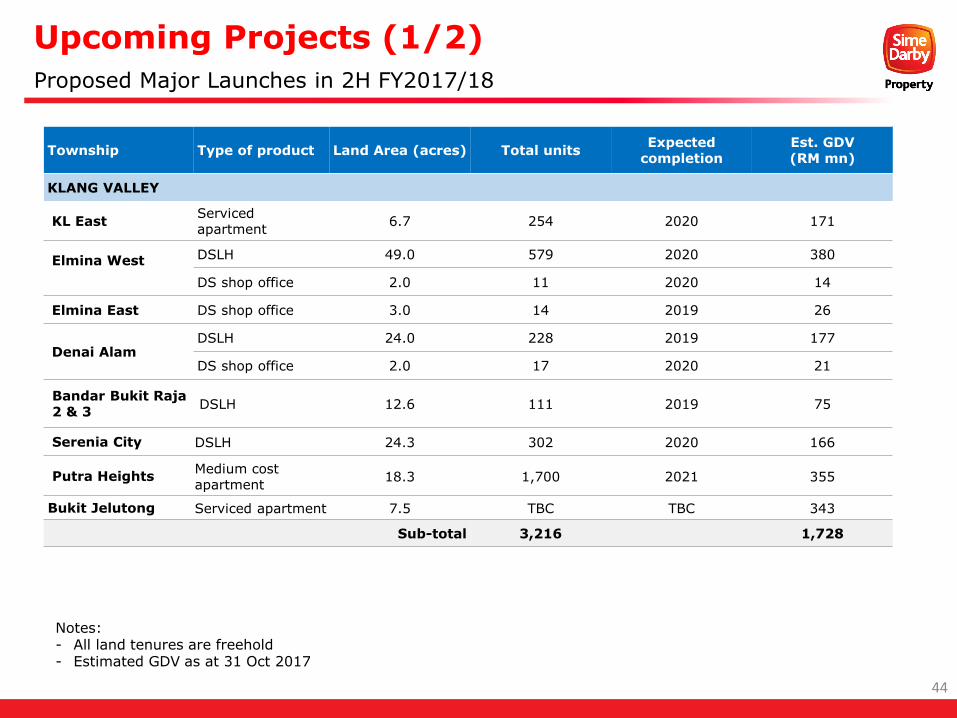
Upcoming Projects (1/2)
Proposed Major Launches in 2H FY2017/18
Township Type of product Land Area (acres) Total unitsExpected
completionEst. GDV (RM mn)
KLANG VALLEY
KL EastServicedapartment
6.7 254 2020 171
Elmina West DSLH 49.0 579 2020 380
DS shop office 2.0 11 2020 14
Elmina East DS shop office 3.0 14 2019 26
Denai AlamDSLH 24.0 228 2019 177
DS shop office 2.0 17 2020 21
Bandar Bukit Raja2 & 3
DSLH 12.6 111 2019 75
Serenia City DSLH 24.3 302 2020 166
Putra HeightsMedium cost apartment
18.3 1,700 2021 355
Bukit Jelutong Serviced apartment 7.5 TBC TBC 343
Sub-total 3,216 1,728
Notes: - All land tenures are freehold - Estimated GDV as at 31 Oct 2017
44
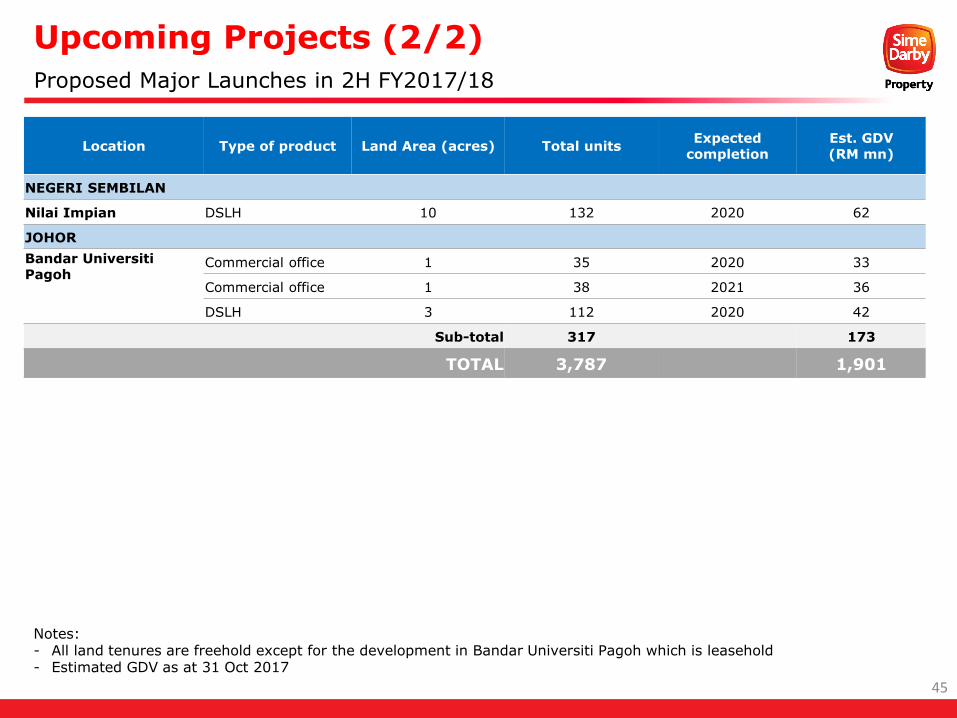
Upcoming Projects (2/2)
Proposed Major Launches in 2H FY2017/18
Location Type of product Land Area (acres) Total unitsExpected
completionEst. GDV(RM mn)
NEGERI SEMBILAN
Nilai Impian DSLH 10 132 2020 62
JOHOR
Bandar UniversitiPagoh
Commercial office 1 35 2020 33
Commercial office 1 38 2021 36
DSLH 3 112 2020 42
Sub-total 317 173
TOTAL 3,787 1,901
Notes: - All land tenures are freehold except for the development in Bandar Universiti Pagoh which is leasehold- Estimated GDV as at 31 Oct 2017
45
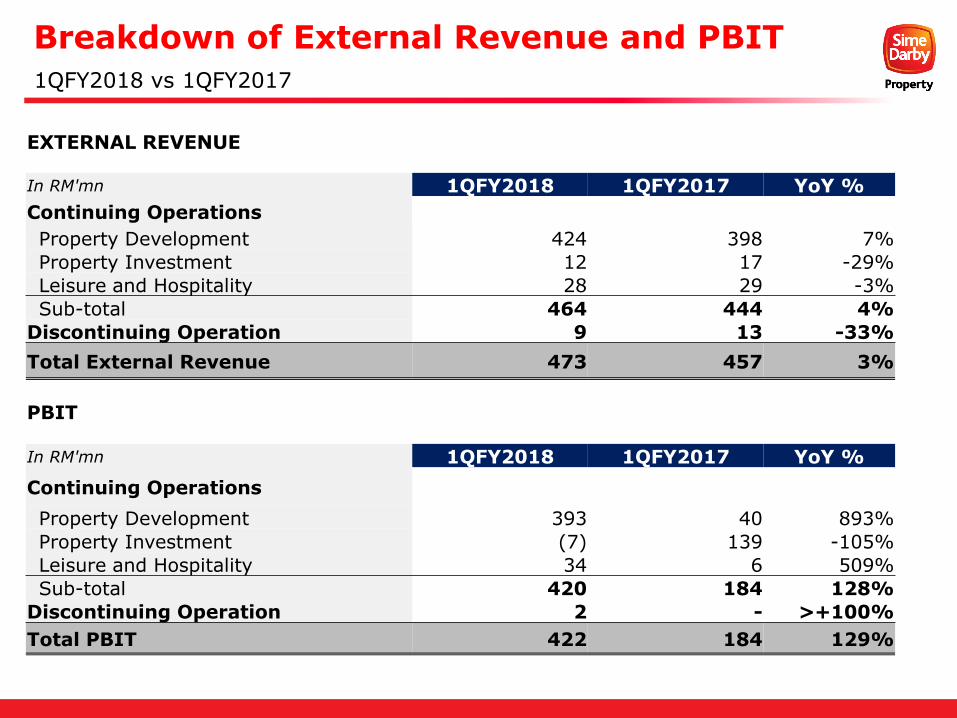
Breakdown of External Revenue and PBIT
1QFY2018 vs 1QFY2017
EXTERNAL REVENUE
In RM'mn 1QFY2018 1QFY2017 YoY %
Continuing Operations
Property Development 424 398 7%
Property Investment 12 17 -29%
Leisure and Hospitality 28 29 -3%
Sub-total 464 444 4%
Discontinuing Operation 9 13 -33%
Total External Revenue 473 457 3%
PBIT
In RM'mn 1QFY2018 1QFY2017 YoY %
Continuing Operations
Property Development 393 40 893%
Property Investment (7) 139 -105%
Leisure and Hospitality 34 6 509%
Sub-total 420 184 128%
Discontinuing Operation 2 - >+100%
Total PBIT 422 184 129%
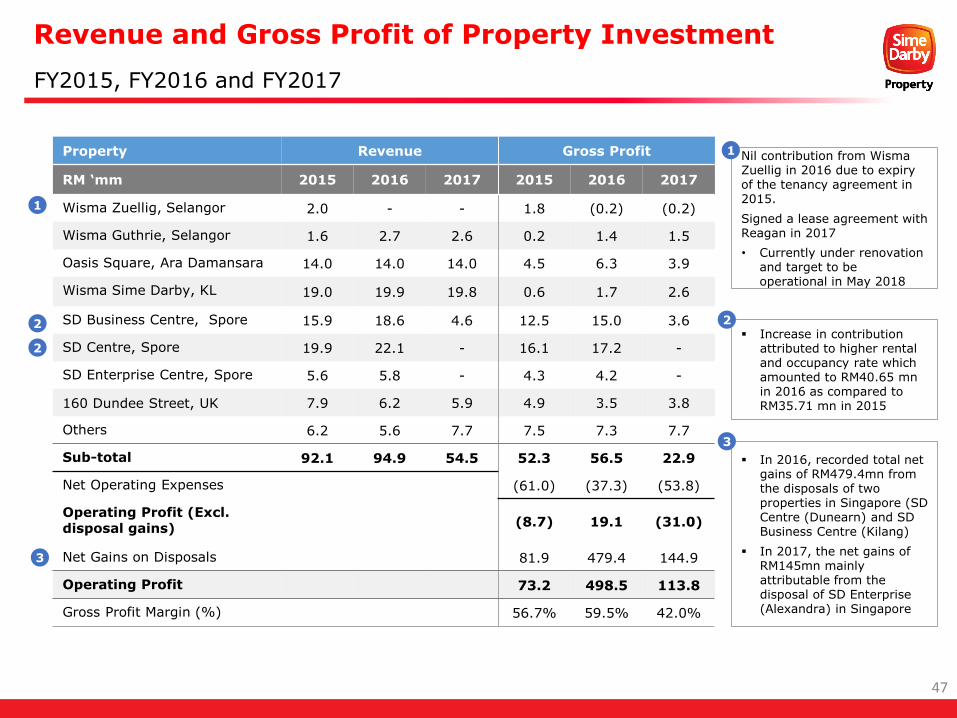
Revenue and Gross Profit of Property Investment
FY2015, FY2016 and FY2017
Property Revenue Gross Profit
RM ‘mm 2015 2016 2017 2015 2016 2017
Wisma Zuellig, Selangor 2.0 - - 1.8 (0.2) (0.2)
Wisma Guthrie, Selangor 1.6 2.7 2.6 0.2 1.4 1.5
Oasis Square, Ara Damansara 14.0 14.0 14.0 4.5 6.3 3.9
Wisma Sime Darby, KL 19.0 19.9 19.8 0.6 1.7 2.6
SD Business Centre, Spore 15.9 18.6 4.6 12.5 15.0 3.6
SD Centre, Spore 19.9 22.1 - 16.1 17.2 -
SD Enterprise Centre, Spore 5.6 5.8 - 4.3 4.2 -
160 Dundee Street, UK 7.9 6.2 5.9 4.9 3.5 3.8
Others 6.2 5.6 7.7 7.5 7.3 7.7
Sub-total 92.1 94.9 54.5 52.3 56.5 22.9
Net Operating Expenses (61.0) (37.3) (53.8)
Operating Profit (Excl.disposal gains) (8.7) 19.1 (31.0)
Net Gains on Disposals 81.9 479.4 144.9
Operating Profit 73.2 498.5 113.8
Gross Profit Margin (%) 56.7% 59.5% 42.0%
Nil contribution from Wisma Zuellig in 2016 due to expiry of the tenancy agreement in 2015.
Signed a lease agreement with Reagan in 2017
• Currently under renovation and target to be operational in May 2018
1
Increase in contribution attributed to higher rental and occupancy rate which amounted to RM40.65 mn in 2016 as compared to RM35.71 mn in 2015
1
2
2
2
47
3
In 2016, recorded total net gains of RM479.4mn from the disposals of two properties in Singapore (SD Centre (Dunearn) and SD Business Centre (Kilang)
In 2017, the net gains of RM145mn mainly attributable from the disposal of SD Enterprise (Alexandra) in Singapore
3
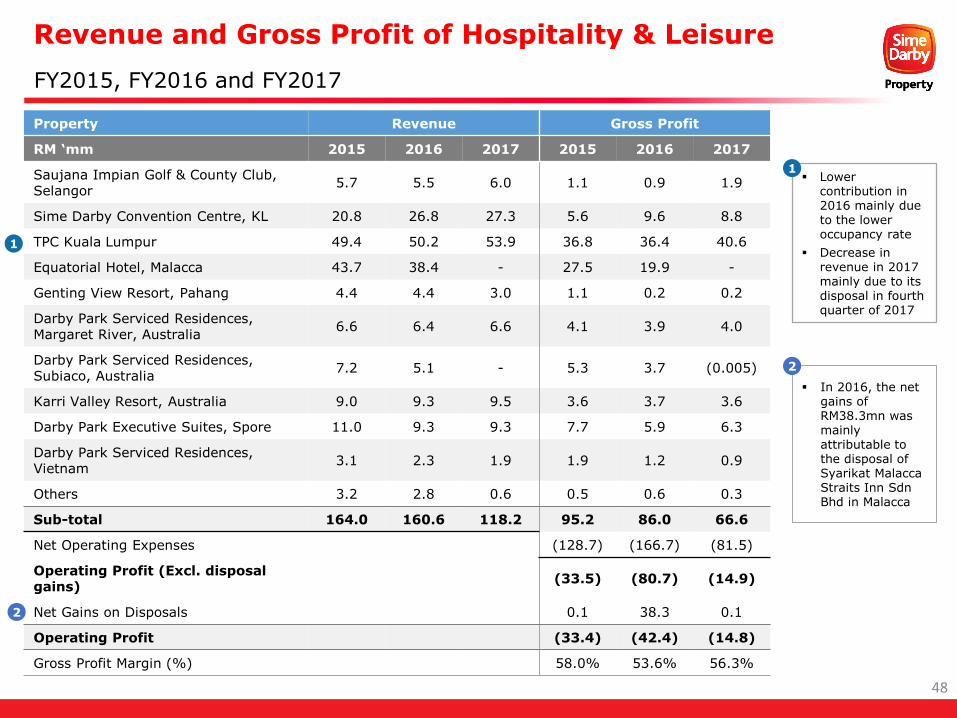
Revenue and Gross Profit of Hospitality & Leisure
FY2015, FY2016 and FY2017
Property Revenue Gross Profit
RM ‘mm 2015 2016 2017 2015 2016 2017
Saujana Impian Golf & County Club, Selangor
5.7 5.5 6.0 1.1 0.9 1.9
Sime Darby Convention Centre, KL 20.8 26.8 27.3 5.6 9.6 8.8
TPC Kuala Lumpur 49.4 50.2 53.9 36.8 36.4 40.6
Equatorial Hotel, Malacca 43.7 38.4 - 27.5 19.9 -
Genting View Resort, Pahang 4.4 4.4 3.0 1.1 0.2 0.2
Darby Park Serviced Residences, Margaret River, Australia
6.6 6.4 6.6 4.1 3.9 4.0
Darby Park Serviced Residences, Subiaco, Australia
7.2 5.1 - 5.3 3.7 (0.005)
Karri Valley Resort, Australia 9.0 9.3 9.5 3.6 3.7 3.6
Darby Park Executive Suites, Spore 11.0 9.3 9.3 7.7 5.9 6.3
Darby Park Serviced Residences, Vietnam
3.1 2.3 1.9 1.9 1.2 0.9
Others 3.2 2.8 0.6 0.5 0.6 0.3
Sub-total 164.0 160.6 118.2 95.2 86.0 66.6
Net Operating Expenses (128.7) (166.7) (81.5)
Operating Profit (Excl. disposal gains)
(33.5) (80.7) (14.9)
Net Gains on Disposals 0.1 38.3 0.1
Operating Profit (33.4) (42.4) (14.8)
Gross Profit Margin (%) 58.0% 53.6% 56.3%
Lower contribution in 2016 mainly due to the lower occupancy rate
Decrease in revenue in 2017 mainly due to its disposal in fourth quarter of 2017
1
1
48
In 2016, the net gains of RM38.3mn was mainly attributable to the disposal of Syarikat Malacca Straits Inn Sdn Bhd in Malacca
2
2
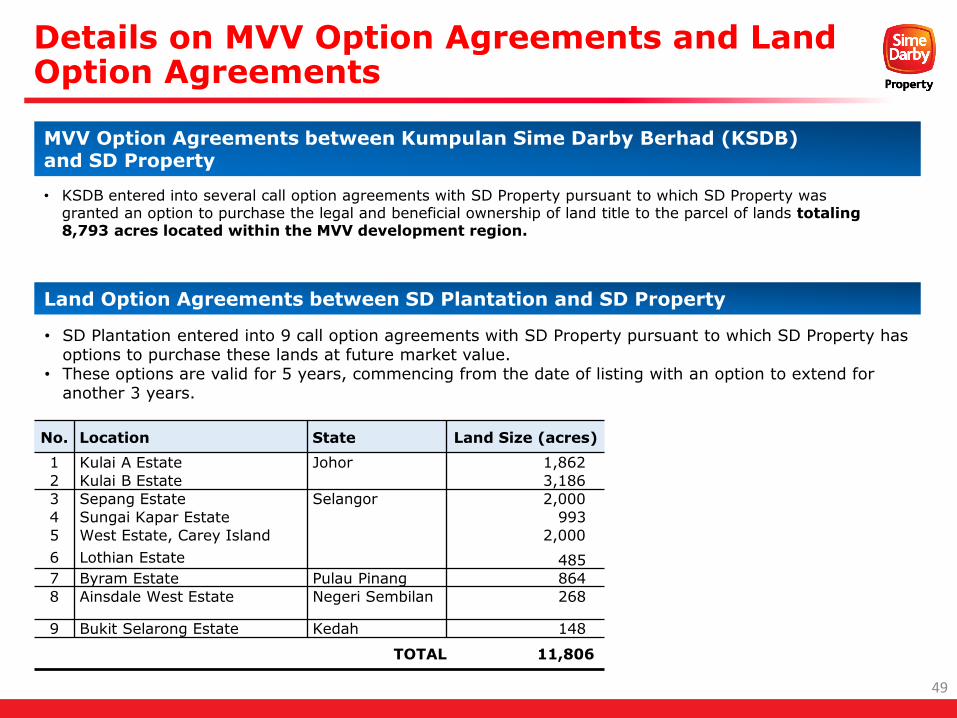
Details on MVV Option Agreements and Land Option Agreements
49
• KSDB entered into several call option agreements with SD Property pursuant to which SD Property was granted an option to purchase the legal and beneficial ownership of land title to the parcel of lands totaling 8,793 acres located within the MVV development region.
• SD Plantation entered into 9 call option agreements with SD Property pursuant to which SD Property has options to purchase these lands at future market value.
• These options are valid for 5 years, commencing from the date of listing with an option to extend for another 3 years.
No. Location State Land Size (acres)
1 Kulai A Estate Johor 1,862
2 Kulai B Estate 3,186
3 Sepang Estate Selangor 2,000
4 Sungai Kapar Estate 993
5 West Estate, Carey Island 2,000
6 Lothian Estate 485
7 Byram Estate Pulau Pinang 864
8 Ainsdale West Estate Negeri Sembilan 268
9 Bukit Selarong Estate Kedah 148
TOTAL 11,806
MVV Option Agreements between Kumpulan Sime Darby Berhad (KSDB) and SD Property
Land Option Agreements between SD Plantation and SD Property