SIME DARBY PLANTATION of Downstream Operations UNITED KINGDOM New Britain Oils Ltd. (300,000...
49
SIME DARBY PLANTATION CIMB 10 th Annual Malaysia Corporate Day 4 January 2018
-
Upload
truongthuy -
Category
Documents
-
view
235 -
download
1
Transcript of SIME DARBY PLANTATION of Downstream Operations UNITED KINGDOM New Britain Oils Ltd. (300,000...

SIME DARBY PLANTATIONCIMB 10th Annual Malaysia Corporate Day4 January 2018

Disclaimer
2
This document is strictly confidential to the recipient. It is being supplied to you solely for your information and may not be reproduced, redistributed orpassed on, directly or indirectly, to any other person or published, in whole or in part, for any purpose. Upon request, you shall promptly return thisdocument all other information made available in connection with this document, without retaining any copies. The distribution of this document inother jurisdictions may be restricted by law, and persons into whose possession this document comes should inform themselves about, and observe,any such restrictions.
This document does not constitute and is not an offer or invitation to sell, or any solicitation of any offer to subscribe for or purchase any securities ofany company referred to in this document in any jurisdiction. The companies referred to herein have not registered and do not intend to register anysecurities under the US Securities Act of 1933, as amended (the “Securities Act”), and any securities may not be offered or sold in the United Statesabsent registration under the Securities Act or an exemption from registration under the Securities Act. By attending the presentation you will bedeemed to represent, warrant and agree that to the extent that you purchase any securities in any of the companies referred to in the presentation,you either (i) are a “qualified institutional buyer” within the meaning of Rule 144A under the Securities Act, or (ii) you will do so in an “offshoretransaction” within the meaning of Regulation S under the Securities Act
By attending this presentation and accepting a copy of this document, you represent and warrant that (i) you have read and agreed to comply with thecontents of this notice; (ii) you will maintain absolute confidentiality regarding the information contained in this document including informationpresented orally or otherwise in accordance with your confidentiality obligation; and (iii) you are lawfully able to receive this document and attend thispresentation under the laws of other jurisdiction in which you are subjected and other applicable laws.
This document is for the purposes of information only and is not intended to form the basis of any investment decision. This presentation may containforward-looking statements by Sime Darby Plantation that reflect management’s current expectations, beliefs, intentions or strategies regarding thefuture and assumptions in light of currently available information. These statements are based on various assumptions and made subject to a numberof risks, uncertainties and contingencies and accordingly, actual results, performance or achievements may differ materially and significantly from thosediscussed in the forward-looking statements. Such statements are not and should not be construed as a representation, warranty or undertaking as tothe future performance or achievements of Sime Darby Plantation and Sime Darby Plantation assumes no obligation or responsibility to update anysuch statements.
No representation or warranty, express or implied, is given by or on behalf of Sime Darby Plantation or its related corporations (including withoutlimitation, their respective shareholders, directors, officers, employees, agents, partners, associates and advisers) (collectively, the “Parties”) as to thequality, accuracy, reliability, fairness or completeness of the information contained in this presentation or its contents or any oral or writtencommunication in connection with the contents contained in this presentation (collectively, the “Information”), or that reasonable care has been takenin compiling or preparing the Information. None of the Parties shall be liable or responsible for any budget, forecast or forward-looking statements orother projections of any nature or any opinion which may have been expressed or otherwise contained or referred to in the Information.
The Information is and shall remain the exclusive property of Sime Darby Plantation and nothing herein shall give, or shall be construed as giving, toany recipient(s) or party any right, title, ownership, interest, license or any other right whatsoever in or to the Information herein. The recipient(s)acknowledges and agrees that this presentation and the Information are confidential and shall be held in complete confidence by the recipient(s).
All the images, pictures and photos including design drawings in relation to the company’s property development projects contained in this documentare artist impression only and are subject to variation, modifications and substitution as may be recommended by the company’s consultants and/orrelevant authorities.

3
Section Page
1 Company Overview 4
2 Key Investment Highlights 9
3 Business Strategies & Future Plans 21
4 Industry Outlook 31
5 Financial Overview 34
6 Appendix 39
Table of Contents

4
Company Overview

Business Overview
Integrated Plantation Company Involved in the Entire Palm Oil Value Chain
5
Upstream Downstream Others
Oil palm, rubber & sugarcane estates
Developing, cultivating and managing oil palm, rubber and sugarcane plantation estates
Milling of FFB and processing & sales
Milling of FFB into CPO and PK
Processing and sales of rubber and sugarcane
Others
Cattle rearing and beef production
Bulk and refined oils & fats
Production and sales of refined oils and fats (which includes specialty and end-user oils and fats)
Oleochemicals, biodiesel products & derivatives
Production and sales of oleochemicals, biodiesel products and derivatives
R&D
Focused on yield and productivity improvements, increasing revenue streams and developing sustainable practices while pursuing innovative strategies
Renewables business
Development of green technology and renewable energy which includes bio-based chemicals, biogas and composting
Agribusiness
Provision of agriculture products and services
Oil palm estate Mill Refinery Food application High-yielding genome seeds
Renewables

Snapshot of Oil Palm Plantation Operational Statistics
FY16/17 unless otherwise stated
Malaysia IndonesiaPNG &
Solomon IslandsLiberia Total
Total oil palmplanted area(1) (ha)
303,367 202,191 86,493 10,401 602,452
Mature area(1) (ha) 251,629 161,621 76,281 9,356 498,887
Palm tree age profile & average tree age (1)
(Years)
FFB production (mn MT/year)
5.29 2.67 1.79 0.03 9.78
Mill production (mn MT/year)
CPO 1.20 0.72 0.55 0.01 2.48
PK 0.29 0.16 0.14 0.00 0.58
FFB yield (MT/ha) 20.76 16.03 23.88 4.04 19.44
OER 20.56% 21.30% 23.10% 18.73% 21.29%
KER 4.95% 4.67% 5.73% 2.48% 5.02%
Note:(1) As at 30 Sep 2017
<3 yrs 4-8 yrs 9-18 yrs
19-22 yrs >22 yrs
4.7 yrs 12.9 yrs14.3 yrs12.6 yrs 11.9 yrs
6

Snapshot of Downstream Operations
UNITED KINGDOMNew Britain Oils Ltd. (300,000 MT/year)
NETHERLANDSSime Darby Unimills B.V.(450,000 MT/year)
SOUTH AFRICASime Darby Hudson & Knight (162,500 MT/year)
VIETNAMGolden Hope Nha Be (99,000 MT/year)
THAILANDMorakot Industries (379,500 MT/year)Industrial Enterprises (IE) Soya (33,000 MT/year)
MALAYSIASime Darby Jomalina(429,000 MT/year)
Nuri Refinery (660,000 MT/year)
Sime Darby Kempas(165,000 MT/year)
Sime Darby Austral (330,000 MT/year)
INDONESIAPT Golden Hope Nusantara (825,000 MT/year)
PAPUA NEW GUINEAKumbango(140,000 MT/year)
12Refineries
~4.0 million MTRefining Capacity
Note: Figures as at 30 Sep 2017
Legend
Differentiated FoodKEY
PRODUCTS
• Food: Palm oil products, specialty oils & fats, phytonutrients, refined PKO, vegetable ghee, shortening & dough fat, industrial margarine, cooking oil, CPKO & PK cake for animal feed, and non-dairy products
• Non-Food: Oleochemicals (high quality fatty acids, glycerine, fatty alcohols, triacetin, methyl esters, oilfield chemicals, ozone acids) and biodiesel
Bulk Processing
71%Average Refinery
Utilisation
7

Downstream – Our renowned brands and winning products are used worldwide
Jomalina Nuri Kempas Austral Nusantara Morakot Nha Be Unimills Liverpool H&K Kumbango
Bulk BulkBulk Bulk
8
IE
Bulk
B2
BB
2C
Vema(no logo)
T O P 3 B R A N D S ( I N T E R M S O F R E V E N U E )
* SDFBM & SDEPL is the sales and marketing arm of SDP which sells B2C products manufactured by Malaysian SDP refineries & third parties
SD Food & Beverage Malaysia (SDFBM)* & SD Edible Products Ltd (SDEPL)*
Morakot Nha Be

9
Key Investment Highlights

Investment Highlights
Strong Investment Proposition
Well Positioned to Benefit from Sound Industry Fundamentals & Strong Demand Growth Trends
The World’s Largest Oil Palm Plantation Company by Oil Palm Planted Area, with Established Reputation as the World’s Largest Producer of Certified Sustainable Palm Oil
Fully Integrated Business Model with Diversified Operations Along the Palm Oil Value Chain
Innovative & Market Leading R&D Supports Operational Efficiency & Productivity
Experienced and Sound Board & Management Team
1
2
3
5
4
6
10

19 MT/ha
25 MT/ha
FY17 FY25 Target
Sime Darby Plantation’s Strong Investment Proposition
1
FFB PRODUCTION
GROWTH POTENTIAL
STRENGTHENING DOWNSTREAM
CONTRIBUTIONS & MARGINS
LOWER COST
IMPROVED GEARING & CASH FLOW
HIGHER DIVIDEND
POLICY
of Net Profit
11
F F B Y I E L D
61%55%
As at 30 Jun2017
As at 30 Sep2017
G E A R I N G

World’s Largest Oil Palm Plantation Company with More Than 600,000 Hectares of Planted Area
We are the world’s largest oil palm plantation company by oil palm planted area with c.2.8% market share(1)
and total landbank of more than 983,000 hectares across Malaysia, Indonesia, PNG & Liberia
Notes:(1) Estimated based on global planted area of 21.5 mm ha worldwide(2) Based on 2016 global CPO production of 58.9 mm MT(3) Based on latest financial year end(4) As at 30 Jun 2017Source: Frost & Sullivan, company
20%Leader in Sustainability - World’s Largest Producer of CSPO
of Global CSPO Production Capacity(1)
~600,000 hectaresWorld’s Largest Oil Palm Plantation Company (by planted area)
4 mn MT p.a.Total Refining Capacity (12 Refineries)
2.5 mn MT FY17 CPO Production (~4% of Global Market Share)(2)
Market Leading R&DEdison Award 2017 under the Energy and Sustainability category (Genome Select Oil Palm Project)
251Estates
72 Mills
11 Crushing Plants (inclusive of soy crushing plant)
World’s Largest Oil Palm Plantation Company by Planted Area with c.2.8% Market Share
502
466
258
266
204
208
159
176
148
100
137
116
116
92
83
603
488
341
297
247
242
209
205
179
141
139
136
127
102
95
SD Plantation
Golden Agri
FGVH
Astra Agro
Salim
Wilmar
First Resources
KLK
IOI
GENP
Sinar Mas
Sampoerna
Persero
Nusantara
LSIP
2.8%
2.3%
1.6%
1.4%
1.2%
1.1%
1.0%
1.0%
0.8%
0.7%
0.6%
0.6%
0.6%
0.5%
0.4%
Planted & Mature Area (Ha)(3)
% global market share(1)
(4)
2
12

1985 • Introduced
Zero-Burning replanting technique
1996• EMS-ISO
14001 certification for environmental management systems
1992• United Nations
Environment Programme’sGlobal 500 Award for Zero-Burningreplanting technique
2002• Founding
member of RSPO
2004 • First
GLOBALG.A.P. certification which recognisesefforts for good agricultural practices
2015• Acquisition of New
Britain Palm Oil Limited, a 100% RSPO certified & traceable palm oil producer in terms of processing identity preserved or fully segregated oil
2016• Launched the
Responsible Agriculture Charter (RAC)
2014• Signed the
Sustainable Palm Oil Manifesto
• HCS+ methodology for oil palm
SDP Sustainability
Brand
Future: “RSPO and Beyond” vision • To prevent value
erosion in our businesses from unethical behavior
• To maintain established sustainability credentials and policies
• Global Sustainability Leadership Award from the World Sustainability Congress
2017• Edison Awards
(Bronze) under Energy & Sustainability category
2 Our Journey to Sustainability
13

Sustainability – Committed to Good Agriculture Practices
As at 30 Sep 2017
As a signatory to the Sustainable Palm Oil Manifesto, we are committed to implement leading industry practices around High Conservation Value and HCS in new developments
RSPO Certification Status
High Carbon Stock (HCS) Commitment
Responsible Agriculture Charter (RAC)
Launched in Sep’16 with SD Plantation’s focused commitments on:
• Human rights & social development
• The environment• Corporate integrity
Sime Darby Open Palm Traceability Dashboard
provides SD Plantation’s customers with access to source the products
purchased from SD Plantation
Open Palm Traceability
Upstream – Mill
Traceable up to plantations
Downstream – Refinery, KCPs & Biodiesel
Traceable up to plantations Traceable up to mills
As at 30 Sep 2017
88.4% Traceable
FFB
96.7% Traceable
CPO Palm Kernel
100% Traceable
80.5% Traceable
CPO Palm Kernel
81.7% Traceable
97%RSPO-certified
100%MALAYSIA
Sime Darby launched it’s Human Rights Charter to articulate its commitment in respecting human rights in line with the United Nations Guiding Principles on Business and Human Rights
Human Rights Charter
96%INDONESIA
100%PNG & SI
As at 30 Sep 2017
2
14

Sustainability – Driving Market Demand 2
11.8 mn MT
Global CSPO Production Capacity(as of 31 Jul 2017)
All of SD Plantation’s refineries are RSPO-certified
New Britain Oils’ refinery in Liverpool is a fully Certified Segregated Refinery
We have modified and expanded our milling and refinery capacity to increase production of Premium Quality (PQ) oil
PQ oil offers low free fatty acid oil blends
NURI REFINERY (MALAYSIA)
NEW BRITAIN OILS (UK)
Source: Company, Frost & Sullivan
CSPO PRODUCTION CAPACITY
15

Well Positioned to Benefit from Sound Industry Fundamentals & Strong Demand Growth Trends
3
Geographical Breakdown
for FY17 Total
Revenue
Market Reach
Extends to the Top 5
Global Palm Oil
Consumer(1)
Upstream Operations
Presence in 5 Countries - Malaysia, Indonesia, PNG & Solomon Islands, Liberia
Developing, cultivating and managing oil palm, rubber & sugarcane plantation estates
Operates and manages 249 plantation estates and 72 palm oil mills
Cattle rearing & beef production
Downstream Operations
Operating across 16 Countries - Malaysia, Indonesia, Netherlands, Thailand, United Kingdom, PNG, Vietnam & others
Production & sales of bulk & refined oils and fats, oleochemicals, biodiesel products and derivatives
Manages and operates 12 refineries with a total refinery capacity of 4 mm MT/year
FY17 Total Revenue = RM14,779 mm
c. RM10.8 bn or 73% of FY17 revenue is derived from the Top 5 Global Palm Oil Consuming Countries/Region
(from Malaysia, Europe, India, Indonesia & China)
Our wide & diverse geographical reach of business operations will allow us to leverage on strong industry fundamentals
Strong Geographical Presence
Note:(1) The top 5 palm oil consuming countries/regions based on global palm oil consumption in 2016 are India, Indonesia, EU, China and Malaysia, which collectively accounted for c.53% of total
consumption in 2016
Source: Frost & Sullivan, company
Malaysia,
23%
Europe,
22%India,
19%Indonesia,
7%
China, 2%
South Africa,
5%
Other SEA, 13%
Others, 9%
16

Well Positioned to Benefit from Sound Industry Fundamentals & Strong Demand Growth Trends (cont’d)
3
Our wide & diverse geographical reach of business operations will allow us to leverage on strong industry fundamentals
62.5 63.966.9
70.273.8
77.781.7
795
750761
771782
793804
2016 2017F 2018F 2019F 2020F 2021F 2022F
Palm oil consumption (mm MT)
CPO Price, CIF Rotterdam (constant USD)
Note:(1) Price rationalization expected in 2017 due to recovery of FFB yield and
CPO production in Indonesia & Malaysia post El Nino drought.Source: Frost & Sullivan, World Bank
Demand for Palm Oil Estimated to Reach 81.7 mnMT by 2022, Providing Support to CPO Prices
Capitalising on strong demand growth for palm oil
Global Edible Vegetable Oil Consumption (mn MT)
Increasing Demand for Palm Oil & Edible Oils Driven by Growing Population & Food Requirements
2012-2016 CAGRPalm oil: +4.4%PKO: +3.7%
17
1.282.49
3.484.51
5.356.18 5.63
2010 2011 2012 2013 2014 2015 2016
Global Sales of Certified Sustainable Palm Oil (mn MT)
Strong CSPO Sales Growth Globally is a Direct Consequence of the Sustainability Commitments of Various FMCG companies

Economies of scale & cost synergies Diversification of commodity price volatility
Shared use of integrated processing facilities & infrastructure
Extensive sales and distribution network
Flexibility to channel products & resources to markets with greater demand
Ability to convert by-products (palm fibres, sludge oil, palm oil mill effluent,empty fruit bunches, palm kernel expeller) into applications such as animalnutrition and tocotrienols
Strengthen our ability to trade around our own assets
Allows diversification of upstream operations which aresusceptible to volatile commodity prices
More stable and resilient earnings as volatilities in segmentmargins are mitigated
Ability to better manage commodity price volatility
Flexibility to channel CPO to various segments of downstreamprocess by capitalizing on the different price characteristicsand feedstock types in the downstream segment
With a fully integrated business model, we are able to diversify our earnings risk from volatility of commodity price and leverage on operational synergies
1 2
Key Benefits of a Fully Integrated Business Model
Fully Integrated Business Model with Diversified Operations Along the Palm Oil Value Chain
4
Upstream Downstream
Seed Production
Oil Palm Nursery
Estate Management
Mills –CPO & PK
Production
Bulk Refineries/ Facilities
Specialty Food Refineries
Non-Food
Bulk Sales
Rubber/Sugar Cane/Cattle
Products
Smallholders Aggregation
Trading & Aggregation
of CPO
Oleo-chemicals
Biodiesel
Compost Gasification/Biogas Animal Feed Tocotrienol Biodiesel
Palm Oil Products
• Cooking Oil
• Specialty Oils & Fats
• Refined PKO
• Spreads
• Shortenings
• Infant Formula
• Dairy Fat Replacers
WASTE TO WEALTH
By-Product
Frond Palm Fibres, Sludge Oil,
POME, EFB, PKE
PFAD
18

Market Leading Research & Development
• Global network of 5 R&D centres in Malaysia, Indonesia & PNG, and3 innovation centres in Malaysia, the Netherlands and South Africa
• Supports operational efficiency and improvements to upstreamproductivity, and we develop sustainable practices while pursuingtransformational innovative strategies
• Development of new palm oil breed via a genomic selection andprediction process
• Malaysia’s first company to win the coveted Edison Award,which recognised its groundbreaking genome initiative
• Research and production of high yield planting material such asnew Dami seeds progenies which are expected to deliver better oilyield improvements than its predecessors
Adopt best agro-management practices
• Precision agriculture to improve yield
• Efficient water management and irrigation system
• Integrated pest management programmes
• Mechanisation initiatives to improve manpower ratio, cost efficiencyand productivity
• Digitisation initiatives
Market Leading R&D Supports Operational Efficiency & Productivity
5
19

RenakaRamachandran
Chief Financial Officer
Datuk FrankiAnthony Dass
Chief Advisor and Value Officer
Tan Sri Dato’ Abdul Ghani
Othman
Chairman and Non-Independent Non-Executive Director
Tan Sri Dato’ Seri Mohd Bakke
Salleh
Executive Deputy Chairman and
Managing Director
Tan Sri Dato’ Seri Mohd Bakke
Salleh
Executive Deputy Chairman and
Managing Director
Mohamad HelmyOthman Basha
Chief Operating Officer, Upstream
Dr. Simon Lord
Chief Sustainability Officer
Mohd Haris Mohd Arshad
Chief Operating Officer,
Downstream
Dr. HarikrishnaKulaveera-
singam
Head of R&D
Our Board and management team have the ability to drive our Group through transformation into the next phase of growth which is to innovate, execute and create value
Datuk ZaitonMohd Hassan
Senior Independent Non-Executive
Director
Dato’ Che Abdullah @ Rashidi Che
Omar
Independent Non-Executive Director
Dato’ Mohamad Nasir Ab. Latif
Non-Independent Non-Executive
Director
Dato’ Mohd Nizam Zainordin
Non-Independent Non-Executive
Director
Tan Sri Datuk Dr.Yusof Basiran
Independent Non-Executive Director
Zainal Abidin Jamal
Non-Independent Non-Executive
Director
Muhammad Lutfi
Independent Non-Executive Director
Tan Ting Min
Independent Non-Executive Director
Board of Directors
Management Team
Board members have held
prominent positions and directorships in areas such as
plantation, banking and finance sectors
and in governmental, regulatory and
professional bodies
Experienced management team with an average of
about 15 years of experience
in the plantation industry
Experienced and Sound Board & Management Team6
20

21
Business Strategies & Future Plans

The Strategy Moving Forward – What is Different?
‘The Leading Global Integrated Palm Oil Player’The global brand for plantation sustainability
VIS
IO
NG
RO
WTH
S
TR
ATEG
YTA
RG
ETS
B
Y 2
02
5
U P S T R E A M
DRIVING OPERATIONAL EXCELLENCE VIA DIGITISATION
D O W N S T R E A M I N T E G R A T I O N1 2 3
Towards Mission 25:25
Achieving FFB yields of 25 MT/Ha & OER of 25% by 2025
Higher Downstream PBIT contribution
20% of PBIT within the next 5 years
Integrated economics across the value chain
SERVING THE CUSTOMERS OF THE FUTURE
MAXIMISING RETURNS ACROSS THE PALM OIL VALUE CHAIN
Relentless Focus on Execution to Drive Value Creation22

Medium to Long Term Targets
19FFB Yield(MT/ha)
21.3%OER
5.2%DownstreamContribution1
FY2017 25FFB Yield(MT/ha)
25%OER
LowerCost to customer
HigherDownstreamContribution1
FY2025CURRENT
LONG-TERM
1 % of Contribution to Plantation PBIT , Source: Company Presentation 23

Upstream – Driving Operational Excellence
21.9 21.5 21.8 21.8 21.9 21.7 21.921.3
22.1 22.5 22.8 23.2 23.2
25.0
2010 2011 2012 2013 2014 2015 2016 2017 2018 2019 2020 2021 2022 2025
FFB Yield(MT/ha)
Oil Extraction
Rate(%)
FY
ACCELERATED REPLANTING
•Group : 5%(Indonesia : 7% staggered)
A SUPERIOR PLANTING MATERIAL
•High yielding planting material (e.g.
Genome, Dami)
B WATER MANAGEMENT
•Effective water management & conservation practices
C MECHANISATION
•Enhancing automation & digitisation•Advanced milling & latest extraction technologies
D
ELEVATING YIELD PERFORMANCE THROUGH ON-GOING PROCESS ENHANCEMENTS
25 MT/ha
25%
24

Upstream – Replanting with High Yielding Materials
Replanting Rate 5-7%
Genome Select can deliver higher oil yield as compared to our current commercial offering, Calix 600
NEW PLANTING MATERIALS
Note: (1) As at 30 Sep 2017
High Yielding Materials
Average Age
10 yearsBy 2025
ACCELERATED REPLANTINGA SUPERIOR PLANTING MATERIALB
2010 2011 2012 2013 2014 2015 2016 2017 2018 2019 2020 2021 2022
Net Impact of Replanting
on PBIT(RM mn)
Financial Year
Oil Palm Replanting (‘000 ha)
Total Area Coming
into Maturity1
(‘000 ha)
291,900 haBY FY2022
201,600 haBY FY2022
POSITIVERETURNSFY2017 ONWARDS
10.8 8.8 12.3 15.520.9 20.6 22.9
30.0 28.4 31.4 31.2 30.3 28.8
• GENOME SELECT
• SUPER FAMILY DAMI
25

MALAYSIA INDONESIA LIBERIAPAPUA NEW GUINEA
& SI
• Installing mobile pumping equipment at our plantations• Building permanent water pumps with engines at rivers and water
bodies at some of our plantations• Irrigation system for drier, inland soils and water management for
coastal areas and areas with high water table
Innovative and cost effective irrigation techniques to ensure that our estates and mills maintain adequate and consistent water
supply during prolonged dry months
Upstream – Innovative Watering Initiatives
WATER MANAGEMENTC
26
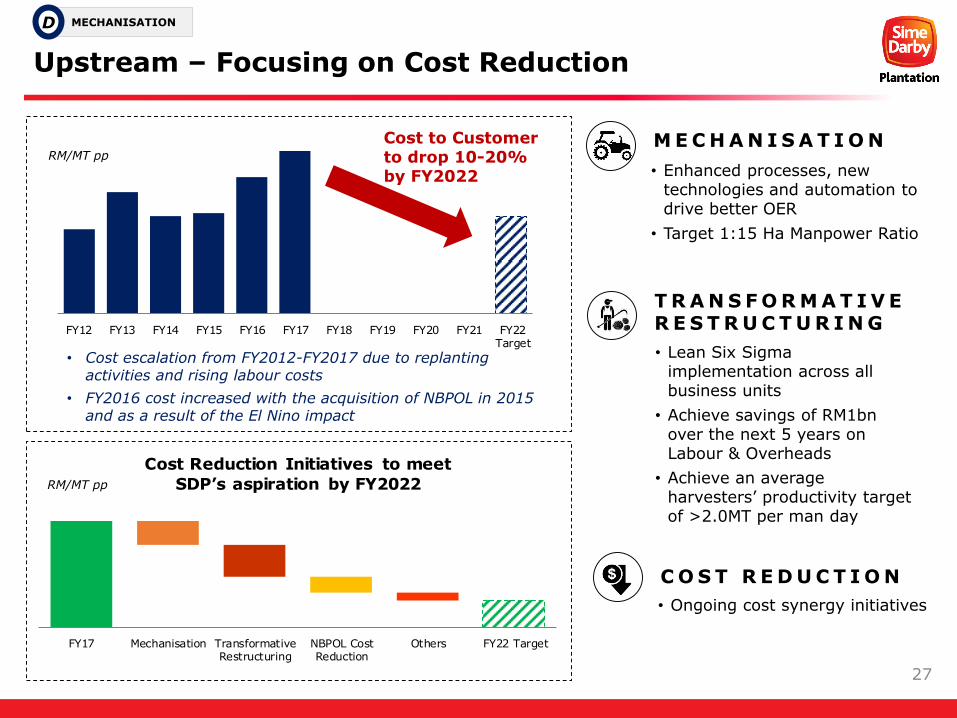
Upstream – Focusing on Cost Reduction
MECHANISATIOND
FY12 FY13 FY14 FY15 FY16 FY17 FY18 FY19 FY20 FY21 FY22Target
Cost to Customer to drop 10-20% by FY2022
• Cost escalation from FY2012-FY2017 due to replanting activities and rising labour costs
• FY2016 cost increased with the acquisition of NBPOL in 2015 and as a result of the El Nino impact
RM/MT pp
FY17 Mechanisation TransformativeRestructuring
NBPOL CostReduction
Others FY22 Target
Cost Reduction Initiatives to meet
SDP’s aspiration by FY2022RM/MT pp
M E C H A N I S A T I O N
T R A N S F O R M A T I V E R E S T R U C T U R I N G
• Enhanced processes, new technologies and automation to drive better OER
• Target 1:15 Ha Manpower Ratio
• Lean Six Sigma implementation across all business units
• Achieve savings of RM1bn over the next 5 years on Labour & Overheads
• Achieve an average harvesters’ productivity target of >2.0MT per man day
C O S T R E D U C T I O N
• Ongoing cost synergy initiatives
27
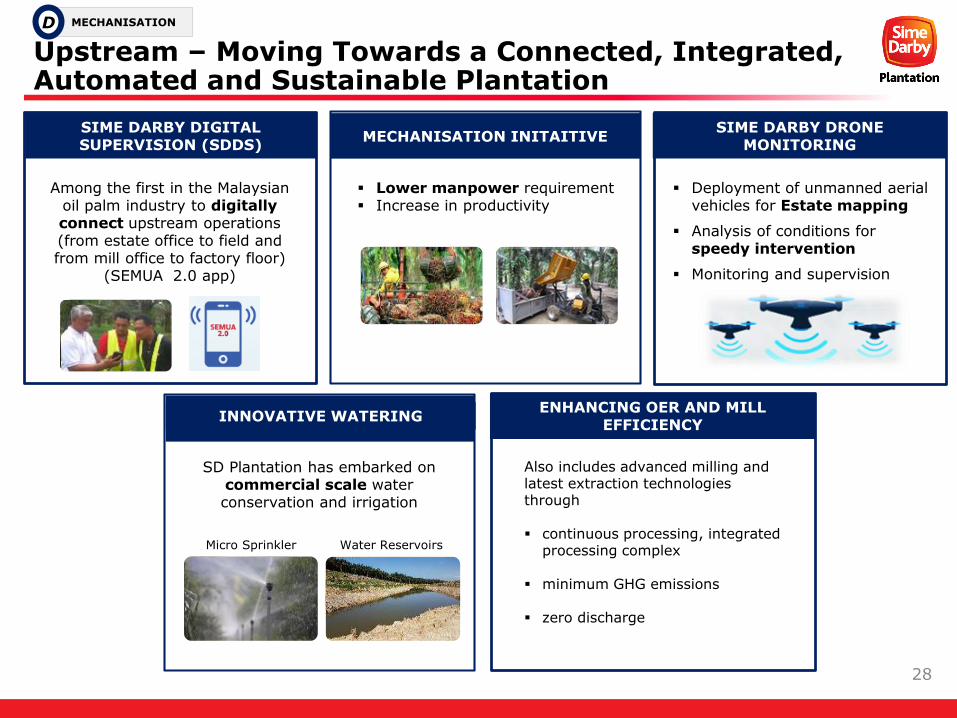
ENHANCING OER AND MILL EFFICIENCY
INNOVATIVE WATERING
SIME DARBY DIGITAL SUPERVISION (SDDS)
Among the first in the Malaysian oil palm industry to digitally connect upstream operations (from estate office to field and from mill office to factory floor)
(SEMUA 2.0 app)
Deployment of unmanned aerial vehicles for Estate mapping
Analysis of conditions for speedy intervention
Monitoring and supervision
Also includes advanced milling and latest extraction technologies through
continuous processing, integrated processing complex
minimum GHG emissions
zero discharge
Lower manpower requirement Increase in productivity
SD Plantation has embarked on commercial scale water conservation and irrigation
Micro Sprinkler Water Reservoirs
SIME DARBY DRONE MONITORING
MECHANISATION INITAITIVE
Upstream – Moving Towards a Connected, Integrated, Automated and Sustainable Plantation
MECHANISATIOND
28

Downstream – To become the preferred sustainable palm oil&fats specialist and customer solutions provider
• Create value by marketing and strengthening the “Sime Darby” brandThrough achieving sustainability, quality and food safety requirements
• Explore & expand opportunities to increase our presence in key geographical markets Such as India, Southeast Asia, the United States, Europe, Africa, the Middle East and China
• Focus on differentiated, sustainable and traceable high value products
HOW DO WE DELIVER VALUE ?
29

Downstream – Shifting Into High Margin Specialty Products & Deriving Full Value from CSPO
Emphasis on Physical CSPO
Sales
PQ Oil as the Gateway to
Niche and High Value Food Segments
Differentiated : Commodity
Supply Chain Optimisation to
Maximise Value of CSPO
Physical Sales vs. Green Certificate
Drive production of differentiated products
Drive physical sales vs Green certificates
Commodity vs. Differentiated
Functional RM1,800/MT
Infant formula RM700/MT
Frying RM300/MT
Dairy fat replacer RM200/MT
1) Industry Average Contribution Margin:
2) SD Nutrition Leveraging on Waste to Wealth
2) Working Towards Fully Segregated & Traceable Refineries
Nuri Refinery SD UnimillsNew Britain Oils
1) Aggregation & Growth Partnership Model(collaboration with smallholders)
A B
C D
30

31
Industry Outlook

Demand Drivers of the Global Oil Palm Plantation and Edible Oils Industry
Competitive Pricing of Palm
Oil and Price Affordability of Edible Palm Oil
Increased consumer
awareness on food
sustainability
Wide Range of Uses for Palm Oil, Palm Kernel Oil
and their Related Products
Growing Demand for Food due to Increase in Population
Increased in Biodiesel Demand
CSPO sales grew at a CAGR of
28.0% between 2010 and 2016, driven by a direct consequence of the sustainability commitments of FMCG companies
By 2020, CSPO sales is estimated to reach
c. 11.0 mm MT
To increase by
60%By 2050 to meet
increase in energy intake demand(from 2005 – 2007)
Average daily energy supply expected to increase by 11% during the same period
Type of OilPrice
(USD/MT) in 2016
Palm Oil 718 – 751
Soybean Oil 736 – 851
Coconut Oil 1,621
Palm Kernel Oil 1,436
Corn Oil 886 – 999
Rapeseed Oil 883
Groundnut Oil 1,544
The physical and chemical
characteristics of oil palm products and
their derivatives allow them to be applied in
a wide variety of
both food and non-food end-user
industries
Lower oil reserves and increased in
oil extraction cost has driven the global demand for palm oil for the production of
biodiesel
By 2052, it is estimated that oil reserves may no longer be able to support the global
economy
32

Outlook of the Global Palm Oil and Edible Oils Market
Global CPO production, palm oil consumption, demand for CSPO and CPO prices expected to increase
Increased in CPO production largely backed by technological advancements, including:
Usage of high yield oilseeds
Usage of mechanisation in the harvesting process
Factors driving demand for palm oil:
Increase in global population & food requirements
Ongoing efforts in developing biodiesel programs by nations (e.g. the EU, the U.S., Brazil and Indonesia)
Global CPO Production and Consumption Forecast
Source: IMR Report prepared by Frost & Sullivan
Demand for Edible Oils Expected to Remain Strong Over the Next 5 Years
Global Consumption of Selected Edible Oils
(mn MT)(mn MT)
Factors driving demand for edible oils:
Growing population and increasing food consumption and usage of non-food applications of edible oils (e.g. soap and detergents)
Ban on trans-fats in the U.S. by June 2018 likely to drive demand for vegetable oil alternatives from hydrogenated oils
Wide range of uses of edible oils & fats
33

34
Financial Overview

Key Financial Metrics
Note: FY17’s PBIT and PATAMI excluded the gain from the divestment of land to Kumpulan Sime Darby Berhad
FY2015 – FY2017
35

1QFY2018 Financial Performance
Breakdown by Segment
220 305
1QFY2017 1QFY2018
Malaysia1
Rise in core1 Upstream PBIT by +66% YoY due to higher FFB production and CPO price realised
39%
220
Downstream PBIT declined by -5% due to lower profit generated by refineries in Malaysia & Europe, while the Others segment registered +175% PBIT improvement due to the
turnaround reported by Emery Group
172%217%
66%92%
305
Note: (1) Excluding one-offs of RM771mn(2) The Liberia operation registered higher losses mainly due to the increase in mature area which led to higher depreciation
-5% +175%

Snapshot of Capital and Debt
5244
38
7885
71
4639
34
As at 30 Jun 2015 As at 30 Jun 2016 As at 30 Jun 2017
Receivables Inventory Payables
0.5
1.3
1.1 1.2
As at 30 Jun2015
As at 30 Jun2016
As at 30 Jun2017
As at 30 Sep2017
Days RM’mn
(x) (x)
1,325.4
685.0
4,690.5
1,037.0
Within 1 year 1-2 years 2-5 years More than 5years
1.371.29
0.61 0.55
As at 30 Jun2015
As at 30 Jun2016
As at 30 Jun2017
As at 30 Sep2017
Note: (1) Based on Total Borrowings (including intercompany loans) divided by Total Equity
Working Capital Turnover Period Indebtedness by Maturity (as at 30 Jun 2017)
Current Ratio Gross Gearing Ratio(1)
37

Dividend Policy
The declaration of interim and final dividends is subject to the discretion of our Board. However, our ability to pay dividends or make other distributions to our shareholders will depend upon a number of factors, including:
the level of our cash, gearing, return on equity and retained earnings;
our expected financial performance;
our projected levels of capital expenditure and other investment plans;
our working capital requirements; and
our existing and future debt obligations.
No inference should be made from any of the foregoing statements as to our actual future profitability or our ability to pay dividends in the future.
We propose to pay dividends out of cash generated from our operations after setting aside necessary funding for capital expenditure and working capital requirements. As part of this
policy, our Company targets a dividend payout ratio of not less than 50.0% of our consolidated profit attributable to the owners of our Company under MFRS, beginning 1 July 2017
38

39
Appendix

Revenue and PBIT
Upstream
25%
Downstream
75%
Others
0.4%
FY17 Revenueby Segment
Increase was primarily due to the increase in sales of our refined
edible oils and fats (downstream operations), sugar and beef
(upstream operations), mainly as a result of the full year
consolidation of NBPOL Group’s financial result.
RM’mn
Increase was primarily due to the increase in the sales of our palm oil products (i.e. our upstream
operations) and our refined edible oils and fats (i.e. our downstream
operations).
Revenue
Malaysia
23%
Europe
22%India
19%
Other SEA
13%
Indonesia
7%
Other
countries7%
South
Africa5%
PNG
& SI2%
China
2%Liberia
0%
FY17 Revenueby Geography
FY17 PBIT by Segment
FY2017 Breakdown
40

Expenses, Operating Profit & PAT
Increase principally reflects the increase in the production of
refined edible oils and fats at our downstream operations where the
purchase of edible oil and consumables for such production was higher, coupled with higher plantation operating costs and depreciation and amortisationfrom our upstream operations.
RM’mn RM’mn
Increase is mainly due to increased expenses from our
upstream operations as well as an increase in edibles and
consumables expenses from our downstream operations
Increase due to the higher revenue and gain from the sale of the parcel of lands
to KSDB
The lower overall operating profit margin is a result of lower FFB
yield. However, this was partially offset by the improvement of the
operating profit margin in our downstream operations.
RM’mn
Operating Expenses Operating Profit & Operating Profit Margin
PAT & PAT Margin
FY2015 – FY2017
41

Financial Highlights
in RM’mn 1Q FY2018 1Q FY2017 YoY %
Revenue 3,541 2,819 +26%
Operating Profit 1,281 344 +272%
One-offs1: RM771mn
PBIT 1,284 329 +290%
PBT 1,239 227 +446%
PATAMI 1,019 151 +575%
Basic EPS (RM sen) 169.8 25.2 +574%
Proforma Basic EPS2
(RM sen)15.0 2.2 +582%
2 Pursuant to Share Split and Distribution, assume 6,800,839,377 number of shares
1 One-offs refer to the gain on sale of land to Sime Darby Property of RM676mn and reversal of accrual for donation of RM95mn
1QFY2018
42

Financial Performance by Segment
1Q FY2018
External Revenue
RM3,541mn (+26% YoY)1QFY17: RM2,819mn
PBIT RM1,284mn (+290% YoY)1QFY17: RM329mn
Upstream
RM1,208mn+359% YoY
(1QFY17:RM263mn)
• PBIT excluding one-offs:RM437mn, +66% YoY
Downstream & Others
RM76mn+15% YoY
(1QFY17: RM66mn)
• Downstream: Declined 5% from RM74mn to RM70mn due to lower profit generated by refineries in Malaysia & Europe
Lower sales volume and lower margin on the back of higher feedstock costs
o Partially mitigated by favourable performance of Indonesiaoperations due to higher sales volume and margin
• Others: Registered a profit of RM6mn from a loss of RM8mn in 1QFY17, due to the turnaround reported by Emery Group arising from initiatives implemented to improve its operations
FFB production
2.70mn MT, +25% YoY (1QFY17: 2.15mn MT)
Average CPO price realised
RM2,693/MT, +4% YoY (1QFY17: RM2,592/MT)
1QFY2018
43

Breakdown of External Revenue and PBIT by Segment
1QFY2018 vs 1QFY2017
In RM'mn 1QFY2018 1QFY2017 YoY %
Upstream Group 782 600 30%
Upstream Malaysia 322 172 87%
Upstream Indonesia 38 117 -68%
Upstream PNG 412 308 34%
Upstream Liberia 10 3 233%
Downstream 2,743 2,203 25%
Others 16 16 0%
TOTAL EXTERNAL REVENUE 3,541 2,819 26%
In RM'mn 1QFY2018 1QFY2017 YoY %
Upstream Group 1,208 263 359%
Upstream Malaysia 1,076 220 389%
Upstream Indonesia 117 43 172%
Upstream PNG 38 12 217%
Upstream Liberia -23 -12 -92%
Downstream 70 74 -5%
Others 6 -8 175%
TOTAL PBIT 1,284 329 290%
44

Summary of Operational Statistics
As at 30 September 2017
Malaysia
YoY %
Indonesia
YoY %
PNG
YoY %
Liberia
YoY %
Group
YoY %30
Sep’17
30 Sep’16
30 Sep’17
30 Sep’16
30 Sep’17
30 Sep’16
30 Sep’17
30 Sep’16
30 Sep’17
30 Sep’16
FFB Production (mn MT)
1.55 1.26 +23% 0.72 0.57 +26% 0.40 0.32 +27% 0.014 0.003 +322% 2.70 2.15 +25%
FFB Yield per mature ha (MT/Ha)
6.12 4.88 +25% 4.47 3.35 +33% 5.29 4.25 +24% 1.46 0.83 +77% 5.38 4.24 +27%
CPO Production (mn MT)
0.37 0.28 +30% 0.19 0.15 +27% 0.12 0.09 +31% 0.003 0.0007 +390% 0.69 0.53 +30%
PK Production (mn MT)
0.09 0.07 +39% 0.04 0.03 +35% 0.03 0.02 +34% 0.0005 - - 0.17 0.12 +37%
CPO Extraction Rate (%)
20.2 21.0 -4% 21.3 21.3 +0% 22.7 22.4 +1% 20.6 20.2 +2% 20.9 21.3 -2%
PK Extraction Rate(%)
5.1 4.9 +3% 4.8 4.5 +7% 5.9 5.7 +3% 2.9 - - 5.1 4.9 +4%
Average CPO Selling Price (RM/MT)
2,730 2,618 +4% 2,635 2,582 +2% 2,690 2,503 +8% 2,220 1,924 +15% 2,693 2,592 +4%
Average PK Selling Price (RM/MT)
2,162 2,555 -15% 1,901 1,940 -2% - - - - - - 2,111 2,442 -14%
45

Upstream Geographical Coverage
As at 30 September 2017
KalimantanPlanted : 129,229 haLandbank : 175,133 ha
SarawakPlanted : 38,894 haLandbank : 47,280 ha
SulawesiPlanted : 3,952 haLandbank : 4,712 ha
SabahPlanted : 46,375 haLandbank : 53,796 ha
Peninsular MalaysiaPlanted : 229,758 haLandbank : 242,883 ha
SumateraPlanted : 70,778 haLandbank : 99,846 ha
LiberiaPlanted : 10,508 haLandbank : 220,000 ha
Papua New Guinea(PNG) & Solomon Islands (SI)Planted : 101,062 haLandbank : 139,903 ha
As at 30 Sep’17 Malaysia Indonesia Liberia PNGSolomon Islands
Group
Land bank (ha) 343,959 279,691 220,000 131,588 8,315 983,553
Oil Palm Planted Area (ha) 303,367 202,191 10,401 79,729 6,764 602,452
Rubber Planted Area (ha) 11,660 1,768 107 - - 13,535
Sugarcane Planted Area (ha) - - - 5,613 - 5,613
Grazing Pastures Area (ha) - - - 8,956 - 8,956 46

Oil Palm Age Profile
As at 30 September 2017
17%
20%
37%
18%
8%
10%
90%
12%
24%
47%
12%
5%
20%
9%
25%
39%
7%
MALAYSIA INDONESIA
LIBERIA PNG
Immature 4 – 8 Years 9 – 18 Years 19 – 22 Years Above 22 Years
Sime Darby has 602,452 ha of oil palm planted area of which 83% is mature and
17% is immature
12.6 yrsAverage Palm
Tree Age
14.3 yrsAverage Palm
Tree Age
4.7 yrsAverage Palm
Tree Age
11.9 yrsAverage Palm
Tree Age
12.9 yrsAverage Palm
Tree Age
47

Credit Ratings
Baa1, Stable As at 26 May’17
BBB+, Stable As at 27 Nov’17
AAAIS , Stable PERPETUAL SUKUK
As at 23 Jun’17
RATING AGENCY RATING & OUTLOOK RATING DATE
48

THANK YOU
SIME DARBY PLANTATION INVESTOR RELATIONS
+(603) 7848 5339
http://www.simedarbyplantation.com/investor-relations