
SIMATIC AUTOMATION OF A COLD PRESS OIL FACTORY
35
JOSIP JURAJ STROSSMAYER UNIVERSITY OF OSIJEK FACULTY OF ELECTRICAL ENGINEERING, COMPUTER SCIENCE AND INFORMATION TECHNOLOGY Undergraduate study SIMATIC AUTOMATION OF A COLD PRESS OIL FACTORY Final paper Carles Miró Gisbert Osijek, 2017.
Transcript of SIMATIC AUTOMATION OF A COLD PRESS OIL FACTORY
JOSIP JURAJ STROSSMAYER UNIVERSITY OF OSIJEK
FACULTY OF ELECTRICAL ENGINEERING, COMPUTER SCIENCEAND INFORMATION TECHNOLOGY
Undergraduate study
SIMATIC AUTOMATION OF A COLD PRESS OIL
FACTORY
Final paper
Carles Miró Gisbert
Osijek, 2017.
CONTENT
1.INTRODUCTION........................................................................................................................1
1.1. Objectives..................................................................................................................1
1.2. Location.....................................................................................................................1
2.PROCESS.....................................................................................................................................5
2.1. Pressing......................................................................................................................6
2.2. Filtering......................................................................................................................6
2.3. Packaging...................................................................................................................8
3.SIMATIC......................................................................................................................................8
3.1. Device & Networks....................................................................................................8
3.2. PLC Programming......................................................................................................10
3.2.1. Tags...............................................................................................................10
3.2.2. Pressing..........................................................................................................11
3.2.3. Filtering..........................................................................................................14
3.2.4. Packaging........................................................................................................16
3.3. Visualization...............................................................................................................18
3.3.1. Users administration......................................................................................28
4.CONCLUSION...........................................................................................................................32
5.BIBLIOGRAPHY.......................................................................................................................33
6.ABSTRACT................................................................................................................................34
7.BIOGRAPHY.............................................................................................................................35
1. INTRODUCTION
Siemens automation software is going to be used in this project to create a controlled way to
produce sunflower oil employing the cold pressing mode. This method gives the oil the best
quality in expenses of less quantity of product and it also represents a major controlled process.
[4] This project is focused on process automation and therefore reducing the human factor and
improving of the product that the factory generates.
1.1. Objectives
The aim of this project not only is to learn how to use the TIA PORTAL V13 software but also
to apply the knowledge in creating an automated process of a sunflower oil plant. In order to
learn how to use TIA PORTAL V13, it's manual, online tutorials and help pages within the
application itself were used.
1.2. Location
The location chosen to apply the project has been the factory of sunflower oil in Cepin, not only
because of the nearly placement, but also because of the currently system they use, a cold
pressing method. This factory is located in Ulica grada Vukovara 18.
Figure 1 shows the location of the sunflower plant in Cepin as well as the satellite and exterior
photo of the plant itself.
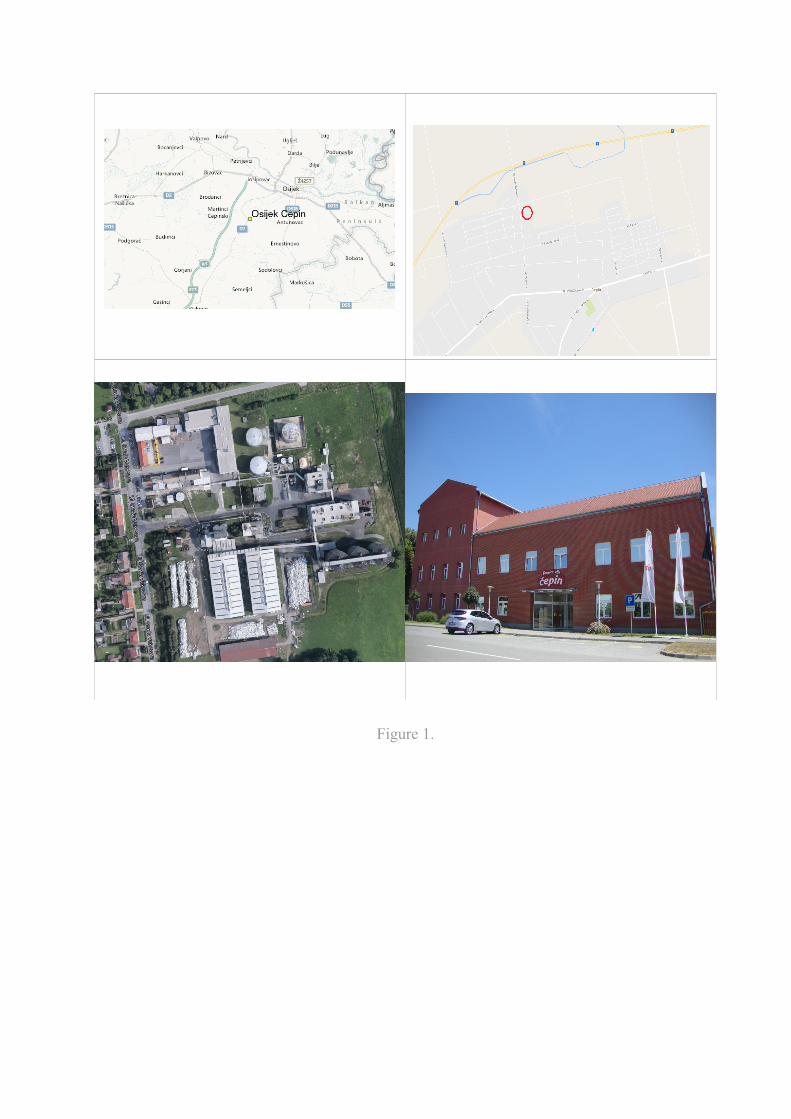
Figure 1.
2. PROCESS
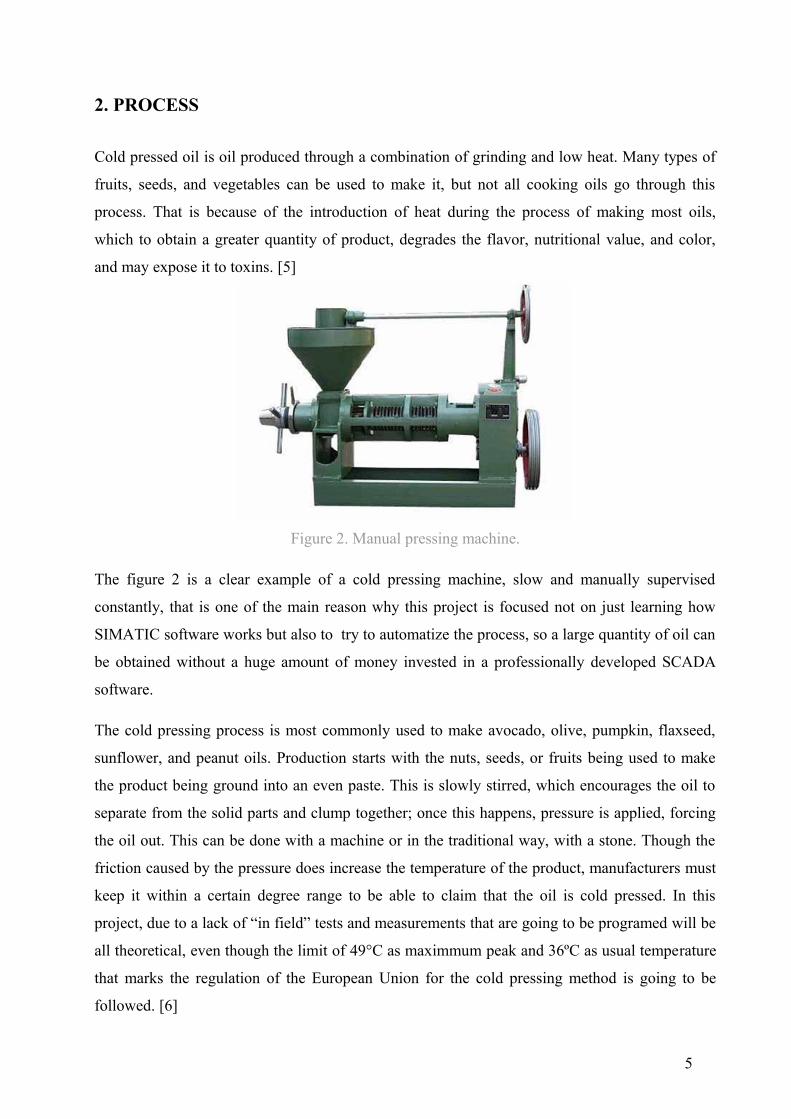
Cold pressed oil is oil produced through a combination of grinding and low heat. Many types of
fruits, seeds, and vegetables can be used to make it, but not all cooking oils go through this
process. That is because of the introduction of heat during the process of making most oils,
which to obtain a greater quantity of product, degrades the flavor, nutritional value, and color,
and may expose it to toxins. [5]
Figure 2. Manual pressing machine.
The figure 2 is a clear example of a cold pressing machine, slow and manually supervised
constantly, that is one of the main reason why this project is focused not on just learning how
SIMATIC software works but also to try to automatize the process, so a large quantity of oil can
be obtained without a huge amount of money invested in a professionally developed SCADA
software.
The cold pressing process is most commonly used to make avocado, olive, pumpkin, flaxseed,
sunflower, and peanut oils. Production starts with the nuts, seeds, or fruits being used to make
the product being ground into an even paste. This is slowly stirred, which encourages the oil to
separate from the solid parts and clump together; once this happens, pressure is applied, forcing
the oil out. This can be done with a machine or in the traditional way, with a stone. Though the
friction caused by the pressure does increase the temperature of the product, manufacturers must
keep it within a certain degree range to be able to claim that the oil is cold pressed. In this
project, due to a lack of “in field” tests and measurements that are going to be programed will be
all theoretical, even though the limit of 49°C as maximmum peak and 36ºC as usual temperature
that marks the regulation of the European Union for the cold pressing method is going to be
followed. [6]
5
The process will be divided in three main parts, firstly the seeds are pressed and also the solid
sub-product is saved for another uses. Then the oil extracted during the pressing is filtered till it
gets pure and clear and finally, the product is bottled in sealed recipients.
2.1. Pressing
This is the first part of the process, in which the seeds of the sunflower plants fall from a
recipient to the pressing machine. This will work while the temperature is optimal as long as
there are seeds on the input and no one press one of the stop buttons. To detect if there are
enough seeds on the start of the machine to keep production going on, a weight detector will be
used. It will emit a digital 1 if there is enough product. In the case it emits a 0, the door and the
conveyer belt that led to the press will stop immediately. If one of the stop buttons are pressed,
everything will be turn down. The difference will be that, if it is an emergency stop the
production will cease sharply. In other hand, if it is a normal stop, the production will cease
gradually in three different sectors that will be shown in the programming bloc.
The seed remains will go out from the pressing machine to another conveyer belt that will led
them into another weight detector. When it detects enough product, will emit a digital 1. When
the sensor emits this signal, a hatch underneath will open during some seconds allowing all the
remains to fall into a big plastic box, which will be packed and send to another plants. This
material can be used in farming, as a component in the food of the animals or also as fertilizer.
[6]
2.2. Filtering
Once the oil is extracted from the seeds during the pressing process, it needs to be filtered before
being suitable for human consumption. [4] To do this process, two deposits under the pressing
machine are disposed. When the level detector emits the signal 1, meaning the first deposit is
nearly full, a motor moves these two to the right. This will happen till the level detector emits the
signal 0, meaning that the deposit is empty, because the second deposit is now under the pressing
machine. Notice that the sensor is not going to wait until the first deposit is completely full,
because this would mean a waste of the oil that keeps going out from the pressing machine
during the time the machine needs to change to the empty container. Next time the detector emits
a 1, the deposits will move to the left. When the filled reservoirs reach the desired position, a
metal component fixed to the general structure will raise part of the floor of the tank. Thus will
cause the container to be emptied into the corresponding filtering machine. When the deposits
6
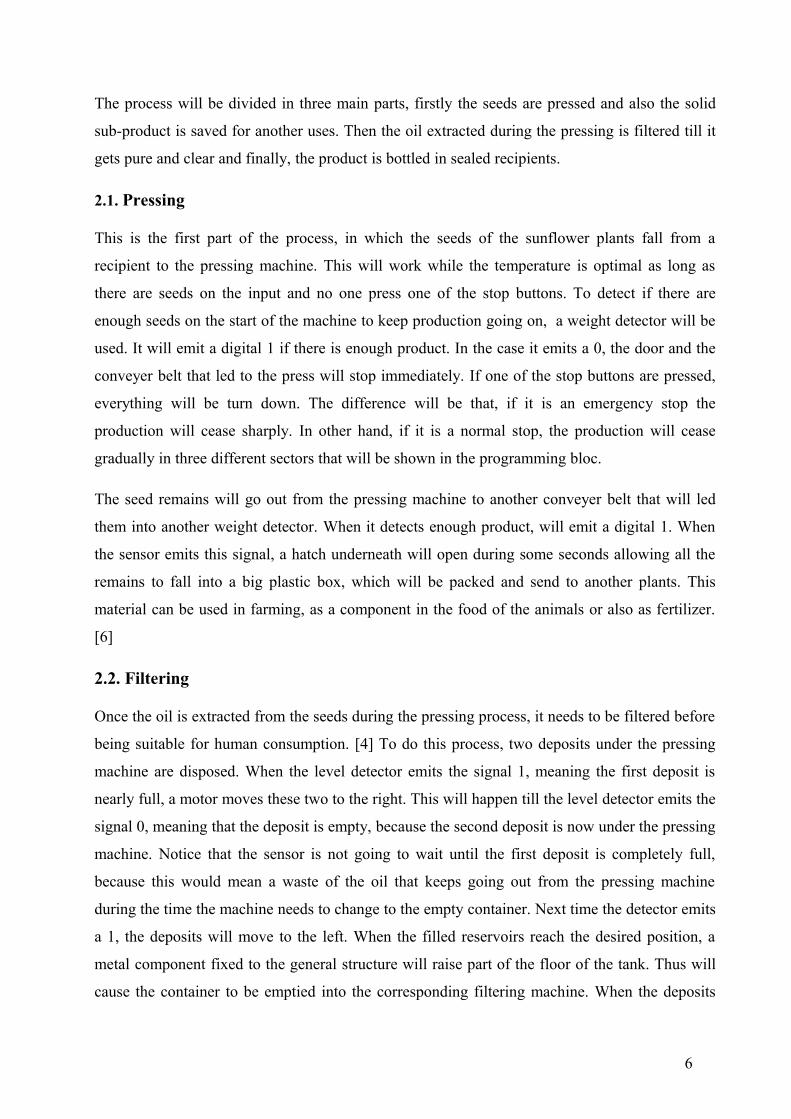
move back to the initial position, a spring will close again the container. This can be observed
with the next schemes. Between the two deposits, two slides will be disposed, and will ensure
that no drop of oil is wasted during the transition between the full and the empty containers. The
design can be observed in the figure 3.
Figure 3. Blueprint of the tanks.
For the next step two identical machines are disposed underneath the deposits. This will provide
the filters with the double time to filter the oil than what it takes to fill the deposits from the
pressing machine. If the factory expect even a better quality of oil, they will just need to increase
the number of deposits and filters to increase the time frame they have to get the work done.
The oil from the containers will keep falling into the funnel of the filter machine since when the
level sensor of the side A detects all the oil from the upper deposit has been released. Then a
pump on the A side will make all the oil flow through the filters till all the liquid is on the side B.
When the level sensor on the side B detects this, the pump on the B side will send the oil to the
side A again. This operation will be repeated till a sensor of purity sends a digital 1, meaning the
oil has reached the desired quality specific previously during the sensor calibration. When this
7
happens, both deposits, from side A and B, will open an underneath hatch that will send the fine
oil into a funnel that will led into a big container were the oil will stay till the last step.
2.3. Packaging
Once the product has reached the desired quality level, it is stored in large tanks waiting to be
bottled. To do this, injectors insert the oil in the bottles that are circulating in batches by the tape.
Once they reach the appropriate level, they return to circulate, to arrive first at the machine of
plugging and second to the one of labeling. Finally, a conveyor belt introduces the bottles into
boxes, ready to be stored or shipped to stores.
3. SIMATIC
SIMATIC is the automation system developed by the German company Siemens to controls
machines used for industrial production. This system makes it possible for machines to run
automatically or with nearly no human supervision. This software is similar to a digital computer
which can store and run programs. The Simatic also has some inputs and outputs which are
controlled by the running program on the system. Both are connected by electrical wires with the
PLC, and can be sensors or activators. That makes a communication between the Simatic and
any machine possible. As the case may be the inputs and outputs are set on a “High” signal or on
a “Low” signal by the program, these signals are the ones that determinate if an action in the
machine happens or not. [1]
On the latest version of the program, the one used in the making of this project, Siemens decided
to unite all the previous softwares into one. The TIA Portal V13 allows users not only to create a
SCADA enviorament as WinCC used to do, but also the configuration of the PLC and it's
modules. [9]
3.1. Device & Networks
The first step in the program will be choosing a PLC that fits the plant necessities and adjust also
to a suitable budget. In this case, the CPU 317F-2 PN/DP has been chosen because of the high
speed, memory capacity for internal variables and relatively low price in comparison with other
8
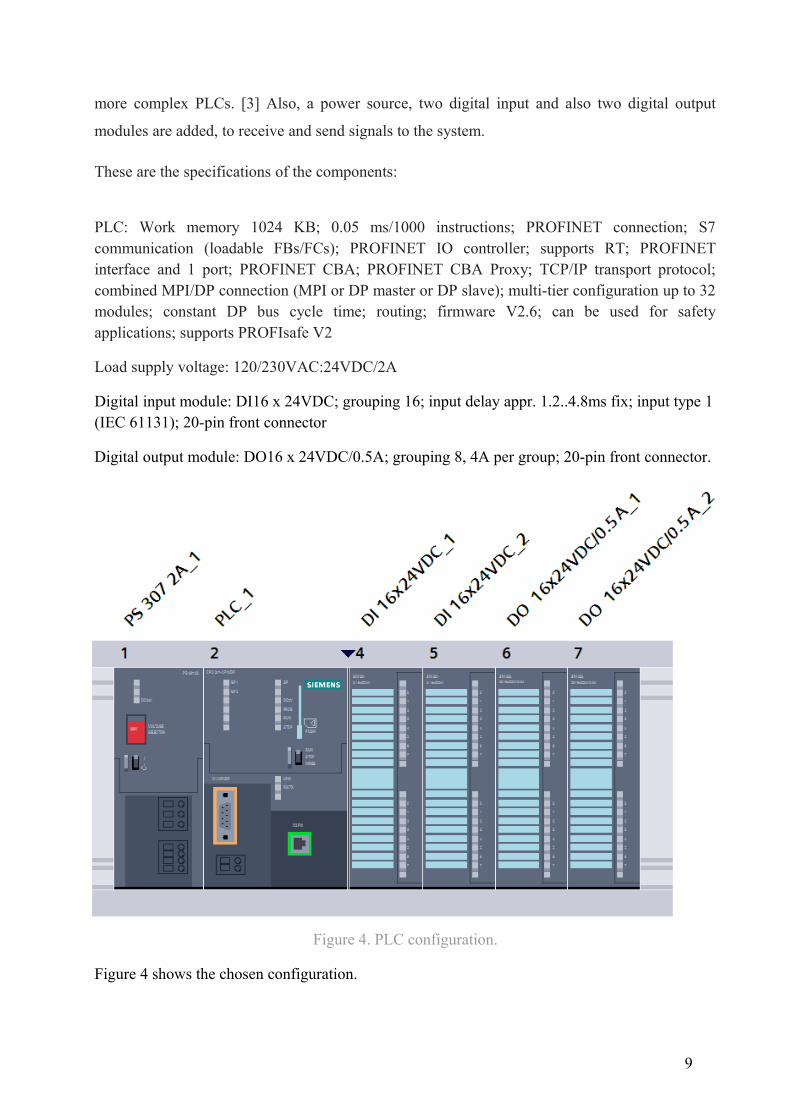
more complex PLCs. [3] Also, a power source, two digital input and also two digital output
modules are added, to receive and send signals to the system.
These are the specifications of the components:
PLC: Work memory 1024 KB; 0.05 ms/1000 instructions; PROFINET connection; S7communication (loadable FBs/FCs); PROFINET IO controller; supports RT; PROFINETinterface and 1 port; PROFINET CBA; PROFINET CBA Proxy; TCP/IP transport protocol;combined MPI/DP connection (MPI or DP master or DP slave); multi-tier configuration up to 32modules; constant DP bus cycle time; routing; firmware V2.6; can be used for safetyapplications; supports PROFIsafe V2
Load supply voltage: 120/230VAC:24VDC/2A
Digital input module: DI16 x 24VDC; grouping 16; input delay appr. 1.2..4.8ms fix; input type 1(IEC 61131); 20-pin front connector
Digital output module: DO16 x 24VDC/0.5A; grouping 8, 4A per group; 20-pin front connector.
Figure 4. PLC configuration.
Figure 4 shows the chosen configuration.
9
3.2. PLC Programming
Now, once the hardware has been selected, the programming of the PLC can begin, according towhich the entire industrial process will be developed.
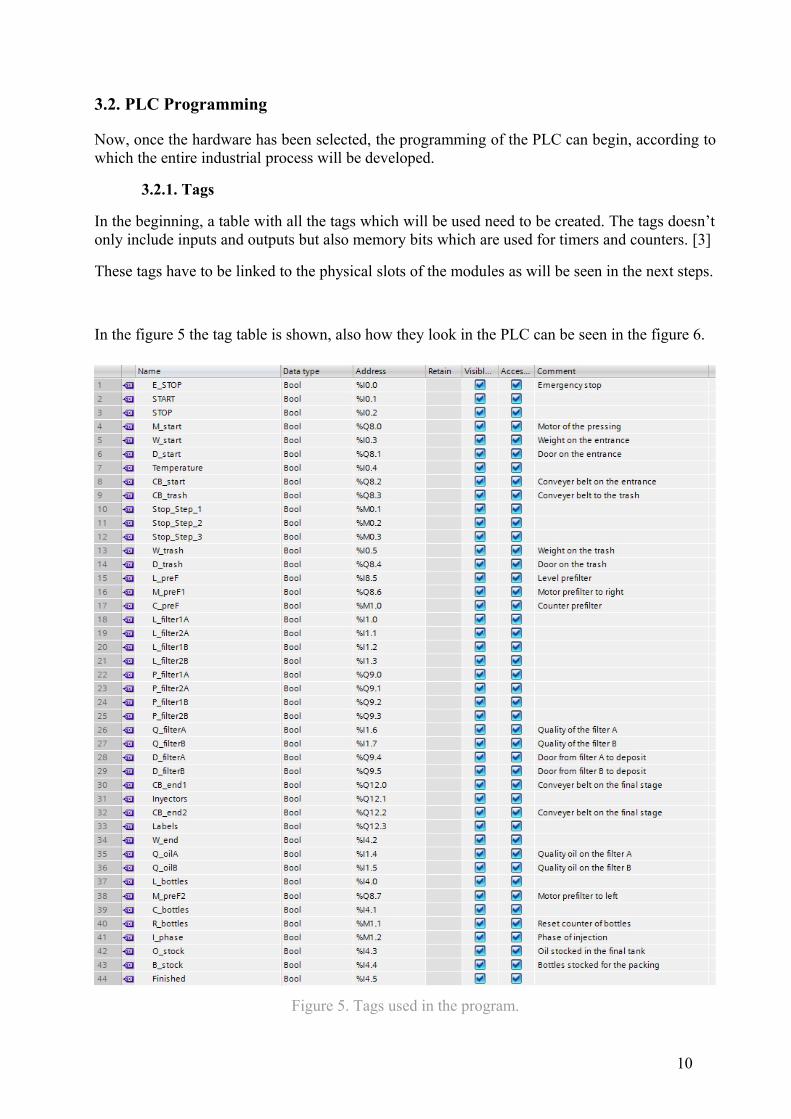
3.2.1. Tags
In the beginning, a table with all the tags which will be used need to be created. The tags doesn’tonly include inputs and outputs but also memory bits which are used for timers and counters. [3]
These tags have to be linked to the physical slots of the modules as will be seen in the next steps.
In the figure 5 the tag table is shown, also how they look in the PLC can be seen in the figure 6.
Figure 5. Tags used in the program.
10
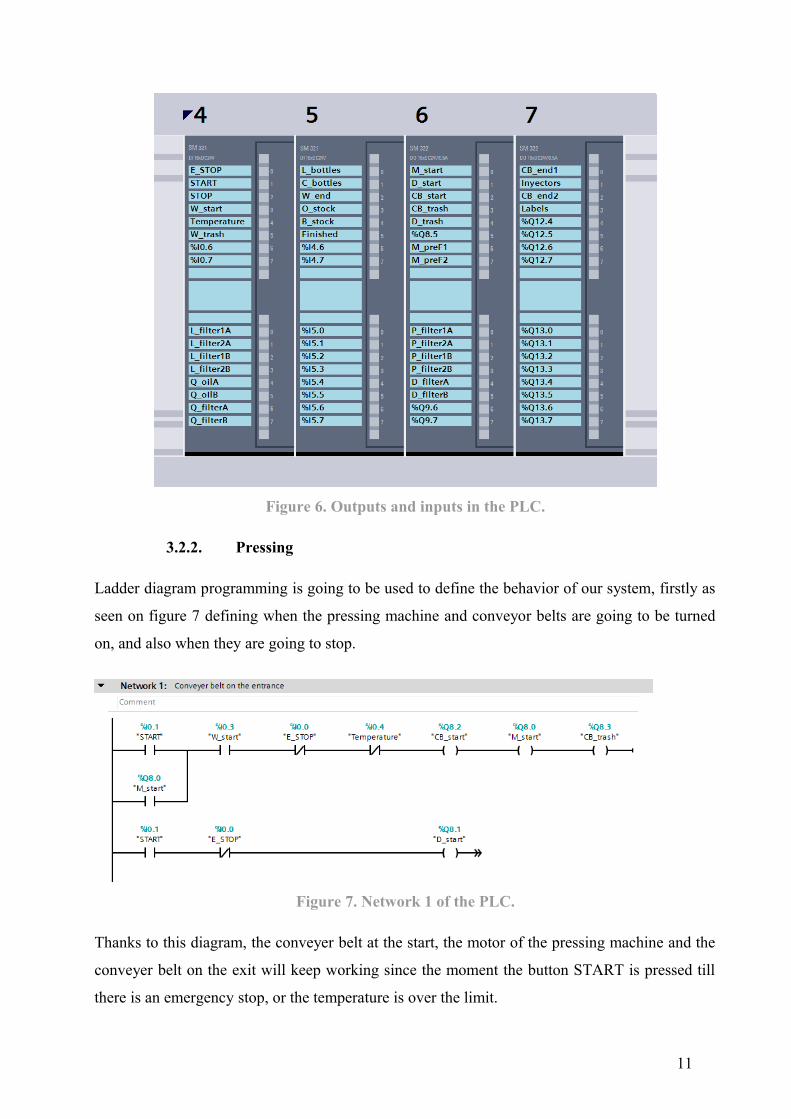
Figure 6. Outputs and inputs in the PLC.
3.2.2. Pressing
Ladder diagram programming is going to be used to define the behavior of our system, firstly as
seen on figure 7 defining when the pressing machine and conveyor belts are going to be turned
on, and also when they are going to stop.
Figure 7. Network 1 of the PLC.
Thanks to this diagram, the conveyer belt at the start, the motor of the pressing machine and the
conveyer belt on the exit will keep working since the moment the button START is pressed till
there is an emergency stop, or the temperature is over the limit.
11
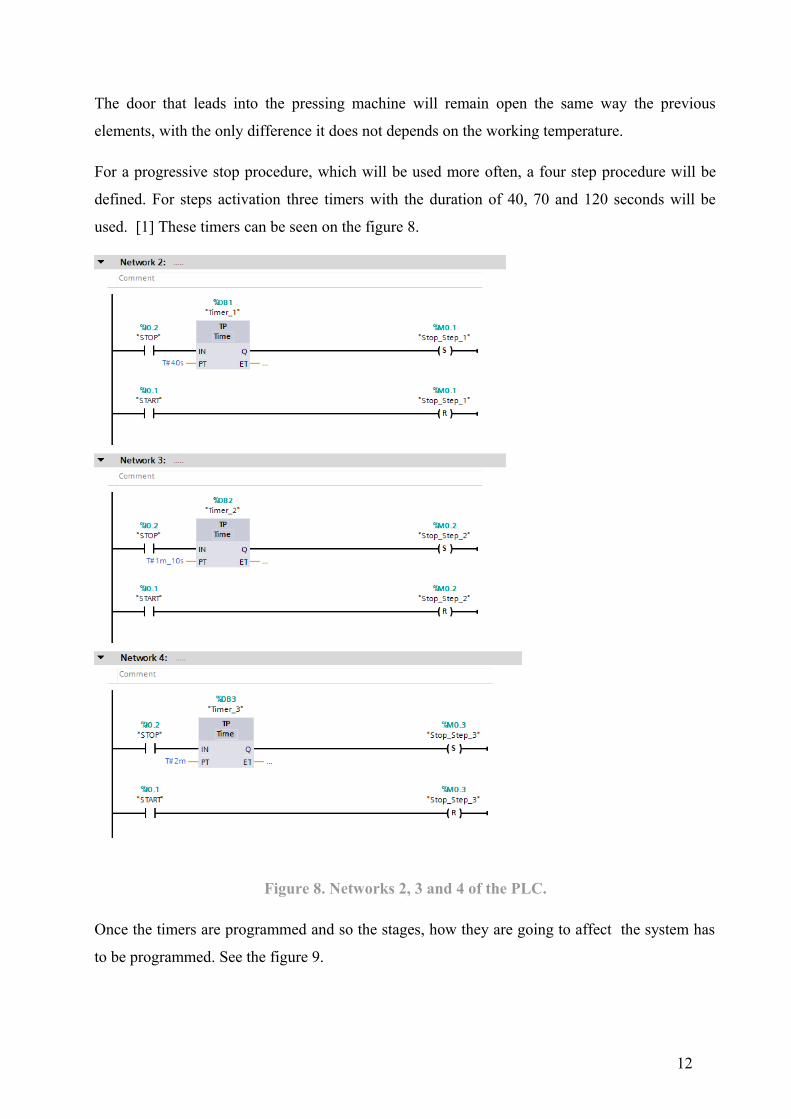
The door that leads into the pressing machine will remain open the same way the previous
elements, with the only difference it does not depends on the working temperature.
For a progressive stop procedure, which will be used more often, a four step procedure will be
defined. For steps activation three timers with the duration of 40, 70 and 120 seconds will be
used. [1] These timers can be seen on the figure 8.
Figure 8. Networks 2, 3 and 4 of the PLC.
Once the timers are programmed and so the stages, how they are going to affect the system has
to be programmed. See the figure 9.
12
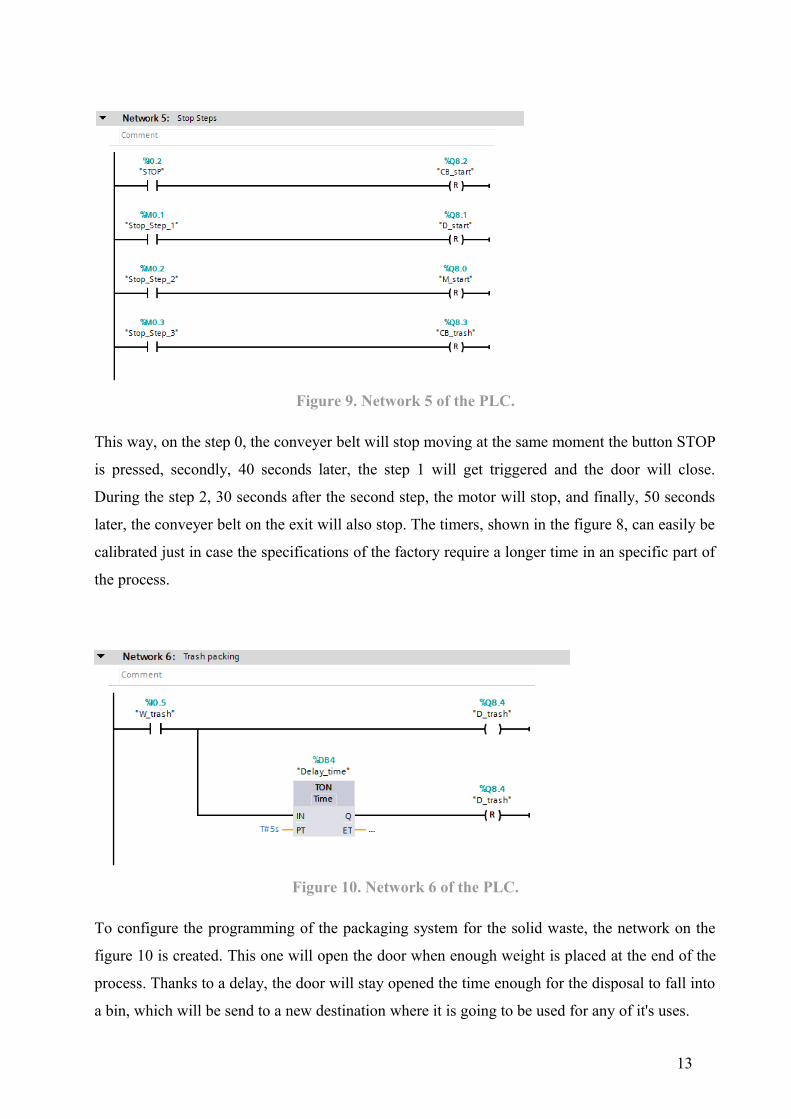
Figure 9. Network 5 of the PLC.
This way, on the step 0, the conveyer belt will stop moving at the same moment the button STOP
is pressed, secondly, 40 seconds later, the step 1 will get triggered and the door will close.
During the step 2, 30 seconds after the second step, the motor will stop, and finally, 50 seconds
later, the conveyer belt on the exit will also stop. The timers, shown in the figure 8, can easily be
calibrated just in case the specifications of the factory require a longer time in an specific part of
the process.
Figure 10. Network 6 of the PLC.
To configure the programming of the packaging system for the solid waste, the network on the
figure 10 is created. This one will open the door when enough weight is placed at the end of the
process. Thanks to a delay, the door will stay opened the time enough for the disposal to fall into
a bin, which will be send to a new destination where it is going to be used for any of it's uses.
13
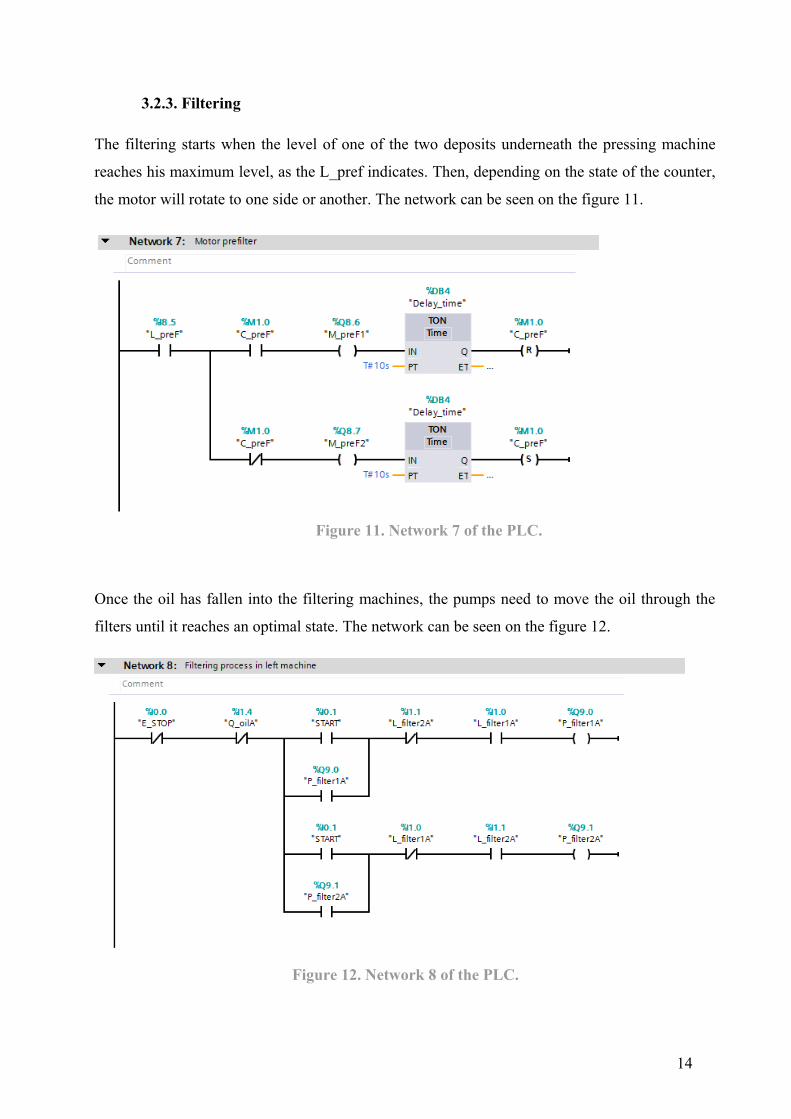
3.2.3. Filtering
The filtering starts when the level of one of the two deposits underneath the pressing machine
reaches his maximum level, as the L_pref indicates. Then, depending on the state of the counter,
the motor will rotate to one side or another. The network can be seen on the figure 11.
Figure 11. Network 7 of the PLC.
Once the oil has fallen into the filtering machines, the pumps need to move the oil through the
filters until it reaches an optimal state. The network can be seen on the figure 12.
Figure 12. Network 8 of the PLC.
14
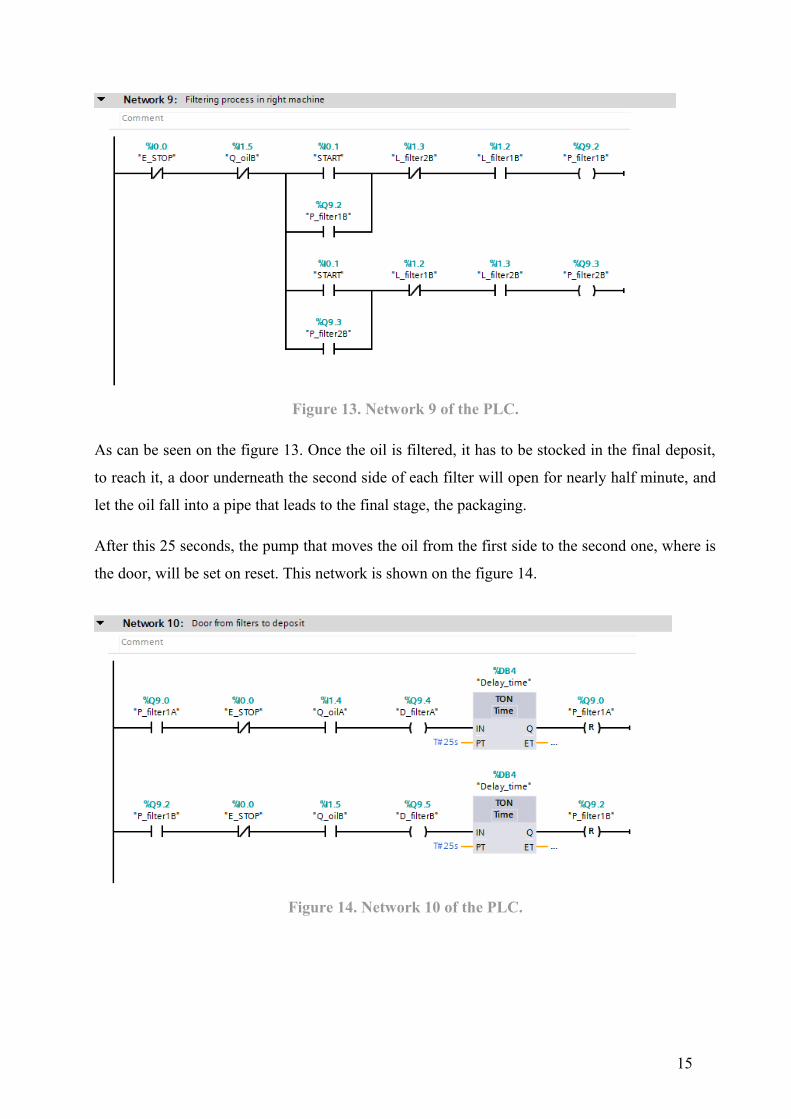
Figure 13. Network 9 of the PLC.
As can be seen on the figure 13. Once the oil is filtered, it has to be stocked in the final deposit,
to reach it, a door underneath the second side of each filter will open for nearly half minute, and
let the oil fall into a pipe that leads to the final stage, the packaging.
After this 25 seconds, the pump that moves the oil from the first side to the second one, where is
the door, will be set on reset. This network is shown on the figure 14.
Figure 14. Network 10 of the PLC.
15
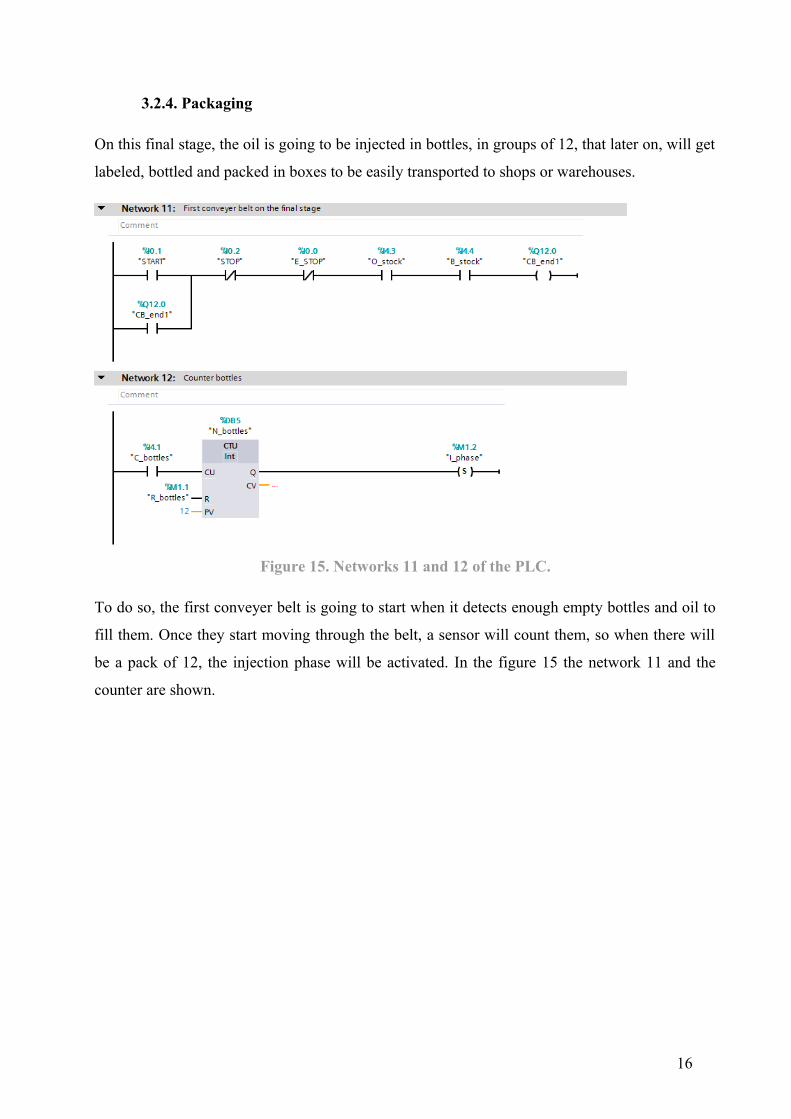
3.2.4. Packaging
On this final stage, the oil is going to be injected in bottles, in groups of 12, that later on, will get
labeled, bottled and packed in boxes to be easily transported to shops or warehouses.
Figure 15. Networks 11 and 12 of the PLC.
To do so, the first conveyer belt is going to start when it detects enough empty bottles and oil to
fill them. Once they start moving through the belt, a sensor will count them, so when there will
be a pack of 12, the injection phase will be activated. In the figure 15 the network 11 and the
counter are shown.
16
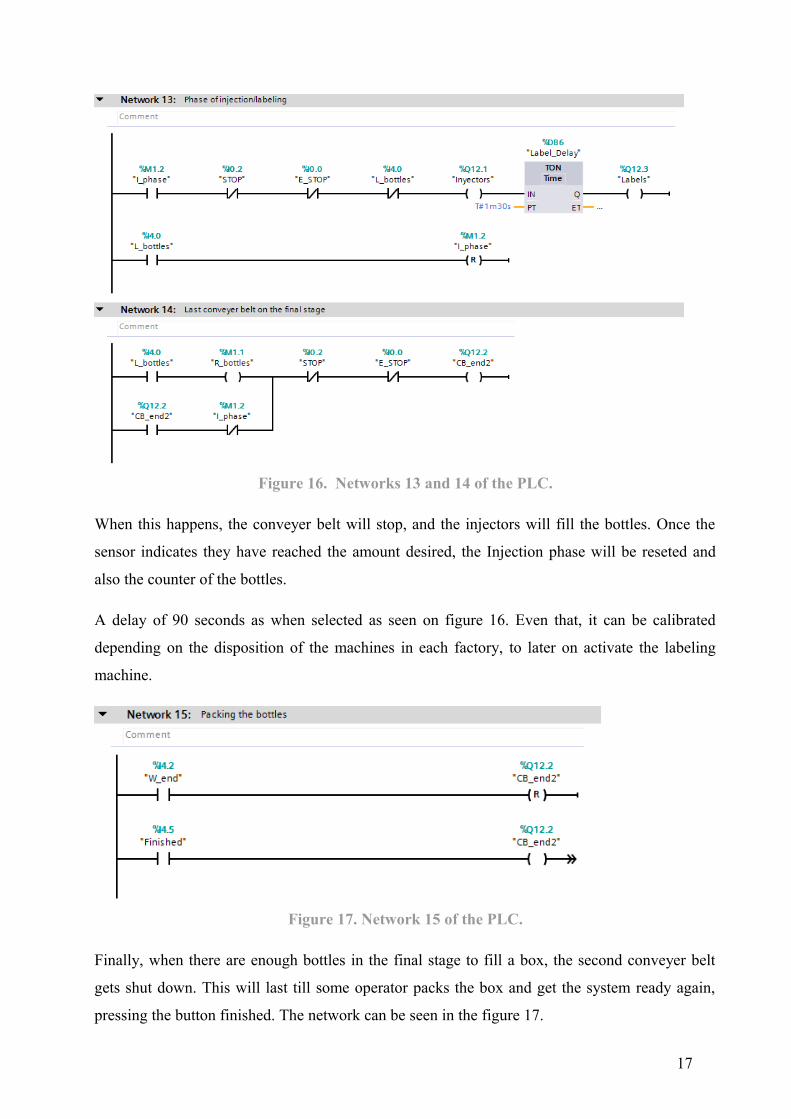
Figure 16. Networks 13 and 14 of the PLC.
When this happens, the conveyer belt will stop, and the injectors will fill the bottles. Once the
sensor indicates they have reached the amount desired, the Injection phase will be reseted and
also the counter of the bottles.
A delay of 90 seconds as when selected as seen on figure 16. Even that, it can be calibrated
depending on the disposition of the machines in each factory, to later on activate the labeling
machine.
Figure 17. Network 15 of the PLC.
Finally, when there are enough bottles in the final stage to fill a box, the second conveyer belt
gets shut down. This will last till some operator packs the box and get the system ready again,
pressing the button finished. The network can be seen in the figure 17.
17
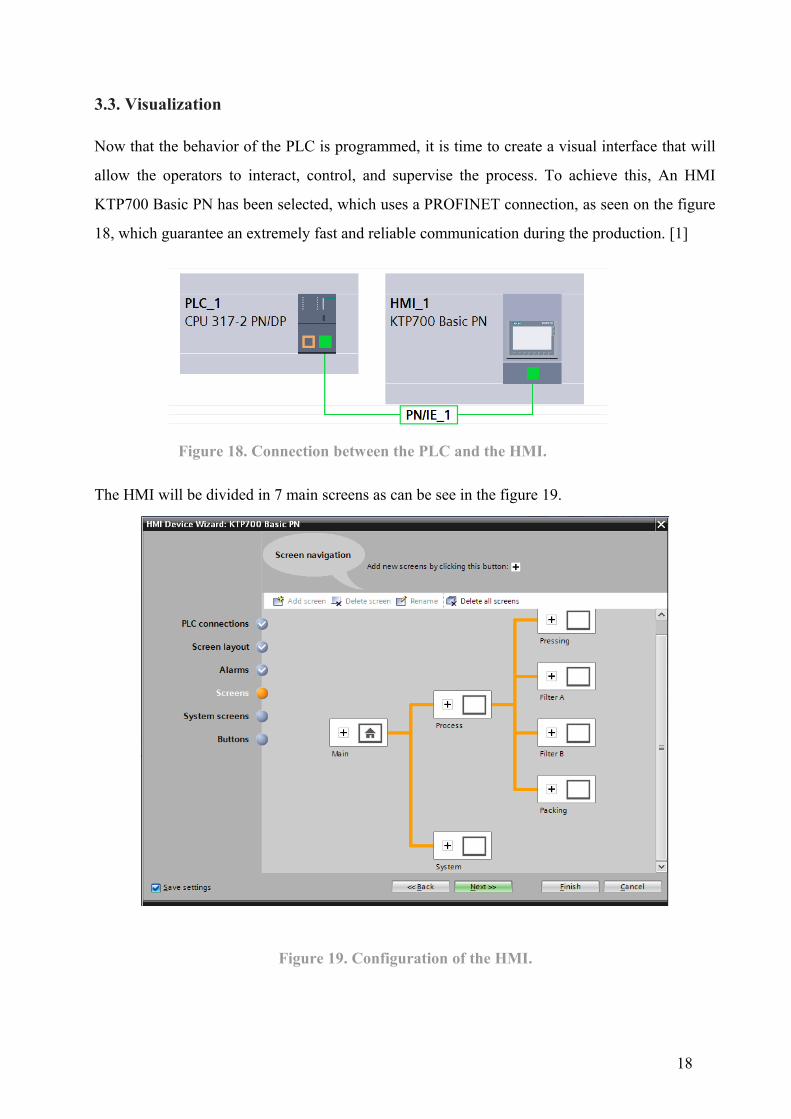
3.3. Visualization
Now that the behavior of the PLC is programmed, it is time to create a visual interface that will
allow the operators to interact, control, and supervise the process. To achieve this, An HMI
KTP700 Basic PN has been selected, which uses a PROFINET connection, as seen on the figure
18, which guarantee an extremely fast and reliable communication during the production. [1]
Figure 18. Connection between the PLC and the HMI.
The HMI will be divided in 7 main screens as can be see in the figure 19.
Figure 19. Configuration of the HMI.
18
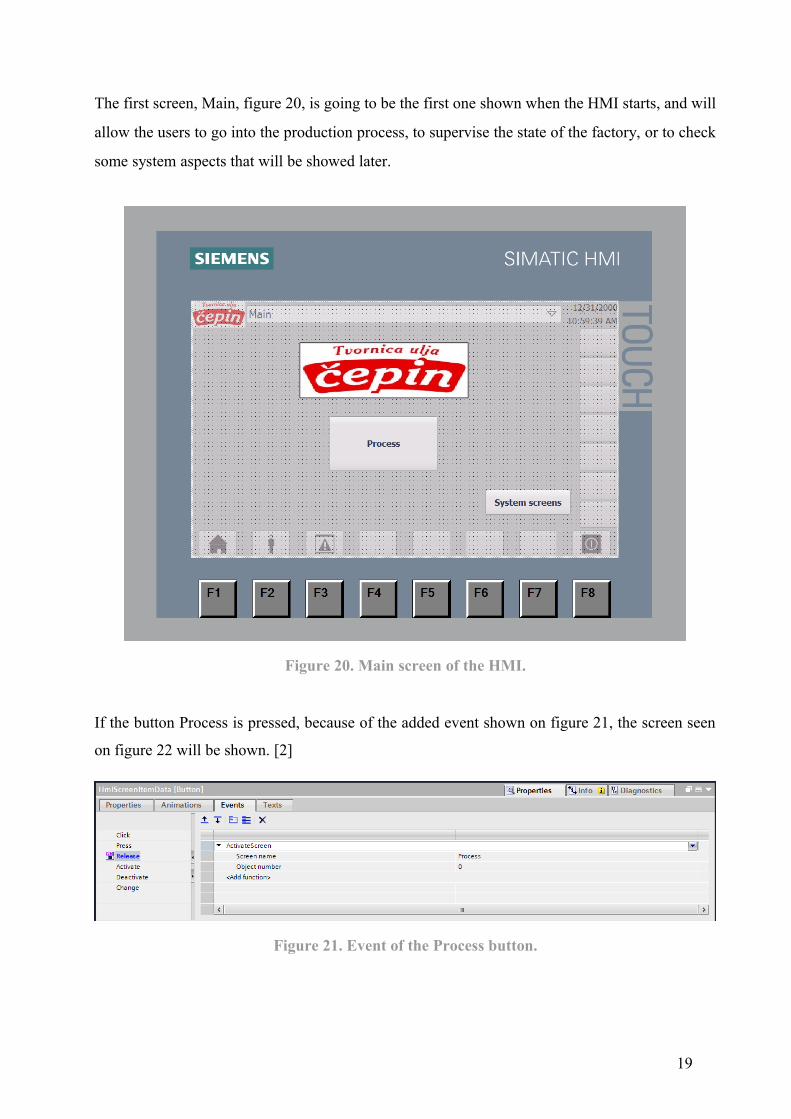
The first screen, Main, figure 20, is going to be the first one shown when the HMI starts, and will
allow the users to go into the production process, to supervise the state of the factory, or to check
some system aspects that will be showed later.
Figure 20. Main screen of the HMI.
If the button Process is pressed, because of the added event shown on figure 21, the screen seen
on figure 22 will be shown. [2]
Figure 21. Event of the Process button.
19
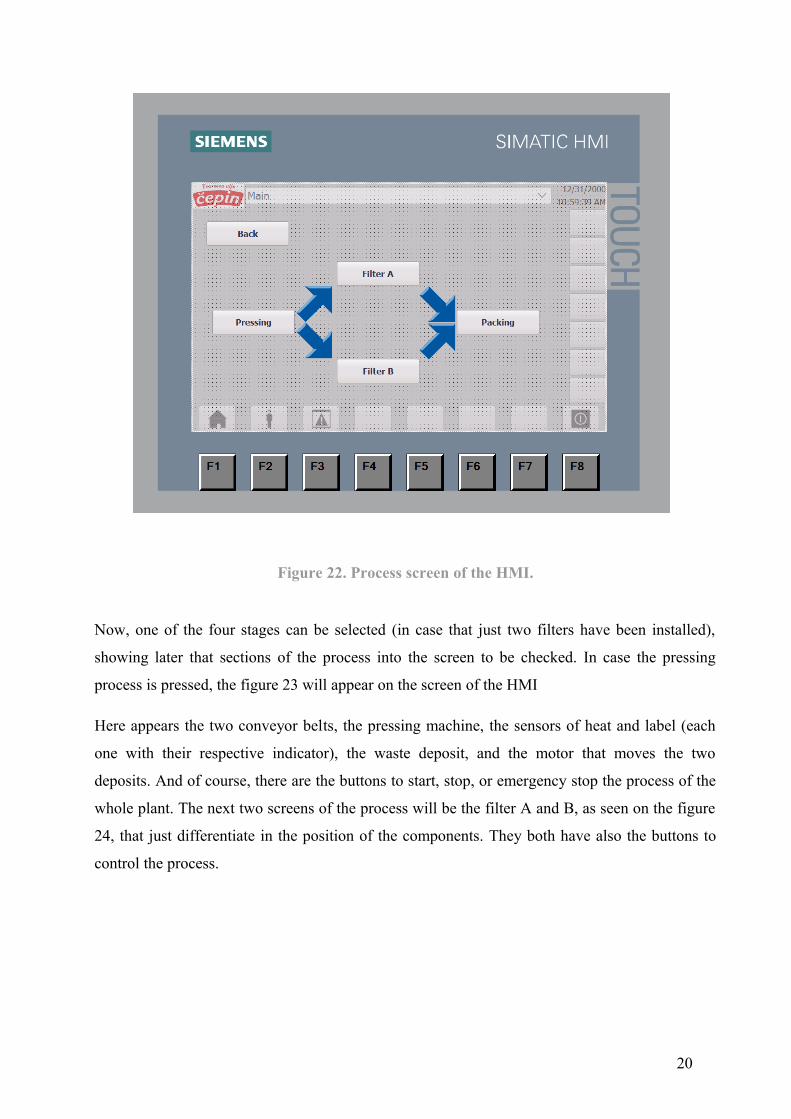
Figure 22. Process screen of the HMI.
Now, one of the four stages can be selected (in case that just two filters have been installed),
showing later that sections of the process into the screen to be checked. In case the pressing
process is pressed, the figure 23 will appear on the screen of the HMI
Here appears the two conveyor belts, the pressing machine, the sensors of heat and label (each
one with their respective indicator), the waste deposit, and the motor that moves the two
deposits. And of course, there are the buttons to start, stop, or emergency stop the process of the
whole plant. The next two screens of the process will be the filter A and B, as seen on the figure
24, that just differentiate in the position of the components. They both have also the buttons to
control the process.
20
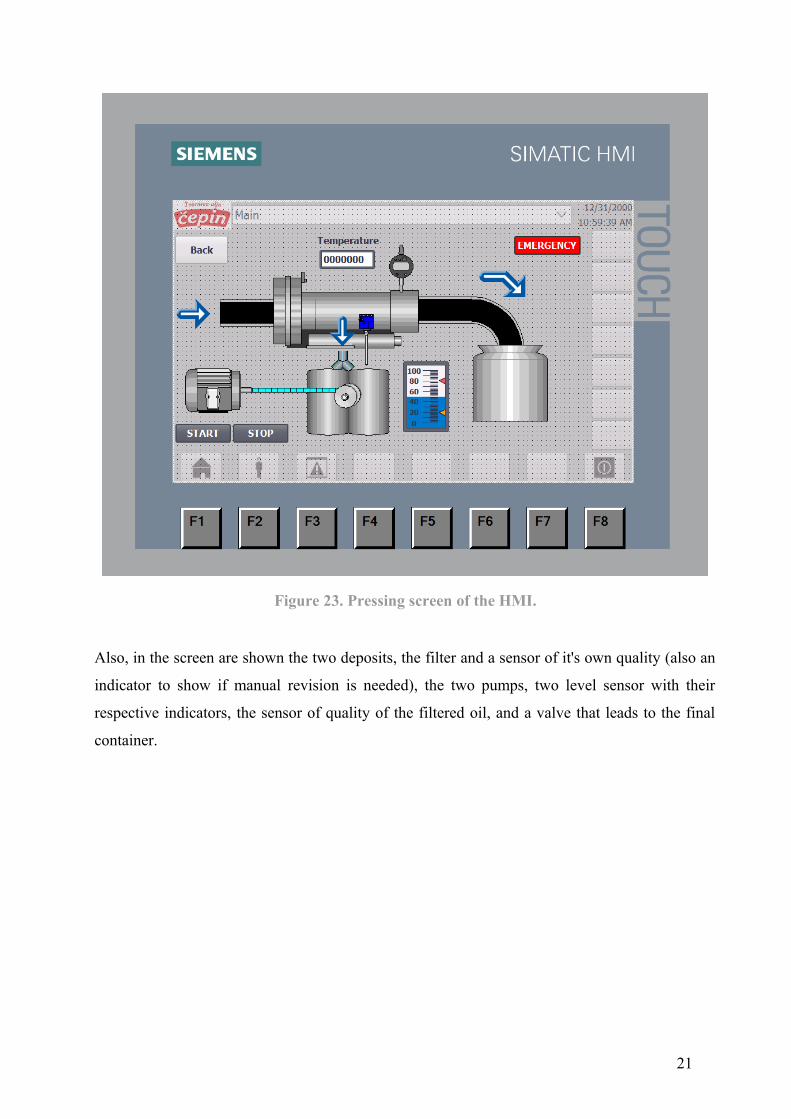
Figure 23. Pressing screen of the HMI.
Also, in the screen are shown the two deposits, the filter and a sensor of it's own quality (also an
indicator to show if manual revision is needed), the two pumps, two level sensor with their
respective indicators, the sensor of quality of the filtered oil, and a valve that leads to the final
container.
21
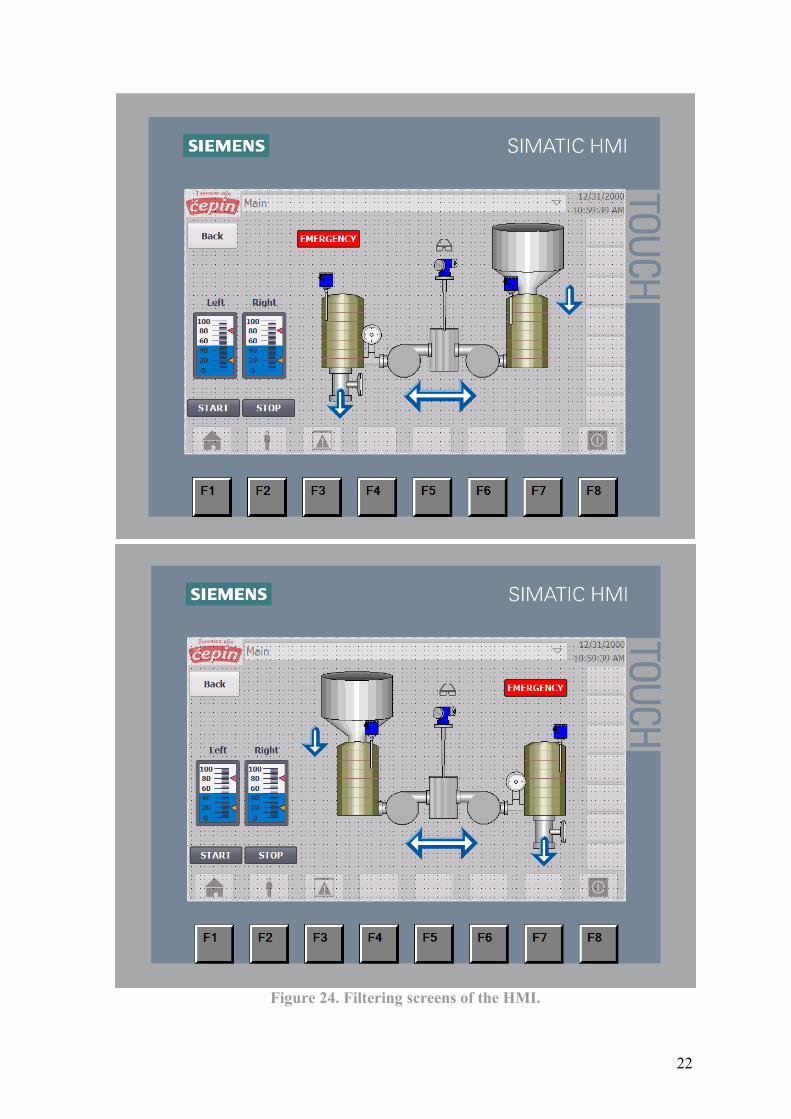
Figure 24. Filtering screens of the HMI.
22
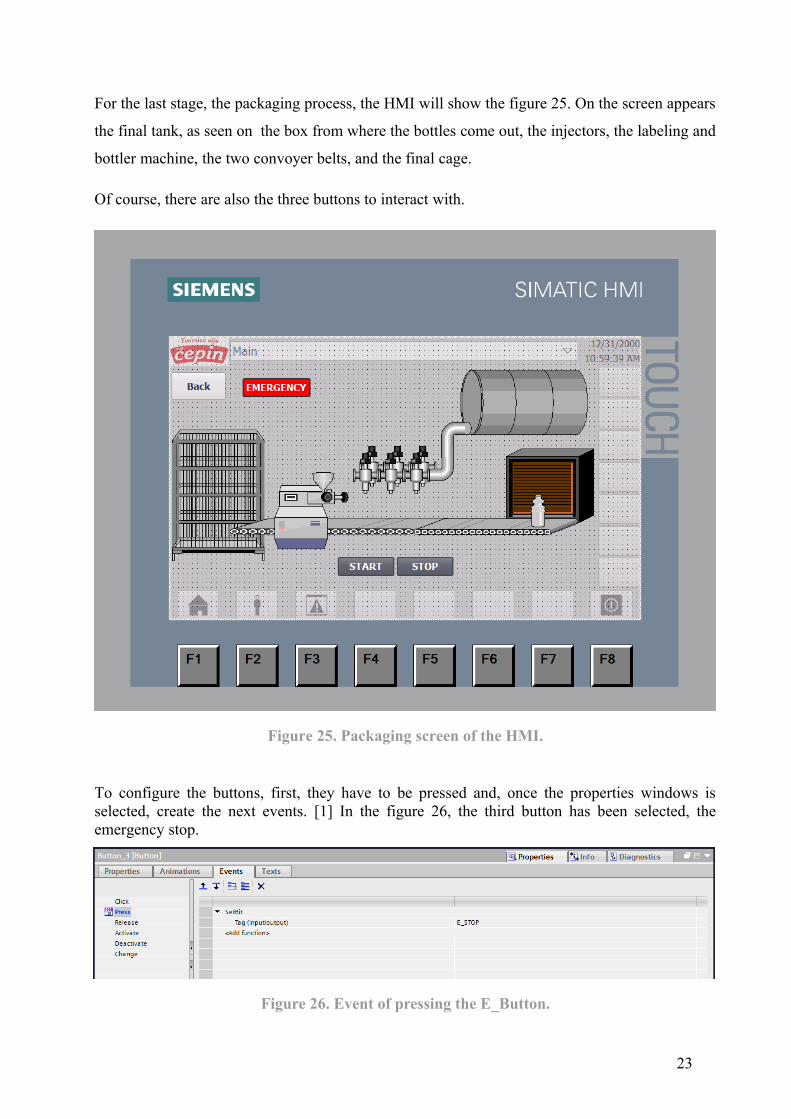
For the last stage, the packaging process, the HMI will show the figure 25. On the screen appears
the final tank, as seen on the box from where the bottles come out, the injectors, the labeling and
bottler machine, the two convoyer belts, and the final cage.
Of course, there are also the three buttons to interact with.
Figure 25. Packaging screen of the HMI.
To configure the buttons, first, they have to be pressed and, once the properties windows isselected, create the next events. [1] In the figure 26, the third button has been selected, theemergency stop.
Figure 26. Event of pressing the E_Button.
23
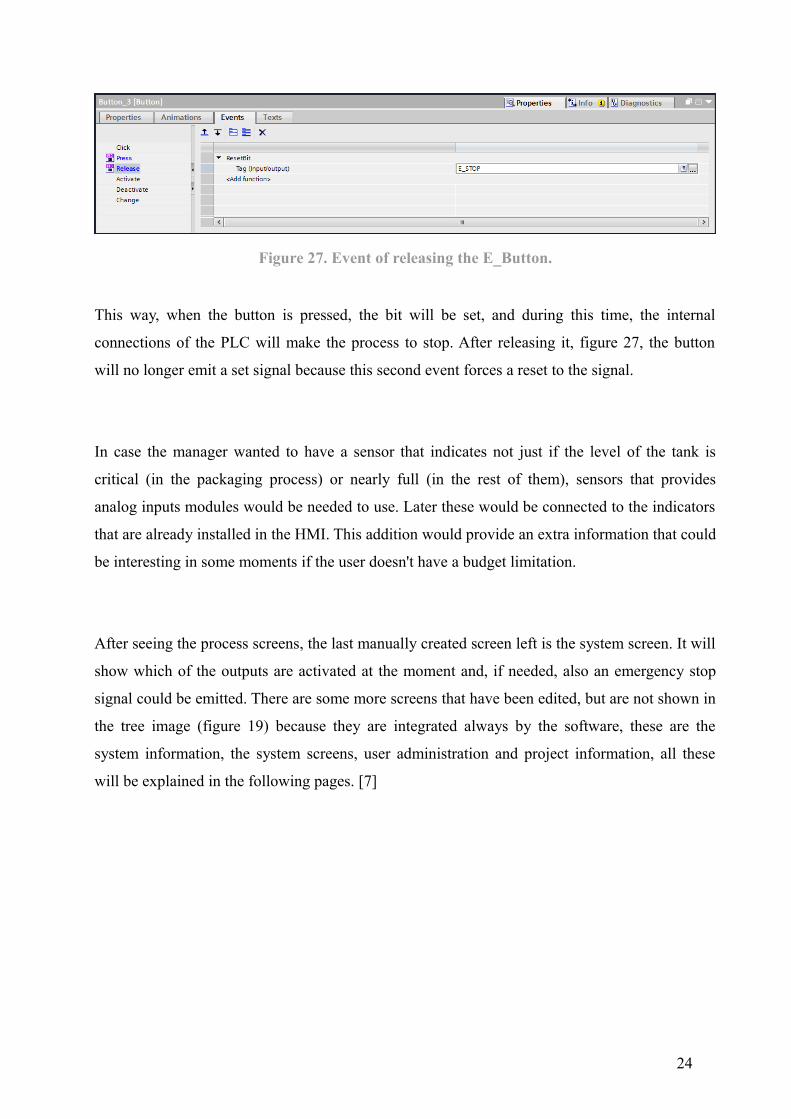
Figure 27. Event of releasing the E_Button.
This way, when the button is pressed, the bit will be set, and during this time, the internal
connections of the PLC will make the process to stop. After releasing it, figure 27, the button
will no longer emit a set signal because this second event forces a reset to the signal.
In case the manager wanted to have a sensor that indicates not just if the level of the tank is
critical (in the packaging process) or nearly full (in the rest of them), sensors that provides
analog inputs modules would be needed to use. Later these would be connected to the indicators
that are already installed in the HMI. This addition would provide an extra information that could
be interesting in some moments if the user doesn't have a budget limitation.
After seeing the process screens, the last manually created screen left is the system screen. It will
show which of the outputs are activated at the moment and, if needed, also an emergency stop
signal could be emitted. There are some more screens that have been edited, but are not shown in
the tree image (figure 19) because they are integrated always by the software, these are the
system information, the system screens, user administration and project information, all these
will be explained in the following pages. [7]
24
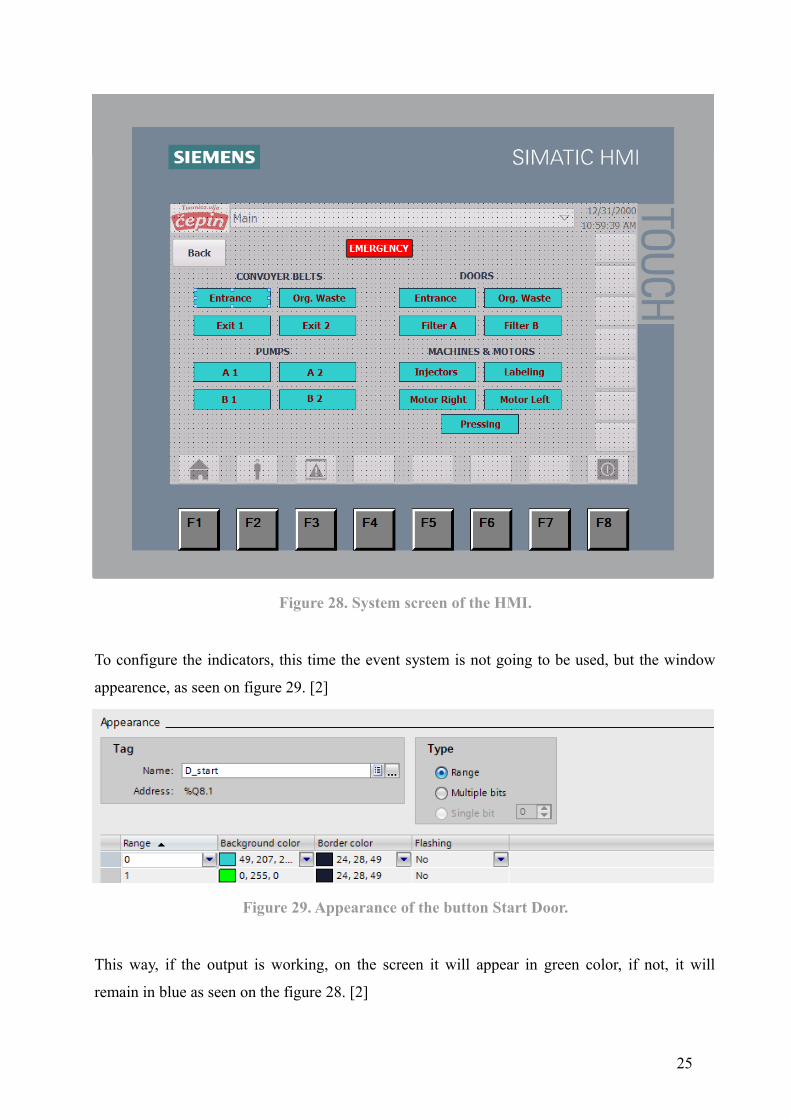
Figure 28. System screen of the HMI.
To configure the indicators, this time the event system is not going to be used, but the window
appearence, as seen on figure 29. [2]
Figure 29. Appearance of the button Start Door.
This way, if the output is working, on the screen it will appear in green color, if not, it will
remain in blue as seen on the figure 28. [2]
25
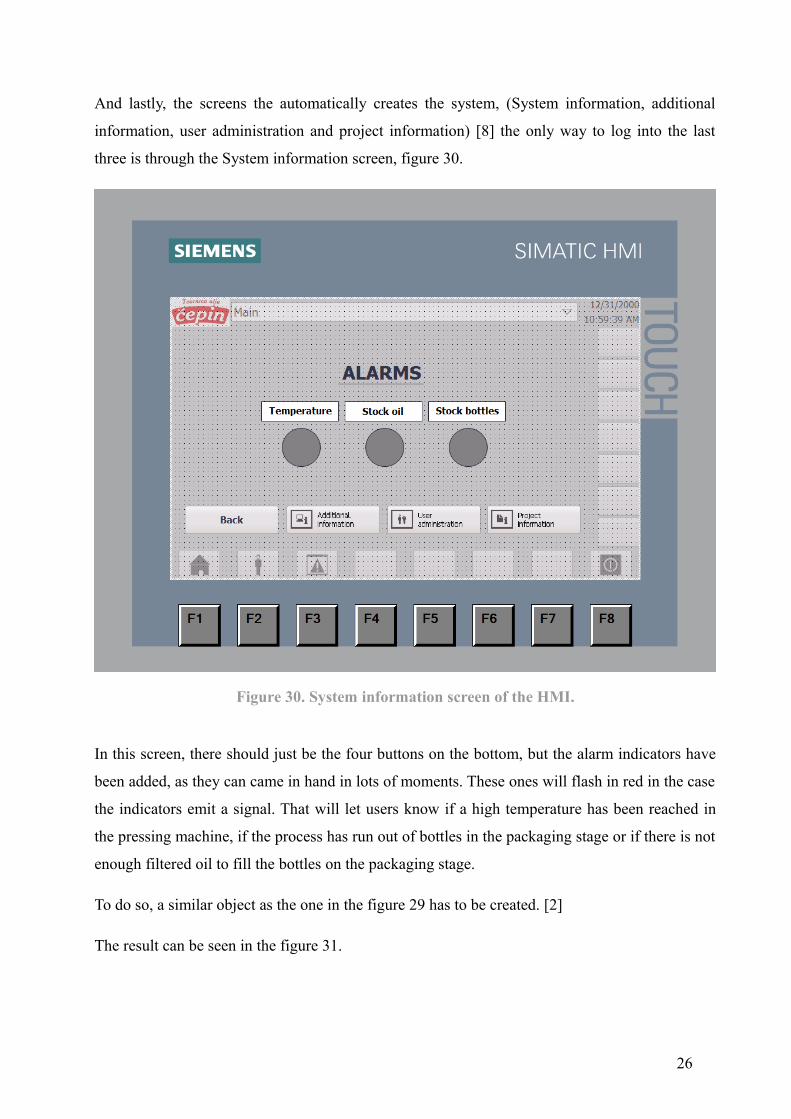
And lastly, the screens the automatically creates the system, (System information, additional
information, user administration and project information) [8] the only way to log into the last
three is through the System information screen, figure 30.
Figure 30. System information screen of the HMI.
In this screen, there should just be the four buttons on the bottom, but the alarm indicators have
been added, as they can came in hand in lots of moments. These ones will flash in red in the case
the indicators emit a signal. That will let users know if a high temperature has been reached in
the pressing machine, if the process has run out of bottles in the packaging stage or if there is not
enough filtered oil to fill the bottles on the packaging stage.
To do so, a similar object as the one in the figure 29 has to be created. [2]
The result can be seen in the figure 31.
26
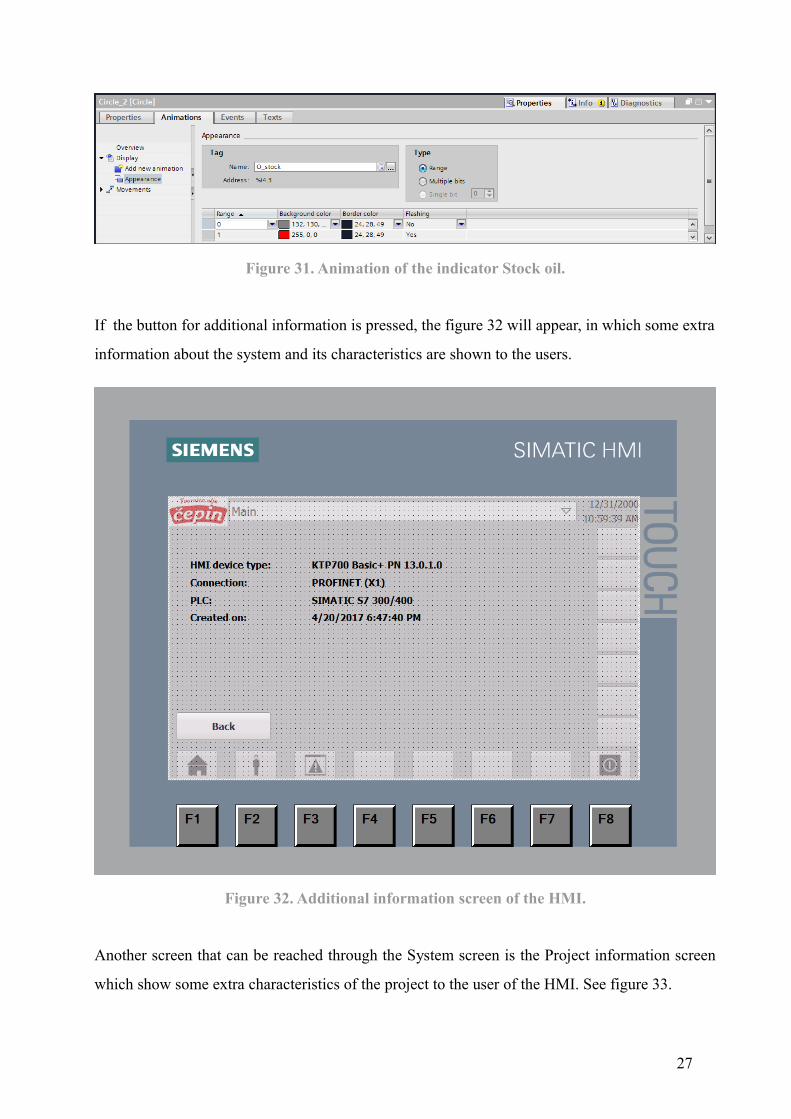
Figure 31. Animation of the indicator Stock oil.
If the button for additional information is pressed, the figure 32 will appear, in which some extra
information about the system and its characteristics are shown to the users.
Figure 32. Additional information screen of the HMI.
Another screen that can be reached through the System screen is the Project information screen
which show some extra characteristics of the project to the user of the HMI. See figure 33.
27
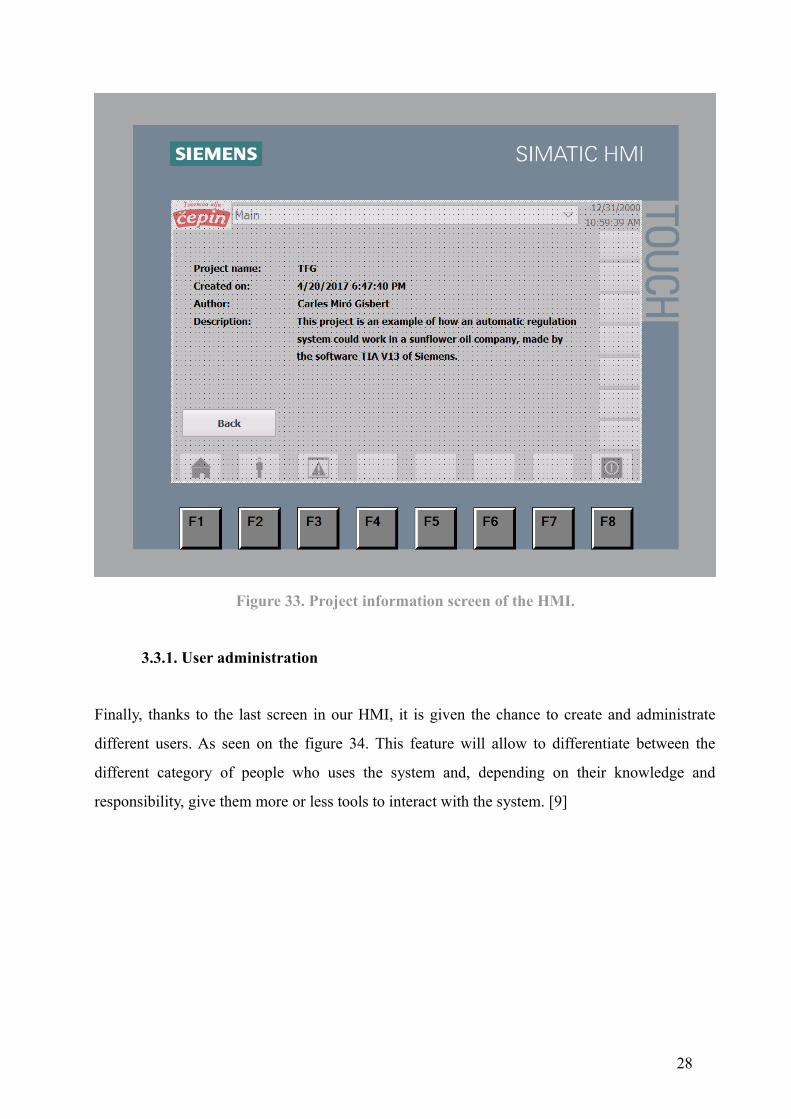
Figure 33. Project information screen of the HMI.
3.3.1. User administration
Finally, thanks to the last screen in our HMI, it is given the chance to create and administrate
different users. As seen on the figure 34. This feature will allow to differentiate between the
different category of people who uses the system and, depending on their knowledge and
responsibility, give them more or less tools to interact with the system. [9]
28
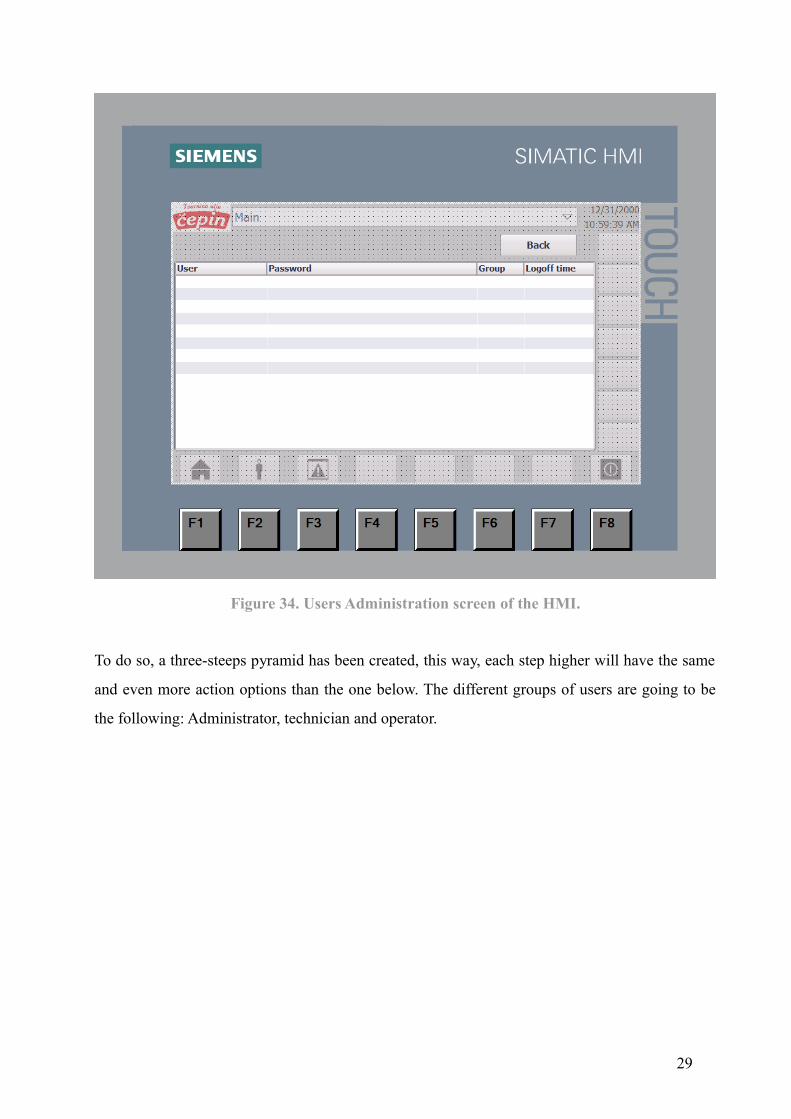
Figure 34. Users Administration screen of the HMI.
To do so, a three-steeps pyramid has been created, this way, each step higher will have the same
and even more action options than the one below. The different groups of users are going to be
the following: Administrator, technician and operator.
29
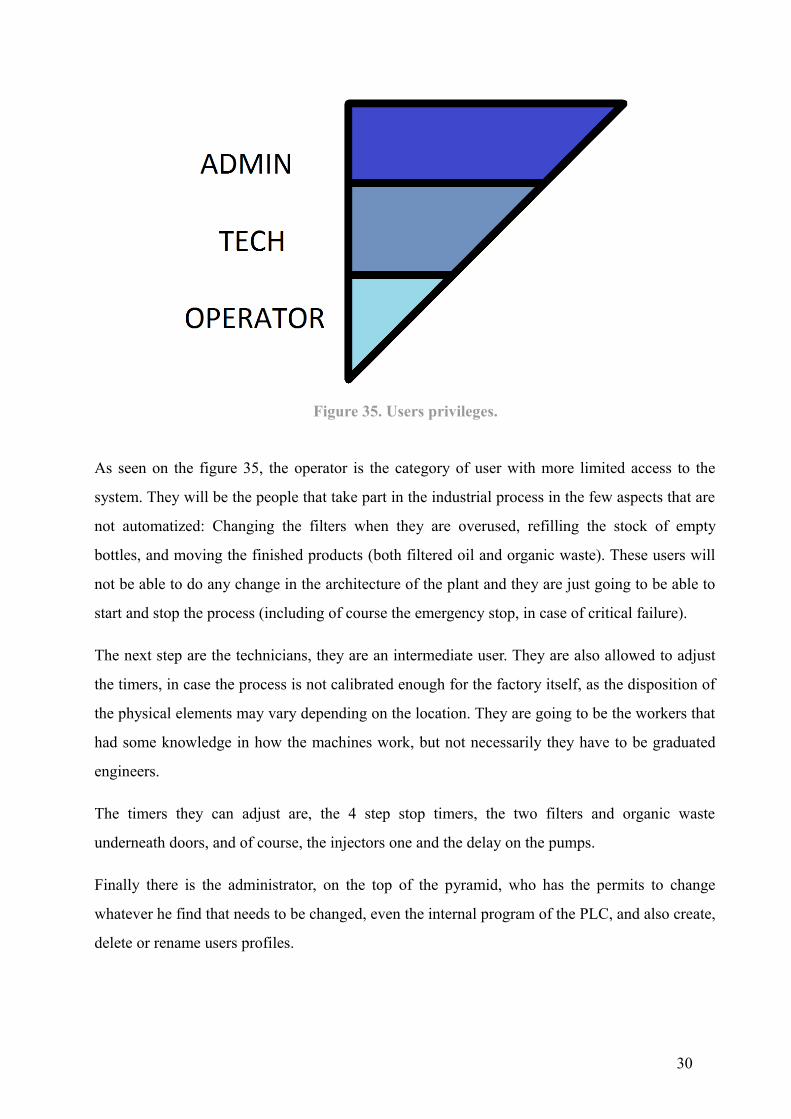
Figure 35. Users privileges.
As seen on the figure 35, the operator is the category of user with more limited access to the
system. They will be the people that take part in the industrial process in the few aspects that are
not automatized: Changing the filters when they are overused, refilling the stock of empty
bottles, and moving the finished products (both filtered oil and organic waste). These users will
not be able to do any change in the architecture of the plant and they are just going to be able to
start and stop the process (including of course the emergency stop, in case of critical failure).
The next step are the technicians, they are an intermediate user. They are also allowed to adjust
the timers, in case the process is not calibrated enough for the factory itself, as the disposition of
the physical elements may vary depending on the location. They are going to be the workers that
had some knowledge in how the machines work, but not necessarily they have to be graduated
engineers.
The timers they can adjust are, the 4 step stop timers, the two filters and organic waste
underneath doors, and of course, the injectors one and the delay on the pumps.
Finally there is the administrator, on the top of the pyramid, who has the permits to change
whatever he find that needs to be changed, even the internal program of the PLC, and also create,
delete or rename users profiles.
30

Each user will be part of one of these three groups, will have a specific name, and a personal
password. Every time they log in or log off, it will be recorded in the memory of the system. This
way, if something wrong happens during the production process, such as a unnecessary and long
pause in the factory or a problem with a machine, the administrator or the manager will be able
to know who was working in that specific moment.
31
4.CONCLUSION
After a month of reading manuals and doing programming tests, the right level of knowledge
was reached and that was when the project started to take shape by selecting the components and
planing the industrial process. After contacting via email a production manager, the sunflower oil
factory located in Cepin was also visited, which was useful at the time of designing the
disposition of sensors and machines.
An intuitive display has been created for the HMI screens.
The project leaves open the door to further enlargements, thanks to its physical modules, unused
pins, and extra indicators in the visualization.
To sum up, even not being a professional material, the results, which could be implemented in a
small scale factory, have been satisfactory.
32
5.BIBLIOGRAPHY
[1] Jon Stenerson, David Deeg; Siemens Step 7 (TIA Portal) Programming, a Practical
Approach, 978-1515220541, 2015.
[2] Pilar Mengual; STEP 7: Una Manera Fácil de Programar PLC de Siemens, 978-8426715005,
2009.
[3] Enrique Mandado; Autómatas Programables y Sistemas de Automatización, 978-8426715753
2009.
[4] Hui Y. H; Bailey's Industrial Oil and Fat Products. Edible Oil and Fat Products. 2011
[5] F. D. Gunstone; Vegetable Oils in Food Technology: Composition, Properties, and Uses, 0-
8493-2816-0, 2002.
[6] Dimitrios Boskou; Sunflower Oil: Chemistry and Technology, Contributor American Oil
Chemists Society, 1-893997-88-X , 2006.
[7] Geoliano Salvatore; Manual básico de configuración TIA PORTAL V13, 2016.
[8] S7ProSim V5.4 Operating Manual, A5E00992430-02, 2011.
[9] Automation License Manager Programming and Operating Manual, A5E32921785-AC,
2014.
33
6.ABSTRACT
Title: SIMATIC regulation of an oil factory.
The aim of this bachelor thesis was to learn how TIA portal works and to configure a PLC and
it's system, to regulate automatically the production of sunflower oil in a plant, using the cold
press method, which provides to the oil with the best quality. An HMI display of 9 screens was
also created, allowing interaction between the system and the operators in the factory by a
PROFINET connection.
Key words: Automatic regulation, TIA portal, sensors, sunflower oil.
34
7. BIOGRAPHY
Carles Miró Gisbert was born on August 9, 1994 in Barcelona. He finished high school in
Badalona and then enrolled in the School of Engineering of Eastern Barcelona (EEBE) of the
UPC University, to attend the electronic and automation bachelor. The second semester of the
course 2016-17 he joined FERIT faculty in Osijek, where he did his final project.
35