
Simagent Final report 5 Transims Matsim partial edits … Final report 5... ·...
49
May 18, 2012 1 SimAGENT TRANSIMS &MATSIM 5 TRANSIMS and MATSIM Experiments in SimAGENT Konstadinos G. Goulias, Nathanael A. Isbell, Daimin Tang, Michael Balmer, Yali Chen, Chandra Bhat, and Ram Pendyala May 18, 2012 Phase 2 Report Submitted to GeoTrans Laboratory, 1832 Ellison Hall, University of California Santa Barbara, Santa Barbara, 931064060
Transcript of Simagent Final report 5 Transims Matsim partial edits … Final report 5... ·...
TRANSIMS and MATSIM Experiments in SimAGENT May 18, 2012
1
SimAGENT TRANSIMS &MATSIM 5
08 Fall
TRANSIMS and MATSIM Experiments in SimAGENT
Konstadinos G. Goulias, Nathanael A. Isbell, Daimin Tang,
Michael Balmer, Yali Chen, Chandra Bhat, and Ram Pendyala
May 18, 2012
Phase 2 Report Submitted to
G e o T r a n s L a b o r a t o r y , 1 8 3 2 E l l i s o n H a l l , U n i v e r s i t y o f C a l i f o r n i a S a n t a B a r b a r a , S a n t a B a r b a r a , 9 3 1 0 6 -‐ 4 0 6 0
TRANSIMS and MATSIM Experiments in SimAGENT May 18, 2012
2
TRANSIMS AND MATSIM EXPERAMENTS IN SIMAGENT
Table of Contents
PREFACE 3
1. SOFTWARE OVERVIEW 4 TRANSIMS 4 MATSIM 5 TRANSIMS AND MATSIM 6
2. METHODOLOGY 7 PREPARATION 7 ROAD NETWORK PREPARATION 10 TRANSIT NETWORK PREPARATION 10 MATSIM ACTIVITY DATA PREPARATION 13
3. TRANSIMS PROCESS 24
4. MATSIM PROCESS 29
5. RESULTS 32 CONCLUSION 35
6. FURTHER RESEARCH 35
7. REFERENCES AND CITATIONS 49

TRANSIMS and MATSIM Experiments in SimAGENT May 18, 2012
3
PREFACE In this report we present a comparison of the TRANSIMS and MATSIM microsimulation
software for SimAGENT. TRANSIMS and MATSIM use the output of SimAGENT’s
CEMDAP module as the input data to drive their dynamic assignment microsimulations.
This report discusses the simulation frameworks of both TRANSIMS and MATSIM and
the resulting simulation results. The SCAG 4-step (static assignment) model is compared
with the results from both modeling environments. Mean link volumes and paired
samples t-tests are used for the comparisons. Most of the TRANSIMS work was done by
Daimin Tang with help for Yali Chen and Karthik Konduri for Arizona State University.
Most of the MATSIM work was done by Michael Balmer of senozon through a contract
with UCSB and Nate Isbell. We selected this type of input and comparison with the four
step model because we will perform a similar exercise with a subcontract with Yi-Chiang
Chu using DynusT by June 2012. The experience documented here will help us decided
on the most appropriate method for traffic assignment and interface with emissions
predicting software.
TRANSIMS and MATSIM Experiments in SimAGENT May 18, 2012
4
1. SOFTWARE OVERVIEW
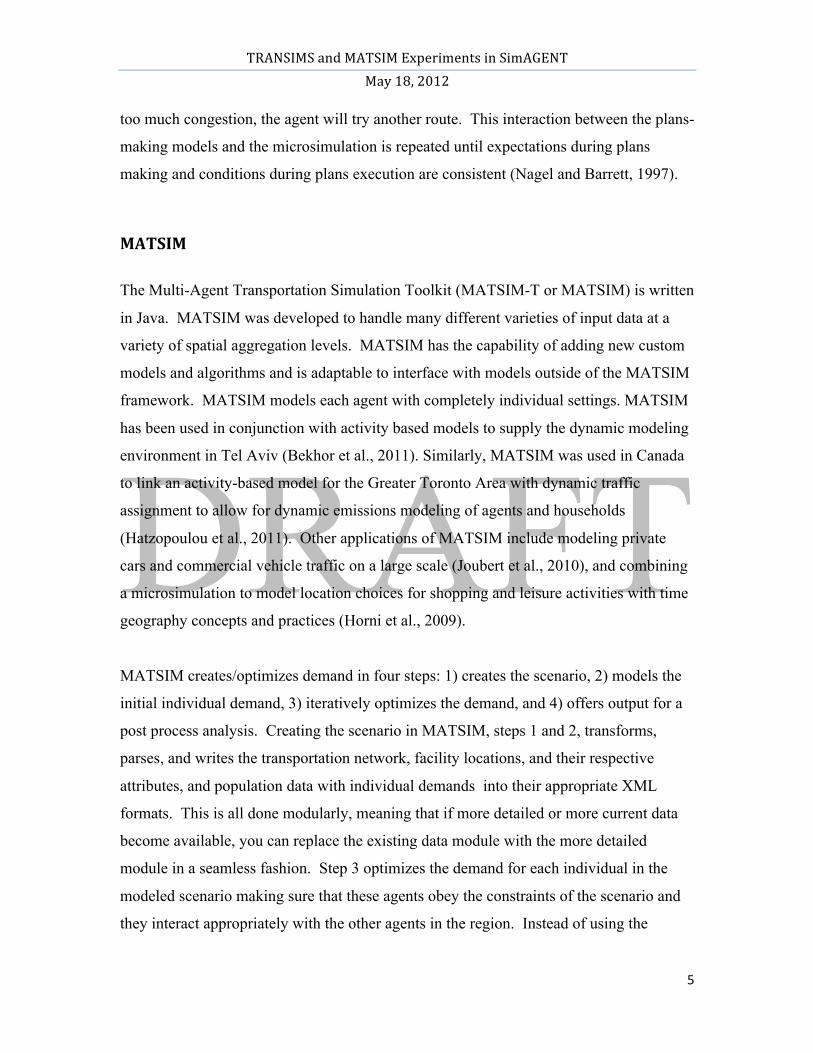
TRANSIMS The Transportation Analysis SIMulation System (TRANSIMS) is a microsimulation
package that attempts to model all transportation related aspects of human behavior
(Nagel et al., 1999). Historically, the amount of data needed and computational
requirements to execute such a model have limited the applications of such
microsimulations in large regions. TRANSIMS has been used in many transportation
studies including, signal timing in Chicago, Illinois (Chang and Ziliaskopoulos, 2003),
and the Portland, Oregon area transportation network (Barrett et al. 2002).
TRANSIMS uses transportation infrastructure, demographic, land-use, and human
decision making data to generate a realistic model of traffic and congestion. TRANSIMS
represents road design in a microscopic manner, as well as, incorporating such things as
the number of lanes, controlled intersections, as well as other traffic control details. Each
agent in TRANSIMS represents a person in the real world. These agents operate on the
transportation network making plans about what to do throughout the modeled day.
Agents can also choose different travel modes. Once the network is defined, agents have
travel plans and are assigned transportation modes. The router in TRANSIMS decides
what transportation links to utilize for each trip for each agent. This routing is done by
implementing a version of Dijkstra’s shortest path algorithm that has regular language
constraints and solves problems with time-dependent edge delays using a general first-in-
first-out model (Barrett et al., 2002). This is an iterative process that allows for re-
planning because the routes are simulated by determining optimal mode choices based on
the demographic and geographic characteristics of the population, forward causality is
artificially introduced. In order to bring the system to a “relaxed state” TRANSIMS
implements re-planning. Link delays observed in the simulation are sent to the route
planner to iteratively re-plan a fraction of the agents. For example, if an agent runs into
TRANSIMS and MATSIM Experiments in SimAGENT May 18, 2012
5
too much congestion, the agent will try another route. This interaction between the plans-
making models and the microsimulation is repeated until expectations during plans
making and conditions during plans execution are consistent (Nagel and Barrett, 1997).
MATSIM
The Multi-Agent Transportation Simulation Toolkit (MATSIM-T or MATSIM) is written
in Java. MATSIM was developed to handle many different varieties of input data at a
variety of spatial aggregation levels. MATSIM has the capability of adding new custom
models and algorithms and is adaptable to interface with models outside of the MATSIM
framework. MATSIM models each agent with completely individual settings. MATSIM
has been used in conjunction with activity based models to supply the dynamic modeling
environment in Tel Aviv (Bekhor et al., 2011). Similarly, MATSIM was used in Canada
to link an activity-based model for the Greater Toronto Area with dynamic traffic
assignment to allow for dynamic emissions modeling of agents and households
(Hatzopoulou et al., 2011). Other applications of MATSIM include modeling private
cars and commercial vehicle traffic on a large scale (Joubert et al., 2010), and combining
a microsimulation to model location choices for shopping and leisure activities with time
geography concepts and practices (Horni et al., 2009).
MATSIM creates/optimizes demand in four steps: 1) creates the scenario, 2) models the
initial individual demand, 3) iteratively optimizes the demand, and 4) offers output for a
post process analysis. Creating the scenario in MATSIM, steps 1 and 2, transforms,
parses, and writes the transportation network, facility locations, and their respective
attributes, and population data with individual demands into their appropriate XML
formats. This is all done modularly, meaning that if more detailed or more current data
become available, you can replace the existing data module with the more detailed
module in a seamless fashion. Step 3 optimizes the demand for each individual in the
modeled scenario making sure that these agents obey the constraints of the scenario and
they interact appropriately with the other agents in the region. Instead of using the

TRANSIMS and MATSIM Experiments in SimAGENT May 18, 2012
6
“relaxed” state like TRANSIMS uses for route choice described by the Wardrop
equilibrium, MATSIM optimizes the complete daily plan (routes, times, locations,
sequence of activities, activity types, etc.) of each agent. This is done by maximizing
each agent’s daily utility, depending on infrastructural constraints (i.e. capacity of links,
opening times, of businesses, etc.) and the plans of other agents in the simulation.
Therefore, the utility of any given daily plan can only be determined by the interaction of
all agents in the simulation. This is done by implementing a co-evolutionary algorithm
(see Balmer et al., 2009). A traffic flow simulation model handles the daily plans and
agent interactions. Plans with high utility scores will remain while plans with low scores
are removed (Balmer et al., 2009).
TRANSIMS AND MATSIM MATSIM differs from TRANSIMS in a number of areas. First, agents in MATSIM
completely contain their individual attributes and data throughout the modeling process.
This allows for agents to access demographic characteristics or time pressure while that
agent is moving about the network. TRANSIMS stores this type of data amongst many
modules and files. Secondly, MATSIM utilizes XML for network and agent input and
output data. This allows for files to contain different levels of data, and insures that the
same file format is used throughout agent data exchange between modules. This means
that arbitrary modules can be joined to supply agent information. Conversely,
TRANSIMS implicitly gives the module’s capabilities by the file formats. Furthermore,
MATSIM requires only one document type definition (DTD or schema) for all agent data
files. Finally, because of the MATSIM agent design, it is relatively easy to store multiple
plans for each agent. This allows for the iterative part of MATSIM to be much more
easily interpreted as a co-evolutionary algorithm in which every agent draws on the
population of plans to find more optimal solutions.
TRANSIMS and MATSIM Experiments in SimAGENT May 18, 2012
7
2. METHODOLOGY
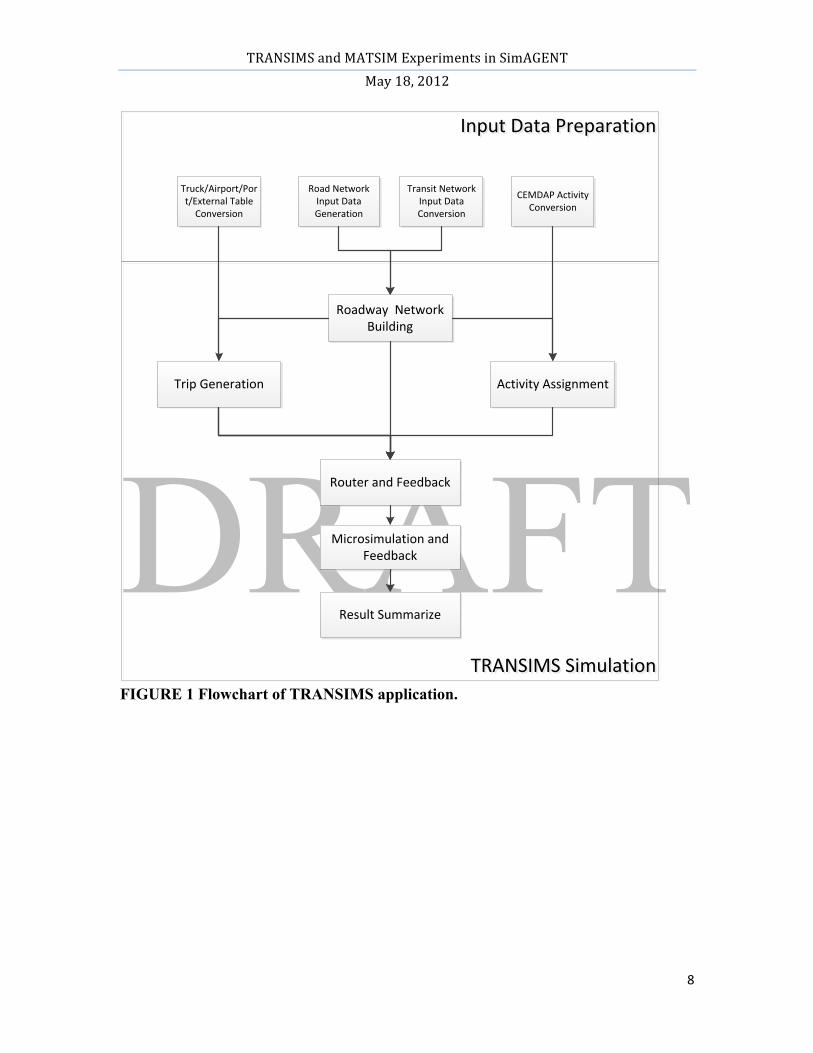
PREPARATION The entire TRANSIMS application flow chart is shown in Figure 1. The MATSIM flow
chart in Figure 2. They are divided into two parts, data preparation and the model
simulation. For both TRANSIMS and MATSIM, synthetic schedules are provided by the
CEMDAP module of SimAGENT. The rest of the traffic contributors in the region
(trucks, port/airport traffic, and external traffic) are provided as OD matrices.
TRANSIMS and MATSIM Experiments in SimAGENT May 18, 2012
8
TRANSIMS SimulationTRANSIMS Simulation
Input Data PreparationInput Data Preparation
Road Network Input Data Generation
Transit Network Input Data Conversion
Truck/Airport/Port/External Table Conversion
CEMDAP Activity Conversion
Roadway Network Building
Router and Feedback
Microsimulation and Feedback
Result Summarize
Trip Generation Activity Assignment
FIGURE 1 Flowchart of TRANSIMS application.

TRANSIMS and MATSIM Experiments in SimAGENT May 18, 2012
9
FIGURE 2 Flowchart For MATSIM Application. TRANSIMS and MATSIM input data includes: the SCAG road network, transit network,
activity schedules of the SCAG residents, and truck/airport/port/external trips in TAZ to
TAZ Origin-Destination (OD) matrices from the SCAG four-step model. Roadway and
transit networks come from SCAG regional transportation planning package. Daily
activity data of people are the output from Comprehensive Econometric Microsimulator
of Daily Activity-travel Patterns (CEMDAP) module and truck/airport/port/external trips
TRANSIMS and MATSIM Experiments in SimAGENT May 18, 2012
10
are from traditional four-step traffic demand model that was used for the 2008 regional
transportation plan. All data were converted to the TRANSIMS input format using C# in
Visual Studio 2010. Data were converted to the MATSIM input format using Java.
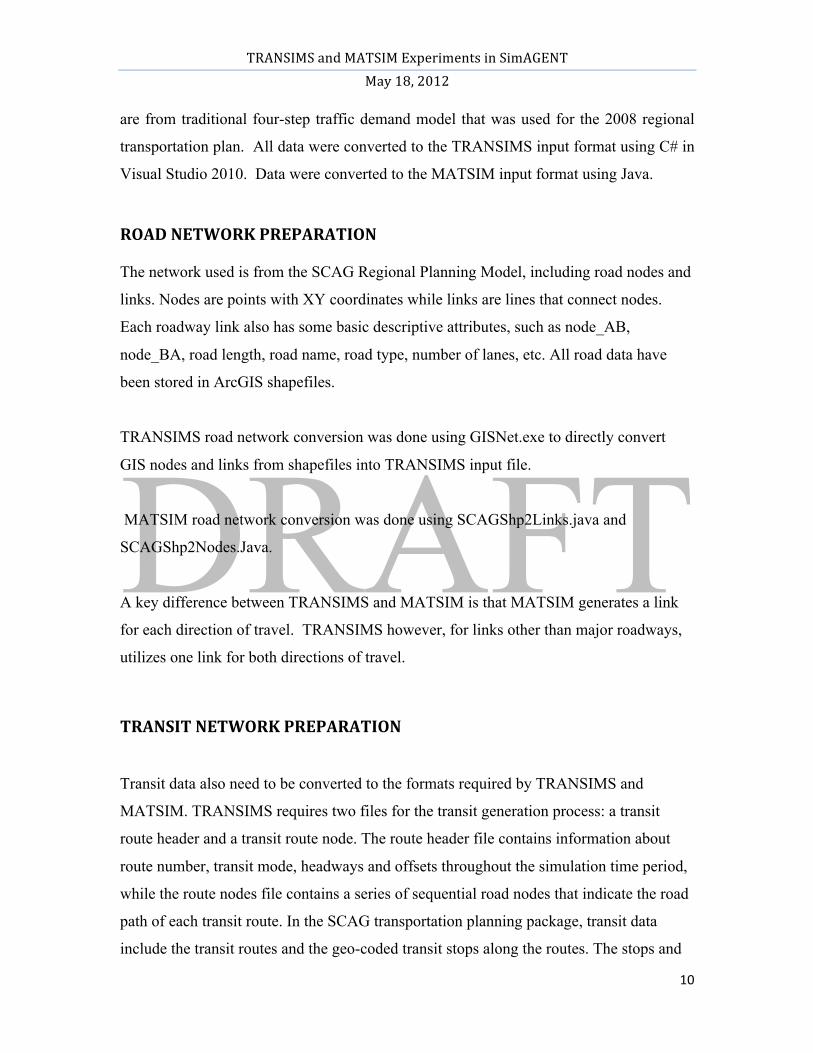
ROAD NETWORK PREPARATION The network used is from the SCAG Regional Planning Model, including road nodes and
links. Nodes are points with XY coordinates while links are lines that connect nodes.
Each roadway link also has some basic descriptive attributes, such as node_AB,
node_BA, road length, road name, road type, number of lanes, etc. All road data have
been stored in ArcGIS shapefiles.
TRANSIMS road network conversion was done using GISNet.exe to directly convert
GIS nodes and links from shapefiles into TRANSIMS input file.
MATSIM road network conversion was done using SCAGShp2Links.java and
SCAGShp2Nodes.Java.
A key difference between TRANSIMS and MATSIM is that MATSIM generates a link
for each direction of travel. TRANSIMS however, for links other than major roadways,
utilizes one link for both directions of travel.
TRANSIT NETWORK PREPARATION
Transit data also need to be converted to the formats required by TRANSIMS and
MATSIM. TRANSIMS requires two files for the transit generation process: a transit
route header and a transit route node. The route header file contains information about
route number, transit mode, headways and offsets throughout the simulation time period,
while the route nodes file contains a series of sequential road nodes that indicate the road
path of each transit route. In the SCAG transportation planning package, transit data
include the transit routes and the geo-coded transit stops along the routes. The stops and

TRANSIMS and MATSIM Experiments in SimAGENT May 18, 2012
11
route lines are associated by their route IDs. However, the routes and stops are not
attached to the SCAG road network so that they cannot be directly converted to route
node file and used in TRANSIMS application. According to this, identifying the road
links and nodes that transit routes are laid on is the key approach to transit - network
integration. Figure 3 below shows the major conversion steps in the process.
3-1 3-2
3-3 3-4 FIGURE 3 Transit Route Conversion. In preparation for generating transit input data, we use ArcGIS software with spatial join
method for this process. In figure 3-1, the red lines are the transit routes. We select one
bus route from the transit route file as an example. First, we add the road nodes and links
to the map so the link, node and route could lay on each other shown in figure 3-2.
Second, we use the spatial join tool to join the nodes and routes together in order to find
all the roadway nodes which are intersected with the route. After that, as shown in 3-3,
we can find a collection of node points associated with each transit route. However, all
the nodes are not in the right sequence. As we know, the transit route is a polyline file, in
which each route is composed by a series of line segments, and they are connected by
points so that the points of each route line are in the right sequence from start to the end.
According to this, as shown in 3-4, we split and convert each route line to a series of
sequential points and use spatial join tool again to find the nearest route line point of each
TRANSIMS and MATSIM Experiments in SimAGENT May 18, 2012
12
road node which we should have found in the last step in order to obtain the right order of
network nodes.
With the way we converted the network above, the transit route node file is ready for
TRANSIMS. In addition, transit route header file also needs to be converted from the
SCAG transit route file. In SCAG application, we include ROUTE, NAME, MODE,
TTIME, HEADWAY, and OFFSET in route header file. If the transit network includes
guideways, their links and nodes should exist in the network Node and Link files prior to
starting the transit conversion process. In our SCAG region study, we included all the
transit links and connection links in the input link file which served as input to the
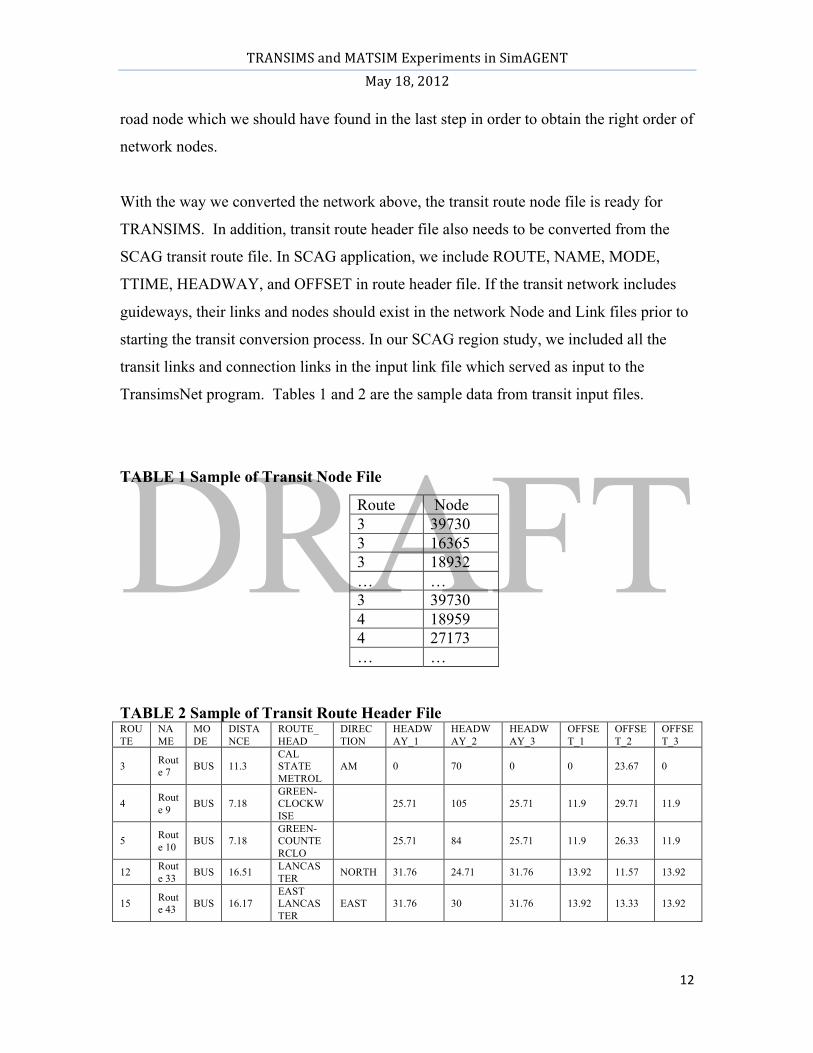
TransimsNet program. Tables 1 and 2 are the sample data from transit input files.
TABLE 1 Sample of Transit Node File
Route Node 3 39730 3 16365 3 18932 … … 3 39730 4 18959 4 27173 … …
TABLE 2 Sample of Transit Route Header File ROUTE
NAME
MODE
DISTANCE
ROUTE_HEAD
DIRECTION
HEADWAY_1
HEADWAY_2
HEADWAY_3
OFFSET_1
OFFSET_2
OFFSET_3
3 Route 7 BUS 11.3
CAL STATE METROL
AM 0 70 0 0 23.67 0
4 Route 9 BUS 7.18
GREEN-CLOCKWISE 25.71 105 25.71 11.9 29.71 11.9
5 Route 10 BUS 7.18
GREEN-COUNTERCLO 25.71 84 25.71 11.9 26.33 11.9
12 Route 33 BUS 16.51 LANCAS
TER NORTH 31.76 24.71 31.76 13.92 11.57 13.92
15 Route 43 BUS 16.17
EAST LANCASTER
EAST 31.76 30 31.76 13.92 13.33 13.92
TRANSIMS and MATSIM Experiments in SimAGENT May 18, 2012
13
After all these preparatory steps, TRANSIMS transit related network files can be
generated by its transit tools called TransitNet which will be discussed later in the
methodology section.
MATSIM also requires the transit network (links and nodes) and schedule. These are
created from the SCAG data using PtNetworkParser.java and
TransitScheduleCreator.java. MATSIM has encountered some problems using the
converted network from the spatial join. Creating a transit network that places traffic on
to the network created in the road network preparation step has not been achieved.
Currently transit is modeled on its own network that does not interact with the road
network. Efforts are currently underway to resolve this issue and requires additional
work beyond the TRANSIMS tasks.
MATSIM ACTIVITY DATA PREPARATION
The daily travel activities of each person in each household come from the new version
of the Comprehensive Econometric Microsimulator of Daily Activity-travel Patterns
(CEMDAP) model dated March 2011. CEMDAP is used as the modeling engine that
simulates activity-travel patterns of all individuals in the region for a 24 hour period
along a continuous time axis. The CEMDAP model provides a series of data about daily
activities, including simulated person, tours, activity stops during a day and vehicles used
by households. The person data contain all the characteristics of synthetic persons: age,
gender, work status, age, and so forth. The tour table gives the duration, number of stops,
and travel mode of each tour. The activity stop file contains the stops of each activity of
each person. For each activity stop record, there is a start time, travel time, travel
duration, travel mode (drive alone, share ride passenger, share ride driver, walk, transit,
and any other data required by the users), type of activity (shopping, social/recreation,
personal business, eat out, and any other activity types included in the specific
application), traffic analysis zone (TAZ) of origin, TAZ of destination, distance, etc.
TRANSIMS and MATSIM Experiments in SimAGENT May 18, 2012
14
Vehicles are stored for each household and their records contain household id, vehicle id
specific to each household, make, body type, years in use, primary driver for the
household, annual mileage, etc.
Table 3 shows the activity file information. The conversion of activity stop and vehicle
files from CEMDAP output to the TRANSIMS format is done in the following way.
Vehicles should be converted first because the activity files are associated with vehicles
under conversion. According to the TRANSIMS vehicle format, new ID of each vehicle
is coded by combining the household id with the vehicle id. For example, if the vehicle id
is “01” and the household id is “2002”, the new vehicle id would be “200201”. Next the
CEMDAP stops file is converted to the TRANSIMS activity file. There are two steps for
the complete conversion, a data format conversion and activity location assignment.
Since TRANSIMS requires that all activities start from the beginning of the day and
CEMDAP activities start from the first activity when traveling outside, a home activity
for each person is added before the conversion. During the format conversion process,
only the useable information for the TRANSIMS activity file is kept. Most data fields are
the same or similar between TRANSIMS and CEMDAP and they are converted based on
the corresponding data fields such as household id, person id, purpose, trip start time, end
time, duration. For travel mode, CEMDAP model uses “Drive Alone”, “Share Ride
Passenger”, “Share Ride Driver”, “Walk”, “Transit” and “School Bus”. While in
TRANSIMS, travel mode is categorized as “Walk”, “Drive”, “Bus”, “Rail”, “Park-&-
Ride Outbound”, “Park-&-Ride Inbound”, “Bicycle”, “Magic Move”, “School Bus”, “2
Person Carpool”, “3 Person Carpool”, “4 Person Carpool”, “Kiss-&-Ride Outbound”,
“Kiss-&-Ride Inbound.” In addition, the MATSIM modes are “car”, “ride”, “walk”, “pt”,
“driven by parent”, “driven by other”, “driven by school bus”, and “shared ride driver”.
The correspondent mode pairs in Table 4 for travel are used for the travel mode
conversion.

TRANSIMS and MATSIM Experiments in SimAGENT May 18, 2012
15
TABLE 3 CEMDAP output Variables Column No Variable Name Variable Description
1 HID Household identification number 2 PID Person identification number 3 TID Tour identification number 2 4 SID Stop identification number 5 ActType Activity type at the current stop 6 StartT Start time of travel to the stop (minutes from 3 a.m.) 7 TravelT Travel time to stop (minutes) 8 Duration Stop duration (minutes) 9 ZoneID Stop location (zone) identification number
10 OZoneID Previous (origin) stop location (zone) identification number 11 Distance Trip distance (miles, calculated as zone to zone centroid distance) 12 PActType Activity type at the previous stop 13 ArriveT StartT + TravelT 14 StartT15 Start time of travel to the stop (nth 15-minute interval from 3 am) 15 HmStayDu Home/work stay duration before tour (minutes) 16 Mode Tour mode 17 Tourdun Tour duration (minutes) 18 N_stops Number of stops in tour 19 IsWorker 1 if adult goes to work on that day, 0 otherwise 20 MakeWrel 1 if adult undertakes work-related activity, 0 otherwise 21 MakeDrop 1 if adult drops-off children at school, 0 otherwise 22 MakePick 1 if adult picks-up children from school, 0 otherwise 23 MakeJDis 1 if adult undertakes joint discretionary activities with children, 0 otherwise 24 MakeShop 1 if adult undertakes shopping activity, 0 otherwise 25 MakePers 1 If adult undertakes household/personal business activity, 0 otherwise 26 MakeSoc 1 if adult undertakes social/recreational activity, 0 otherwise 27 MakeEatOut 1 if adult undertakes eat-out activity, 0 otherwise 28 MakeServe 1 if adult undertakes other serve-passenger activity, 0 otherwise 29 AdultChild 1 if adult, 2 if child 30 IsSch 1 if child goes to school on that day, 0 otherwise 31 MakeIDis 1 if child undertakes independent discretionary activities, 0 otherwise 32 NonSch_Tours MakeJDis + MakeIDis 33 WrkStart Work/school start time (minutes from 3 a.m.) 34 WrkEnd Work/school end time (minutes from 3 a.m.) 35 NumBW Number of before-work tours 36 NumWB Number of work-based tours 37 NumAW Number of after-work tours 38 Works 1 if worker 39 NumToursWork NumBW + NumWB + NumAW 40 WrkStart15 WrkStart into 15 minute intervals (e.g., I if 3:00-3:15 AM , 2 if 3:15-30) 41 WrkEnd15 WrkEnd into 15 minute intervals 42 N_tour Total number of tours made 43 Nonwork 1 if nonworker 44 SchStart School start time (minutes from 3 a.m.) 45 SchEnd School end time (minutes from 3 a.m.) 46 DropSch 1 if child gets dropped off at school by parent, 0 otherwise 47 PickSch 1 if child gets picked up from school by parent, 0 otherwise 48 ChildStu 1 if child student 49 SchStart15 SchStart into 15 minute intervals 50 SchEnd15 SchEnd into 15 minute intervals 51 Worker 1 if works=1 or childstu = 1 52 NonWorker 1 if nonwork=1 or IsSch = 0 53 N_Act_Stops N_stops - 1 54 Activity ActType 55 PActivity PActType 56 TripTypeB
57 TripType 1 if Adult and TripTypeB =1, 2 if (Child and TripTypeB=1 ) or TripTypeB=2, 3 if TripTypeB=3
62 Mode_new DA = 1, SR_driver = 2, SR_pass = 3, Walk = 4, Transit = 5, Schbus = 6

TRANSIMS and MATSIM Experiments in SimAGENT May 18, 2012
16
Table 4 Travel Mode Conversion Travel Mode Conversion CEMDAP TRANSIMS MATSIM Drive Alone Drive car Share Ride Passenger 2/3/4 Person Carpool ride Share Ride Driver 2/3/4 Person Carpool ride Walk Walk walk Transit BUS pt School Bus School Bus ride
In the second step, each activity in TRANSIMS is assigned to an exact location where it
happens, otherwise people cannot be routed on the network. However, activities in the
CEMDAP model are at the zonal level. People travel from the centroid of one
transportation analysis zone (TAZ) to another, which means trips within a TAZ all start
from the same location to another. Therefore, an activity assignment approach has been
done to distribute trips starting from different activity locations within each zone. The
approach of activity assignment is based on a random assignment method. First, all the
activity locations generated by TRANSIMS are sorted by TAZ. Second, activity records
are read once per household. For each person in the household, we assume the locations
of their first activities which we added at the conversion step are home activities. For all
activities, random locations are chosen within the respective zones and set as that
household’s location. Third, after all trips of one household are assigned to the network,
some locations need to be updated. There are two situations in which the locations need
to be updated: First, if the last activity of a person ends in the same zone as its first home
activity, it is assumed that it is a “back home” activity and change its location to the home
location. Second, the locations of those passengers who travel together are updated along
with the number of passengers in passenger field. After assigning all the trips to the
TRANSIMS and MATSIM Experiments in SimAGENT May 18, 2012
17
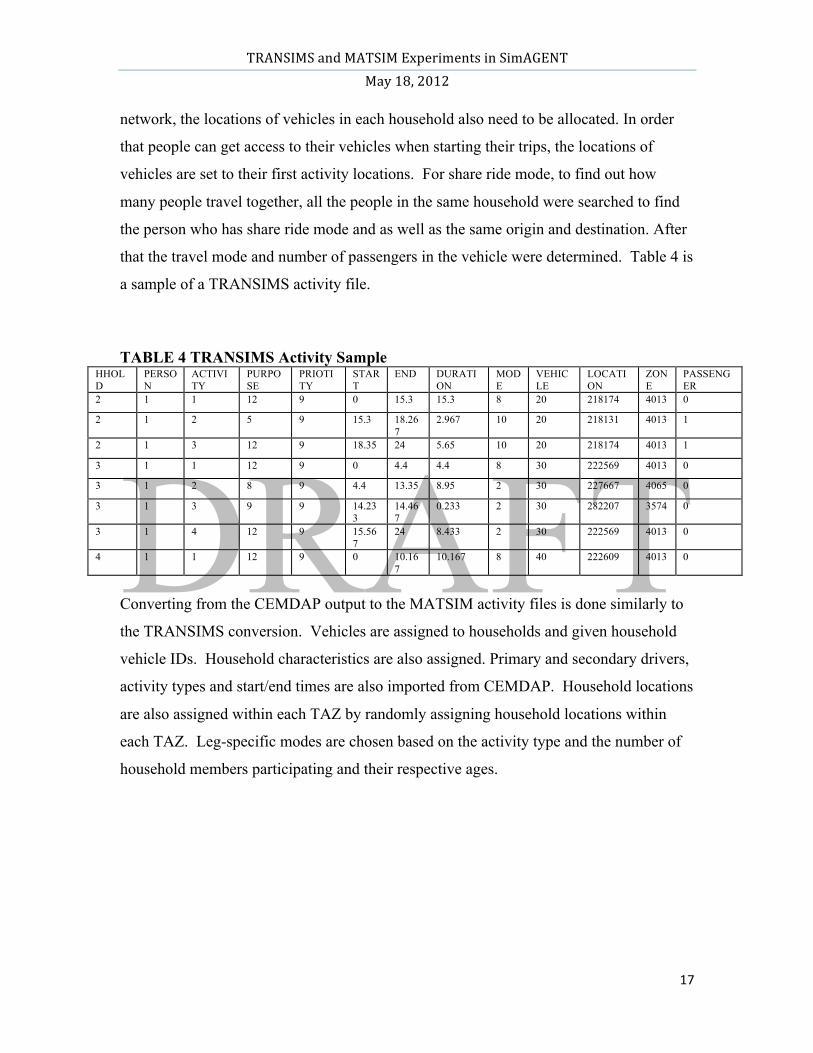
network, the locations of vehicles in each household also need to be allocated. In order
that people can get access to their vehicles when starting their trips, the locations of
vehicles are set to their first activity locations. For share ride mode, to find out how
many people travel together, all the people in the same household were searched to find
the person who has share ride mode and as well as the same origin and destination. After
that the travel mode and number of passengers in the vehicle were determined. Table 4 is
a sample of a TRANSIMS activity file.
TABLE 4 TRANSIMS Activity Sample
HHOLD
PERSON
ACTIVITY
PURPOSE
PRIOTITY
START
END DURATION
MODE
VEHICLE
LOCATION
ZONE
PASSENGER
2 1 1 12 9 0 15.3 15.3 8 20 218174 4013 0
2 1 2 5 9 15.3 18.267
2.967 10 20 218131 4013 1
2 1 3 12 9 18.35 24 5.65 10 20 218174 4013 1
3 1 1 12 9 0 4.4 4.4 8 30 222569 4013 0
3 1 2 8 9 4.4 13.35 8.95 2 30 227667 4065 0
3 1 3 9 9 14.233
14.467
0.233 2 30 282207 3574 0
3 1 4 12 9 15.567
24 8.433 2 30 222569 4013 0
4 1 1 12 9 0 10.167
10.167 8 40 222609 4013 0
Converting from the CEMDAP output to the MATSIM activity files is done similarly to
the TRANSIMS conversion. Vehicles are assigned to households and given household
vehicle IDs. Household characteristics are also assigned. Primary and secondary drivers,
activity types and start/end times are also imported from CEMDAP. Household locations
are also assigned within each TAZ by randomly assigning household locations within
each TAZ. Leg-specific modes are chosen based on the activity type and the number of
household members participating and their respective ages.
TRANSIMS and MATSIM Experiments in SimAGENT May 18, 2012
18
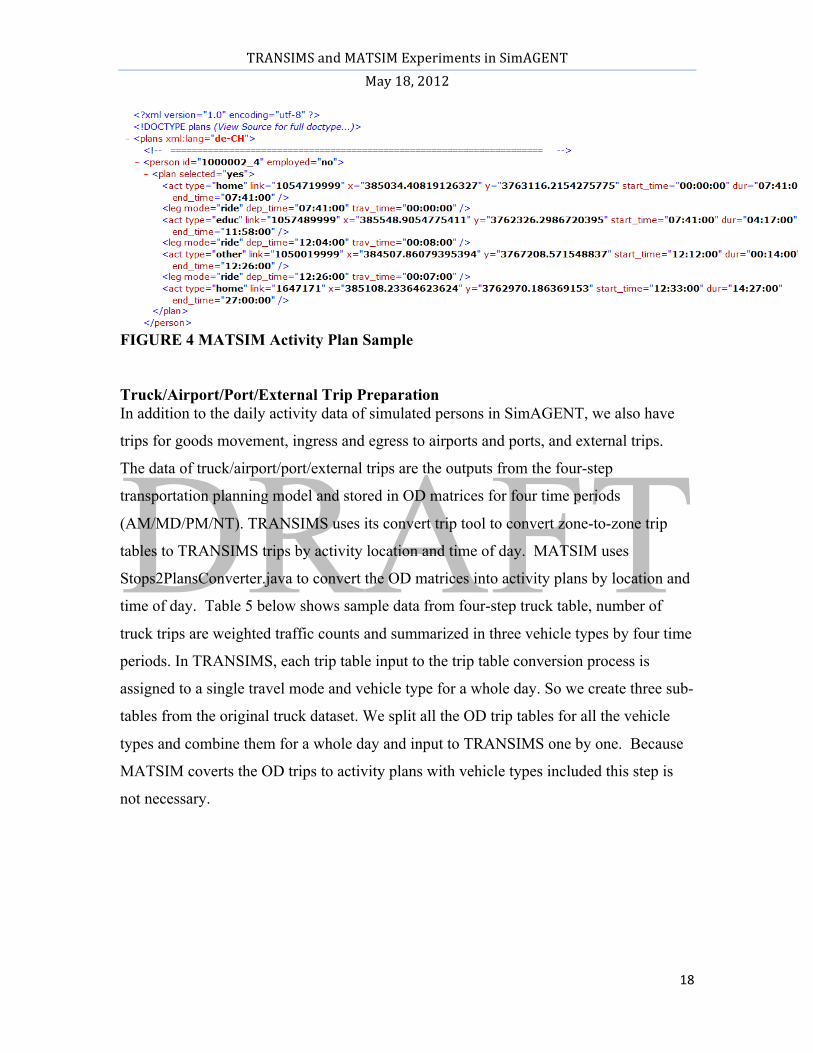
FIGURE 4 MATSIM Activity Plan Sample Truck/Airport/Port/External Trip Preparation In addition to the daily activity data of simulated persons in SimAGENT, we also have
trips for goods movement, ingress and egress to airports and ports, and external trips.
The data of truck/airport/port/external trips are the outputs from the four-step
transportation planning model and stored in OD matrices for four time periods
(AM/MD/PM/NT). TRANSIMS uses its convert trip tool to convert zone-to-zone trip
tables to TRANSIMS trips by activity location and time of day. MATSIM uses
Stops2PlansConverter.java to convert the OD matrices into activity plans by location and
time of day. Table 5 below shows sample data from four-step truck table, number of
truck trips are weighted traffic counts and summarized in three vehicle types by four time
periods. In TRANSIMS, each trip table input to the trip table conversion process is
assigned to a single travel mode and vehicle type for a whole day. So we create three sub-
tables from the original truck dataset. We split all the OD trip tables for all the vehicle
types and combine them for a whole day and input to TRANSIMS one by one. Because
MATSIM coverts the OD trips to activity plans with vehicle types included this step is
not necessary.

TRANSIMS and MATSIM Experiments in SimAGENT May 18, 2012
19
TABLE 5 Sample of AM Truck Trip Table
From To Light Truck
Medium Truck
Heavy Truck
1 1 6.37 3.23 0.02 … … 1 4114 0.02 0.21 0.4 … … 131 502 0.01 0.01 0.01 … …
TABLE 6 Converted All Day Truck Trip Tables
From To Heavy Truck From To Light
Truck From To Medium Truck
1 1 0.06 1 1 13.78 1 1 8.26 … … … … … … … 1 4114 1.38 1 4114 0.05 1 4114 0.54 … … … … … … … 131 502 0.05 131 502 0.01 131 502 0.02 … … … … … … … …
Since the TRANSIMS and MATSIM model trips on a second-by-second basis, the trips
included in the input trip tables and activity plans need to be distributed to a specific time
of day. TRANSIMS requires a diurnal distribution file with each trip table. Diurnal
distribution files are text files with at least three data fields (start time, end time, and one
or more distribution fields). The first two columns of the file define the starting and
ending time of the time period. The third column contains a number that represents the
time period’s share of trips. The values represent the relative probability of a trip within
the time period given the sum of all values in the distribution. MATSIM applies these
distributions in the activity plan generation step described above.
The first step is to get the percentage of trips travelled in each time period by simply
adding trips among TAZs and divided by total numbers for the whole day. Then we use a
tool called SmoothData.exe in TRANSIMS package to distribute the proportion of trips
shared in four time periods into 15-minutes intervals. Table 7 shows the proportion of
vehicle trips in each time period for light trucks. Figure 5 shows an example of the
diurnal distribution.

TRANSIMS and MATSIM Experiments in SimAGENT May 18, 2012
20
TABLE 7 Light Truck Trip Distribution
START END SHARE 6AM 9AM 0.132 9AM 15PM 0.407 15PM 19PM 0.264 19PM 6AM 0.197
FIGURE 5 Light Truck Diurnal Distribution.
TRANSIMS Data Preparation Process
Major Process Description
SCAG_LinkConverter Convert network links from regional planning package
SCAG_Trip_Converter Convert trip tables and diurnal file from OD Matrices
SCAG_ActivityConverter Convert CEMDAP activities and vehicles to TRANSIMS format
SCAG_TripAssignment Assign trips and vehicles to activity locations within the network
SCAG_VehicleCombiner Combine the trip vehicles and activity vehicles
SCAG_Household_Converter Extract household from Activity file
SCAG_Household_Combiner Combine the household of trips and activities
MATSIM Data Preparation Process
Major Process Description
SCAGNetworkConverter Convert network links and nodes from regional planning package
SCAGSingleTripsConverter Convert trip tables and diurnal file from OD Matrices
SCAGTAZ2Coord Assigns persons within a TAZ to locations within that TAZ
SCAGStopsParser Assign trips and vehicles to activity locations within the network
SCAGStops2PlansConverter Combine the trip vehicles and activity vehicles
SCAGStops2PlansConverter Extract household from Activity file
SCAGStops2PlansConverter Combine the household of trips and activities
FIGURE 6 TRANSIMS & MATSIM Data Preparation Process.
0 0.005 0.01 0.015 0.02 0.025
0.25
1.75
3.25
4.75
6.25
7.75
9.25
10.75
12.25
13.75
15.25
16.75
18.25
19.75
21.25
22.75
TRANSIMS and MATSIM Experiments in SimAGENT May 18, 2012
21
With all the data preparation approaches discussed above, data that come from different
sources are converted to the input requirements of TRANSIMS and MATSIM. Figure 6
shows the major processes that are used within each environment to prepare and convert
the data.
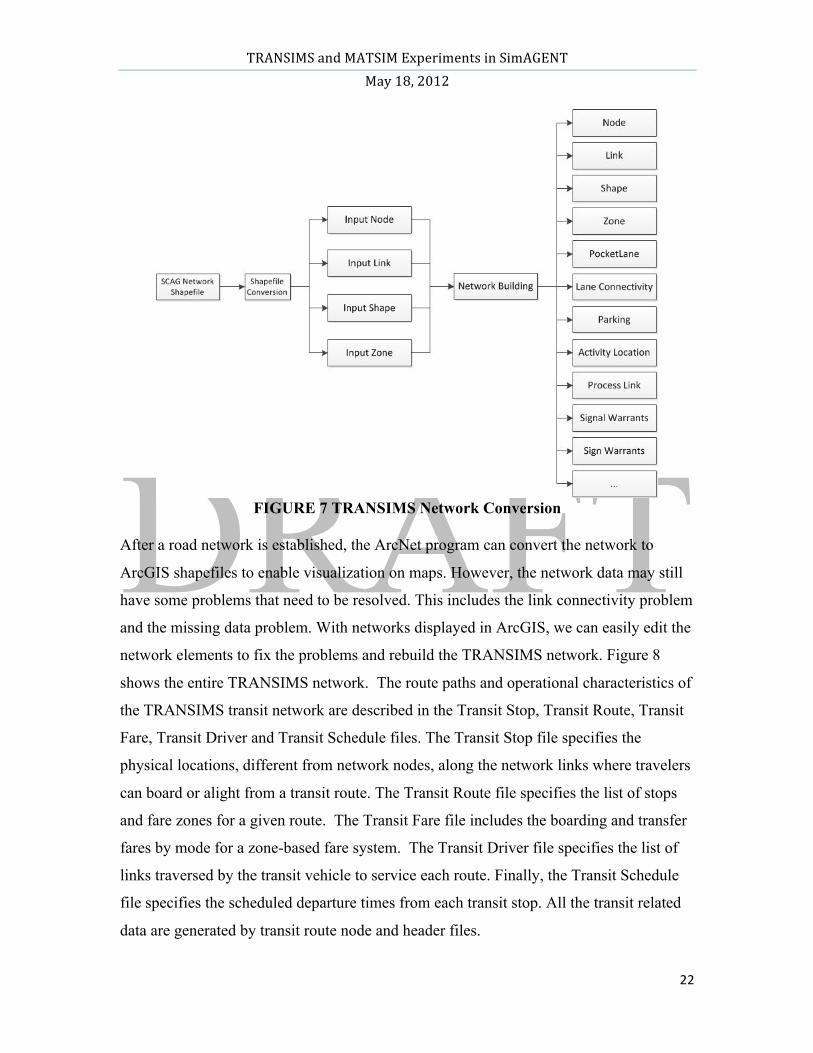
. Road Network Building The TRANSIMS network is generated by TransimsNet program. The TRANSIMS
network contains 20 or more road related components that define various aspects of the
highway and transit facilities and operational characteristics. All components are created
based on the input node, link, shape, and zone files. In particular, the attributes of links
have a strong impact on the network generation. For example, setting up activity
locations is based on the road type of each road link. Activity locations won’t be
generated on freeway, ramp and type of other roadway. In addition, transit stop nodes and
connection links were also added to the network node and link file so that SCAG network
also includes transit network as well. Other network building parameters such as pocket
lengths for facilities, signal warrant for area type, and maximum connection angle are
also set in the control file. Figure 7 shows the network components used in the
TRANSIMS model.
TRANSIMS and MATSIM Experiments in SimAGENT May 18, 2012
22
FIGURE 7 TRANSIMS Network Conversion
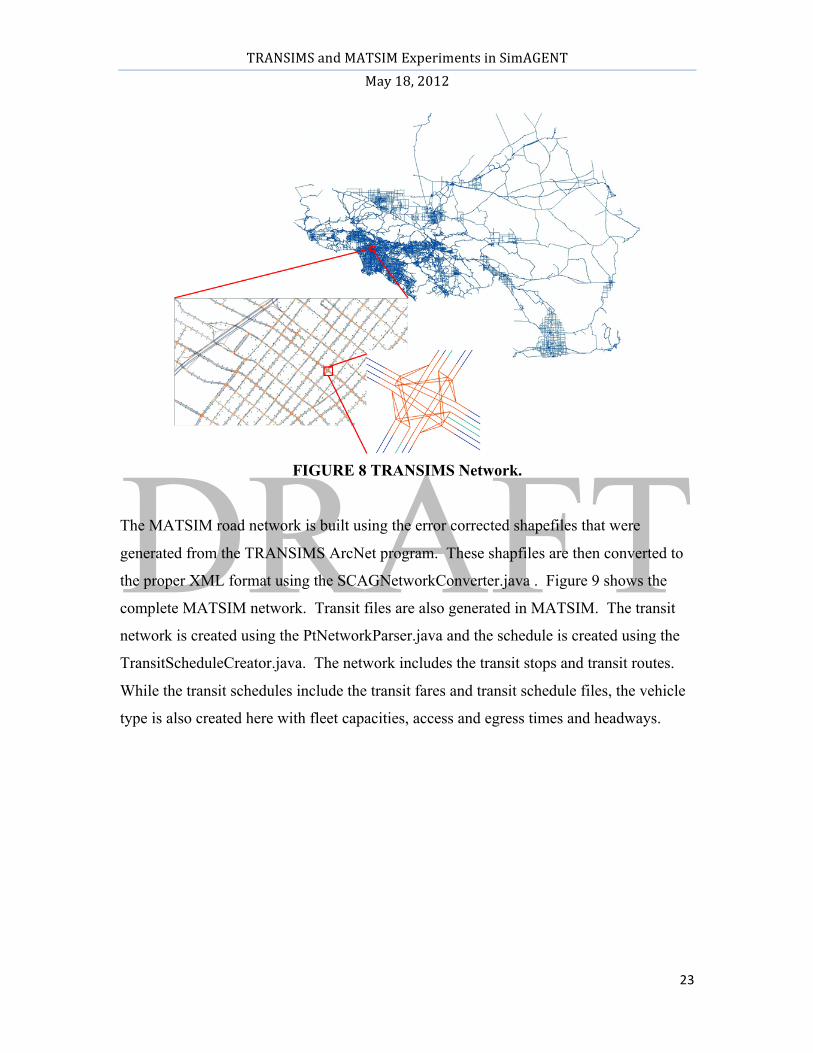
After a road network is established, the ArcNet program can convert the network to
ArcGIS shapefiles to enable visualization on maps. However, the network data may still
have some problems that need to be resolved. This includes the link connectivity problem
and the missing data problem. With networks displayed in ArcGIS, we can easily edit the
network elements to fix the problems and rebuild the TRANSIMS network. Figure 8
shows the entire TRANSIMS network. The route paths and operational characteristics of
the TRANSIMS transit network are described in the Transit Stop, Transit Route, Transit
Fare, Transit Driver and Transit Schedule files. The Transit Stop file specifies the
physical locations, different from network nodes, along the network links where travelers
can board or alight from a transit route. The Transit Route file specifies the list of stops
and fare zones for a given route. The Transit Fare file includes the boarding and transfer
fares by mode for a zone-based fare system. The Transit Driver file specifies the list of
links traversed by the transit vehicle to service each route. Finally, the Transit Schedule
file specifies the scheduled departure times from each transit stop. All the transit related
data are generated by transit route node and header files.
TRANSIMS and MATSIM Experiments in SimAGENT May 18, 2012
23
FIGURE 8 TRANSIMS Network.
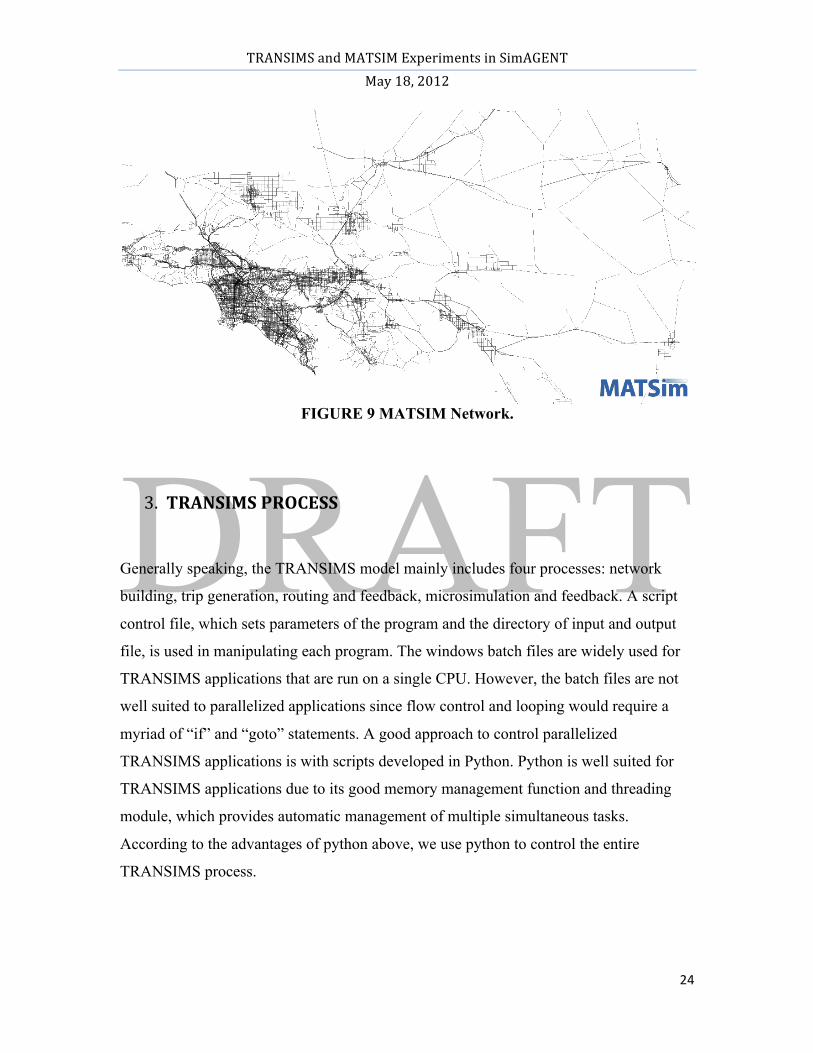
The MATSIM road network is built using the error corrected shapefiles that were
generated from the TRANSIMS ArcNet program. These shapfiles are then converted to
the proper XML format using the SCAGNetworkConverter.java . Figure 9 shows the
complete MATSIM network. Transit files are also generated in MATSIM. The transit
network is created using the PtNetworkParser.java and the schedule is created using the
TransitScheduleCreator.java. The network includes the transit stops and transit routes.
While the transit schedules include the transit fares and transit schedule files, the vehicle
type is also created here with fleet capacities, access and egress times and headways.
TRANSIMS and MATSIM Experiments in SimAGENT May 18, 2012
24
FIGURE 9 MATSIM Network.
3. TRANSIMS PROCESS Generally speaking, the TRANSIMS model mainly includes four processes: network
building, trip generation, routing and feedback, microsimulation and feedback. A script
control file, which sets parameters of the program and the directory of input and output
file, is used in manipulating each program. The windows batch files are widely used for
TRANSIMS applications that are run on a single CPU. However, the batch files are not
well suited to parallelized applications since flow control and looping would require a
myriad of “if” and “goto” statements. A good approach to control parallelized
TRANSIMS applications is with scripts developed in Python. Python is well suited for
TRANSIMS applications due to its good memory management function and threading
module, which provides automatic management of multiple simultaneous tasks.
According to the advantages of python above, we use python to control the entire
TRANSIMS process.

TRANSIMS and MATSIM Experiments in SimAGENT May 18, 2012
25
Generating traffic trips from the combination of truck/airport/port/external OD matrices
by time of day from trip tables (OD) is the first thing after network building. As
mentioned in data preparation, we import every trip table with a diurnal distribution file
to the ConvertTrips program, which also specifies the conversion parameters like trip
purpose, travel mode, average travel speed, vehicle type and subtype for different trip
tables. The ConvertTrip process will create trip records that start from one activity
location and arrive at the destination with estimated travel times. Table 7 below shows
the sample data of the ConvertTrip outputs.
TRANSIMS uses a router program that builds travel paths in the network for trips and
activities. Given the origin and the destination activity location, the trip start time, and the
primary travel mode, the router uses the shortest path algorithm to construct a minimum
impedance path between the origin and destination based on travel conditions at the
specified time of day. The whole travel path for a trip is called a travel plan. The plan for
an automobile trip between home and work consists of three legs. The first leg represents
the walk from the home activity location to the parking lot where the automobile is
parked. The second leg represents the network links when driving from the origin parking
lot to the destination parking lot. The third leg represents walking from the destination
parking lot to the work activity location. The total impedance for all three legs is used to
identify the optimal path for the trip. The output travel plan file includes a separate set of
records for each mode-specific leg of every trip. After travel plans have been built, we
can use ArcPlan program to convert travel plans to be viewed in ArcGIS in order to
verify their validity or to check network travel times.
TRANSIMS router can handle both trips-based and activity-based travel data at the same
time. But at first, vehicle file from different sources have to be combined together. After
imputing trips of truck/airport/port/external generated from ConvertTrips and the
converted CEMDAP activity data to the router and when both kinds of travel data are
imported, trip-based tours are routed.
TRANSIMS and MATSIM Experiments in SimAGENT May 18, 2012
26
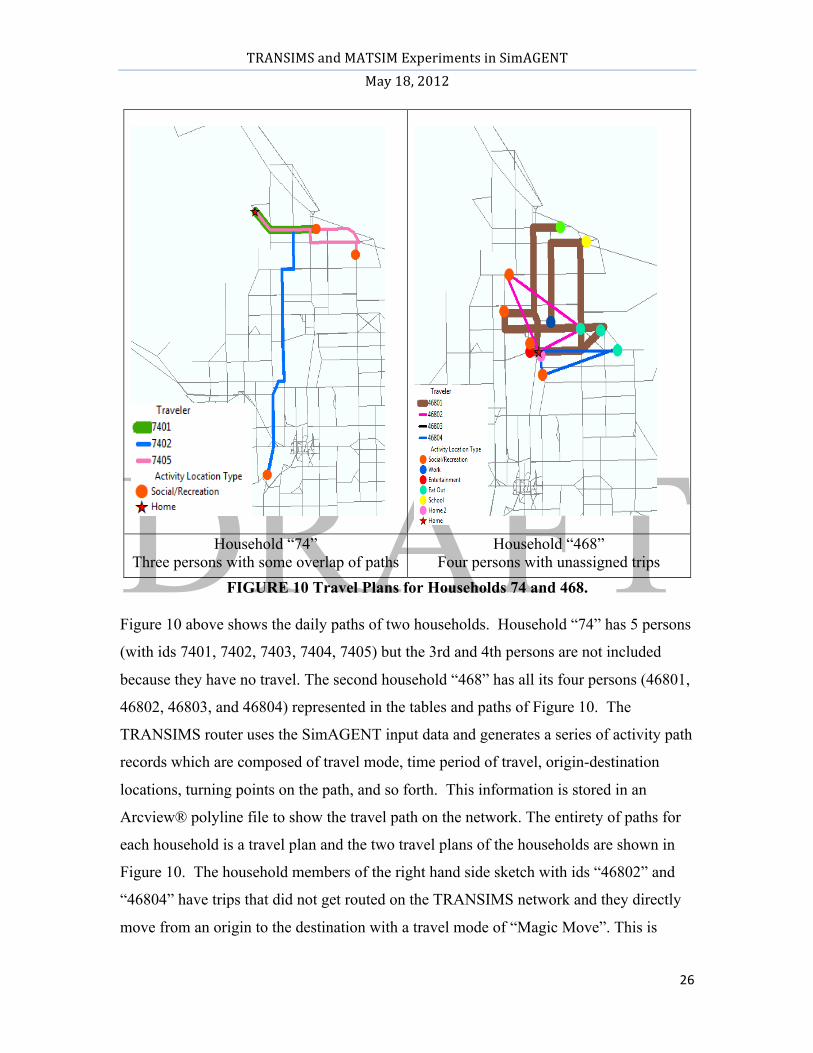
Household “74”
Three persons with some overlap of paths Household “468”
Four persons with unassigned trips FIGURE 10 Travel Plans for Households 74 and 468.
Figure 10 above shows the daily paths of two households. Household “74” has 5 persons
(with ids 7401, 7402, 7403, 7404, 7405) but the 3rd and 4th persons are not included
because they have no travel. The second household “468” has all its four persons (46801,
46802, 46803, and 46804) represented in the tables and paths of Figure 10. The
TRANSIMS router uses the SimAGENT input data and generates a series of activity path
records which are composed of travel mode, time period of travel, origin-destination
locations, turning points on the path, and so forth. This information is stored in an
Arcview® polyline file to show the travel path on the network. The entirety of paths for
each household is a travel plan and the two travel plans of the households are shown in
Figure 10. The household members of the right hand side sketch with ids “46802” and
“46804” have trips that did not get routed on the TRANSIMS network and they directly
move from an origin to the destination with a travel mode of “Magic Move”. This is

TRANSIMS and MATSIM Experiments in SimAGENT May 18, 2012
27
because the persons traveled by “School Bus” (Mode = “6”) and “Driven by Parent (for
child)” (Mode = “4”) and VEHID = “-1” which could not be routed on the network. This
is an example of the type of details that need to be post-processed in addition to a variety
of other comparisons among different assignment algorithms and sensitivity analysis that
are planned for the next phase in model development.
It is important to note that TRANSIMS model is based on the concept of iterative
feedback. This means an iterative feedback process is used to update link travel times and
adjust travel plans so as to generate realistic estimates of traffic volume and transit
ridership. In this part, the PlanSum program to summarize the link demands and estimate
link delays using volume-to-capacity relationships. The link delay file is used in the
PlanSelect program for selecting a subset of household members to re-route their trips
and adjust their travel plans. The PlanSelect process is based on the link volume-to-
capacity ratio, time of day selection, percentage of household and differences between
cumulative travel time and assigned time in a travel plan to determine if a household is
eligible for re-routing. When a household is selected for the next routing process, the link
delay file calculated for the previous loop is also imported for generating new routes. The
new travel plans are built during this process and they are merged to the previous whole
plans.
When new merged plans have been built, the first two loops of routing have been done.
According to the TRANSIMS user document, the number of loops depends on the
convergence criterion used and the method selected for achieving it. When the percentage
of travelers who could improve their travel time by changing paths is less than 2% (about
40 iterations), we could consider the path building is stable. Additional iterations do not
significantly improve this result. Figure 11 shows the flow chart of router and router
feedback Iteration.

TRANSIMS and MATSIM Experiments in SimAGENT May 18, 2012
28
Router
PlanSum
LinkDelay
PlanSelect
Re-‐Route
Acitvities Trips Vehicles
FIGURE 11 Route Planner and Feedback Iteration.
After building and adjusting travel plans for every household, it is time to start to
simulate all the travellers on the network. TRANSIMS uses microsimulator program to
run the simulation. It simulates the movement and interaction of persons and vehicles in a
multimodal transportation network and it works in conjunction with the router to simulate
the travel conditions experienced by individual travelers. The simulation is carried out in
discrete, user-specified time intervals of one second or less over the course of a day. In
every time step, the driving status of each vehicle based on its travel plans, vehicle type,
road conditions, surrounding vehicles, and traffic signals It is also a dynamic traffic
assignment process with iterative feedbacks. Before starting the simulation, PlanPerp
program is used to sort all the travel plans by time of day. And then input time plans and
vehicle type data to start the simulation.
During the simulation, each link in the network is depicted as a grid of cells, with each
pocket and through lane containing its own set of cells. The cell size is typically set equal
to the total space occupied by a passenger car when stopped in a queue. Each vehicle thus
occupies one or more cells depending on its length. Relatively simple rules are used to
move vehicles between cells in the network. The Microsimulator generates performance
statistics based on cell movements per second that replicate fundamental flow-density-
speed relationships. If congestion or network errors prevent a vehicle from changing
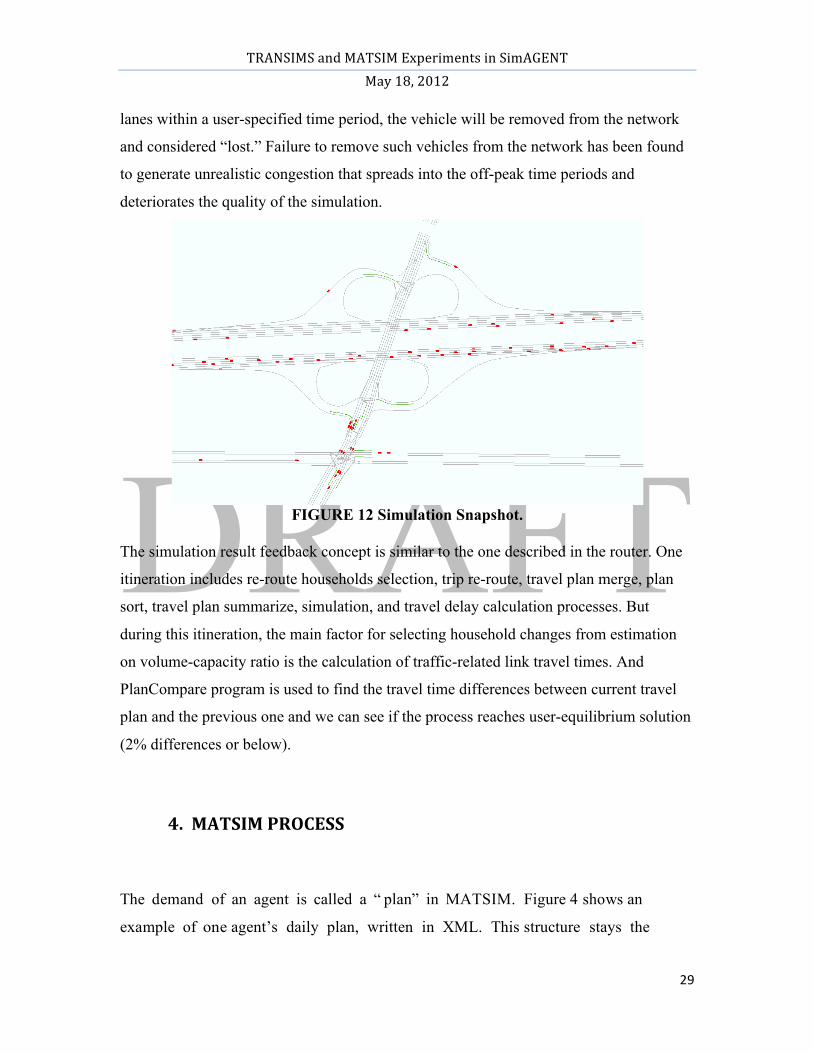
TRANSIMS and MATSIM Experiments in SimAGENT May 18, 2012
29
lanes within a user-specified time period, the vehicle will be removed from the network
and considered “lost.” Failure to remove such vehicles from the network has been found
to generate unrealistic congestion that spreads into the off-peak time periods and
deteriorates the quality of the simulation.
FIGURE 12 Simulation Snapshot.
The simulation result feedback concept is similar to the one described in the router. One
itineration includes re-route households selection, trip re-route, travel plan merge, plan
sort, travel plan summarize, simulation, and travel delay calculation processes. But
during this itineration, the main factor for selecting household changes from estimation
on volume-capacity ratio is the calculation of traffic-related link travel times. And
PlanCompare program is used to find the travel time differences between current travel
plan and the previous one and we can see if the process reaches user-equilibrium solution
(2% differences or below).
4. MATSIM PROCESS
The demand of an agent is called a “ plan” in MATSIM. Figure 4 shows an
example of one agent’s daily plan, written in XML. This structure stays the
TRANSIMS and MATSIM Experiments in SimAGENT May 18, 2012
30
same during all modeling and simulation of the demand. In particular, the
assignment of the traffic demand does not only take single trips into account, but the
complete daily plans, including the activities, are executed. Figure 2 shows the
scenario creation process, initial individual demand modeling process, iterative
demand optimization process (including demand execution, scoring, and
replanning), and post-process analysis. Since MATSIM-T is a modular approach, all
parts shown in Figure 2 (fusion, i n i t i a l d e m a n d m o d e l i n g , EXECUTION,
SCORING and REPLANNING) are given as interfaces such that users are able to
plug in their own models.
The fusion and MATSIM processes rely on input data from SIMAGENT. Since
the quality, quantity, and resolution of data can vary considerably from one
scenario to another, the scenario creation and the MATSIM process steps in
MATSIM can vary as well. MATSIM therefore provides in its core only the
resulting data representation of the infrastructure (network and facilities) and the
population including each person’s individual demand, plus parsers and writers for
the XML data representation.
Land-use data from SCAG region, work locations by industry type are combined in
the fusion module that parses this information and creates one facility (including
the number of workplaces) per census block. This gives a rough approximation of
the existing work facilities and work places in the region.
The post-process analysis part of MATSIM works in the same way, with the
difference that now the input data follows MATSIM standards (MATSIM XML
formats of the network, facilities, population and demand) and therefore is useable for
any given scenario. The iterative demand optimization process is the core of
MATSIM. While all other steps are run once in a sequential order defined by the
user, part three optimizes the demand for each individual synthetic traveler in the
scenario such that they respect the constraints (network, facilities) of the scenario

TRANSIMS and MATSIM Experiments in SimAGENT May 18, 2012
31
and the interaction with all the other actors of that region. MATSIM uses a relaxation
method to find an equilibrium state. Not only the routes are optimized in
MATSIM. The complete daily plan, including routes, times, locations, sequence of
activities, activity types, etc. of each agent is optimized. Each agent tries to execute
its day with highest possible utility. The utility of a daily plan depends on
infrastructural constraints (capacity of streets, opening times of businesses, etc.) and
on the daily plans of the other agents in the system. The effective utility of a daily
plan can only be determined by the interaction of all agents. This is where MATSIM
implements co-evolutionary algorithms. MATSIMS’ evolutionary algorithm consists
of the following steps:
1) Initialize / generate the daily plans for each agent in the system 2) Calculate the utility of the execution of the individual daily plans for each agent 3) Delete “bad” daily plans (the ones with a low utility) 4) Duplicate and modify daily plans 5) Make those plans the relevant plans for the next iteration; increase
the iteration counter by one 6) Go to step 2.
It is important to note that the “individuals” of the evolutionary algorithms are the
plans, while the synthetic travelers are the entities that co-evolve. Figure 2 shows
this optimization loop. For each of the steps listed above, specific modules are
available. The execution of the daily plans (EXECUTION) is handled by a
corresponding traffic flow simulation module, in which the individuals interact
with each other, i.e., individuals may generate congestion on streets of high
usage. The SCORING module calculates the utility of all the executed daily plans.
Plans with a high utility (high “fitness”) survive, while plans with a low utility (e.g.
caused by long travel times because of traffic jams) are eventually deleted. The
creation and variation of daily plans (REPLANNING) is distributed among
different modules that are specialized on varying specific aspects of daily plans.
The modifications in the plan of a single agent are completely independent on the
re-planning of all the other agents’ plans.
TRANSIMS and MATSIM Experiments in SimAGENT May 18, 2012
32
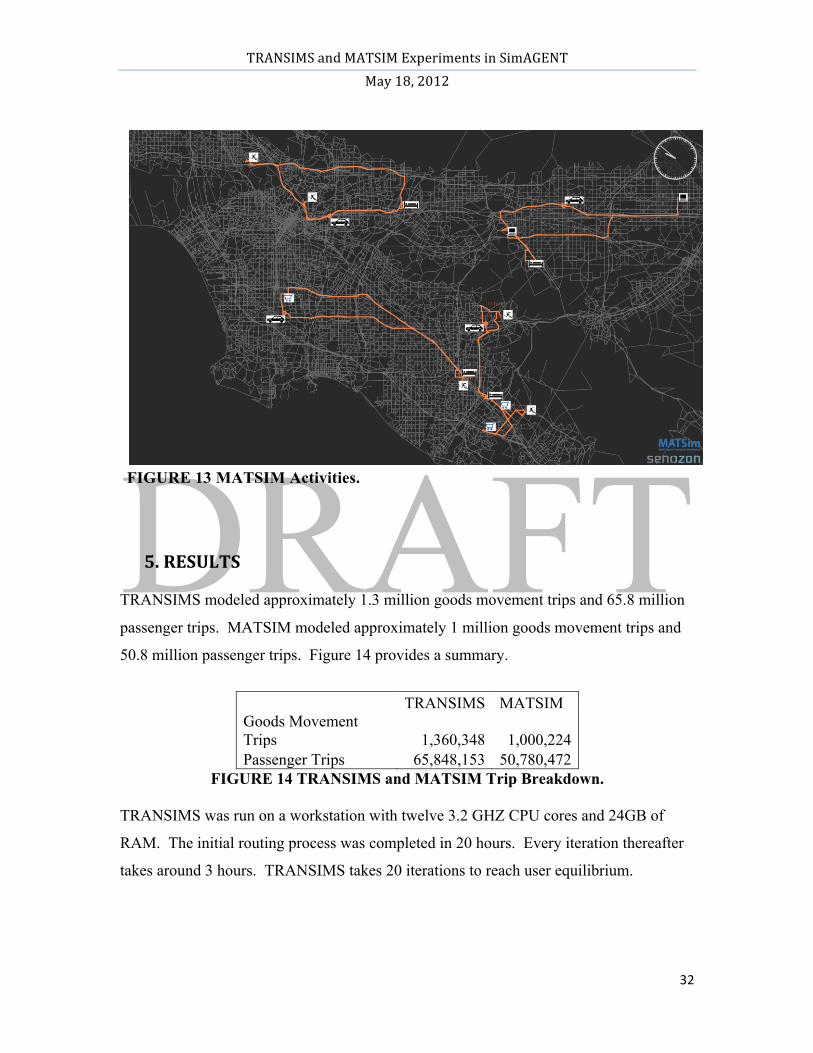
FIGURE 13 MATSIM Activities.
5. RESULTS TRANSIMS modeled approximately 1.3 million goods movement trips and 65.8 million
passenger trips. MATSIM modeled approximately 1 million goods movement trips and
50.8 million passenger trips. Figure 14 provides a summary.
TRANSIMS MATSIM
Goods Movement Trips 1,360,348 1,000,224 Passenger Trips 65,848,153 50,780,472
FIGURE 14 TRANSIMS and MATSIM Trip Breakdown.
TRANSIMS was run on a workstation with twelve 3.2 GHZ CPU cores and 24GB of
RAM. The initial routing process was completed in 20 hours. Every iteration thereafter
takes around 3 hours. TRANSIMS takes 20 iterations to reach user equilibrium.
TRANSIMS and MATSIM Experiments in SimAGENT May 18, 2012
33
MATSIM was run on a workstation with sixteen 2.93 GHZ CPU cores and 72GB of
RAM. Every iteration thereafter takes around 40 min to complete. Similarly equilibrium
is reached around 20 iterations. It should be noted that MATSIM was only able to run a
25% sample of the data. Because of the memory consumption of MATSIM a 100% run
was not possible on the hardware available. For the analysis below a 10% sample is used
and multiplied by 10 to compare with the 100% run from TRANSIMS.
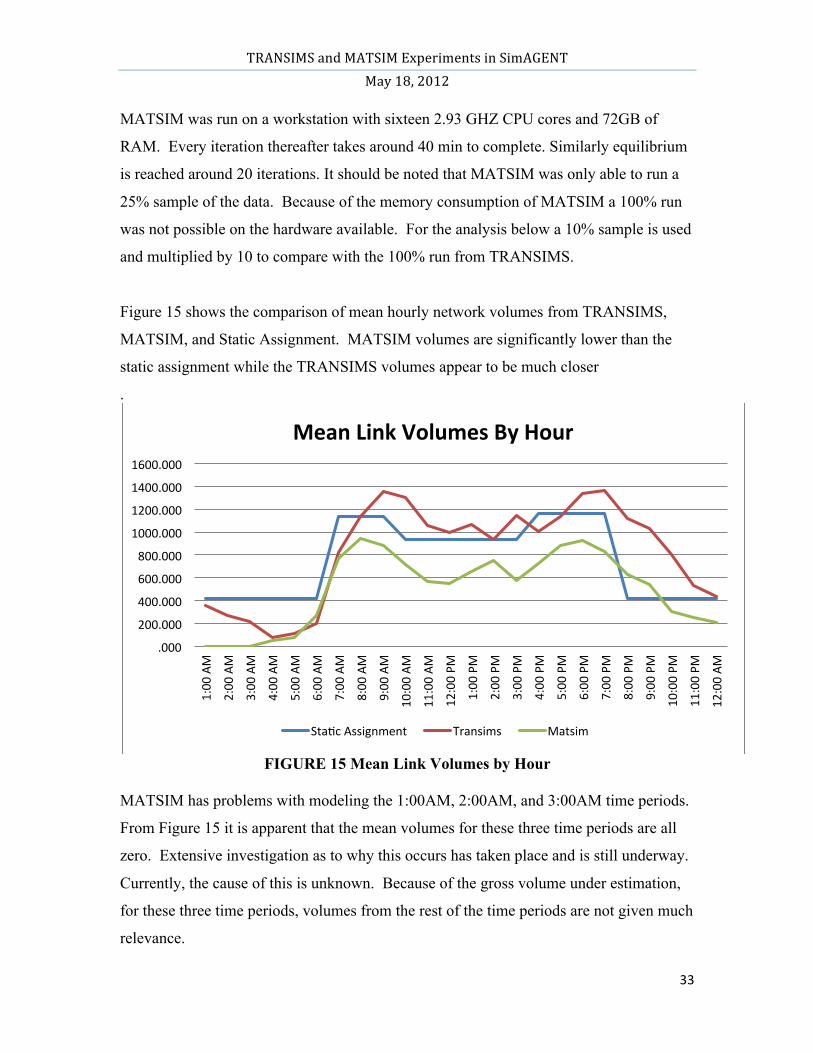
Figure 15 shows the comparison of mean hourly network volumes from TRANSIMS,
MATSIM, and Static Assignment. MATSIM volumes are significantly lower than the
static assignment while the TRANSIMS volumes appear to be much closer
.
FIGURE 15 Mean Link Volumes by Hour
MATSIM has problems with modeling the 1:00AM, 2:00AM, and 3:00AM time periods.
From Figure 15 it is apparent that the mean volumes for these three time periods are all
zero. Extensive investigation as to why this occurs has taken place and is still underway.
Currently, the cause of this is unknown. Because of the gross volume under estimation,
for these three time periods, volumes from the rest of the time periods are not given much
relevance.
.000
200.000
400.000
600.000
800.000
1000.000
1200.000
1400.000
1600.000
1:00 AM
2:00 AM
3:00 AM
4:00 AM
5:00 AM
6:00 AM
7:00 AM
8:00 AM
9:00 AM
10:00 AM
11:00 AM
12:00 PM
1:00 PM
2:00 PM
3:00 PM
4:00 PM
5:00 PM
6:00 PM
7:00 PM
8:00 PM
9:00 PM
10:00 PM
11:00 PM
12:00 AM
Mean Link Volumes By Hour
Sta4c Assignment Transims Matsim
TRANSIMS and MATSIM Experiments in SimAGENT May 18, 2012
34
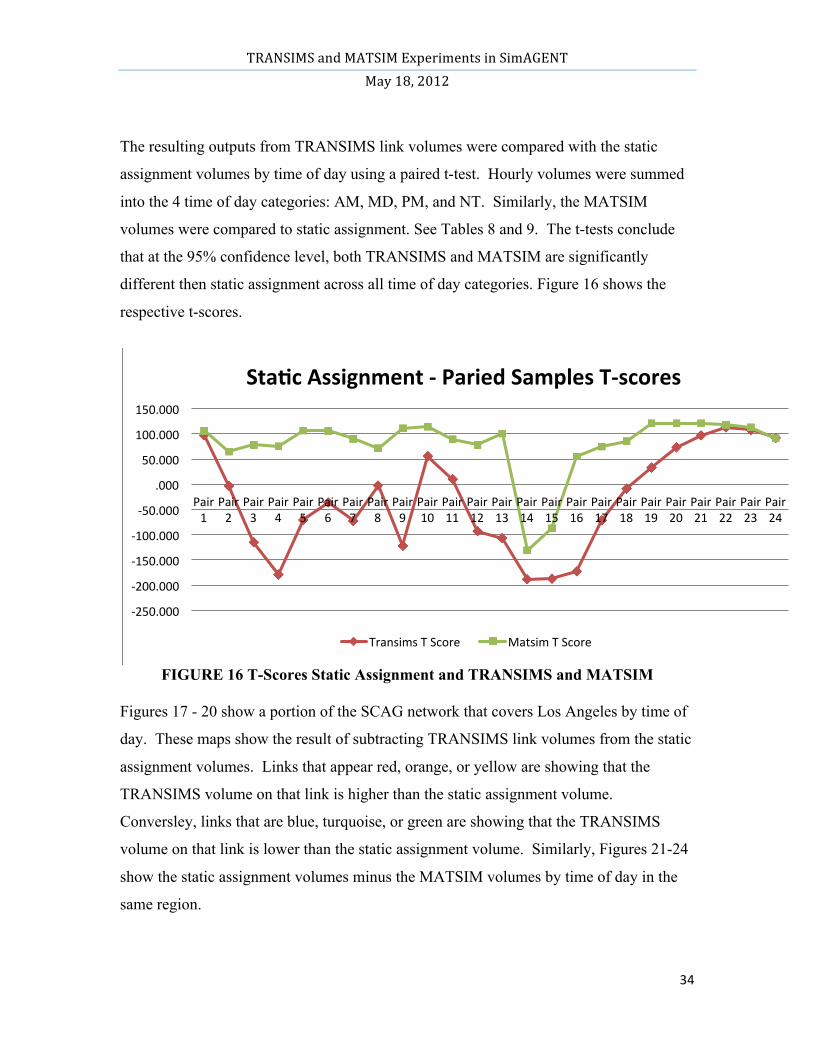
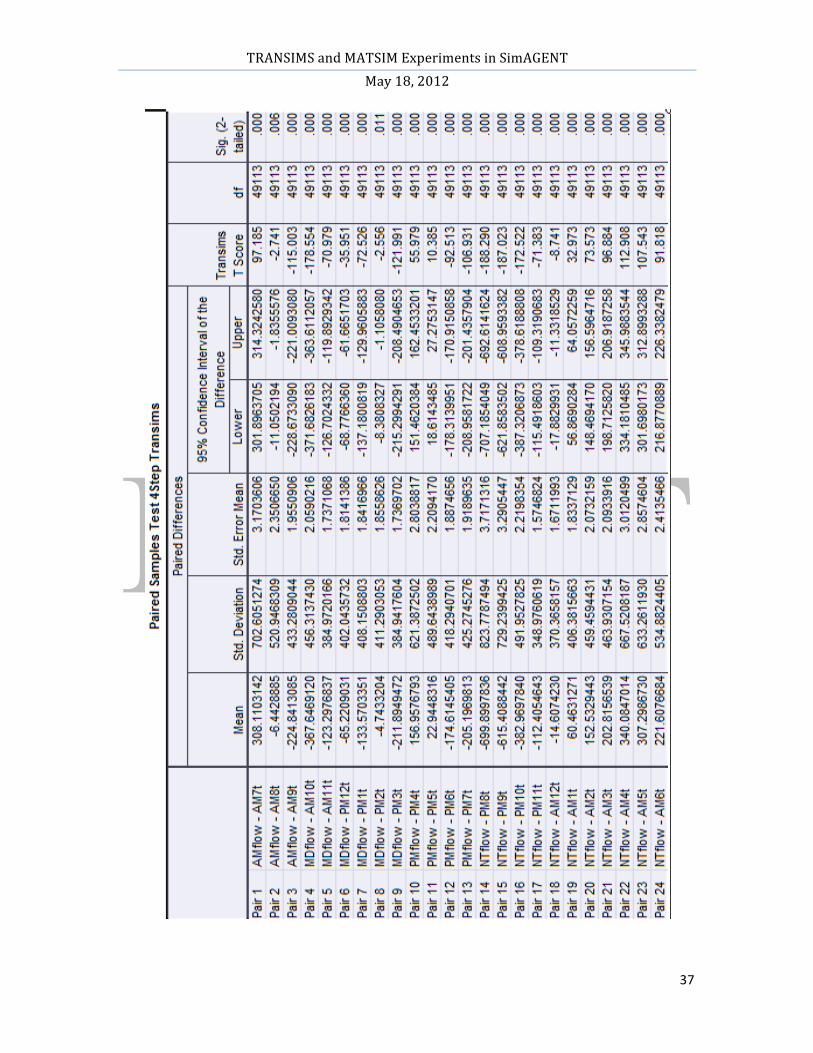
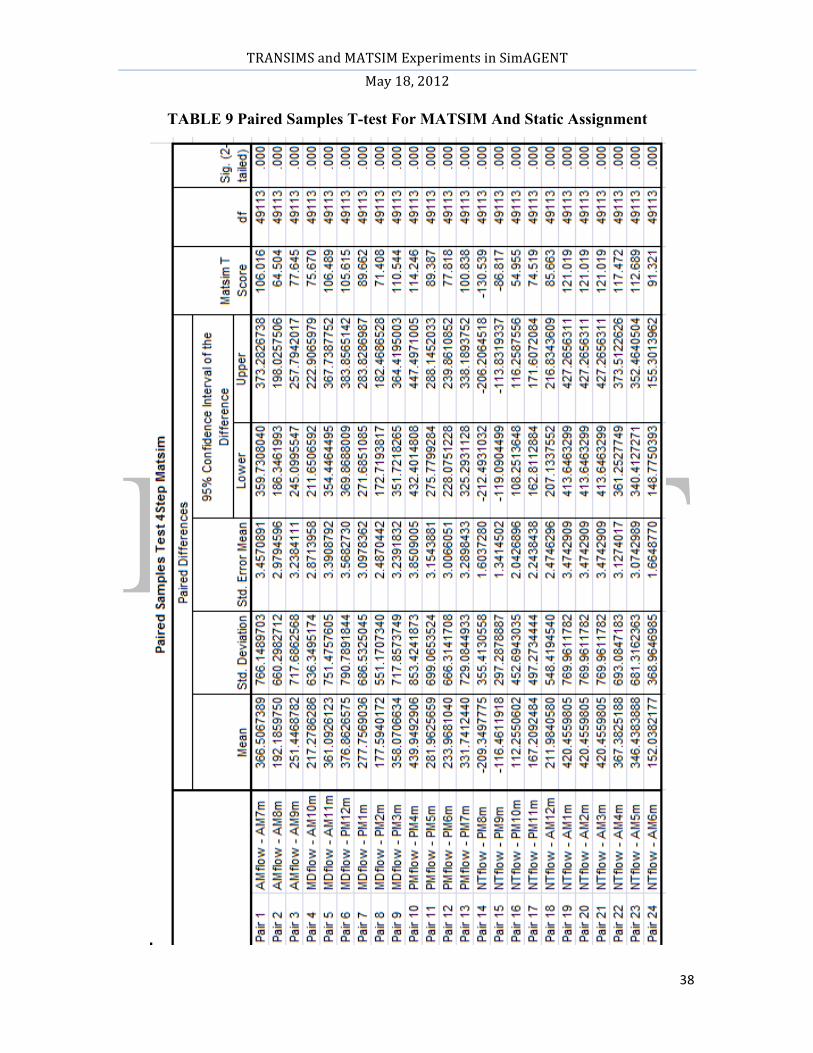
The resulting outputs from TRANSIMS link volumes were compared with the static
assignment volumes by time of day using a paired t-test. Hourly volumes were summed
into the 4 time of day categories: AM, MD, PM, and NT. Similarly, the MATSIM
volumes were compared to static assignment. See Tables 8 and 9. The t-tests conclude
that at the 95% confidence level, both TRANSIMS and MATSIM are significantly
different then static assignment across all time of day categories. Figure 16 shows the
respective t-scores.
FIGURE 16 T-Scores Static Assignment and TRANSIMS and MATSIM
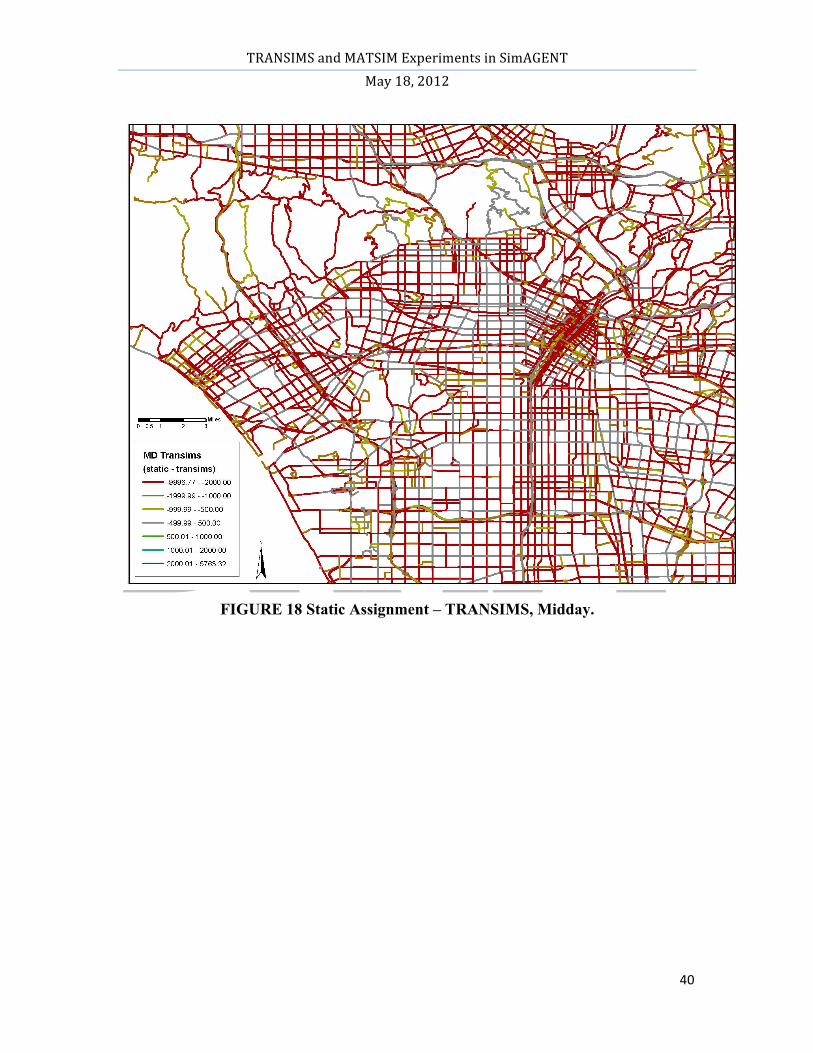
Figures 17 - 20 show a portion of the SCAG network that covers Los Angeles by time of
day. These maps show the result of subtracting TRANSIMS link volumes from the static
assignment volumes. Links that appear red, orange, or yellow are showing that the
TRANSIMS volume on that link is higher than the static assignment volume.
Conversley, links that are blue, turquoise, or green are showing that the TRANSIMS
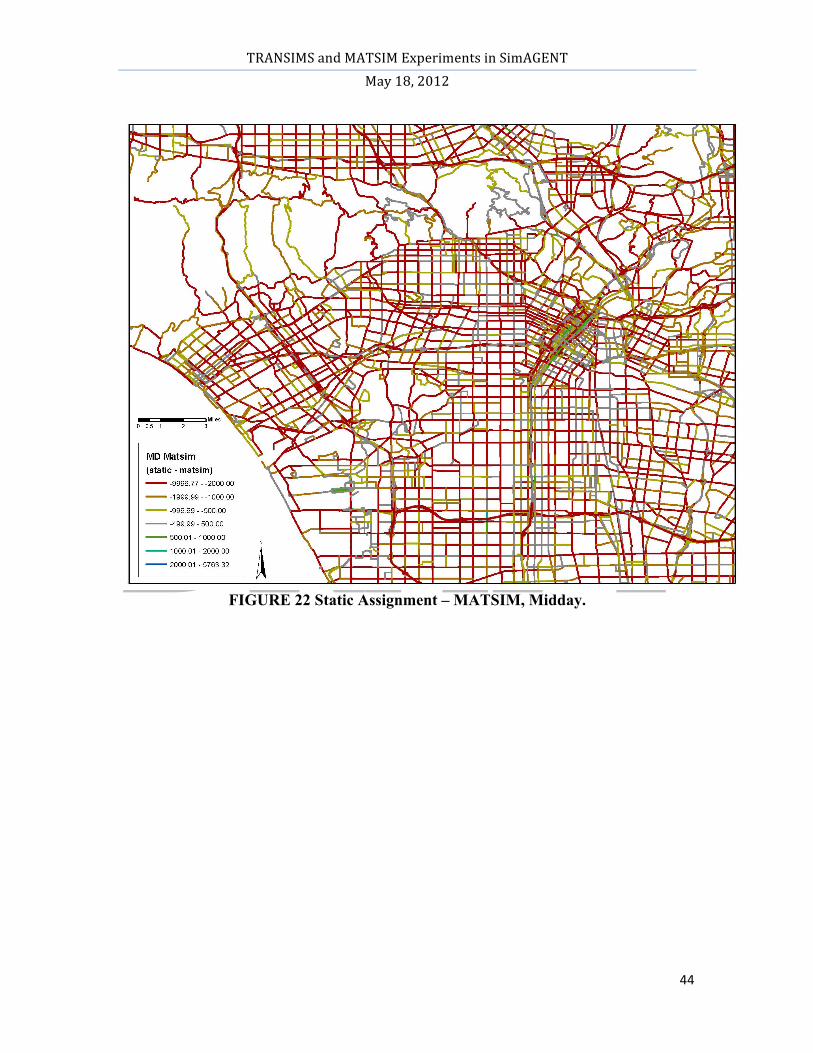
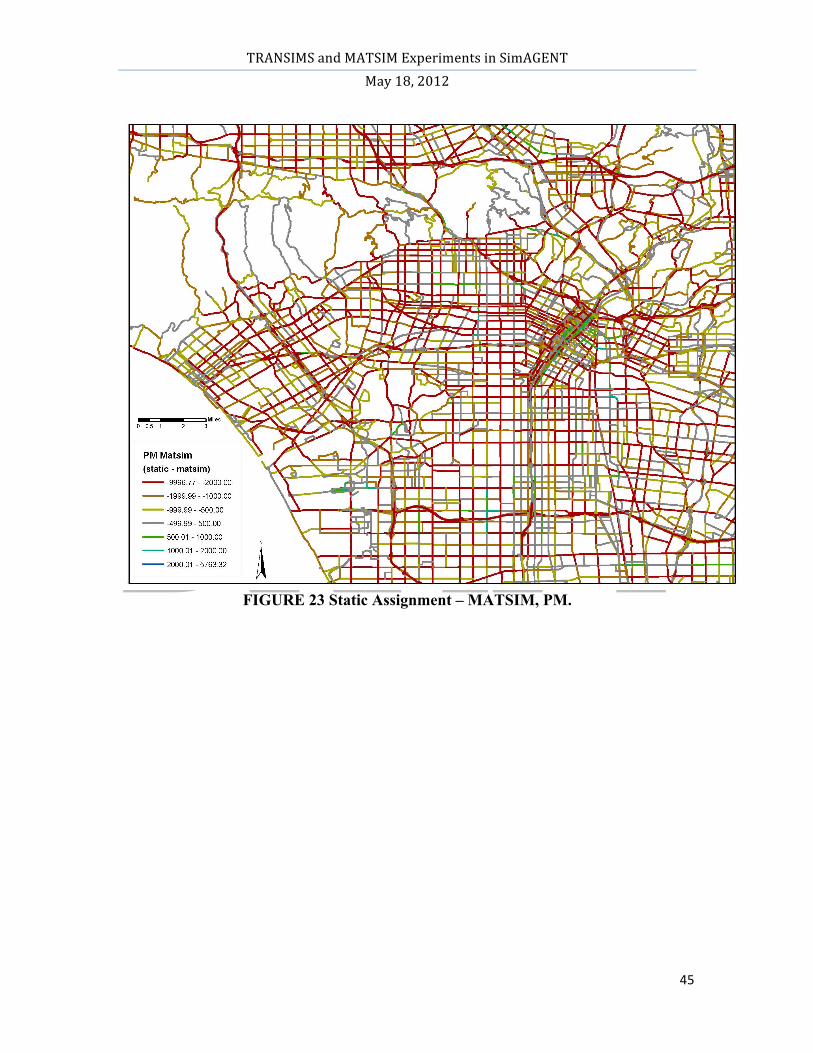
volume on that link is lower than the static assignment volume. Similarly, Figures 21-24
show the static assignment volumes minus the MATSIM volumes by time of day in the
same region.
-‐250.000
-‐200.000
-‐150.000
-‐100.000
-‐50.000
.000
50.000
100.000
150.000
Pair 1
Pair 2
Pair 3
Pair 4
Pair 5
Pair 6
Pair 7
Pair 8
Pair 9
Pair 10
Pair 11
Pair 12
Pair 13
Pair 14
Pair 15
Pair 16
Pair 17
Pair 18
Pair 19
Pair 20
Pair 21
Pair 22
Pair 23
Pair 24
Sta>c Assignment -‐ Paried Samples T-‐scores
Transims T Score Matsim T Score
TRANSIMS and MATSIM Experiments in SimAGENT May 18, 2012
35
CONCLUSION TRANSIMS and MATSIM were both used to implement microsimulations of the
CEMDAP output. TRANSIMS while harder to work with provided a model that
included 100% of the data and correctly routed transit and goods movement onto the
network.
Problems occur when dealing with data inconsistency. For instance, in the CEMDAP
activity files, some share ride passengers do not have vehicle information, which would
be directly moved from origin to the destination. When building the network, some links
may not connect to the whole network; links may lose connectivity lanes in some
intersections, which leads to links unreachable during the routing process and simulation.
MATSIM was only able to provide a 25% sample (although a 100% sample should be
possible with more random access memory). Significant problems were encountered with
transit routing onto the road network. Furthermore, volumes were grossly incorrect for 3
time periods and lower then both static assignment and TRANSIMS for most of the other
time periods.
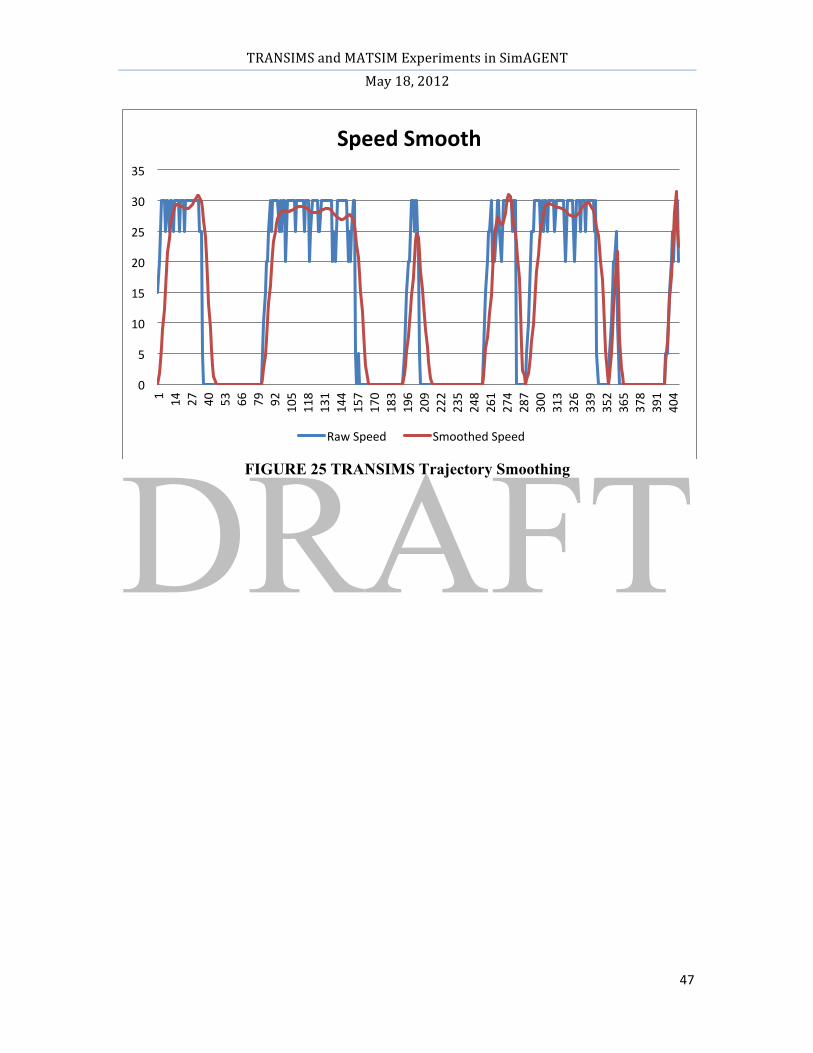
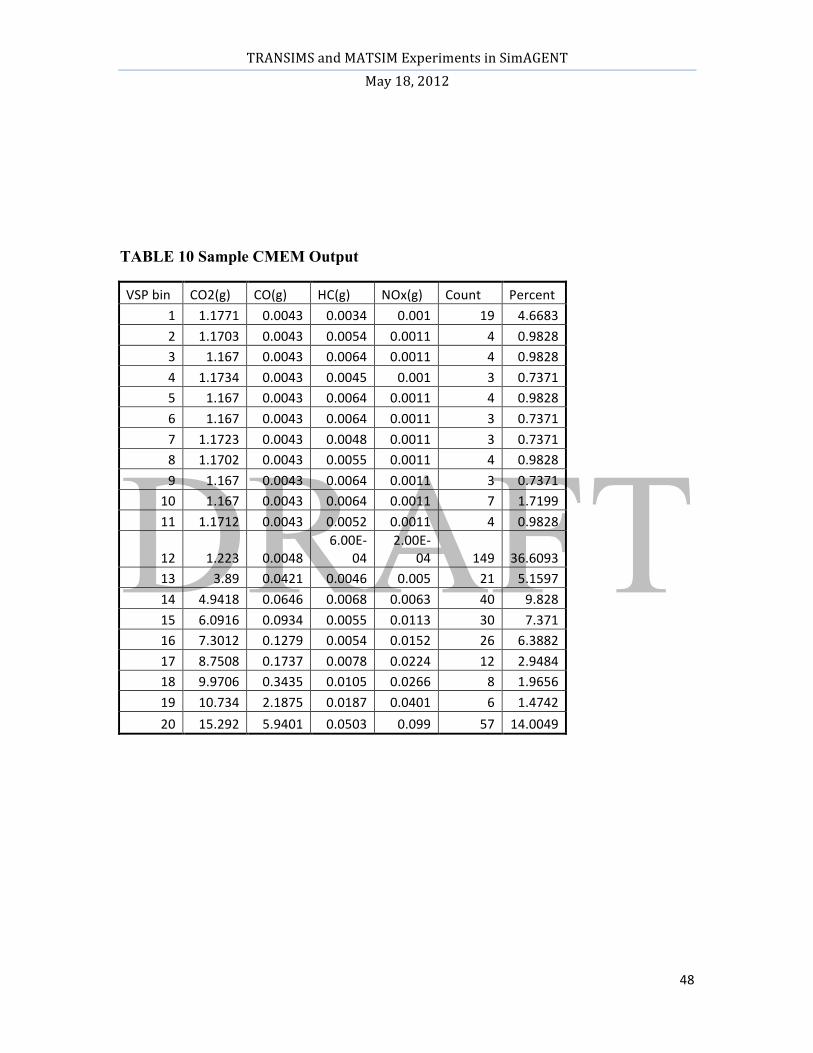
6. FURTHER RESEARCH The second by second vehicle speed and acceleration profiles from TRANSIMS are
currently being implemented into the Comprehensive Modal Emissions Model (CMEM)
to provide second by second emissions calculations. A problem exists from the nature of
the data provided by TRANSIMS. TRANSIMS provides speeds and accelerations in 5
mph intervals as shown by the blue line in Figure 25. These jumps in speed result in very
extreme accelerations. These extreme accelerations lead to emissions over-estimations by
CMEM. Because of this, a polynomial smoothing is applied to the TRANSIMS
trajectories. The red line in graph 3 shows the same trajectory with smoothing applied.

TRANSIMS and MATSIM Experiments in SimAGENT May 18, 2012
36
TABLE 8 Paired Samples T-test For TRANSIMS And Static Assignment
TRANSIMS and MATSIM Experiments in SimAGENT May 18, 2012
37
TRANSIMS and MATSIM Experiments in SimAGENT May 18, 2012
38
TABLE 9 Paired Samples T-test For MATSIM And Static Assignment

TRANSIMS and MATSIM Experiments in SimAGENT May 18, 2012
39
FIGURE 17 Static Assignment – TRANSIMS, AM.
TRANSIMS and MATSIM Experiments in SimAGENT May 18, 2012
40
FIGURE 18 Static Assignment – TRANSIMS, Midday.

TRANSIMS and MATSIM Experiments in SimAGENT May 18, 2012
41
FIGURE 19 Static Assignment – TRANSIMS, PM.

TRANSIMS and MATSIM Experiments in SimAGENT May 18, 2012
42
FIGURE 20 Static Assignment – TRANSIMS, Nighttime.

TRANSIMS and MATSIM Experiments in SimAGENT May 18, 2012
43
FIGURE 21 Static Assignment – MATSIM, AM.
TRANSIMS and MATSIM Experiments in SimAGENT May 18, 2012
44
FIGURE 22 Static Assignment – MATSIM, Midday.
TRANSIMS and MATSIM Experiments in SimAGENT May 18, 2012
45
FIGURE 23 Static Assignment – MATSIM, PM.

TRANSIMS and MATSIM Experiments in SimAGENT May 18, 2012
46
FIGURE 24 Static Assignment – MATSIM, Nighttime.
TRANSIMS and MATSIM Experiments in SimAGENT May 18, 2012
47
FIGURE 25 TRANSIMS Trajectory Smoothing
0
5
10
15
20
25
30
35 1 14
27
40
53
66
79
92
105
118
131
144
157
170
183
196
209
222
235
248
261
274
287
300
313
326
339
352
365
378
391
404
Speed Smooth
Raw Speed Smoothed Speed
TRANSIMS and MATSIM Experiments in SimAGENT May 18, 2012
48
TABLE 10 Sample CMEM Output
VSP bin CO2(g) CO(g) HC(g) NOx(g) Count Percent 1 1.1771 0.0043 0.0034 0.001 19 4.6683 2 1.1703 0.0043 0.0054 0.0011 4 0.9828 3 1.167 0.0043 0.0064 0.0011 4 0.9828 4 1.1734 0.0043 0.0045 0.001 3 0.7371 5 1.167 0.0043 0.0064 0.0011 4 0.9828 6 1.167 0.0043 0.0064 0.0011 3 0.7371 7 1.1723 0.0043 0.0048 0.0011 3 0.7371 8 1.1702 0.0043 0.0055 0.0011 4 0.9828 9 1.167 0.0043 0.0064 0.0011 3 0.7371
10 1.167 0.0043 0.0064 0.0011 7 1.7199 11 1.1712 0.0043 0.0052 0.0011 4 0.9828
12 1.223 0.0048 6.00E-‐
04 2.00E-‐
04 149 36.6093 13 3.89 0.0421 0.0046 0.005 21 5.1597 14 4.9418 0.0646 0.0068 0.0063 40 9.828 15 6.0916 0.0934 0.0055 0.0113 30 7.371 16 7.3012 0.1279 0.0054 0.0152 26 6.3882 17 8.7508 0.1737 0.0078 0.0224 12 2.9484 18 9.9706 0.3435 0.0105 0.0266 8 1.9656 19 10.734 2.1875 0.0187 0.0401 6 1.4742 20 15.292 5.9401 0.0503 0.099 57 14.0049

TRANSIMS and MATSIM Experiments in SimAGENT May 18, 2012
49
7. REFERENCES AND CITATIONS Barrett, C., Bisset, K., Jacob, R., Konjevod, G., Marathe, M., 2002. Classical and contemporary shortest path problems in road networks: Implementation and experimental analysis of the transims router. In: Möhring, R.H., Raman, R. (eds.) ESA 2002. LNCS, vol. 2461, pp. 126–138 Balmer, M., Rieser, M., Meister, K., Charypar, D., Lefebvre, N., and Nagel, K., 2009. MATSim-T: Architecture and simulation times. In: Bazzan, A., Klügl, F. (eds.) Multi-Agent Systems for Traffic and Transportation Engineering, ch. III. Information Science Reference (2009). Bekhor, S., C. Dobler, and K.W. Axhausen, 2011. Integration of Activity-Based with Agent-Based Models: an Example from the Tel Aviv Model and MATSim, paper presented at the 90th Annual Meeting of the Transportation Research Board, Washington, D.C., January 2011. Chang, E., and A. Ziliaskopoulos, 2003. Data challenges in the development of a regional assignment simulation model to evaluate transit signal priority in Chicago. CD-Rom for the 82nd Annual Meeting of the Transportation Research Board, Washington D.C. 2003 Hatzopoulou, M., H., Y. Jiang, Hao, and E. Miller, 2011. Simulating the impacts of household travel on greenhouse gas emissions, urban air quality, and population exposure, Transportation (2011) 38, pp. 871–887. Horni, A., D. M. Scott, M. Balmer and K. W. Axhausen, (2009) Location Choice Modeling for Shopping and Leisure Activities With MATSim: Combining Micro-simulation and Time Geography, Transportation Research Record, 2135, pp. 87-95. Joubert, W. J., P. J. Fourie and K. W. Axhausen, (2010) Large-Scale Agent-Based Combined Traffic Simulation of Private Cars and Commercial Vehicles, Transportation Research Record, 2168, pp. 24-32. Nagel, K., R. Beckman, and C. Barrett, 1999. TRANSIMS for urban planning, Technical Report LA-UR 98-4389, Los Alamos National Laboratory. Nagel, K., R. Beckman, and C. Barrett, 1999. TRANSIMS for urban planning, Technical Report LA-UR 98-4389, Los Alamos National Laboratory.


![Parallel implementation of the TRANSIMS micro … · arXiv:cs/0105004v1 [cs.CE] 2 May 2001 Parallel implementation of the TRANSIMS micro-simulation Kai Nagela ,1 and Marcus Rickertb](https://static.fdocuments.net/doc/165x107/5b5de4f37f8b9a65028e94ab/parallel-implementation-of-the-transims-micro-arxivcs0105004v1-csce-2-may.jpg)


