Silver Nanocrystals Differing By Their Coating Agents ...
156
HAL Id: tel-01560791 https://tel.archives-ouvertes.fr/tel-01560791 Submitted on 12 Jul 2017 HAL is a multi-disciplinary open access archive for the deposit and dissemination of sci- entific research documents, whether they are pub- lished or not. The documents may come from teaching and research institutions in France or abroad, or from public or private research centers. L’archive ouverte pluridisciplinaire HAL, est destinée au dépôt et à la diffusion de documents scientifiques de niveau recherche, publiés ou non, émanant des établissements d’enseignement et de recherche français ou étrangers, des laboratoires publics ou privés. Silver Nanocrystals Differing By Their Coating Agents : Unexpected Behaviors Jingjing Wei To cite this version: Jingjing Wei. Silver Nanocrystals Differing By Their Coating Agents : Unexpected Behaviors. Chem- ical Physics [physics.chem-ph]. Université Pierre et Marie Curie - Paris VI, 2015. English. NNT : 2015PA066312. tel-01560791
Transcript of Silver Nanocrystals Differing By Their Coating Agents ...

HAL Id: tel-01560791https://tel.archives-ouvertes.fr/tel-01560791
Submitted on 12 Jul 2017
HAL is a multi-disciplinary open accessarchive for the deposit and dissemination of sci-entific research documents, whether they are pub-lished or not. The documents may come fromteaching and research institutions in France orabroad, or from public or private research centers.
L’archive ouverte pluridisciplinaire HAL, estdestinée au dépôt et à la diffusion de documentsscientifiques de niveau recherche, publiés ou non,émanant des établissements d’enseignement et derecherche français ou étrangers, des laboratoirespublics ou privés.
Silver Nanocrystals Differing By Their Coating Agents :Unexpected Behaviors
Jingjing Wei
To cite this version:Jingjing Wei. Silver Nanocrystals Differing By Their Coating Agents : Unexpected Behaviors. Chem-ical Physics [physics.chem-ph]. Université Pierre et Marie Curie - Paris VI, 2015. English. �NNT :2015PA066312�. �tel-01560791�

THÈSE
DE DOCTORAT DE L’UNIVERSITÉ PIERRE ET MARIE CURIE (PARIS VI)
ECOLE DOCTORALE DE CHIMIE-PHYSIQUE ET CHIMIE ANALYTIQUE DE PARIS
CENTRE
SPÉCIALITÉ «CHIMIE-PHYSIQUE»
présentée par
JINGJING WEI
pour obtenir le diplôme de
DOCTEUR DE L’UNIVERSITÉ PIERRE ET MARIE
CURIE
Sujet de la thèse
SILVER NANOCRYSTALS DIFFERING BY THEIR COATING
AGENTS: UNEXPECTED BEHAVIORS
Thèse soutenue le 10 Juillet 2015 devant le jury composé de:
Pr. DIDIER ASTRUC Examinateur
Pr. PIERO BAGLIONI Rapporteur
Pr. GIORGIO BENEDEK Examinateur
Pr. GIULIO CERULLO Rapporteur
Pr. HELENE GERARD Président du jury
Pr. MARIE-PAULE PILENI Directrice de thèse
Dr. NICOLAS SCHAEFFER Examinateur


Acknowledgement
i
Acknowledgements
It would not have been possible to write this doctoral thesis without the help
and support of the kind people around me, to only some of whom it is possible to give
particular mention here.
Firstly and most importantly, I would like to thank Prof. Marie-Paule PILENI
at the MONARIS lab (De la molécule aux nano-objets : réactivité, interactions et
spectroscopies, UMR 8233) at Université Pierre et Maire CURIE (Paris VI). I was so
lucky to be a Ph.D student of professor Pileni. During the last four years, I was
strongly astonished by her wide knowledge and professional attitude on the scientific
research. She was strict with every data we obtained and her upright attitude to
science encouraged me a lot. She was serious with every scientific paper we produced
and she always tried her best to improve them. Furthermore, everytime I encountered
difficulties in the experiments she encouraged me and gave me selfless help. She is
also a immane person who gave me some freedom on the research to improve my
abilities, which shed light on my research life. I have been extremely lucky to have a
supervisor who cared so much about my work. It is impossible to imagine how I could
have focused on the research and achieved this thesis without her help. Besides, she is
a very good guide and friend in life. She always told us amazing stories of Paris and
gave suggestions on how to enjoy and live in this strange city. This experience will be
a valuable experience for all my life.
Secondly I would thank Dr. Nicolas SCHAEFFER, who helped me not only for
the research work but also for the life skills. He spent a lot of time revising my papers
and helped me organise the data I obtained. It would have been impossible for me to
finish those four years’ work without his guidance and help. Furthermore, he gave me
great help to save me from the difficulties in life. He is a very warm hearted person to
help others.
Last but not the least, I would like to thank Dr. Pierre-Antoine ALBOUY
(Laboratoire de Physique des Solides, Université Paris-Sud) for the characterization
of the sample (SAXS), I would also like to show my appreciation to Dr. Hervé
PORTALÈS for the simulation work in the papers and thesis. I would like to thank Dr.
Zhijie YANG for the sample of CoFe2O4 colloidal nanoparticles and Mr. Nicolas
GOUBET for the samples of colloidal Au nanoparticles. I would like to thank Dr.

Ag nanocrystals differing by their coating agents: unexpected behaviors
ii
Ludovic DOUILLARD and Dr Julien ROMANN for the fruitful discussions about the
various papers and the thesis manuscript. I would like to show my appreciation to Dr.
Peng YANG, Dr. Cong YAN, Dr Yanfen WAN, Mr. Xiang LING, Mr. Nailiang
YANG, Dr. Liying WANG and Dr. Arzu COLAK, my colleagues, who gave me so
much help and happiness just like in my family. I would like to offer great thanks to
all other members in the laboratory: Pr. Christophe PETIT, Dr. Isabelle LISIECKI,
Professor Alexa COURTY, Dr. Imad ARFAOUI, Dr. Anh-Tu NGO, Dr. Johannes
RICHARDI, Dr. Caroline SALZEMANN, Mr. Farid KAMECHE, Mr. Takieddine
DJEBAILI, Mr. Patrice SEBASTIEN, Mr. Jean-luc LINDOR, and former members of
the laboratory, Dr. Manon CAVALIER, Dr. Amandine ANDRIEUX-LEDIER, Ms.
Neus AGULERA, Dr. Claudio LAROSO and Dr. Ana CAZACU.
I extend my warmest thanks to all the people who evaluate my thesis and the
members of the jury: Pr. Hélène GERARD, Pr. Dedier ASTRUC, Pr. Piero
BAGLIONI, Pr. Georgio BENEDEK, Dr. Nicolas SCHAEFFER. Thanks a lot for
their effort to help me improve the Ph.D manuscript.
I would also like to thank my husband Zhijie who gave me the courage to carry
on this thesis. I would also like to express my gratitude to my parents.
I would like to sincerely thank the China Scholarship Council for the financial
support during my stay in France.
Paris, July 10th, 2015

Abstract
iii
Abstract
Over the last few decades, nanotechnology, which is the development of new
methods for synthesizing and manipulating discrete nanoparticles and larger
nanostructured assemblies, have made great progress. Nanoparticles provide a high
surface-to-volume ratio (compared to the bulk phase), representing an important state
of condensed matter, hence exhibiting novel physical and chemical properties that are
not observed in their bulk state. Self-organization of spherical particles into two-
dimensional (2D) and three-dimensional (3D) superlattices is commonly observed in
nature, where nanoparticles having similar diameters and very narrow size
distributions can self-organize into 2D or in 3D ordered structures, also called
supracrystals. Furthermore, binary nanocrystal superlattices, which are co-assembled
from two distinct series of nanoparticles, have also emerged. Compared to the limited
phase structures formed in the single-component nanoparticle superlattices, a variety
of phase structures of binary nanocrystal superlattices can be produced, and the
prediction of these phase structures mainly relies on the space-filling principles.
However, in addition to the well-known crystal structures formed with hard sphere
model, such as AlB2, NaZn13, NaCl, and laves phases in binary superlattices, other
phases such as CuAu-type, Cu3Au-type, CaB6-type as well as quasicrystalline
ordering are also discovered in binary nanocrystal superlattices, where nanoparticle
interactions must be considered.
In this manuscript, recent advances in the synthesis and optical properties of
Ag nanocrystals and their assemblies into 2D/3D superlattices will be reviewed in
Chapter 1. Chapter 2 focuses on the SPR response from 2D self-assemblies of both
Ag and Au spherical nanocrystals. The collective SPR bands observed in the
measured absorption spectra are described and compared to those calculated using
dipole approximation (DDA) method. The similar results provided by these two
approaches show that the theoretical DDA methods are suitable for the simulation of
linear optical response of 2D superlattices made of such ultrafine metal nanocrystals
and can be used to model and predict their optical responses. The influence of the
nanocrystals coating agent and its influence on the validity of DDA simulations is
also discussed. Chapter 3 describes the optical properties of silver nanocrytals when
dispersed in a solvent. The SPR band of those nanocrystals is shown to be dependent

Ag nanocrystals differing by their coating agents: unexpected behaviors
iv
not only on the nanaocrystal diameter, but also on the nature of the coating agent. In
Chapter 4, the fabrication of thin supracrystalline films made of Ag nanocrystals is
explained, and the optical properties of the as-obtained films composed of
nanocrystals with varying diameters and coating agents studied. By comparing the
SPR spectra of dispersed Ag nanocrystals with their assemblies of supracrystalline
films, marked changes are observed. The energy discrepancy (ΔE), determined from
the difference in SPR band between dispersed nanocrystals and their corresponding
assemblies is shown to be mainly dependent on both the nanocrystals size and the
interparticle distances within the supercrystalline films. These results also show a
good agreement between simulated optical properties of 2D superlattices with data
acquired with 3D thin films assembled in fcc crystalline structure. Furthermore, it is
shown that the interparticle distance of nanocrystals, modulated by the alkyl chain
length of the coating agents, could effectively tune the SPR band position. Chapter 5
is related to the fabrication of binary nanocrystal superlattices. Colloidal binary
nanocrystal mixtures containing two distinct nanocrystals with either the same surface
coating agent, called single ligand system, or with two different surface coating agents,
refered as multiple ligands system, are used to grow binary nanocrystal superlattices.
The mechanism of formation of binary nanocrystal superlattices from Ag-Ag binary
mixtures and the effect of surface capping agents on the formation of binary
nanocrystal superlattices is discussed.
Résumé
v
Résumé
Au cours des dernières décennies, les nanotechnologies, c'est à dire le développement
de nouvelles méthodes de synthèse et la manipulation de nanoparticules et de leurs
assemblage en nanostructures plus grandes, ont connu d'important progrès. Les
nanoparticules offrent un grand ratio de surface sur volume (par rapport au solide), en
faisant d’elles un état de la matière condensée important de par les nouvelles
propriétés physiques et chimiques qu'elles offrent et qui n'existent pas dans le solide.
L'auto-organisation de particules sphériques en deux dimensions (2D) et en trois
dimensions (3D) des super-réseaux est couramment observée dans la nature, où les
nanoparticules ayant des diamètres et des répartitions de tailles très fines peuvent
s'auto-organiser en structures ordonnées en 2D ou en 3D, appelées supracristaux. En
outre, les super-réseaux de nanocristaux binaires, qui sont des co-assemblages de
deux séries distinctes de nanoparticules, ont également émergé. Par rapport aux
structures formées de nanoparticules à une composante unique, une variété de
structures de réseaux de phase binaires de nanocristaux ont été produites, et la
prédiction de ces structures repose principalement sur le principes de remplissage
d'espace. Cependant, en plus des structures cristallines connues formées avec le
modèle de sphère dure, comme AlB2, NaZn13, NaCl en réseaux binaires, d'autres
phases telles que les types CuAu, Cu3Au et CaB6, ainsi que des structures quasi
cristallines ont également été découvertes, pour lesquelles les interactions entre
nanoparticules doivent être prises en compte.
Dans ce manuscrit, les récents progrés faits dans les procédés de synthèse et
l’étude des propriétés optiques des nanocristaux d'argent et leurs assemblages en
réseaux 2D / 3D seront examinées dans le Chapitre 1. Le Chapitre 2, se concentre
sur la réponse SPR des auto-assemblages 2D de nanocristaux sphériques d'argent et
d'or. Les bandes SPR observées dans les spectres d'absorption mesurés sont décrites et
comparées à celles calculées en utilisant la méthode d'approximation de dipôles
discrets (DDA). Les résultats semblables fournies par ces deux approches montrent
que les méthodes théoriques sont adaptées pour la simulation de réponse optique
linéaire de réseaux 2D de nanocristaux métalliques ultrafins et peuvent être utilisés
pour modéliser et prédire leurs réponses optiques. L'influence de l'agent stabilisant
des nanocristaux et leur influence sur la validité des simulations DDA est également
discutée. Le Chapitre 3 décrit les propriétés optiques de nanocrytaux argent dispersés

Ag nanocrystals differing by their coating agents: unexpected behaviors
vi
dans un solvant. La bande SPR de ces nanocristaux dépend non seulement du
diamètre des nanaocristaux, mais également de la nature de l'agent stabilisant. Dans le
Chapitre 4, la fabrication de films minces de supracristaux d'Ag et les propriétés
optiques des films obtenus avec des nanocristaux de différents diamètres et des agents
de stabilisation differents sont discutées. En comparant les spectres SPR de
nanocristaux d'Ag dispersés avec ceux des films supracrystallins correspondants,
d'importantes variations sont observées. La différence d'énergie (E), décrivant la
différence entre les positions des bandes SPR entre des nanocristaux dispersés et les
assemblages correspondants se révèle être principalement dépendante à la fois de la
taille des nanocristaux, mais aussi des distances entre particules à l'intérieur des films
supercristallins. Ces résultats montrent également un bon accord entre les propriétés
optiques simulées de réseaux 2D avec des données acquises avec des films minces 3D
assemblés en structures cristallines cfc. En outre, il est démontré que la distance
interparticulaire de nanocristaux modulée par la longueur de chaîne alkyle de l'agent
de stabilization peut aider à faire varier la position de la bande de SPR. Le Chapitre 5
est lié à la fabrication de réseaux de nanocristaux binaires. Des mélanges binaires de
nanocristaux colloïdaux contenant deux types distincts de nanocristaux, soit avec le
même agent de stabilisation, appelé système de ligand unique, ou avec deux
stabiliseurs différents, appelé système de ligands multiples, sont utilisés pour faire
croître les réseaux de nanocristaux binaires. Le mécanisme de formation de réseaux
de nanocristaux binaires Ag-Ag et l'effet de l'agent de surface sont discutés.

Abbreviations
vii
Abbreviations
2/3D two/three dimension or dimensional
AFM antiferromagnetic
a.u. arbitrary units
BNSLs binary nanoparticle superlattices
fcc face centered cubic
FFT Fast Fourier Transform
HRSEM high-resolution scanning electron microscopy
HRTEM high-resolution transmission electron microscopy
hcp hexagonal close packed
bcc body centered cubic
QC quasicrystals/quasicrystalline ordering
UV-vis ultraviolet visible spectroscopy
SPR surface plasmon resonance
SAXS small angle X-ray scattering
SEM scanning electron microscopy
STEM scanning transmission electron microscope/microscopy
TEM transmission electron microscope/microscopy
VDW Van der Waals

Ag nanocrystals differing by their coating agents: unexpected behaviors
viii

Contents
ix
Contents
Acknowledgements ....................................................................................................... i
Abstract ....................................................................................................................... iii
Résumé .......................................................................................................................... v
Abbreviations .............................................................................................................vii
Contents ....................................................................................................................... ix
Introduction .................................................................................................................. 1
Chapter 1 ...................................................................................................................... 5
1.1 Nanotechnologies and Nanocrystals, Introduction .............................................. 5
1.1.1 General Overview ......................................................................................... 5
1.1.2 Silver Nanomaterials ..................................................................................... 5
1.1.2.1 History and Prospect of Silver at Different Scales. ............................... 5
1.1.2.2 Applications of Ag at Different Scales .................................................. 6
1.2 Synthesis Strategies ............................................................................................. 7
1.2.1 General Synthesis Strategies of Nanocrystals ............................................... 7
1.2.2 Synthesis Strategies of Silver Nanostructures .............................................. 9
1.2.2.1 The need of Stabilization of Ag nanocrystals ........................................ 9
1.2.2.2 Synthesis Methods ............................................................................... 10
1.3 Optical Properties of Colloidal Nanocrystals .................................................... 13
1.3.1 SPR of silver nanoparticles ......................................................................... 15
1.4 Self-assemblies of Nanocrystals ........................................................................ 17
1.4.1 Application of Superlattices ........................................................................ 18
1.4.2 Two-dimensional (2D) nanocrystal superlattices ....................................... 18
1.4.3 Three-dimensional (3D) Nanocrystal Superlattices .................................... 19
1.4.3.1 General View on Formation Mechanism of 3D Superlattices ............. 20
1.4.3.2 Growth Methods .................................................................................. 20
1.4.4 Binary Nanocrystal Superlattices ................................................................ 22
1.4.4.1 General View on Formation Mechanism ............................................. 23
1.4.4.2 Growth Methods .................................................................................. 24
1.5 Optical Properties of Assemblies ....................................................................... 25
Chapter 2 .................................................................................................................... 27
Ag nanocrystals differing by their coating agents: unexpected behaviors
x
2.1 Abstract .............................................................................................................. 27
2.2 Article: Collective Surface Plasmon Resonances in Two-Dimensional
Assemblies of metal Nanocrystals: experiments and simulations ........................... 28
Chapter 3 .................................................................................................................... 45
3.1 Abstract .............................................................................................................. 45
3.2 Articles: Ag Nanocrystals : Effect of Ligands on Plasmonic Properties ........... 46
3.3 Supporting Information ...................................................................................... 61
Chapter 4 .................................................................................................................... 67
4.1 Abstract .............................................................................................................. 67
4.2 Article: Surface Plasmon Resonance of Silver Nanocrystals Differing by Sizes
and Coating Agents Ordered In 3D Supracrystals ................................................... 68
4.3 Supporting Information ...................................................................................... 86
Chapter 5 .................................................................................................................... 95
5.1 Abstract .............................................................................................................. 95
5.2 Article : Surface Chemistry Controls the Crystal Structures in Binary
Nanocrystal Superlattices ......................................................................................... 96
5.3 Supporting Information .................................................................................... 117
Bibliography ............................................................................................................. 133
List of publications ................................................................................................... 143
Introduction
1
Introduction
Nanomaterials, in their natural or engineered states, surrounds us and are
present in a variety of products and technologies with applications ranging from
advanced magnetic recording media, light emitting devices, to solar cells amongst
many others. In parallel to the development of various synthetic methods and
analytical techniques to produce and characterize them, a fundamental understanding
of the chemistry and physics of those nanomaterials has been reached over the last
few decades. Nanomaterials are known to be a new generation of advanced materials
exhibiting unusual chemical and physical properties due to the high surface-to-volume
radio that differs from those of bulk phase materials. Besides, the considerable
economical benefits are also a driving force in the number of studies in this field.
Recently, synthesis of high-quality metallic nanocrystals has been dramatically
improved. Several breakthroughs have been made in view of the producion of well-
defined nanoparticles via wet-chemistry methods, allowing furthter possibilities to
study and understand those materials. The surface ligands used in the synthesis of
high-quality nanocrystals are relatively important, they consist in most cases of a
small anchoring group with strong affinity with the metal for bounding onto the
surface of the nanocrystals, and a long hydrocarbon chain which provies steric and/or
electrostatic repulsions to stabilize the nanocrystals in suspension and counterbalance
Van der Waals attractive forces. Polymeric ligands or bulky bio-based molecules are
also employed for the synthesis and stabilization of nanocrystals. Silver, which is very
important coin metal, exhibits very specific optical properties at the nanometer scale,
making it a very interesting candidate for various applications. Hence, Ag at the
nanometer regime is widely investigated. Recently, silver nanocrystals with various
shapes and sizes have been synthesized and the properties of those silver
nanostructures are studied. However, silver nanocrystals with small diameters and
rather narrow distribution withour further size selection remains technically
challenging to produce, limiting the understanding of the physical properties, and
possible new discoveries related to this type of materials.
The organization of monodisperse colloidal particles has been a topic of
interest since the discovery of the iridescence of gem opals, which was attributed to

Ag nanocrystals differing by their coating agents: unexpected behaviors
2
diffraction of light from regular packed silica spheres. Furthermore, it has also been
found that silica spheres with two different sizes (Brazilian opal) can self-assemble
into complex binary structures. The performance of these assemblies is dictated by the
properties of individual nanocrystals as well as their mutual interactions. In the past
two decades, the formation of supracrystals composed of metals, semiconductors, or
magnetic nanoparticles have been investigated since the report of CdSe and Ag2S
superlattices in 1995 by Bawendi’s group. Later, those studies were extended to the
formation of binary nanocrystals superlattices made of two different types of
nanoparticles in a single materials, as first reported by Murray et al. in 2003. The
formation mechanism of single component nanocrystals is now relatively well
understood and can be described by a relatively simple hard-sphere packing model.
However, the formation of binary superlattices can yield to superlattices with different
phase diagrams with multiple close-packed and non-close-packed periodic phases.
Several thermodynamic forces can drive the formation of superlattices from
suspensions: all entropic force and the energetic force from the interparticle
interactions. It has also been shown that the type of solvent used during the
evaporation process leading to the formation of the superlattices is critical to the self-
assembly process. However, other parameters that affect the formation of binary
superlattices, such as the coating agents and electrostatic interactions are rarely
investigated.
The interesting colors of noble metal nanoparticles have attracted considerable
interest since historical times, as shown by their use as decorative pigments in stained
glasses and artworks for example. When the sizes of those materials are decreased to
the nanoscale regime, the tunable optical properties and associated fuctions such as
SERS response or fluorensence are dramatically changed, those properties have
attracted considerable interest and become a very promising topic. As firstly
demonstrated by Gustav Mie in 1908, the interaction of light with metal nanoparticles
results in the collective oscillation of the free electrons with the light field. From those
properties stems the apparition of a large light absorption, called Surface Plasmon
Resonnance (SPR). Several experiments and simulation works have shown that the
plasmon resonances are highly dependent on the nanocrystals size, shape,
environment dielectric constant, and their organization. All those parameters have an
influence on the position, profile and intensity of the SPR. Silver is partricularily
interesting for plasmonic applications, due to its intrinsic optical and electronic

Introduction
3
properties, and exhibit a relatively good quality factor with neglectable damping
effect in a large spectral region of the UV-visible spectra (from 300 nm to 1200 nm).
Moreover, silver is relatively cheaper than gold, making it a more suitable candidate
for the preparation of plasmonic materials at larger scale. Finally, the ligands that are
anchored on the nanoparticles’ surface to stabilize them against aggregation can also
modulate their SPR properties by modifying the dielectric constant of the silver
surface.
By assemblying the nanocrystals into two-dimensional or three-dimensional
superlattices, the coulpling of the electromagnetic fields between neighbouing
nanocrystals provide a tool that can be used to tune the plasmon resonances of the
assemblies. From previous simulation, it is known that 2D silver nanocrystal arrays
show an anisotropy in their optical properties. In this case, two resonaces
corresponding to transverse and longitudinal resonances can be obtained when the
incident electromagnetic (EM) field is perpendicular to the substrate, and only one
resonance is observed when the incident EM field is parallel to the substrate. These
properties are intrinsic to silver assemblies and do not exist for gold. So investigating
the collective optical properties of silver superlattices in order to gain an in-depth
understanding of those phenomena is of great importance.
The first part of this thesis will focus on the preparation and optical properties
of silver nanocrystals, their chemical and optical properties being significantly
affected by their sizes, ligands and ordering. Furthermore, simulations and
experimental works will be used to describe the optical properties of either silver or
gold 2D assemblies at different incident angles, the optical response of those
structures will be discussed in Chapter 2. In the third and fourth Chapters,
monodisperse silver nanocrystals coated with different types of coating agents and
exhibiting narrow size distributions will be used to show that the optical properties of
those assemblies are highly dependent on the ligand type and the size of the
nanocrystals. When the nanocrystals are assembled into thin 3D superlattices films,
the optical properties are in opposition with those observed for nanocrystals dispersed
in a solvent. In the last part of this thesis, report the role that the ligands play in the
assembly of nanocrystals and their ability to tune the superlattices structures types and
ultimately affect the optical properties of the final structure will be described.

Ag nanocrystals differing by their coating agents: unexpected behaviors
4

Chapter 1 State of the Art
5
Chapter 1
State of the Art
1.1 Nanotechnologies and Nanocrystals, Introduction
1.1.1 General Overview
Nanosciences and nanotechnologies have become a very important research field in
the last few decades and an increasing number of scientists have shown interests in this
relatively new topic. It can be said to have started on December 29th 1959, with Richard P.
Feynman’s lecture at the annual meeting of the American Physical Society, and his famous
statment: “ultimately-in the great future-we can arrange the atoms the way we want; the very
atoms, all the way down! What would happen if we could arrange the atoms one by one the
way we want them?”1 This now classic talk inspired the first research on new materials
organized at the nanoscale. Although it is nowadays still challenging for researchers to
arrange atoms exactly the way they intend in the solution phase, controlling the synthesis of
nanomaterials with different sizes and morphologies has now become much easier and an
important number of synthetic procedures, some of them being now used at industrial level,
have been developed. Compared to bulk materials, nanomaterials exhibit unique physical and
chemical properties due to their high surface-to-volume ratios. Hence, the detailed procedures
enabling a precise control over nanomaterials withe uniform sizes and shapes is a significant
question for researchers, and is still under investigation. 2-4
1.1.2 Silver Nanomaterials
1.1.2.1 History and Prospect of Silver at Different Scales.
Bulk silver (Ag), which was discovered approximate 3000 BC, is a relatively soft and
shiny metal. Its widest and well-known use is its utility as coinage metal. It is also known for
its widespread use in photography development because of the black color associated with the
large aggregates of Ag nanoparticles.5 Recently, with the increasing understanding of the
control of Ag at the atomic scale, applications of silver nanomaterials related to Ag in its

Ag nanocrystals differing by their coating agents: unexpected behaviors
6
nanocrystalline form have also emerged. Like most materials when their size is decreased in
the nanoscale, Ag exhibits a variety of unique properties that are drastically different from
those of their bulk state. The optical properties of Ag in this size rergime are particularily
interesting, thus, in an attempt to better understand and use those properties, preparation of
size-tunable plasmonic Ag nanocrystals, with controlled crystal structure has been studied.
Silver nanocrystals intrinsic properties are dependent on their size, shape, composition,
crystallinity and structure. It is to be noted that, from a structural point of view, bulk metallic
Ag and nanoscaled Ag materials both crystallize in fcc phase. 6
1.1.2.2 Applications of Ag at Different Scales
Silver is one the most important material in plasmonics since it offers many
advantages over Au, Cu, Li and Al for example, On a large spectral area and for spectra
across ranging from 300 to 1200 nm.7 The difficulties of manufacturing nanostructures and
the costs inherent to their production are also factors that determines the usefulness of a metal
for plasmonic application, especially for large-scale applications. Silver is cheaper than Au,
and even though it tends to oxidate, some synthetic methods have been developed to
overcome this issue.7
Furthermore, Ag materials are widely used for Surface Enhanced Raman Scattering
(SERS) applications since nanostructured silver have been discovered.8 Both theoretical
calculation and experimental measurements have shown that SERS properties are strongly
dependent on the exact morphology of silver nanostructures.9, 10 For example, by changing the
shape of silver nanoparticles from cubes to cube-octahedra to octahedral, the sensitivity of
SERS will dramatically increase.11
Silver also has the highest electrical conductivity and thermal conductivity amongst all
metals, resulting in the use of Ag as conductive fillers of conductive adhesives and thermal
interfacial materials in electronics.7 Ag nanowires are widely used in the electronics fields.12
Besides, silver nanomaterials also have potential applications in catalysis.1, 13 For
example, Linic et al. demonstrated that metallic silver nanostructures can release electrons
when irradiated with continuous-wave low-intensity visible light, thus enabling further
chemical reaction in the medium. These electrons can be used in tandem with thermal energy
to drive commercially relevant catalytic chemical transformation at viable rates, through
elementary reduced temperatures compared to those of pure thermal processes.14

Chapter 1 State of the Art
7
1.2 Synthesis Strategies
1.2.1 General Synthesis Strategies of Nanocrystals
Generally, two distinct approaches can be considered to synthesize nanomaterials. The
physical method of decreasing the size of an existing object (by laser ablation for example) is
known as the “top-down” method, and focuses on subdividing bulk materials into
nanomaterials. The second approach relies on chemical methods, and is known as the
“bottom-up” method; in this case, particles are grown from metal atoms in which solution
phase colloidal chemistry is often employed.13, 15-18 The bottom-up approach generally leads
to the production of finer materials with a better control over their sizes, size distributions and
shapes.
Many reaction parameters can be tuned in the bottom-up approach to control the size,
shape, and composition of the as-produced nanomaterials, such as selecting appropriate
reagents and stabilizers, modifying the reaction time, reaction temperature and the precursor
concentration, etc.2, 13, 19, 20 Numerous theoretical and computational methods have been
investigated to study the exact formation process of various nanomaterials. Based on these
theoretical works and experimental experiments, two steps have been recognized within the
formation of a nanomaterial: first, a nucleation step, followed by a growth process,1, 21-23 as
described in Figure 1.1. According to the nucleation and growth mechanism, a supersaturation
regime is needed to produce highly crystalline nanoparticles.24-26 Based on this theory, the
size and shapes of nanomaterials can be well-controlled by tuning the thermodynamic and
kinetic parameters of the synthesis system.17, 18, 22 However, the detailed nucleation and
growth mechanisms of nanocrystals are not yet completely understood, limiting the possibility
of controlling the formation of some materials.1

Ag nanocrystals differing by their coating agents: unexpected behaviors
8
Figure 1.1. LaMer model describing the nucleation and growth of nanocrystals as a function
of reaction time and concentration of precursor atoms. Reprinted from reference 23.
Despite a limited level of understanding of the growth process, several techniques
have been developed to produce metallic nanocrystals according to the nucleation and growth
mechanism over the last three decades. Those strategies mainly relies on two distinct
techniques: chemical reduction of metal salt precursors, and controlled decomposition of
organometallic compounds or metal-surfactant complexes.19 In 1857, Faraday reported the
fabrication of gold colloidal sol by reducing HAuCl4 by phosphorous.27, 28 Then Turkevich’s
group synthesized uniform 13-nm Au nanaoparticles by using sodium citrate as a reductant.29,
30 In 1991, Pileni’s group synthesized uniform silver nanocrystals from reverse micelles. In
this method, metal atoms (Ag) were linked to a surfactant (AOT) to form a precursor
(Ag(AOT)), and hydrazine was used as the reducing agent. After the nanocrystals formed
within the micelles, dodecanethiol, capping agent, was used to extract and stabilize the as-
formed nanocrystals from micellar solution.31 Later, this method was further developed to
produce Cu or Co nanoparticles.32, 33 In 1994, Brust’s group described a biphasic method of
producing 3nm gold nanoparticles.34 This method involves the phase tranfer of an organic
solution in a two-phase liquid/liquid system, followed by reduction with sodium borohydride
in the presence of the thiol stabilising ligand. In 2000, Alivisatos’ group used decomposition
methods, to produce either the CdSe quantum dots or CdSe nanorods by controlling the types
of ligands as well as the concentration of monomer.35 They also obtained Co nanocrystals by
thermal-decomposition of Co2(CO)8.36 Besides, this method can also be used to fabricate
alloyed FePt nanocrystals37 by using two precursor platinum bis(acetylacetonate) and Fe(CO)5.

Chapter 1 State of the Art
9
Regarding the synthesis of nanocrystals via thermal decomposition, two important
heating methods should be mentioned here: hot injection method and heating-up method (one-
pot). In 1993, Murray et al. used hot-injection methods to synthesize CdS or CdSe
nanocrystals with Me2Cd as precursor and trioctylphosphine oxide (TOPO) as solvent, which
provides a new method to synthesize monodisperse nanocrystals.13, 38 In the hot-injection
method (Figure 1.2), the fast injection of the precursor induces a high degree of
supersaturation, resulting in a short burst of nucleation.16 During the nucleation process the
precursor concentration in the solution decreases abruptly. The hot-injection method was
widely used later and further modified by many groups. In the so-called “heating-up” method,
the reaction solution is prepared at relatively low temperature. Subsequent heating initiates
the crystallization process, finally leading to the formation of nanocrystals.39 In 2005, Hyeon
group obtained Fe3O4 nanocrystals by heating-up (one-pot) method.40 By refluxing Fe crystal
seeds and Iron oleate in organic solvent the nanocrystal size can be tuned from 6-nm to 15-nm.
Figure 1.2. Experimental set-up and reaction scheme of the hot injection method. Reprinted
from reference 38.
1.2.2 Synthesis Strategies of Silver Nanostructures
1.2.2.1 The need of Stabilization of Ag nanocrystals
Most synthesis methods described above mention the need of a coating agent or
stabilizer, with different molecules being used for various types of materials. The first use of

Ag nanocrystals differing by their coating agents: unexpected behaviors
10
those coatings is to protect the nanostructures from aggregation. These coating molecules
introduce short-range steric repulsions and counterbalance the van der Waals attractive forces
that exist between particles.18 Therefore all synthetic approaches to stable metal colloids must
include astabilizing agents, which is generally adsorbed at the material’s surface.19 The
stabilizing agents are molecules of surfactant linked through covalent, coordinate, ionic bonds
or physically adsorbed on the nanocrystal surface. Furthermore, the surfactant can also play a
role in controlling the size of the nanocrystals.41 During nanocrystal growth in solution, the
surfactant can adsorb to the specific surface of the nanocrystal, decreasing the rate of
materials addition to the nanocrystal, resulting in smaller nanocrystal sizes. The stabilizers
most commonly used are electron-donor ligands, polymers and surfactant molecules. 16
For Ag nanocrystals, capping agents also play a very important role either for the
stabilization of the nanoparticles or for the shape control of Ag nanocrystals. The most
common capping agents used in polar solvent for the synthesis of Ag are PVP (polyvinyl
pyrrolidone), PEG (polyethylene glycol) and CTAB.7 In non-polar solvents, the most
common capping agents are dodecanethiol28, 42 and oleylamine.43, 44 These capping agents
have long hydrocarbon chains protecting the nanocrystals from aggregation. Dodecanethoil is
commonly used to protect noble metal (Au or Ag) nanostructures because the bonds between
sulfer head group is strong, making the nanoparticles stable.45, 46, 47
1.2.2.2 Synthesis Methods
According to the crystal nucleation and growth mechanism and the need for a coating
agent decribed above, the most common ways to prepare silver nanomaterials rely on the
reduction of a silver precursor using a suitable reducing agent, in the presence of a coating
agents that will stabilize the as-formed particles in appropriate conditions. During the
reducing process, zero-valence Ag is continuously provided to maintain a sustainable growth
of Ag nanoparticles. As long as more zero-valence Ag are produced, zero-valence Ag reach a
critical value of concentration and the zero-valence Ag can condense to form nuclei.23 AgNO3
is the most commonly used precursor. Chemical reducing agents, such as sodium borohydride,
alcohols, and sodium citrate, are typically used to reduce the dissolved Ag+ ions to Ag atoms,
which finally assemble into nanostructures.7
The synthesis of quasi-spherical Ag nanoparticles, such as icosahedral silver
nanocrystals, which has the lowest surface energy compared to other shapes is the most

Chapter 1 State of the Art
11
studied. Several methods are available to make this kind of nanomaterials in different size
ranges. The most common method in water solution is the reduction of AgNO3 by NaBH4,
which finally yields to Ag particles with a relatively narrow size distribution.7 Besides, Ag
colloids can also obtained via the reduction of citrate in an aqueous solution.48 Two other
relatively common methods to produce Ag nanocrystals rely on the reduction of AgNO3 with
hot oleylamine or ethylene glycol (EG). In these two methods, oleylamine and EG are used as
reducers, solvent to dissolve AgNO3 and the oleylamine is also used as capping agent.23, 49 For
instance, Peng et al. synthesized icosahedral Ag nanocrystals with very large-scale size
ranging from 2 nm to around 17 nm by reducing the AgNO3 in hot oleylamine (Figure 1.3-
a).43 Lim et al. synthesized silver nanospheres particles in EG by electrochemically-assisted
polyol process. In this method, PVP is electrochemically stable and facilitates the formation
of well-defined nanospheres of sizes around -11 nm (Figure 1.3-b).50 Besides, Pileni’s group
also prepared Ag nanoparticles around 5 nm in diameter by reverse micelles method with
dodecanethiol as capping agents (Figure 1.3-c).51
Recently, seeding growth approaches have become increasingly popular; they consist
in using preformed nanocrystals and smoothing them to subsequent growth.52, 53 This method
is highly versatile and can be used to manipulate the size, aspect ratio, and shape of the
resulting nanostructures. 54, 55
Ag nanostructures of different shapes have also been studied.56 There are many factors
that can be controlled to obtained Ag nanomaterials with varying structures, such as
controlling the concentration of silver precursor and the types of solvent; inducing the
presence of a soft or hard template, inducing a guest ions to adsorb to a particular crystal
plane.56 For example, Varma et al. fabricated silver nanorods (Figure 1.4-a) in PEG
(polyethylene glycol) using microwave irradiation and Ag nanoparticles can also be obtained
by modifying the ratio between PEG and Ag precursor.57 Sun et al. also fabricated nanocubes
in binary organic solvent mediated with DDAC (dimethyldistear-ammonium chloride) that
was used as a source to provide free Cl- ions (Figure 1.4-b).58 Carrol et al. fabricated silver
truncated, triangular nanoplates and circular nanodisks in the presence of CTAB (Figure 1.4-c)
7, 59 and Pileni et al. synthesized nanodisks by sonicating AgNO3 and hydrazine in the
presence of reverse micelles self-assembled from an AOT/isooctane/water system (Figure
1.4-d)60 . Sun et al. synthesized Ag nanowires as well as other 1D nanostructures derived from
Ag nanowires (Figure 1.4-e). 12

Ag nanocrystals differing by their coating agents: unexpected behaviors
12
Figure 1.3. Ag nanoparticles synthesized by different methods: (a) reduction of AgNO3 with
hot oleylamine; (b) electrochemical-assisted polyol process; (c) Ag nanoparticles prepared in
reverse micelles. Reprinted from references 43, 50 and 51, respectively.
Figure 1.4. Ag nanomaterials with different shapes: (a) nanorods; (b) nanocubes; (c)
nanoplates; (d) nanodisks; (e) nanowires. Reprinted from references 57, 58, 59, 60 and 12
respectively.

Chapter 1 State of the Art
13
1.3 Optical Properties of Colloidal Nanocrystals
When irradiated by an electromagnetic wave, metallic nanocrystals exhibit a very
large absorption band that stem from the free electrons at the metal surface resonatibng with
the incident photons. This effect is known as a Surface Plasmon Resonnance (SPR).
Plasmonics is related to the localization, guiding, and manipulation of electromagnetic
waves down to the nanometer-length scale.6, 7, 61, 62 Metals are key component in plasmonics
because they supports surface plasmon polariton modes. 63-65
Surface plasmons have been known for more than 160 years since Micheal Faraday
demonstrated their existence for the first time in 1857.27 Two types of plasmons can be
differenciated, that are two common types of plasmonic modes: localized surface plasmons
(LSPs) and propagating surface plasmons (PSPs).7 When metal nanoparticles are irradiated by
light at wavelengths much larger than the size of the metal nanoparticles, the surface electron
cloud is displaced with respect to the metal nuclei, generating a restoring force arising from
Coulomb attractions between electrons and nuclei. This kind of attraction leads to the
oscillation of the surface electron. At a special frequency the surface electrons are oscillating
coherently with the incident light, resulting in the plasmonic resonance, which is commonly
known as a localized surface plasmon resonance (LSPR) mode.66 (Figure 1.5-a) There are
several factors influencing the oscillation frequency: (1) the density of surface electrons; (2)
the effective electron mass (3) the shape and size of the charge distribution.64
In contrast, PSPs are supported by structures that have at least one dimension that
approaches the excitation wavelength, such as nanowires, as shown in Figure 1.5-b.6 In this
case, the electron field is not uniform across the structure and other effects must be considered.

Ag nanocrystals differing by their coating agents: unexpected behaviors
14
Figure 1.5. Schematic illustration of the two types of plamonic nanostructures: (a) Schematic
of plasmon oscillation for a sphere, showing the displacement of the conduction electron
charge cloud relative to the nuclei; (in this case, the nanostructure is smaller than the
wavelength of light) (b) the nanowire has one dimension much larger than the wavelength of
light. Reprinted from reference 66 and 7, respectively.
Since the plasmonic properties of a material are dependent on its size and shape,
nanostructures can be used as active components to guide and manipulate light. Compared to
other properties, plasmonic is a unique property of metal nanomaterials because plasmon
relies on light matter interactions. Therefore plasmoncis is a new subfield of nanoscale
science and technology that aims to understand the control light and metal nanostructures in
novel ways.67-70
There are several simulation works on the plasmonic properties of metal
nanoparticles.63, 64, 71, 72 As early as 1908, Gustave Mie developed an analytical solution to
Maxwell’s equation73 that described the extinction spectra (extinction = scattering +
absorption)74 of spherical particles of arbitrary sizes. Since then, many research groups
contributed to this pioneering work on simulation works of metal nanomaterials plasmon. For
example, Schatz’s group used efficient CG/FFT (Conjugate Gradient Solution with Fast
Fourier Trans- forms) methods for calculating coupled dipole optical response to the coupled

Chapter 1 State of the Art
15
nanosphere problem. They determined aspects of the structural basis for the UV-vis extinction
properties of DNA-linked nanoparticle aggregates.63 Guyot-Sionnest’s group synthesized
Au/Ag core/shell nanorods and subjected those to optical measurements. The longitudinal
plasmon resonance of core/shell nanorods was found to be blue shifted as the Ag layer
became thicker. They also used new energy-loss model to evaluate the extra damping of a
conduction electron in an arbitrary-shaped metal particle to explain the plasmonic results
observed.75
1.3.1 SPR of silver nanoparticles
As mentioned above, noble metallic nanoparticles, especially silver nanoparticles are a
very important material in plasmonics. Ag has the largest quality factor across most of the
spectrum from 300 to 1200 nm.76 In physical and engineering the quality factor is a
dimensional parameter that describes how under-damped an oscillation or resonators, are as
well as characterized a resonators’ bandwith relative to its center frequency. Compared to Au
and Cu that exhibit a rather broad and anisomerous plasmonic resonance due to damping
effect, the interband transitions of silver, that is the special area where electrons are excited
from the conduction band to higher energy levels, take place at much higher frequencies than
that of the LSPRs. That is why silver plasmon spectra show very narrow resonance band and
the shape of the band is much more symmetrical compared to other methods.76
It is worth noting that the most traditional approaches used to characterize the
plasmonic response of metal nanostructures is to measure their extinction spectrum using UV-
vis-NIR spectroscopies.77 Several calculations and experimental works reported that various
factors affect the plasmonic properties of silver nanostructures. First of all, the morphology of
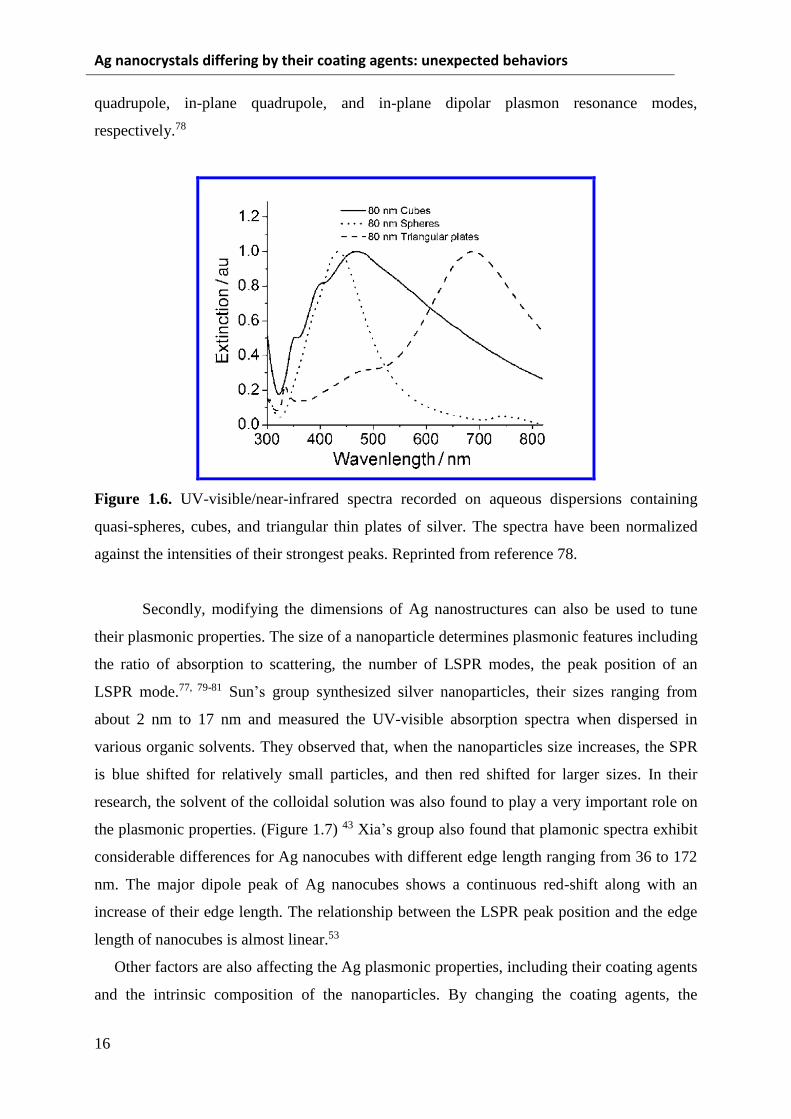
Ag nanocrystals is an important factor. For example, Xia’s group showed UV-visible
extinction spectra of three Ag nanostructures in aqueous media and containing silver spheres,
cubes, and triangular thin plates with almost the same sizes. (Figure 1.6) The silver
nanospheres exhibit one symmetric extinction peak centered at 430 nm due to the isotropic
symmetry of sphetical structures. However, cubic nanoparticles displayed three SPR peaks
located at 350, 400, and 470 nm, respectively. The spectra of triangular nanoplates displayed
three peaks at around 335, 470 and 690 nm. This phenomenon can be explained by theoretical
calculation carried out by Schatz’s group: these peaks correspond to the out-of-plane
Ag nanocrystals differing by their coating agents: unexpected behaviors
16
quadrupole, in-plane quadrupole, and in-plane dipolar plasmon resonance modes,
respectively.78
Figure 1.6. UV-visible/near-infrared spectra recorded on aqueous dispersions containing
quasi-spheres, cubes, and triangular thin plates of silver. The spectra have been normalized
against the intensities of their strongest peaks. Reprinted from reference 78.
Secondly, modifying the dimensions of Ag nanostructures can also be used to tune
their plasmonic properties. The size of a nanoparticle determines plasmonic features including
the ratio of absorption to scattering, the number of LSPR modes, the peak position of an
LSPR mode.77, 79-81 Sun’s group synthesized silver nanoparticles, their sizes ranging from
about 2 nm to 17 nm and measured the UV-visible absorption spectra when dispersed in
various organic solvents. They observed that, when the nanoparticles size increases, the SPR
is blue shifted for relatively small particles, and then red shifted for larger sizes. In their
research, the solvent of the colloidal solution was also found to play a very important role on
the plasmonic properties. (Figure 1.7) 43 Xia’s group also found that plamonic spectra exhibit
considerable differences for Ag nanocubes with different edge length ranging from 36 to 172
nm. The major dipole peak of Ag nanocubes shows a continuous red-shift along with an
increase of their edge length. The relationship between the LSPR peak position and the edge
length of nanocubes is almost linear.53
Other factors are also affecting the Ag plasmonic properties, including their coating agents
and the intrinsic composition of the nanoparticles. By changing the coating agents, the

Chapter 1 State of the Art
17
dielectric constant of the nanocrystals is varied. This phenomenon has also been proved by
many theoretical simulations.43, 63, 64, 82 Besides, several groups produced Ag/Au alloyed
nanoparticles, such as Ag/Au core-shell structures or Au/Ag hollow structures to manipulate
the optical properties.
Figure 1.7. Comparison of experimental and theoretically calculated absorption spectra. (A)
Experimental (dots) and theoretically predicted (lines) SPR peaks positions for Ag
nanoparitlces of various size dispersed in hexane (black), chloroform (red), and toluene (blue).
(B) Schematic illustration of the theoretical model: d represents the diameter of a Ag
nanoparticles, t is the thickness of the outermost atomic Ag layer with lowered conductivity,
and s is denoted as the thickness of the surfactant layer. Blue dots represent N atoms bonded
to the surface of the NP. This figure is reprinted from reference 43.
1.4 Self-assemblies of Nanocrystals
In nature, living systems often tend to self-organize in order to build larger and more
complex structures; this is nature’s preferred way of building and creating at various scales.
Self-assembly is the process in which isolated components organize autonomously and
spontaneously into ordered and functional structures in static and dynamic states.26 As we
know, the properties of colloidal inorganic nanoparticles are significantly dependent on the
nanoparticle’s sizes and morphologies. Fabricate more complicated structures made of
nanocrystals with different sizes and morphologies is highly necessary, which are expected to
lead to superstructures with a range of practical applications.83-85
1.4.1 Application of Superlattices

Ag nanocrystals differing by their coating agents: unexpected behaviors
18
To date, a large number of groups have succeeded in preparing various self-organized
superlattices. This growing interest is due to the fact that, compared to dispersed nanocrystals,
these superlattices show considerable changes in the physical properties of the whole
structures they form, due to that nanocrystals are all in close vicinity one form each other. 25,
26, 86, 87
For superlattices composed of metallic nanocrystals, such as silver, gold, and cobalt,
collective properties are attributed to dipole-dipole interactions. For example, Pileni’s group
measured by STM the electronic properties of very thick gold nanocrystals assembled into
superlattices. In this case, for a given nanocrystal, the conductance exhibits a slight additional
modulation superimposed on the collective conductance background that mimics the
Coulomb staircase structure normally associated with an isolated nanocrystal.88
Binary nanocrystal superlattices also showed outstanding collective physical
properties compared to either isolated nanocrystals or their corresponding single component
superlattices. For example, the collective plasmonic response of binary superlattieces
assembled with Au and Fe2O3 nanocrystals. In this system, the strength of near-field
couplings between adjacent plasmonic nanocrystals can be systematically engineered by
varying the NC size, composition and the lattice symmetry, leading to broadband spectral
tenability of the collective plasmonic response of superlattices across the entire visible
spectrum.89 In 2007, Murray’s group also presented for the first time that the electronic
measurements of multicomponent nanocrystal solid composed of PbTe and Ag2Te,
demonstrating synergistic effects leading to enhenced p-type conductivity.90
1.4.2 Two-dimensional (2D) nanocrystal superlattices
Over the last 20 years, a number of groups have succeeded in fabricating self-ordered
nanocrystals in two-dimensional closed-packed superlattices with a small number of defects
and at very large scale. These 2D superlattices self-assembled by inorganic nanoparticles
provide new possibilities of fabricating new solid-state materials and devices with novel
physical properties because the interactions between nanopariticles can generate new
collective phenomenon. 91-94
There are several dominating strategies to produce 2D self-assembled superlattices: (1)
Langmuir-Blodgett methods are well known procedures to generate 2D hexagonal closed-

Chapter 1 State of the Art
19
packed superlattices.95 This type of strategies was developped in the early 20th century by
Irving Langmuir and Katherine Blodgett. In this method, a Langmuir monolayer is held at
constant surface pressure while transferring it onto a solid substrate. Currently, this approach
has already been explored to fabricate closed-packed 2D films composed of nanomaterials
with different shapes. Tao et al. used Langmuire-Blodgett methods to fabricate 2D
superlattices assembled of silver nanowires and then subjected the sample to SERS
measurements.96 (2) There is another convenient way to prepare 2D superlattices: one-drop
colloidal solution of known concentration is deposited on the substrate and the evaporation
process occurs at the substrate surface.47 This method is easier and more flexible than LB
based procedures, but the superlattices obtained only exhibit local ordering, with some areas
containing multilayers. Other parameters that must also be considered are related to the
material itself, the particle-particle and the particle-substrate interactions.86, 91 For instance,
Pileni’s group successfully prepared 2D Cobalt self-assembled arrays with this method.86 (3)
Finally, liquid-air interfacial assembly approaches have become a popular method in recent
years to produce 2D superlattices.97 This method is a combination of modified LB and
evaporating method. Murray et al. used this method to prepare 2D superlattices with different
kind of nanocrystals. 2D superlattices films obtained in the centimeter-scale and transferable
for example.93
1.4.3 Three-dimensional (3D) Nanocrystal Superlattices
Similarily to 2D superlattices, controlled assembly of long range three-dimensional
(3D) superlattices with well-defined structures and desired types of NCs can lead to many
unique properties and their subsequent use in different applicatiomns, hence their production
has been a long-standing challenge.
The structures of 3D superlattices are similar to atoms in bulk phase metals and in
nanocrystals such as body centered cubic (bcc), face centered cubic (fcc) and also the
hexonganal close packed (hcp) structures. Amorphous structures of disordered nanoparticles
also exist. (Figure 1.8)25 When the fabrication conditions of these superlattices are well
controlled, the structures can be varied between the different types.51

Ag nanocrystals differing by their coating agents: unexpected behaviors
20
Figure 1.8. Schematic representation of sphere packing into (a) bcc, (b) fcc and (c) hcp. The
figures reprinted from reference 25.
1.4.3.1 General View on Formation Mechanism of 3D Superlattices
During superlattices growth in a solvent, the nanoparticles crystallize from the
suspension in order to achieve the thermodynamic equilibrium state, which results in the
minimum Gibbs free energy 98, 99 of the system. The Gibbs free energy changes (ΔG) at a
given temperature is as follows:
ΔG = ΔH-TΔS
where ΔH is the standard enthalpy of formation, ΔS is the standard entropy formation, and T
is the temperature in K. The energetic contribution ΔH accounts for the various types of
interactions (van der Walls force, Columbic force, dipolar interaction, etc) between
nanoparticles in the suspension, while the entropy changes during the self-assembly processes
are generally related to the sum of each nanoparticles’ free volumes in the system.22, 100, 101
Both entropy and isotropic van der Walls interactions should favor structures with high
packing densities, fcc and hcp. In the hard-sphere system, fcc is favored over hcp due to its
higher entropy, although the free energy difference is small. In addition, the solvent flow can
direct nanocrystals toward the fcc lattice. 25, 102
1.4.3.2 Growth Methods

Chapter 1 State of the Art
21
As mentioned above the mechanism of superlattices self-assembly is driven primately
by entropy, as well as a complex interplay of entropic and enthalpic components. Based on
quantitative reported data, two principal methods, which are similar as the method used for
2D superlattices, are applied to grow nanocrystal 3D superlattices: crystallization induced by
solvent evaporation and by adding a bad solvent.98, 103-105 The most common method is the
slow and controlled evaporation of the organic solvent, or even water, on a suitable surface.
As early as 2003, Pileni et al. produced supracrystals composed of Cobalt nanocrystals with
more than 1000 layers of organized nanocrystals (Figure 1.9-a).106 In this approach, particle-
substrate interaction plays an important role on the ordering of superlattices. When using
HOPG (Highly Oriented Pyrolitic Graphite) as a substrate instead of silicon wafer, the
ordering is improved. Later, the solvent-evaporating method was further modified by
Talapin’s group (Figure 1.9-c).101 They prepared superlattices with 11-nm FexO/CoFe2O4
nanocrystals. In this process, a beaker holding the substrate is tilted to an angle to avoid
coffee ring effect during the drying process. Besides, the solutions were evaporated under
vacuum controlled by a needle penetrating the cap of the closed beaker. By adjusting the
needle type, the evaporating rate can be controlled. With this method, the solvent can be
evaporated relatively fast under dynamic vacuum condition even when using a high boiling
point solvent. In 2010, Murray’s group applied a liquid-air interfacial method to make large-
scale 3D superlattices (Figure 1.9-b), as described in Section 1.4.2 on 2D superlattices
synthesis.97 In 2001, Rogach et al. demonstrated a new method named non-solvent method to
prepare 3D superlattices. They prepared supercrystals composed of CdSe nanocrystals by
slow diffusion of a non-solvent into a concentrated solution of CdSe nanocrystals, either
directly or through a buffer layer, resulting in nucleation of nanocrystals on the walls of tubes
and in the bulk of the solution. The buffer layer used here is low, but its solubility is not
negligible enough for nanocrystals. (Figure 1.9-d) 103, 107 This method can also be used to
grow supracrsyals in polar suspensions and the as-obtained supracrystals are well-shaped
crystals instead of films.

Ag nanocrystals differing by their coating agents: unexpected behaviors
22
Figure 1.9. Schematic illustrations of the set-ups used for the 3D superlattices preparation: (a)
slow evaporating solvent method;108 (b) liquid-air interface method;97 (c) modified solvent
evaporating method;101 (d) non-solvent method.103 Reprinted from reference 108, 97, 101, and
103, respectively.
1.4.4 Binary Nanocrystal Superlattices
Superlattices composed of nanocrystals with single component and morphology have
been extensively investigated. However, In recent years, the attentions have also been focused
towards bimetallic materials, that are superlattices composed of multi-components materials.
Those types of materials are known to exhibit novel properties that can be used in various
applications, so superlattices made of different types of nanocrystals with properties arising
from the controlled interaction of the different nanocrystals is a long standing challenge for
scientists.109-112 However, preparation of binary superlattices comes across many technical
difficulties and limitations. Previous multi-component nanocrystal assemblies usually resulted
in amorphous or short-rang-ordered structures.83 Besides, it is difficult to obtain superlattices
with only one structure.
Recently, a better understanding of the formation mechanism of superlattices has been
reached allowing the production of high-quality nanocrystals with controlled sizes and shapes;
those can now be routinely synthesized in a relatively large quantity, hence leading to the
facilitation of binary nanocrystal superlattices co-crystallization from suspension of two
nanocrystals with selected size ratios. Again, similarily to what is being observed for atoms,
many different types of binary superlattices structures can be made. The arrangement types of
superlattices and the interparticle distances, influencing the coupling effect between the
superlattices, can be well controlled. Thus binary superlattices containing two distinct type of

Chapter 1 State of the Art
23
nanocrystals provide new possibility to building materials with potentially novel chemical and
physical properties. 109-111
1.4.4.1 General View on Formation Mechanism
The formation mechanism of binary nanocrystal superlattices is a complex process, and is
still not yet well understood. It is widely recognized that the driving force of formation of
various binary structures can be explained by entropic considerations, similarly to single
component superlattices formation mechanism mentioned above.109, 113 However, other
factors involving Coulomb interactions from particles charges, Van der Waals interaction
forces or dipole-dipole interactions should also be taken into consideration. In the hard-sphere
model, the formation of binary superlattices is correlated to the configurational entropy and
free volume entropy, regardless of the energetic contribution. The system is expected to adopt
the crystal structure corresponding to the most efficient space filling system to reach the
maximization of packing density ρ for a given ratio of the sphere radii γ. Therefore, space
filling curves plotting the packing density ρ versus ratio of the sphere radii γ provides a good
estimate for entropic contribution.114-116
Figure 1.10. Space filling curves of various binary structures that have been observed in the
literature.

Ag nanocrystals differing by their coating agents: unexpected behaviors
24
1.4.4.2 Growth Methods
Based on series of data reported previously, it can be established that the growth of binary
superlattices is almost identicaly to that of single component nanocrystal superlattices.
Solvent evaporation method and liquid-air surface interface methods are the most used
strategies. For example, in 2003, O’Brien et al. used solvent evaporation methods to produce
3D binary superlattices composed of PbSe and Fe2O3 nanocrystals.83 In their system, the size
ratio of two different nanocrystals is a key factor for the structure of superlattices. By
modifying the size ratio between these two nanocrystals, various types of binary superlattices
were obtained. After this report, many researchers demonstrated the synthesis of binary
superlattices with different structure types by controlling the size ratio of composing
nanocrystals.85, 113, 117 It is worth noting that with this method, the nanocrystal concentrations
ratios between the large and small nanocrystals should also be precisely controlled in order to
get pure phase superlattices. For example, for a certain size ratio, an increase of smaller
nanocrsyatl relative concentration will lead to the AB13 type superlattices instead of AB2.
Later, in 2010, Murray’s group applied liqud-air interface method to co-crystallized
multicomponent nanocrystals into binary superlattices; with this method large-scale
membranes of long-range-ordered binary superlattices was achieved rapidly.118
As mentioned above, non-solvent method is efficient for single component systems to
generate well-shaped supracrystals. However, those methods were found to be unsuitable for
the growth of binary supracrystals. For example, when bad solvent was added into a
suspension containing a mixture of large PbSe and smaller CdSe nanocrystal, the nanocrystals
with different sizes crystallized separately, resulting in single component superlattices.119 This
phenomenon could be explained as follows: the nanoparticles’ potential is increased by
adding a bad solvent, thus the interactions between the nanoparticles are significantly
increased, which drives the nanoparticles to crystalize into supracrystals. Because the
nanoparticles potential increases with the ascending of particle diameter, the larger sized
nanoparticles will crystallize first due to the stronger thermodynamic driving force when bad
solvent was added. Until now, the growth of binary nanoparticle superlattice by adding bad
solvent into the mixed suspensions for non-polar solvent system remains challenging. If the
potential differences of two nanocrystals can be well controlled by adding bad solvent, it will
be possible to produce binary superlattices with this method. For example, in the aqueous
solvent, by adding a bad solvent, the Au and Ag nanocrystals can co-crystallize to get binary

Chapter 1 State of the Art
25
diamond-shaped superlattices. In this experiment, the Au and Ag nanocrystals have the same
sizes but with different charged ligands and the formation of this kind of supracrystals is the
consequence of electrostatic effects specific to the nanoscale.120
1.5 Optical Properties of Assemblies
The plasmonic properties of 2D or 3D superlattices show major changes compared to
isolated nanoparticles due to the collective dipolar interaction between the nanoparticles.121
Gwo et al. prepared large-area, highly ordered 2D superlattices of alkanethiolate-stabilized
gold nanoparticles onto quartz substrate with varying lattice constant, this can be controlled
by the alkyl chain lengths of their coating agents ranging from C12, C14, C16 to C18. These 2D
nanoparticle superlattices show strong collective surface plasmon extinction bands and
pronounced chain-length-dependent red shifts have been confirmed for synthesized
superlattices.122 Murray et al. studied the collective plasmonic response of self-assembled
binary nanocrystals superlattices using correlated optical microspectrophotometry and
electron microscopy over individual superlattices domains, which represent a versatile
platform for the rational design of microscopic 3D plasmonic metamaterials exhibiting
emergy optical chatateristics. There are also some simulation works focusing on the 2D or 3D
superlattices. For example, Pileni et al. worked on the DDA simulations of the optical
absorption of 5 nm spherical silver and gold nanoparticles arranged in hexagonally closed-
packed planar array; Ag showed two absorption bands of in increasing order of energy while
Au only show one absorption band.123 However, the study of plasmonic properties on 3D
silver superlattices and 3D silver binary superlattices are still rare, making it challenging to
understand the relationship between plasmonic properties and self-assembled nanoparticles.

Ag nanocrystals differing by their coating agents: unexpected behaviors
26

Chapter 2 Collective Surface Plasmon Resonances in Two-Domensional
Assemblies of Metal Nanocrystals : experiments and simulations
27
Chapter 2
Collective Surface Plasmon Resonances in Two-
Dimensional Assemblies of Metal Nanocrystals:
experiments and simulations
2.1 Abstract
In this Chapter, the plasmonic responses of two-dimensional (2D) assemblies of Ag or
Au nanocrystals coated with dodecanethiol are studied by measuring their UV-visible
absorption spectra in transmission at variable incidence angle, for three different NP
diameters (7 nm, 5 nm and 4 nm). The silver nanocrystals are synthesizd from reverse
micelles and the gold nanocrystals are obtained from modified Stuky’s method. The measured
spectra are compared to the results calculated using the discrete dipole approximation (DDA)
method. The anisotropy observed in the optical response is inherent to the planar geometry of
the close-packed arrangements and originates from the near-field coupling between
nanocrystals. In 2D assemblies of Ag nanocrystals, this coupling induces the splitting of the
collective surface plasmon resonance (SPR) absorption band into two components, namely,
the transverse and longitudinal modes. A good agreement between experiments and DDA
calculation can be obtained with only slight divergency that is probably due to the substrate
effect or the strong bonding between ligands and silver nanocrystals.
At variance, by replacing Ag by Au nanocrystals assemblies with average diameter,
coating agent and differing by the procedure used to produce them, no splitting is observed.
As already observed by DDA simulation this was attributed to the different intrinsic dielectric
properties of Au and Ag. Nevertheless disagreements are also obtained concerning the
longitudinal modes. This is attributed to the large amount present of the dodecanthiol
adsorbed both at the Au surface atoms and on the alkyl chains used as coating agent which are
origined from the synthesis method. This induces a significant increase of the damping effect
at the surface of the nanoparticle.

Ag nanocrystals differing by their coating agents: unexpected behaviors
28
2.2 Article: Collective Surface Plasmon Resonances in Two-Dimensional
Assemblies of metal Nanocrystals: experiments and simulations
Collective surface plasmon resonances in two-dimensional assemblies
of Au and Ag nanocrystals: Experiments and DDA simulation
J. J. Wei1,2, P. Yang1,2,$, H. Portalès1,2 and M.P Pileni1,2,3,*
1 UPMC - Sorbonne Universités, UMR 8233, MONARIS, 75005, Paris, France 2 CNRS, UMR 8233, MONARIS, 75005, Paris, France 3 CEA/IRAMIS, CEA Saclay, 91191, Gif-sur-Yvette, France $ Present address: School of Advanced Materials and Nanoscience, Xidian University, Xi’an,
710071, P. R. China
INTRODUCTION
Superstructures composed of nanosized particles ordered in close-packed
arrangements with programmable design are attracting many interests,1-4 especially by using
noble metal nanocrystals as building blocks in view of promoting tunable plasmonic
properties. As clearly established in previous studies, the characteristics of the localized
surface plasmon resonances (LSPRs) of such nanocrystals (NCs) depend on their composition,
shape, size and size distribution, local dielectric environment as well as their potential
electromagnetic coupling to other vicinal nanocrystals. In two-dimensional (2D) NC
arrangements, the near-field coupling between neighboring NCs was demonstrated to allow
for the coherent response of the nanocrystals and the emergence of collective optical
properties.5, 6 In this way, the 3D superstructures may exhibit neither the same properties as
that of the bulk phase materials, nor those of individual NCs, which enables the NC
superstructures to act as photonic crystals. These novel properties are promising for their use
in functional devices, thus motivating many efforts on their controllable, bottom-up
fabrication on large scale.7, 8

Chapter 2 Collective Surface Plasmon Resonances in Two-Domensional
Assemblies of Metal Nanocrystals : experiments and simulations
29
During this last decade, both experimental and theoretical studies were devoted to the
collective SPR in 2D assemblies of metal NCs. On the basis of reflectivity spectra of Ag NCs
self-assembled in 2D superstructures onto a graphite substrate exposed to p-polarized light
(polarization parallel to the incidence plane), collective optical properties were found from the
emergence of additional plasmonic features in their spectra compared to those of similar NCs
dispersed in solution.5, 9 Besides, the substrate effect on the reflectivity spectra of 2D self-
assemblies of Ag NCs was also investigated by using various substrates, namely, highly
oriented pyrolytic graphite (HOPG), gold, silicon, and Al0.7Ga0.3As. 10
Recently, using the discrete dipole approximation (DDA) method, the absorption
spectra of well-ordered 2D assemblies of ultrafine Ag and Au nanospheres were simulated for
different interparticle distances and incidence angles.11, 12 From these last calculations, optical
anisotropy of thin films of Ag nanospheres was distinctly observed through the emergence of
transverse and longitudinal modes for incidence angle larger than 30° and interparticle
distance not exceeding one nanosphere radius typically. Conversely, for identical
nanostructured films composed of Au nanospheres, only a shift without any splitting of the
SPR band was observed in the DDA calculated absorption spectra. Chen et al.6 reported on
the evolution of the optical response of highly ordered 2D superlattices of alkanethiolate-
stabilized Au NCs onto quartz substrate. By finely varying the lattice constant through the
change in alkyl chain length while keeping the metal core size unchanged, they demonstrated
their ability to tune the collective SPR extinction band via near-field coupling between
adjacent NCs. The extinction measurements performed on the 2D assemblies exhibited the
progressive blueshift of the SPR peak for increasing interparticle distance.6
Here, on the basis of both spectrophotometry measurements and computational
simulations of the absorption spectra, we conjointly study the plasmonic response from 2D
self-assemblies of either Ag or Au spherical NCs. The samples under investigation are
prepared by depositing dodecanethiolate-stabilized Ag or Au NCs with different diameters
ranging from 4-nm to 7-nm, onto a glass substrate where they self-assemble and form close-
packed planar arrangements. Through both experimental and numerical approaches, one
points out the tunability of the collective SPR in these Ag NC assemblies, as induced by the
near-field coupling between nanocrystals. The collective SPR bands observed in the measured
absorption spectra are described and compared to those calculated using the DDA method.
Ag nanocrystals differing by their coating agents: unexpected behaviors
30
EXPERIMENTAL AND SIMULATION METHODS
a. Synthesis of Ag and Au NCs and their 2D assemblies
The reverse micelle technique13 was used to synthesize Ag NCs with average diameters of 7.0
nm, 5.0 nm, and 3.9 nm. The nanocrystals were extracted with dodecanethiol from the
micellar solution and then were subjected to the ethanol-hexane wash cycles.14 Finally, the Ag
NCs were dispersed in hexane for use. Au NCs were synthesized by revisiting the Stucky’s
method.15
2D assemblies of Ag or Au NCs are produced as follows: 30 L of toluene was
deposited on a glass substrate, followed by the deposition of 20 L of metallic colloidal
solution (Ag or Au) onto the toluene surface. After the evaporation of the solvent, 2D
assemblies of NCs were formed on the glass substrate. In parallel, a drop of the colloidal
solution is deposited on a TEM grid to determine the nanocrystal size distribution. Typical
transmission electron microscopy (TEM) images of the synthesized NPs along with the size
distribution and interparticle distance histograms are shown in Figure 1 and Figure 2 for Ag
and Au NCs, respectively. Table 1 summarizes the average diameters and interparticle
distances determined by TEM analysis over a population of around 500 NCs. Simultaneously,
to the TEM experiments, the same amount of colloidal solution is deposited onto a glass
wafer to measure the optical properties of such assemblies.

Chapter 2 Collective Surface Plasmon Resonances in Two-Domensional
Assemblies of Metal Nanocrystals : experiments and simulations
31
a
b
c
e P
op
ula
tio
n
d
Po
pu
latio
n
f
Diameter (nm)
Po
pu
latio
n
h
Po
pu
latio
n
g
Po
pu
latio
n
i
pp (nm)
Po
pu
latio
n
Figure 1. (a-c) TEM images and (d-f) size distribution histograms of Ag NCs issued from
samples Ag-7, Ag-5 and Ag-4, from top to bottom. (g-i) Histograms of the border-to-border
interparticle distance, δpp. Each histogram was determined by TEM analysis over a population
of around 500 NCs. The scale bar is 20 nm.
Table 1. Average diameter, D, of Ag and Au NCs and border-to-border interparticle
distance, δpp, determined by TEM analysis. The relative interparticle distance, = δpp/D, is
also indicated.
Sample D (nm) δpp γ = δpp / 〈D〉
Ag-7 7.0 ± 0.6 2.0 ± 0.4 0.286 ± 0.063
Ag-5 5.0 ± 0.5 2.0 ± 0.3 0.400 ± 0.073
Ag-4 3.9 ± 0.4 1.9 ± 0.4 0.49 ± 0.12
Au-7 7.4 ± 0.5 2.3 ± 0.3 0.311 ± 0.046
Au-5 5.4 ± 0.4 1.7 ± 0.4 0.315 ± 0.078
Au-4 3.8 ± 0.3 1.6 ± 0.4 0.42 ± 0.12

Ag nanocrystals differing by their coating agents: unexpected behaviors
32
a
b
c
Po
pu
latio
n
e
d
Po
pu
latio
n
f
Po
pu
latio
n
Diameter (nm)
h
Po
pu
latio
n
g
Po
pu
latio
n
i
Po
pu
latio
n
pp (nm)
Figure 2. (a-c) TEM images and (d-f) size distribution histograms of Au NCs issued from
samples Au-7, Au-5 and Au-4, from top to bottom. (g-i) Histograms of the border-to-border
interparticle distance, δpp, determined by TEM analysis. The scale bar is 20 nm.
b. UV-visible absorption measurements
The UV-visible absorption measurements presented here were performed using a Varian Cary
5000 double monochromator recording spectrophotometer. To perform measurements in
transmission geometry at various angles of incidence, the spectrophotometer was equipped
with a Harrick Scientific (Pleasantville, NY) variable angle transmission accessory (VATA),
which has been specially designed for transmission studies of samples up to 3 mm thick. The
VATA allows a given sample and a blank, which should match the former in both thickness
and refractive index, to be placed in the light beam at the same angle of incidence, but in the
opposite orientation, in order to avoid any misalignment of the detected beam that could
affect the measured transmittance. A Glan-Taylor polarizer was also used in all our
Chapter 2 Collective Surface Plasmon Resonances in Two-Domensional
Assemblies of Metal Nanocrystals : experiments and simulations
33
measurements to polarize the light parallel to the plane of incidence. Under such a
configuration, information on the optical anisotropy of the sample can interestingly be
achieved by considering the fact that the electric field is then projected in both perpendicular
and parallel directions to the 2D assembly of nanocrystals.
c. Discrete dipole approximation method
The discrete dipole approximation (DDA) method16, 17 is used to simulate the optical response
of the NP assemblies. The DDA is a flexible and powerful method widely used to simulate
the scattering and absorption by nanometer-sized targets of chosen geometry and dielectric
properties.17-28 The principle and accuracy of the DDA method are described elsewhere.29 In
this work, the free software ‘DDSCAT 7.0’ is used to carry out the DDA calculations.30 As
illustrated in the inset of Figure 3, the 2D nanocrystal assembly is modeled as a planar
hexagonal arrangement of 91 regularly spaced and equally sized spheres. The relevance of
using this DDA target was already discussed in previous works.11, 12 For these calculations,
the refractive index of the surrounding medium is set to be that of dodecanethiol (n = 1.46)
which is used as coating agent to passivate the Ag and Au nanospheres. To account for the
finite size effects, the bulk dielectric functions of Ag and Au, as taken from Palik’s
handbook,31 are size-corrected following the procedure described elsewhere.32, 33 The DDA
absorption spectra of Ag and Au nanospheres films are calculated for various incidence
angles ranging from 0° to 60°.
Ag nanocrystals differing by their coating agents: unexpected behaviors
34
RESULTS AND DISCUSSION
Experiments and calculated optical properties are compared for three different NC sizes (7 nm,
5 nm and 4 nm). The use of dodecanethiol molecules as coating agent makes the interparticle
distance in the assembly to be around 2 nm. The absorption spectra of the 2D assemblies of
nanocrystals, deposited on glass wafer substrate, were recorded at various incidence angles
ranging from 0o to 60o. Graphs in Figure 3a-c show the SPR absorption spectra of 2D
assemblies composed of Ag NCs issued from samples Ag-7, Ag-5 and Ag-4. For sample Ag-7
(Figure 3a), the absorption spectra exhibit an intense absorption band around 478 nm (2.59 eV)
corresponding to the in-plane (longitudinal) SPR mode. On increasing the incidence angle, the
maximum wavelength of the SPR band remains unchanged while a shoulder grows up from
its low-wavelength side, at around 376 nm (3.30 eV). The presence of an isosbestic point at
388 nm (3.20 eV) underlies the mutual contributions of the transverse and longitudinal SPR
modes in the measured absorption band. Graphs in Figure 3d-f show the DDA absorption
spectra calculated to simulate the 2D ordered assembly of Ag spheres at various incidence
angles and for different diameters, while fixing the border-to-border interparticle distance to
δpp = 2 nm, for coherence with the experimental data. In the assembly of 7 nm spheres, the
longitudinal SPR peak is centered at 460 nm (2.70 eV) and one still distinctly observes an
isosbestic point on increasing the incidence angle, at 400 nm (3.10 eV). The transverse SPR
mode is centered at 364 nm (3.41 eV) and progressively grows up by increasing the incidence
angle. Experimental and simulated SPR spectra exhibit similar features and are therefore in
good qualitative agreement. Note that a broadening of the SPR band is observed in the
experimental spectra compared to the calculated ones. This broadening mostly originates from
the size and interparticle distributions of the nanocrystals used to produce the 2D assemblies
(Table 1).
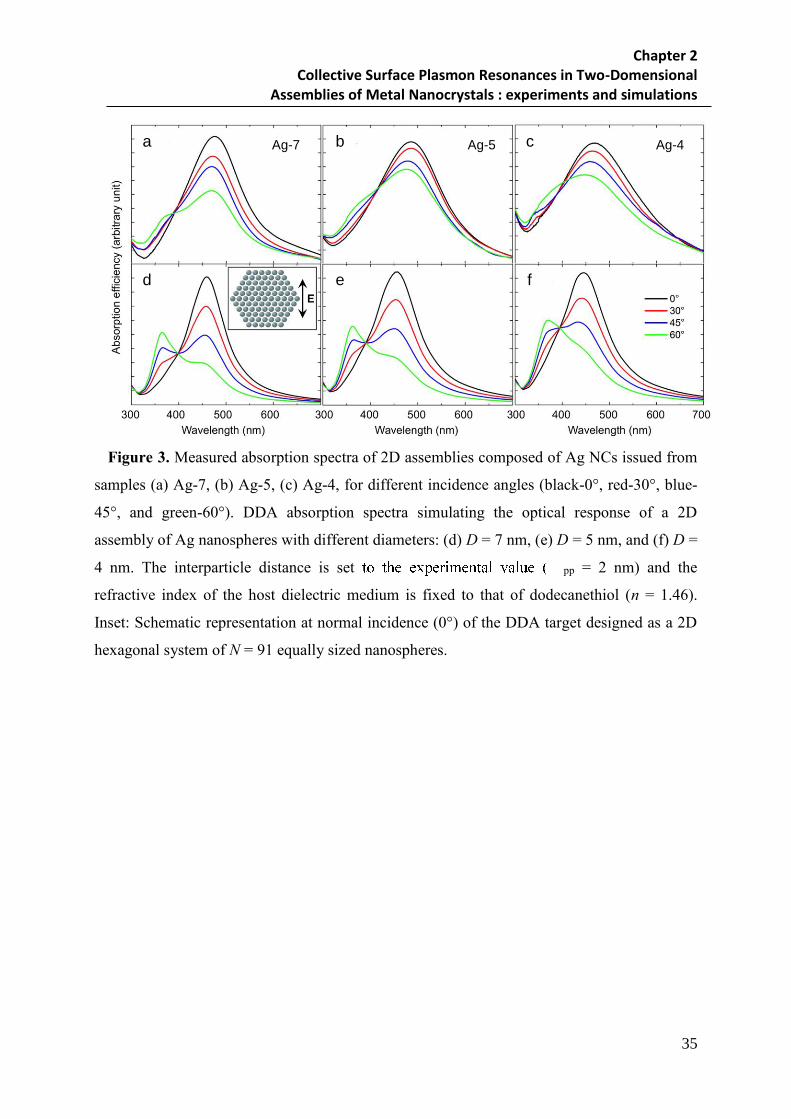
Chapter 2 Collective Surface Plasmon Resonances in Two-Domensional
Assemblies of Metal Nanocrystals : experiments and simulations
35
b a c
d e f
Ag-7 Ag-5 Ag-4
Figure 3. Measured absorption spectra of 2D assemblies composed of Ag NCs issued from
samples (a) Ag-7, (b) Ag-5, (c) Ag-4, for different incidence angles (black-0°, red-30°, blue-
45°, and green-60°). DDA absorption spectra simulating the optical response of a 2D
assembly of Ag nanospheres with different diameters: (d) D = 7 nm, (e) D = 5 nm, and (f) D =
4 nm. The interparticle distance is set pp = 2 nm) and the
refractive index of the host dielectric medium is fixed to that of dodecanethiol (n = 1.46).
Inset: Schematic representation at normal incidence (0°) of the DDA target designed as a 2D
hexagonal system of N = 91 equally sized nanospheres.

Ag nanocrystals differing by their coating agents: unexpected behaviors
36
Figure 4. Deconvolution of the longitudinal and transverse SPR modes (dotted curves)
achieved for three different samples: (a) Ag-7, (b) Ag-5, and (c) Ag-4. The experimental
absorption spectra (red curve) were recorded fixing the incidence angle to 60°.
To go further in the examination of the spectra and taking advantage from the presence
of the aforementioned isosbestic point, we quantitatively assessed the longitudinal and
transverse energy modes. In this aim, we fitted the structured SPR absorption band using two
component bands with a lorentzian profile. Figure 4 shows the deconvolution of the
longitudinal and transverse SPR contributions in the absorption spectra of three different
samples recorded using an incidence angle of 60°. In parallel, Table 2 compares for all
samples the longitudinal and transverse SPR mode energies as deduced from such a
deconvolution of the structured band in both experimental and measured absorption spectra.
Concerning the sample Ag-7, the mismatch E// between the measured and calculated

Chapter 2 Collective Surface Plasmon Resonances in Two-Domensional
Assemblies of Metal Nanocrystals : experiments and simulations
37
longitudinal SPR mode energies does not exceed 0.06 eV and E = 0.10 eV for the
transverse mode. It should also be noticed that the SPR bands in the calculated spectrum
exhibit a slight but systematic blue-shift as compared to the experimental ones. This behavior
primarily originates from the discrepancy between the dielectric constants of the real system
(metal NCs + host medium) and those used in the DDA calculations where, in particular, the
substrate was not taken into account. Moreover, in the samples, the structural parameters such
as the interparticle spacing and the NC size are dispersed (see uncertainties in Table 1) around
average values that were considered in the simulations.
Table 2. Comparison of the experimental longitudinal (E//) and transverse (E) SPR mode
energies to those issued from the DDA calculated spectra.
SPR energy Ag-7 Ag-5 Ag-4 Au-7 Au-5 Au-4
E//exp (eV) 2.64 2.59 2.61 2.20 2.20 2.25
E//DDA (eV) 2.70 2.73 2.77 2.38 2.36 2.38
Eexp (eV) 3.31 3.30 3.27 NA NA NA
EDDA (eV) 3.41 3.40 3.35 NA NA NA
Note: “NA” means “not available”
Figure 5. Experimental (black squares) and calculated (red dots) energies of the longitudinal
(E//) and transverse (E) SPR modes in 2D assemblies of Ag NCs plotted versus the relative
interparticle distance, γ = δpp / D characterizing the samples Ag-7, Ag-5 and Ag-4. For
clarity, error bars are not shown on the graph.

Ag nanocrystals differing by their coating agents: unexpected behaviors
38
On decreasing the NC size, one observes the broadening of the SPR absorption band in both
experimental and simulated spectra. This effect related to the well-known 1/D-size
dependence of the SPR damping time32 appears to be more pronounced in the experimental
spectra. This behavior probably results from the decrease in the van der Waals interactions
between NCs for decreasing the NC size and, consequently, the worst capacity of
nanocrystals to closely self-assemble. The distributions in both NC size and interparticle
distance may also contribute to the broadening of the SPR bands, thus favoring the
convolution of the two SPR modes. Figure 5 illustrates the variation on the relative
interparticle distance of the longitudinal and transverse SPR mode energies as deduced for 2D
assemblies of Ag NCs from both experimental and DDA absorption spectra. The
overestimation of around 0.10 eV of the calculated energies with respect to the experimental
ones is likely to arise from not taking into account the substrate when designing the DDA
target used in our calculations. Moreover, the SPR characteristics of dodecanethiol molecules
capped Ag NCs are also sensitive to the coating agent. The ligands-metal chemical
interactions affect the coherent oscillation of conduction electrons within the nanocrystals33-35
by inducing an additional “interface” damping of the electron oscillations, thus modifying the
effective refractive index at the near-field of the nanocrystals. As a matter of fact, due to these
chemical interactions, a lowered electron conductivity in the outermost atomic Ag layer was
invoked to explain the red-shift of the SPR band observed for decreasing the Ag NC diameter
from 12 to 2 nm.36 Such lowering of the electron conductivity originating from the
interactions of the NCs with the capping molecules was not taken into account in the DDA
simulations presented in this work. In spite of these approximations, as seen from the values
reported in Table 2 and their plots in Figure 5, our experimental assessment of the SPR
energies reasonably agrees with the DDA results.

Chapter 2 Collective Surface Plasmon Resonances in Two-Domensional
Assemblies of Metal Nanocrystals : experiments and simulations
39
b a c
d e f
Au-7 Au-5 Au-4
Figure 6. Measured absorption spectra of 2D assemblies composed of Au NCs issued from
samples (a) Au-7, (b) Au-5, (c) Au-4. The absorption spectra were recorded using the
following incidence angles (from top to bottom in each graph): black-0°, red-30°, blue-45°,
and green-60°. Calculated absorption spectra of a 2D assembly of Au nanospheres of different
diameters: (e) D = 7 nm, (f) D = 5 nm, and (g) D = 4 nm. The border-to-border interparticle
spacing is set to the constant value pp = 2 nm, and the refractive index of the dielectric
medium surrounding the nanospheres is fixed to that of dodecane (n = 1.46).
Let us go further in this study looking at the optical response of 2D assemblies of Au NCs.
Graphs in Figure 6a-c show the SPR absorption spectra of such Au NCs assemblies on a glass
wafer. These absorption spectra are dominated in the visible domain by an intense band
corresponding to the collective SPR of the system. Conversely to the observations described
above for Ag NCs, the longitudinal SPR peak remains unchanged for any NC sizes and no
residual peak is observed on increasing the incidence angle of the irradiation light. No
splitting between the longitudinal and transverse collective SPR modes is detectable. Even
though the size distributions of Au NCs are narrower than those of Ag NCs, the SPR band in
the experimental spectra is much broadened than the calculated ones presented in Figure 6d-f.
The spectra calculated for nanosphere diameters of 4-nm, 5-nm and 7-nm, while still setting
the interparticle distance to 2-nm, show a blue-shift of the SPR band on increasing the
incidence angle. In a previous work,12 the SPR band profile (amplitude and position) of a 2D
assembly of 5-nm Au NCs was observed to change on varying the interparticle distance. This
change in the SPR band profile was attributed to the increasing contribution in the absorption
Ag nanocrystals differing by their coating agents: unexpected behaviors
40
spectrum of the transverse SPR mode on progressively rotating the planar array from in-plane
to out-of-plane configuration. Probable reasons for not observing similar change in the
recorded SPR band profile of 2D assemblies of Au NCs relate, as mentioned above, to the
significant SPR broadening as well as to the technical limitation in varying the incidence
angle, knowing that this latter cannot exceed 60° with our setup. Due to this lack in
completely reproducing the same configuration in the experiments as compared to the
simulated one, measured and calculated absorption spectra of 2D assemblies of Au NCs do
not exhibit the same trends on increasing the incidence angle. In particular, the slight blue-
shift of the SPR band observed in the simulation for increasing the incidence angle is not
detectable in the recorded absorption spectra.
CONCLUSION
Two different chemical routes have been applied to synthesize colloidal Ag and Au NCs
whose average size ranges between 4 and 7 nm. After deposition onto a glass wafer, these
nanocrystals self-organize in thin layer films where interparticle spacing is short enough to
promote near-field coupling between nanocrystals and the emergence of collective optical
properties. The UV-visible absorption spectra of 2D assemblies of Ag and Au NCs are
recorded at various incidence angles. In 2D assemblies of Ag NCs, due to the optical
anisotropy of the system, the SPR absorption band splits in two contributions, namely, the
longitudinal and transverse SPR modes. For Ag NCs, these features are satisfactorily
reproduced in the absorption spectra calculated using the DDA method. At variance, in
similar assemblies of Au NCs, only one SPR band is observed whatever the incidence angle
and NC size. The transverse SPR mode is difficult to observe experimentally, partially due to
the strong ligands-metal interactions that lower the electron conductivity in the outermost
metal atomic layer of the nanocrystals. These findings allow further using the DDA method to
simulate more complex systems, especially binary and/or bimetallic NP superlattices that are
made of building blocks of two different compositions and/or sizes.
ACKNOWLEDGEMENTS
Thanks to N. Goubet for providing the colloidal solutions used to prepare the 2D
assemblies of Au nanocrystals and for fruitful discussion. This research has been supported

Chapter 2 Collective Surface Plasmon Resonances in Two-Domensional
Assemblies of Metal Nanocrystals : experiments and simulations
41
by the advanced grant of the European Research Council under n° 267129. J. J. W. thanks
the China Scholarship Council for financial support.
REFERENCES
(1) Mirkin, C. A.; Letsinger, R. L.; Mucic, R. C.; Storhoff, J. J. Nature 1996, 382, 607-609.
(2) Korgel, B. A.; Fullam, S.; Connolly, S.; Fitzmaurice, D. J. Phys. Chem. B 1998, 102,
8379-8388.
(3) Song, R. -Q.; Cölfen, H. Adv. Mater. 2010, 22,1301-1330.
(4) Liao, C.-W.; Lin, Y.-S.; Chanda, K.; Song, Y.-F.; Huang, M. H. J. Am. Chem. Soc. 2013,
135, 2684-2693.
(5) Taleb, A.; Russier, V.; Courty, A.; Pileni, M. P. Phys. Rev. B 1999, 59, 13350.
(6) Chen, C. F.; Tzeng, S. D.; Chen, H. Y.; Lin, K. J.; Gwo, S. J. Am. Chem. Soc. 2008, 130,
824-826.
(7) Park, S. Y.; Lytton-Jean, A. K. R.; Lee, B.; Weigand, S.; Schatz, G. C.; Mirkin, C. A.
Nature 2008, 451, 553-556.
(8) Corricelli, M.; Depalo, N.; Fanizza, E.; Altamura, D.; Giannini, C.; Siliqi, D.; Di Mundo,
R.; Palumbo, F.; Kravets, V. G.; Grigorenko, A. N.; Agostiano, A.; Striccoli, M.; Curri, M. L.
J. Phys. Chem. C 2014, 118, 7579-7590.
(9) Liu, Y.; Begin-Colin, S.; Pichon, B. P.; Leuvrey, C.; Ihiawakrim, D.; Rastei, M.;
Schmerber, G.; Vomir, M.; Bigot, J. Y. Nanoscale 2014, 6, 12080-12088.
(10) Pinna, N.; Maillard, M.; Courty, A.; Russier, V.; Pileni, M. P. Phys. Rev. B 2002, 66,
045415.
(11) Portalès, H.; Pinna, N.; Pileni, M. P. J. Phys. Chem. A. 2009, 113, 4094-4099.
(12) Yang, P.; Portalès, H.; Pileni, M. P. Phys. Rev. B 2010, 81, 205405.

Ag nanocrystals differing by their coating agents: unexpected behaviors
42
(13) Pileni, M. P. J. Phys. Chem. 1993, 97, 6961-6973.
(14) Taleb, A.; Petit, C.; Pileni, M. P. Chem. Mater. 1997, 9, 950-959.
(15) Goubet, N.; Richardi, J.; Albouy, P.-A.; Pileni, M. P. Adv. Funct. Mater. 2011, 21,
2693-2704.
(16) Purcell, E. M.; Pennypacker, C. R. Astrophys. J. 1973, 186, 705-714.
(17) Draine, B. T.; Flatau, P. J. J. Opt. Soc. Am. A. 1994, 11, 1491-1499.
(18) Zhao, J.; Pinchuk, A. O.; McMahon, J. M.; Li, S. Z.; Alisman, L. K.; Atkinson, A. L.;
Schatz, G. C. Acc. Chem. Res. 2008, 41, 1710-1720.
(19) Yang, P.; Portalès, H.; Pileni, M. P. J. Phys. Chem. C 2009, 113, 11597-11604.
(20) Zhu, J.; Li, F. K. Eur. Phys. J. B 2011, 80, 83-87.
(21) D'Agostino, S.; Sala, F. D. J. Phys. Chem. C 2011, 115, 11934-11940.
(22) Yang, P.; Portalès, H.; Pileni, M. P. J. Chem. Phys. 2011, 134, 024507.
(23) Alsawafta, M.; Wahbeh, M.; Truong, V. V. J. Nanomater. 2012, Vol. 2012, 283230.
(24) Blaber, M. G.; Henry, A. I.; Bingham, J. M.; Schatz, G. C.; Van Duyne, R. P. J. Phys.
Chem. C 2012, 116, 393-403.
(25) Xu, X. B.; Yi, Z.; Li, X. B.; Wang, Y. Y.; Geng, X.; Luo, J. S.; Luo, B. C.; Yi, Y. G.;
Tang, Y. J. J. Phys. Chem. C 2012, 116, 24046-24053.
(26) Xu, X.-B.; Yi, Z.; Li, X.-B.; Wang, Y.-Y.; Liu, J.-P.; Luo, J.-S.; Luo, B.-C.; Yi, Y.-G.;
Tang, Y.-J. J. Phys. Chem. C 2013, 117, 17748-17756.
(27) Lermé, J.; Bonnet, C.; Broyer, M.; Cottancin, E.; Manchon, D.; Pellarin, M. J. Phys.
Chem. C 2013, 117, 6383-6398.
(28) Lyamkina, A. A.; Moshchenko, S. P. J. Phys. Chem. C 2013, 117, 16564-16570.
(29) Yurkin, M. A.; De Kanter, D.; Hoekstra, A. G. J. Nanophotonics 2010, 4, 041585.

Chapter 2 Collective Surface Plasmon Resonances in Two-Domensional
Assemblies of Metal Nanocrystals : experiments and simulations
43
(30) Draine, B. T.; Flatau, P. J., User Guide for the Discrete Dipole Approximation Code
'DDSCAT 7.0'. In 2008.
(31) Palik, E. D., Handbook of Optical Constants of Solids. Academic Press: New York,
1985.
(32) Hövel, H.; Fritz, S.; Hilger, A.; Kreibig, U.; Vollmer, M. Phys. Rev. B 1993, 48,
18178-18188.
(33) Coronado, E. A.; Schatz, G. C. J. Chem. Phys. 2003, 119, 3926-3934.
(34) Kelly, K. L.; Coronado, E.; Zhao, L. L.; Schatz, G. C. J. Phys. Chem. B 2003, 107,
668-677.
(35) Peng, S.; McMahon, J. M.; Schatz, G. C.; Gray, S. K.; Sun, Y. Proc. Natl. Acad. Sci.
USA 2010, 107, 14530-14534.

Ag nanocrystals differing by their coating agents: unexpected behaviors
44
Chapter 3 Ag Nanocrystals : Effect of Ligands on Plamonic Properties
45
Chapter 3
Ag Nanocrystals : Effect of Ligands on Plasmonic
Properties
3.1 Abstract
In this part, silver nanocrystals (NCs) stabilized using amine terminated coating agents
(oleylamines), their size ranging between 2 and 12 nm in diameter, are synthesized by hot
injection methods and one-pot method. Their dispersion in size is relatively low (typically
below 10%) without the need of post-synthesis size segregation process. Here 2.2-nm
nanocrystals are synthesized by adding two coating agents: oleylamine and oleic acid, and
then wash away the oleic acid by toluene-ethanol washing cycle with additional oleylamine.
Similarly, by using dodecylamine instead of oleylamine, 3 – 7 nm nanocrystals coated with
dodecylamine can also obtained with a rather narrow distribution (< 10%). The amine
terminated coating agents is replaced by thiol terminated molecules (dodecanethiol or
hexadecanethiol) by ligand exchange, allowing the formation of alkanethiols coated Ag
colloids. All NCs with various surface coatings are dispersed in toluene.
Regardless of the nature of the coating agent, the surface plasmon resonance (SPR) is
red-shifted and the bandwidth is increased with decreasing the NC size. For a given size, the
SPR peak of thiol-stabilized NCs is shifted to lower energies compared to that of amine-
stabilized NCs. Core-shell theory in this study are used to explain the plasmon divergencies of
these nanocrystals with different coating agents and sizes. Furthermore, with thiol-stabilized
Ag NCs, the position of the SPR peak was found to be sensitive to the length of the alkyl
chains of the coating agent, whereas minor differences is detected for Ag NCs coated with
amine-terminated with differing alkyl chain lengths.
Ag nanocrystals differing by their coating agents: unexpected behaviors
46
3.2 Articles: Ag Nanocrystals : Effect of Ligands on Plasmonic Properties
Ag Nanocrystals: 1. Effect of Ligands on Plasmonic Properties
Jingjing Wei 1,2, Nicolas Schaeffer 1,2, Marie-Paule Pileni1,2,3 *
1- Sorbonne Universités, UPMC Univ Paris 06, UMR 8233, MONARIS, F-75005,
Paris, France
2- CNRS, UMR 8233, MONARIS, F-75005, Paris, France
3- CEA/IRAMIS, CEA Saclay, 91191, Gif-sur-Yvette, France
* Corresponding author: [email protected]
Keywords: Ag nanocrystals; SPR; ligand; nanocrystal size
INTRODUCTION
Metallic nanocrystals (NCs) stabilized by a monolayer of organic coating agent have
attracted growing interest during the last few decades due to their size- and shape-dependent
physical properties, making them potential candidates for the design of new functional
materials.1-3 The main role of the organic layer anchored to metallic core is to avoid
coalescence between the NCs in solution and counterbalance the Van der Waals attractive
forces. This layer also governs the physical properties of the NCs surface.1 The coating agent
is usually a relatively large organic molecule or polymer bearing one or more anchoring group
for bonding onto the surface of the NCs.4, 5 Functional groups such as thiols, amines, or
silanes are routinely used to prepare stable metallic NCs and a handful of efficient synthetic
procedures have been developed for the production of NCs. In some cases, the NC size and
shape can be controlled through changes in the nature or amount of coating agent. Thus,
optimization of the NCs properties in view of specific applications requires careful
considerations when choosing the nature of the coating agent.6

Chapter 3 Ag Nanocrystals : Effect of Ligands on Plamonic Properties
47
The optical properties of noble-metal NCs have fascinated scientists because they
exhibit a strong surface plasmon resonance (SPR) effect that is characteristic of the size
regime at the nanoscale, hence making them potentially interesting units for designing optical
devices,7 or for optical energy transport applications,8, 9 and surface-enhanced Raman
scattering (SERS) spectroscopy.10-14 This SPR results from the collective resonance
oscillation of conduction electrons upon light irradiation.15-17 As reported previously, the
oscillation frequency is dependent on several factors, such as the density of electrons and the
shape and size of the charge distribution.16, 18, 19 Thus, in order to fully understand the optical
properties of noble-metal NCs, different parameters must be considered: the type of material,
the size and shape of the NCs, the dielectric properties of the solvent, the nature of the
stabilizing agent, and the possible inter-particle coupling interactions.20-23 For example,
extinction spectra of gold nanorods exhibit two plasmon bands that correspond to longitudinal
and transverse SPR respectively.21, 24 In the case of spherical NCs, size-dependent surface
plasmon resonances have been studied; Peng et al. 25 reported a gradual blue-shift of the SPR
absorption band when decreasing Ag NCs size down to 12 nm, followed by a strong red-shift
when decreasing the size further. In the case of Ag NCs, various reports describe their size- or
shape- dependent optical properties. However, only a handful of investigations have included
an in-depth study of the influence of the coating agent on these optical properties. 26-29
Here, we report the synthesis of Ag NCs of various sizes using different coating agents,
all the specimens being characterized by a low size distribution (<10%) without the need of
size selection process. The optical properties of these Ag NCs dispersed in toluene differing
by their sizes or coating agents is studied. For a given coating agent, a size-dependent shift in
the SPR occurs. Furthermore, for a given NCs size, the SPR shift is observed to be dependent
on the type of coating agent. For NCs coated with alkyl amines (oleylamine or dodecylamine)
the alkyl chain length does not affect the position of the SPR peak. However, the chain length
has a marked effect on the SPR peak position in the case of alkanethiol coated NCs
(dodecanethiol or hexadecanethiol).

Ag nanocrystals differing by their coating agents: unexpected behaviors
48
MATERIALS AND METHODS
Silver nitrate (99.9%) was purchased from VWR, toluene (98%) from Riedel de Haen,
ethanol (99%) from Prolabo, o-dichlorobenzene (99%) from Sigma, oleylamine (70%) from
Sigma, and dodecanediol (99%) from Sigma. All reagents were used as received without
further purification. The detailed synthesis of Ag NCs can be found in the results part.
Transmission electron microscopy (TEM) images were recorded on a JEOL JEM 1011
(acceleration voltage: 100 kV). Optical absorption measurements were carried out on a Varian
Cary 5000 spectrophotometer using 1-mm cuvettes.
Figure 1. TEM images, size distribution histograms and high-resolution TEM of oleylamine
coated silver NCs: a) 2.2 nm b) 4.1 nm c) 5.9 nm d) 8.7 nm e) 12.9 nm.
RESULTS AND DISCUSSION
The synthetic procedure for the preparation of Ag NCs coated with oleylamine (C18-
NH2) and dodecylamine (C12-NH2) are based on hot-injection method. Briefly, an AgNO3 o-
dichlorobenzene (DCB) solution mixed with oleylamine or dodecylamine is rapidly injected
into a hot dodecanediol DCB solution (180oC) and the mixture was allowed to react for 3
minutes; the solution was then cooled down to room temperature. With oleyamine (C18-NH2),
this procedure produces the size of the Ag NCs can be controlled from 2.2 to 7 nm by

Chapter 3 Ag Nanocrystals : Effect of Ligands on Plamonic Properties
49
controlling the relative ratio of AgNO3 and oleyamine (Table S1). For larger NC size (8.7nm
and 12.9nm) oleylamine coated NCs were prepared following a modified one-pot method as
described elsewhere.30 Hence this procedure permits to control the NC size from 2.2nm to
12.9nm. The TEM images in Figure 1 clearly show that all the NCs, regardless of their size,
are well arranged in a two-dimensional hexagonal closed packed array, this is typical of NCs
with low size distribution (typically below 10%).31 Note that these NCs were obtained without
any post-synthesis size selection process or size-focusing ripening process. This is, from the
best of our knowledge, a new platform of size-controllable synthesis of Ag NCs without a
size-focusing process.32 High-resolution TEM images of the NCs reveal that all NCs are
multiply twined particles (MTPs), probably holding icosahedral morphologies, and the same
icosahedral crystals were reported by Peng et al.25 When the oleyamine (C18-NH2) is
replaced by dodecylamine (C12-NH2), which is a similar -NH2 terminated coating agent with
a shorter alkyl chain, stable monodisperse Ag NCs coated by dodecylamine is produced, as
shown in Figure 2a and S2. In this case, the size of the Ag NCs can be controlled from 3.0 to
6.3 nm. Again, the size distribution of these dodecylamine coated NCs are kept below 10%
without the need of size segregation procedures.
This hot injection process cannot be used for the preparation of alkanethiol coated Ag
NCs since AgNO3 cannot be dissolved in DCB in the presence of –SH terminated coating
agent. When a mixture of AgNO3 and dodecanethiol is injected into hot solutions containing
polyols, only polydisperse small NCs are produced. Hence, in order to obtain Ag NCs of
similar sizes and coated with alkanethiol, a ligand exchange procedure is carried out. Thiol
coated Ag NCs are prepared from the pre-formed oleylamine coated NCs described above and
a ligand exchange procedure. A small amount of dodecanethiol (20l dodecanethiol per 10mg
Ag NCs) is added to the suspension of Ag NCs and the mixture is kept under vigorous stirring
for 1 hour. Then, ethanol is added to the solution, inducing flocculation. The excess
dodecanethiol is removed from the supernatant and the NCs are re-dispersed in toluene. The
sizes and size distributions of the various NCs prepared throughout this study are listed in
Table S1(Supporting Information). The efficiency of the ligand exchange procedure was
assessed by tracking by ICP-AES the relative amounts of Ag, N, and S in the preparation
before and after exchanging the ligands. The results shown in Table 1 show that only traces of
N could be detected after this procedure, inferring than at least 80% of the amine-terminated
ligand was exchanged for the thiol-containing compound. Figure 2b and S3 show TEM
images of the Ag NCs coated with dodecanethiol, and their size can be controlled from 2.2

Ag nanocrystals differing by their coating agents: unexpected behaviors
50
nm to 6.0 nm. Figure 2c and S4 show TEM images of Ag NCs coated with hexadecanethiol
prepared in a similar manner. It is worth noting here that the size distribution of all the NCs
after ligand exchange is below 10% except in the case of 2.2 nm NCs coated with
dodecanethiol (see Table S1 and Figure S3, Supporting information). Thus 2D hexagonal
structures can be observed in most TEM images.
Table 1. 6-nm Ag Nanocrystals Coated with Oleylamine Were Analyzed by ICP-AES
(Inductively Coupled Plasma-Atomic Emission Spectroscopy) before and after Ligand
Exchange.
Elements N(w/w) S(w/w) Ag (w/w)
Before ligand exchange 0.44% NAa 70.96%
After ligand exchange <0.10% 2.7% 90.09%
NAa refers to not available
Figure 2. TEM images of silver NCs (a) 6.3 nm NCs coated with dodecylamine (b) 6.0 nm
NCs coated with dodecanethiol (c) 6.0 nm NCs coated with hexadeanethiol.
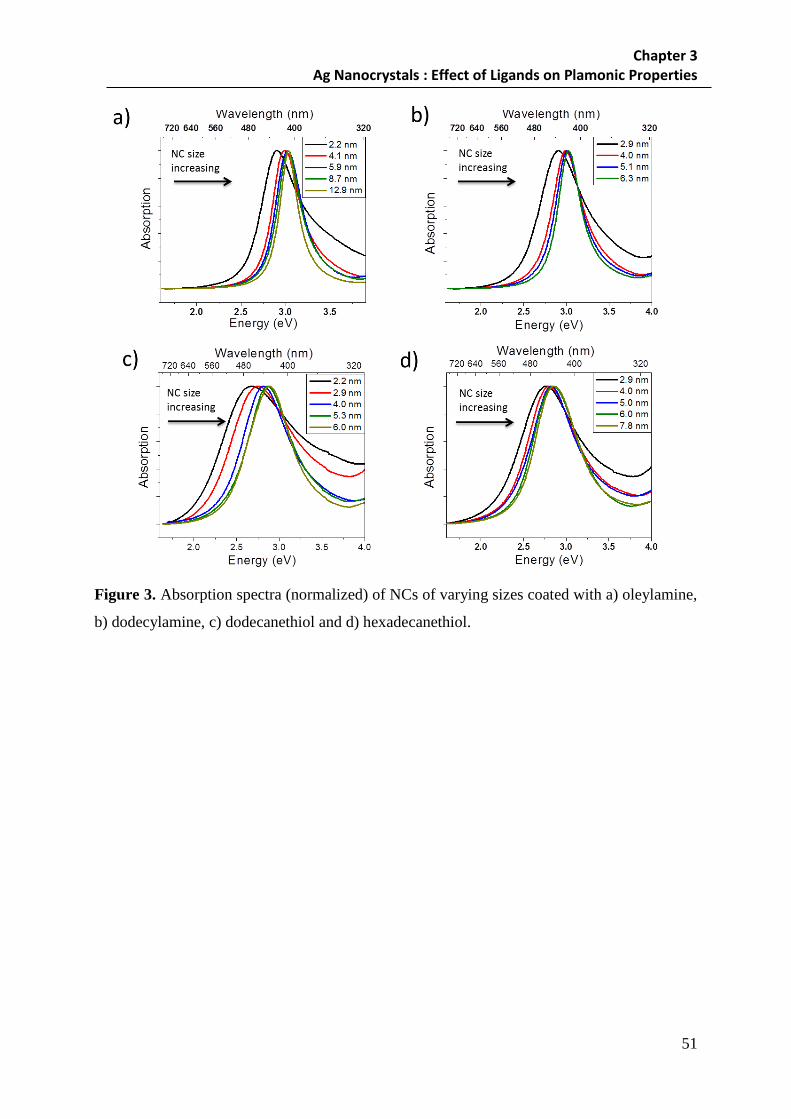
Chapter 3 Ag Nanocrystals : Effect of Ligands on Plamonic Properties
51
Figure 3. Absorption spectra (normalized) of NCs of varying sizes coated with a) oleylamine,
b) dodecylamine, c) dodecanethiol and d) hexadecanethiol.

Ag nanocrystals differing by their coating agents: unexpected behaviors
52
Figure 4. Maximum SPR peak value as a function of the diameter of the NCs size for the
dodecanethiol coated (black), dodecylamine coated (red), hexadeanethiol coated (blue) and
oleylamine (green) coated Ag NCs. The error bars in the measurements are ±0.02 eV.
The Ag NCs described above are dispersed in toluene and their UV-visible absorption
spectra are depicted in Figure 3. A well-defined SPR band as shown in Figure 3a
characterizes the normalized optical responses of colloidal Ag NCs coated with oleylamine.
With the increase of the NC size, the SPR band shifts to smaller wavelength and higher
energies. The same measurements are carried out on colloidal solutions of Ag NCs coated
with the other three types of ligands (in Figure 3b - 3d) and dispersed in toluene. A similar
trend is observed for these specimens: The SPR band is blue-shifted when increasing the NCs
size. This is observed for any coating agents used. Figure 4 depicts a plot of the SPR peak
position as a function of the NC size for the four types of coating agents used. For NCs coated
with oleylamine (C18-NH2), the SPR band position increases rapidly when the size of the
NCs increases from 2.2 nm to 5.9 nm, and this trend is more profound within smaller sized
nanocrystals. This result is in agreement with the previous report on the size-dependent
optical properties of Ag NCs, and can be explained by the plasmonic “core/shell” theory.25
Since the NCs are coated with organic molecules, the electron conductivity becomes lower in
the outer Ag layer chemically bound to the coating agents than in the inner core. With the

Chapter 3 Ag Nanocrystals : Effect of Ligands on Plamonic Properties
53
increase of the nanocrystal size, the relative influence of the outer Ag surface decreases and
the global conductivity of the nanocrystal increases, eventually inducing a blue-shift of the
SPR band.
In a similar manner, the NCs coated with other ligands (dodecylamine, dodecanethiol
and hexadecanethiol) show the same size-dependent SPR band shift trend, within the size
range of the nanocrystals that are being studied in this work.
The SPR band is located at much lower energies for alkanethiols (Cx-SH) coated NCs
(black and blue curves in Figure 4) than for NCs coated with alkylamine (Cx-NH2), (red and
green curves). The thiols head groups (-SH) are known to bond stronger than amine-
terminated ligands onto metallic surfaces.33 This also explains the possibility of efficient
ligand exchange from amines to thiols, and not the other way around.34 A combined coating
agent nature and length dependence on the SPR band is also observed. For example, for 6-nm
alkylamine (Cx-NH2) coated NCs, the SPR band shows no significant shift when changing the
alkyl chain length from C12 to C18 (3.02eV and 3.01eV, respectively). However, the SPR
band position differs significantly between alkanethiol (Cx-SH) coated NCs of different alkyl
chain lengths (2.89eV for C12 and 2.85 eV for C16). This shows that when the chemical bond
between the NCs and the ligand is relatively weak, as it is for amine-terminated ligands,
variations in the ligand chain length do not affect the SPR band position. However, the energy
of the SPR band is clearly dependent on the alkyl chain length in the case of thiol terminated
ligands. This is probably due to the stronger bonding between ligand and Ag NC surface.
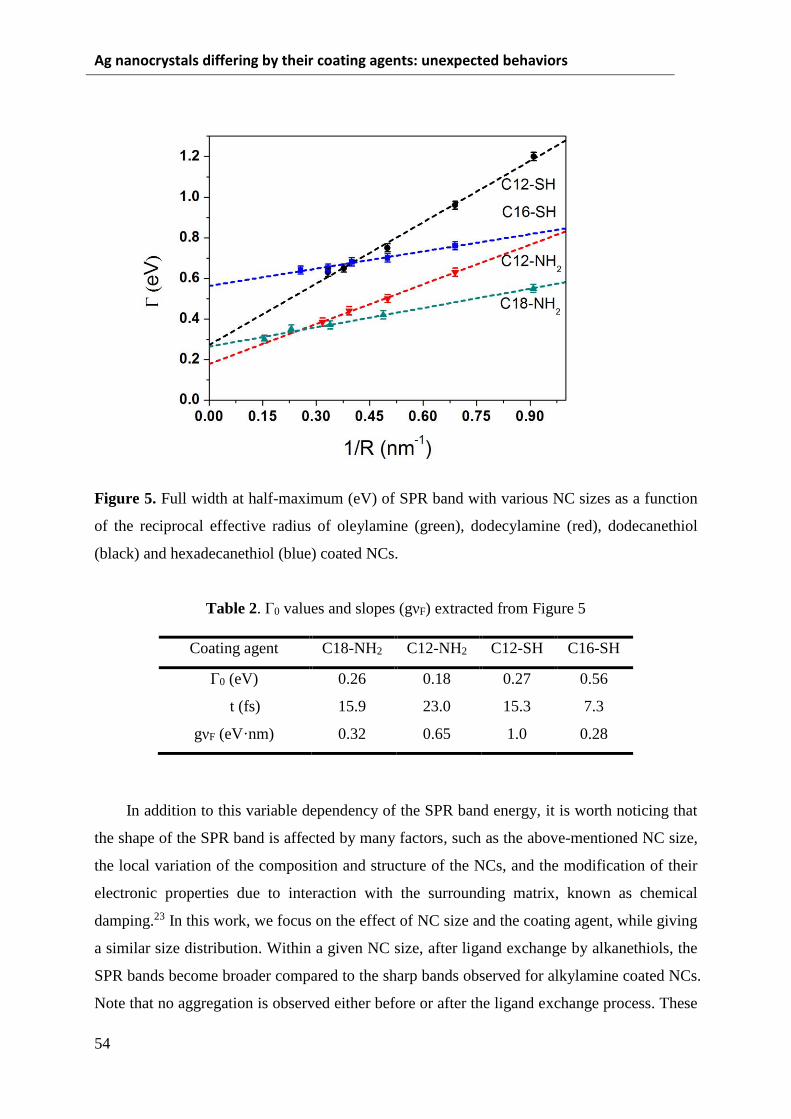
Ag nanocrystals differing by their coating agents: unexpected behaviors
54
Figure 5. Full width at half-maximum (eV) of SPR band with various NC sizes as a function
of the reciprocal effective radius of oleylamine (green), dodecylamine (red), dodecanethiol
(black) and hexadecanethiol (blue) coated NCs.
Table 2. Γ0 values and slopes (gνF) extracted from Figure 5
Coating agent C18-NH2 C12-NH2 C12-SH C16-SH
Γ0 (eV) 0.26 0.18 0.27 0.56
t (fs) 15.9 23.0 15.3 7.3
gνF (eV·nm) 0.32 0.65 1.0 0.28
In addition to this variable dependency of the SPR band energy, it is worth noticing that
the shape of the SPR band is affected by many factors, such as the above-mentioned NC size,
the local variation of the composition and structure of the NCs, and the modification of their
electronic properties due to interaction with the surrounding matrix, known as chemical
damping.23 In this work, we focus on the effect of NC size and the coating agent, while giving
a similar size distribution. Within a given NC size, after ligand exchange by alkanethiols, the
SPR bands become broader compared to the sharp bands observed for alkylamine coated NCs.
Note that no aggregation is observed either before or after the ligand exchange process. These

Chapter 3 Ag Nanocrystals : Effect of Ligands on Plamonic Properties
55
variations in the profile of the SPR bands are thought to stem from the strong interactions
between the metal surface and the alkanethiol, as evident from the dampening effect observed
on the SPR bands. Figure 3c (C12-SH coated NCs) shows that when increasing the NC size,
the SPR bandwidth decreases. The same trend is also observed for the SPR bands of the NCs
coated with other ligands (in Figure 3a, 3b and 3d). Quantitative interpretation of these data
requires precise quantum mechanical calculation of the surface-induced broadening effects
going beyond the quantum-box model.35-37 Hence, the bulk-like Drude-type expression with
an additional surface contribution to the electronic scattering rate, are used to express the
data.38-40 The bandwidth variations with the size can be described as follows: 38, 41, 42
(1)
where Γ0 the contribution due to the intrinsic electron scattering in the particle, g(υF/R) a
consequence of electron-surface interaction in spherical particles, g the surface factor in the
range of 0 to 1, υF the Fermi velocity and, R to the particle radius determined from the TEM
images. Note that this linear trend is a rough approximation. In fact, is size dependent
through electron-electron, electron-phonon couplings and dielectric function. However Figure
5 shows the measured spectra fitted using equation (1) and indicates that, in such size range (2
nm – 12 nm), Γ0 can be considered to be constant. A linear fit of the data presented in Figure
5 yields a varied Γ0 values (shown in Table 1), which implies that the intrinsic electronic
dephasing time of Ag NCs, t = h/Γ0, (h being the Planck’s constant), is particularly dependent
on their surface coating agent. In the case of alkylamine coated NCs, namely C18-NH2 and
C12-NH2, the intrinsic electronic dephasing times are 15.9 and 23.0 fs, respectively, indicating
that a shorter chain length (C12) give rise to a longer dephasing time. In addition, this trend is
also observed in Ag NCs anchored with alkanethiols (Figure 5 and Table 1). Furthermore, the
C12-SH coated NCs gives much shorter dephasing time than the C12-NH2 coated ones,
confirming that the surface-ligand interactions can play a role in determining the dephasing
time of the small Ag NCs. However, previous report 40,41 show that Γ0 has a range from 0.06
eV (69 fs) to 0.23 eV (18 fs) for silver, which was estimated from the refractive index
measurements in bulk silver. Indeed, the Γ0 deduced from Ag NCs with size larger than 10 nm
in diameter is consistent with value from bulk Ag. Here, Γ0 varied, and is particularly
dependent on the coating agent, probably because the NCs used in our work are all smaller
than 12 nm in diameter. For small NCs, the specific area is considerably larger and the
Ag nanocrystals differing by their coating agents: unexpected behaviors
56
interplay between the surface atoms and the ligand is more pronounced, which is confirmed
by the reversed size-dependence in SPR band peak, as discussed above. According to the
“core/shell” plasmonic model,25 the “core” part atoms are commonly considered as in bulk
state, whereas the “shell” part constituted with the surface atoms and the bonded ligands. Here,
we found that in the case of weak surface coating with amine-terminated ligands, namely C18-
NH2 and C12-NH2, the Γ0 values are 0.26 and 0.18 eV, respectively, falling in or approaching
the range estimated from the bulk silver (0.06-0.23eV). While for Ag NCs with strong thiol-
terminated ligand, the Γ0 values are typically higher than the upper limit of bulk silver (0.23
eV). This unusual Γ0 value is probably due to the presence of strong interactions between
surface atoms and ligands, and is much more pronounced in longer chain length ligand, C16-
SH.
As shown in Table 1 and Figure 5, the slope of the linear fittings, which is correlated
with the surface factor g, shows various values for the different surface coatings of Ag NCs.
In the case of C12-SH and C12-NH2 the g values are larger than that of C18-NH2 and C16-SH,
suggesting additional contribution of ligand-surface interaction takes place in this size range
(2-12 nm). However, it is still an open question on how to predict the g value, and it should be
noted that due to the different approximations used for obtaining an analytical g expression,
different theoretical values were reported. 38, 39
CONCLUSIONS
Here we describe synthetic procedures based on hot injection methods for the production Ag
with very low size distribution, in the 2 – 12 nm size range coated with amine-containing
organic molecules. Their size distribution is kept below 10% without the need of size
selection process. The coating layer of these NCs is replaced by thiol-terminated coating
agent via ligand exchange procedures. The optical properties of these different specimens
reveal that the SPR band position is not only dependent on the NCs size, but also on the
nature of the coating agent; would it be through the influence of the head-group (amine or
thiol) or the chain length.

Chapter 3 Ag Nanocrystals : Effect of Ligands on Plamonic Properties
57
ACKNOWLEDGMENTS
The authors would like to thank Dr. L.Douillard and Dr J.Romann for fruitful discussions.
An Advanced Grant of the European Research Council under Grant 267129 supports the
research leading to these results. J. J. W. thanks the China Scholarship Council for financial
support.
REFERENCES
1. Yin, Y.; Alivisatos, A. P., Colloidal nanocrystal synthesis and the organic-inorganic
interface. Nature 2005, 437 (7059), 664-670.
2. Alivisatos, A. P., NCs: Building blocks for modern materials design. Endeavour 1997,
21 (2), 56-60.
3. El-Sayed, M. A., Small Is Different: Shape-, Size-, and Composition-Dependent
Properties of Some Colloidal Semiconductor NCs. Accounts of Chemical Research
2004, 37 (5), 326-333.
4. Pradhan, N.; Reifsnyder, D.; Xie, R.; Aldana, J.; Peng, X., Surface Ligand Dynamics
in Growth of NCs. Journal of the American Chemical Society 2007, 129 (30), 9500-
9509.
5. Murray, C. B.; Kagan, C. R.; Bawendi, M. G., Synthesis and characterization of
monodisperse NCs and close-packed nanocrystal assemblies. Annual Review of
Materials Science 2000, 30, 545-610.
6. Ong, W.-L.; Rupich, S. M.; Talapin, D. V.; McGaughey, A. J. H.; Malen, J. A.,
Surface chemistry mediates thermal transport in three-dimensional nanocrystal arrays.
Nat Mater 2013, 12 (5), 410-415.
7. Dirix, Y.; Bastiaansen, C.; Caseri, W.; Smith, P., Oriented Pearl-Necklace Arrays of
Metallic Nanoparticles in Polymers: A New Route Toward Polarization-Dependent
Color Filters. Adv. Mater. 1999, 11 (3), 223-227.
8. Krenn, J. R.; Dereux, A.; Weeber, J. C.; Bourillot, E.; Lacroute, Y.; Goudonnet, J. P.;
Schider, G.; Gotschy, W.; Leitner, A.; Aussenegg, F. R.; Girard, C., Squeezing the
Optical Near-Field Zone by Plasmon Coupling of Metallic Nanoparticles. Physical
Review Letters 1999, 82 (12), 2590-2593.
9. Pendry, J., Playing Tricks with Light. Science 1999, 285 (5434), 1687-1688.
10. Shalaev, V. M., Transforming light. Science 2008,322 (5900), 384-386.

Ag nanocrystals differing by their coating agents: unexpected behaviors
58
11. Wertime, T. A., BEGINNINGS OF METALLURGY - NEW LOOK. Science
1973,182 (4115), 875-887.
12. Rycenga, M.; Cobley, C. M.; Zeng, J.; Li, W.; Moran, C. H.; Zhang, Q.; Qin, D.; Xia,
Y., Controlling the Synthesis and Assembly of Silver Nanostructures for Plasmonic
Applications. Chemical Reviews 2011,111 (6), 3669-3712.
13. Lal, S.; Link, S.; Halas, N. J., Nano-optics from sensing to waveguiding. Nature
Photonics 2007,1 (11), 641-648.
14. Jain, P. K.; Lee, K. S.; El-Sayed, I. H.; El-Sayed, M. A., Calculated absorption and
scattering properties of gold nanoparticles of different size, shape, and composition:
Applications in biological imaging and biomedicine. J. Phys. Chem. B 2006,110 (14),
7238-7248.
15. Mie, G., Articles on the optical characteristics of turbid tubes, especially colloidal
metal solutions. Annalen Der Physik 1908,25 (3), 377-445.
16. Kelly, K. L.; Coronado, E.; Zhao, L. L.; Schatz, G. C., The optical properties of metal
nanoparticles: The influence of size, shape, and dielectric environment. J. Phys. Chem.
B 2003,107 (3), 668-677.
17. Salzemann, C.; Brioude, A.; Pileni, M. P., Tuning of copper NCs optical properties
with their shapes. J. Phys. Chem. B 2006,110 (14), 7208-7212.
18. Yang, P.; Portalès, H.; Pileni, M.-P., Dependence of the localized surface plasmon
resonance of noble metal quasispherical nanoparticles on their crystallinity-related
morphologies. The Journal of Chemical Physics 2011, 134 (2), 024507-1.
19. Amendola, V.; Bakr, O. M.; Stellacci, F., A Study of the Surface Plasmon Resonance
of Silver Nanoparticles by the Discrete Dipole Approximation Method: Effect of
Shape, Size, Structure, and Assembly. Plasmonics 2010, 5 (1), 85-97.
20. Link, S.; El-Sayed, M. A., Spectral properties and relaxation dynamics of surface
plasmon electronic oscillations in gold and silver nanodots and nanorods. J. Phys.
Chem. B 1999, 103 (40), 8410-8426.
21. Nehl, C. L.; Hafner, J. H., Shape-dependent plasmon resonances of gold nanoparticles.
Journal of Materials Chemistry 2008, 18 (21), 2415-2419.
22. Ghosh, S. K.; Nath, S.; Kundu, S.; Esumi, K.; Pal, T., Solvent and Ligand Effects on
the Localized Surface Plasmon Resonance (LSPR) of Gold Colloids. The Journal of
Physical Chemistry B 2004, 108 (37), 13963-13971.
Chapter 3 Ag Nanocrystals : Effect of Ligands on Plamonic Properties
59
23. Wei, T.; Liu, Y.; Dong, W.; Zhang, Y.; Huang, C.; Sun, Y.; Chen, X.; Dai, N.,
Surface-Dependent Localized Surface Plasmon Resonances in CuS Nanodisks. ACS
Applied Materials & Interfaces 2013, 5 (21), 10473-10477.
24. Murphy, C. J.; San, T. K.; Gole, A. M.; Orendorff, C. J.; Gao, J. X.; Gou, L.; Hunyadi,
S. E.; Li, T., Anisotropic metal nanoparticles: Synthesis, assembly, and optical
applications. J. Phys. Chem. B 2005, 109 (29), 13857-13870
25. Peng, S.; McMahon, J. M.; Schatz, G. C.; Gray, S. K.; Sun, Y., Reversing the size-
dependence of surface plasmon resonances. Proceedings of the National Academy of
Sciences of the United States of America 2010, 107 (33), 14530-14534.
26. Haes, A. J.; Van Duyne, R. P., A nanoscale optical blosensor: Sensitivity and
selectivity of an approach based on the localized surface plasmon resonance
spectroscopy of triangular silver nanoparticles. Journal of the American Chemical
Society 2002, 124 (35), 10596-10604.
27. Malinsky, M. D.; Kelly, K. L.; Schatz, G. C.; Van Duyne, R. P., Chain length
dependence and sensing capabilities of the localized surface plasmon resonance of
silver nanoparticles chemically modified with alkanethiol self-assembled monolayers.
Journal of the American Chemical Society 2001, 123 (7), 1471-1482.
28. Mock, J. J.; Barbic, M.; Smith, D. R.; Schultz, D. A.; Schultz, S., Shape effects in
plasmon resonance of individual colloidal silver nanoparticles. Journal of Chemical
Physics 2002, 116 (15), 6755-6759.
29. Hao, E.; Schatz, G. C., Electromagnetic fields around silver nanoparticles and dimers.
Journal of Chemical Physics 2004, 120 (1), 357-366.
30. Wang, C.; Yin, H.; Chan, R.; Peng, S.; Dai, S.; Sun, S., One-Pot Synthesis of
Oleylamine Coated AuAg Alloy NPs and Their Catalysis for CO Oxidation.
Chemistry of Materials 2009, 21 (3), 433-435.
31. Pileni, M. P., Self-Assembly of inorganic NCs: Fabrication and Collective Intrisic
Properties. Acc. Chem. Res 2007, 40 (8), 685-693.
32. Shankar, R.; Wu B. B.; Bigioni, T. P. Wet Chemical Synthesis of Monodisperse
Colloidal Silver Nanocrystals Using Digetive Ripening. J. Phys. Chem. C 2010, 114,
15916-15923.
33. Hiramatsu H.; Osterloh F. E., A Simple Large-scale Synthesis of nearly Monodisperse
Gold and Silver Nanoparticles with Adjustable Sizes and with Exchangeable
Surfactants. Chemistry of Materials 2004, 16 (13), 2509-2511.
Ag nanocrystals differing by their coating agents: unexpected behaviors
60
34. Linnert T.; Mulvaney P.; Henglein A., Surface Chemstry of Colloidal Silver: Surface
Plasmon Damping by Chemisorbed I-, SH-, and C6H5S-, 1993, 97(3), 679-682.
35. Kawabata, A.; Kubo, R. Electronic Properties of Fine Metallic Particles. II. Plasma
Resonance Absorption. J. Phys. Soc. Jpn.1966, 21 (9), 1765-1772.
36. Ruppin, R.; Yatom, Y. Size and Shape Effects on the Broadening of the Plasma
Resonance Absorption in Metals. Phys. Status Solidi 1976, 74, 647-654.
37. Barma, M.; Subrahmanyam, V. Optical Absorpiton in Small Metal Particles. J. Phys.:
Condens. Matter 1989, 1, 7681.
38. Lerme, J.; Baida, H.; Bonnet, C.; Broyer, M.; Cottancin, E.; Crut, A.; Maioli, P.; Fatti
Del, N.; Vallee, F.; Pellarin, M. Size Dependence of the Surface Plasmon Resonance
Damping in Metal Nanospheres. J. Phys. Chem. Lett. 2010, 1, 2922-2928.
39. Baida, H.; Billaud, P.; Marhaba, S.; Chistofilos, D.; Cottaicin, E.; Crut, A.; Lerme, J.;
Maioli, P.; Pellarin, M.; Broyer, M.; Del Fatti, N.; Vallee, F. Quantitative
Determination of the Size Dependence of Surface Plasmon Resonance Damping in
Single Ag@SiO2 Nanoparticles. Nano lett. 2009, 9 (10), 3463-3469.
40. Del Fatti, N.; Vallee, F.; Flytzanis, C.; Hamanaka, Y.; Nakamura, A. Electron
dynamics and surface plasmon resonance nonlinearities in metal nanoparticles. Chem.
Phys. 2000, 251, 215-226
41. Hodak, J. H.; Henglein, A.; Hartland, G. V., Photophysics of Nanometer Sized Metal
Particles: Electron−Phonon Coupling and Coherent Excitation of Breathing
Vibrational Modes. The Journal of Physical Chemistry B 2000, 104 (43), 9954-9965.
42. Kreibig, U.; Vollmer, M. Optical Properties of Metal Clusters; Springer: Berlin, 1995.
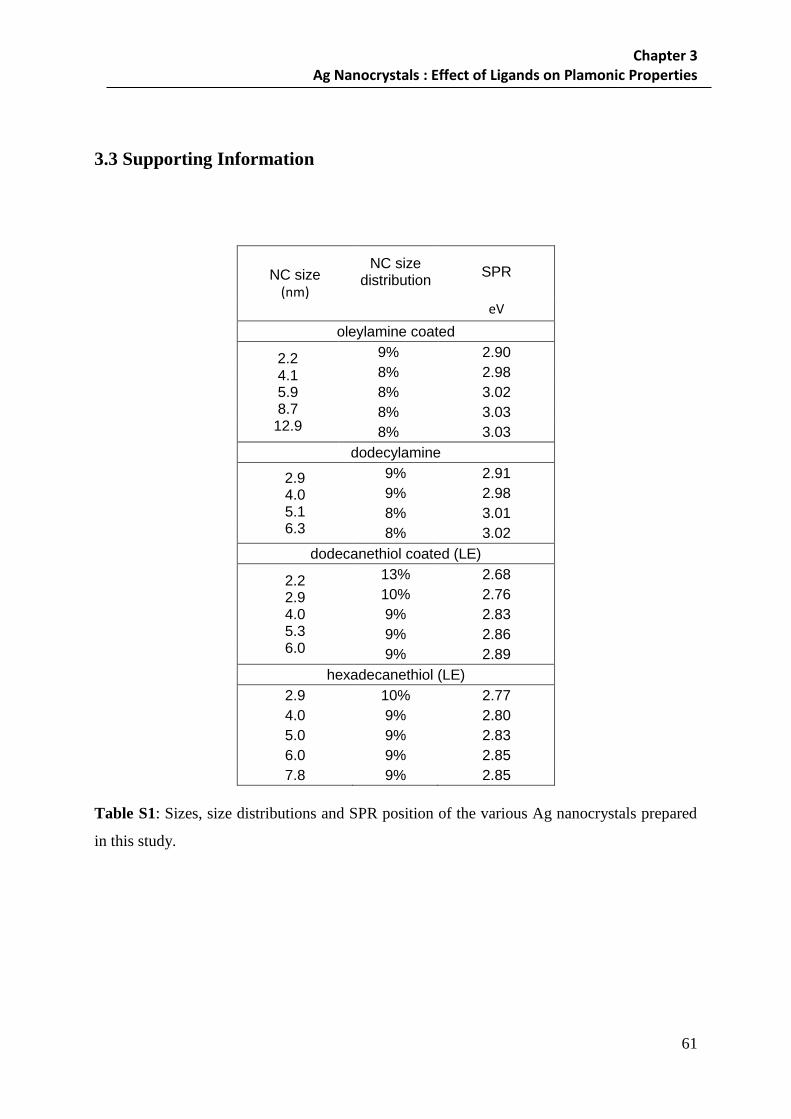
Chapter 3 Ag Nanocrystals : Effect of Ligands on Plamonic Properties
61
3.3 Supporting Information
NC size (nm)
NC size distribution
SPR
eV
oleylamine coated
2.2 4.1 5.9 8.7
12.9
9% 2.90
8% 2.98
8% 3.02
8% 3.03
8% 3.03
dodecylamine
2.9 4.0 5.1 6.3
9% 2.91
9% 2.98
8% 3.01
8% 3.02
dodecanethiol coated (LE)
2.2 2.9 4.0 5.3 6.0
13% 2.68
10% 2.76
9% 2.83
9% 2.86
9% 2.89
hexadecanethiol (LE)
2.9 10% 2.77
4.0 9% 2.80
5.0 9% 2.83
6.0 9% 2.85
7.8 9% 2.85
Table S1: Sizes, size distributions and SPR position of the various Ag nanocrystals prepared
in this study.
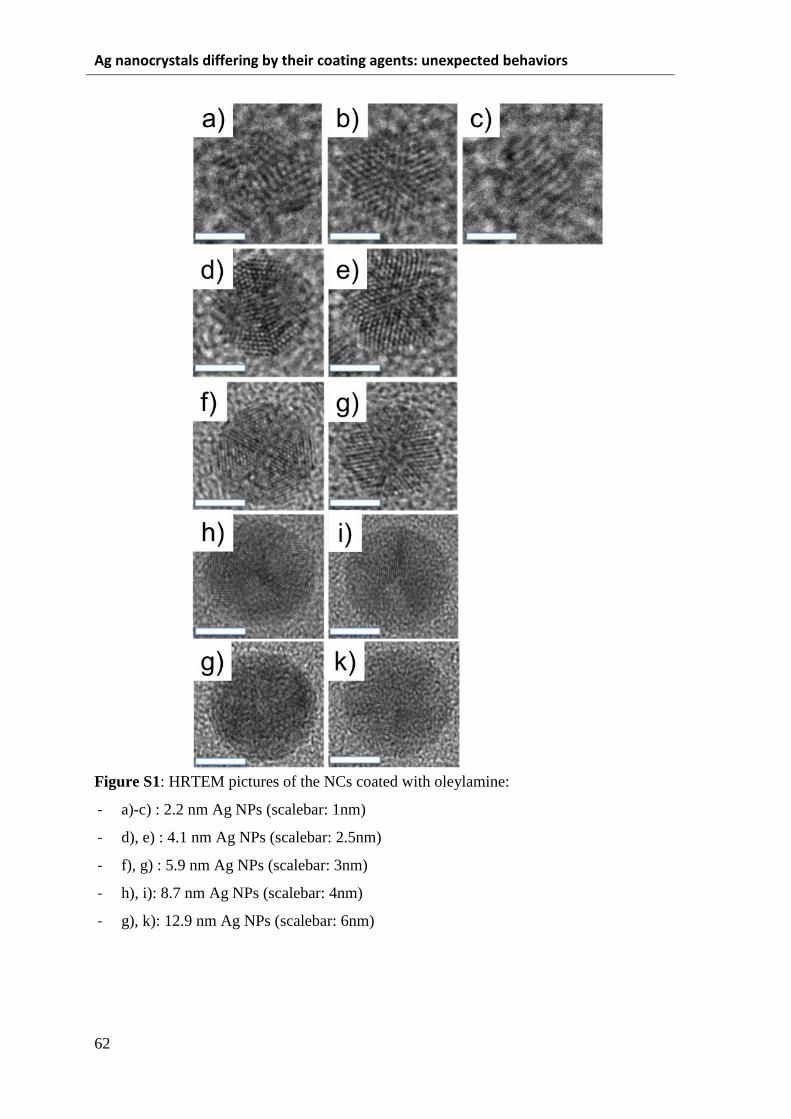
Ag nanocrystals differing by their coating agents: unexpected behaviors
62
Figure S1: HRTEM pictures of the NCs coated with oleylamine:
- a)-c) : 2.2 nm Ag NPs (scalebar: 1nm)
- d), e) : 4.1 nm Ag NPs (scalebar: 2.5nm)
- f), g) : 5.9 nm Ag NPs (scalebar: 3nm)
- h), i): 8.7 nm Ag NPs (scalebar: 4nm)
- g), k): 12.9 nm Ag NPs (scalebar: 6nm)

Chapter 3 Ag Nanocrystals : Effect of Ligands on Plamonic Properties
63
Figure S2. TEM images of colloidal silver nanocrystals coated with dodecylamine: a) 2.9 nm;
b) 4.0 nm; c) 5.1 nm.
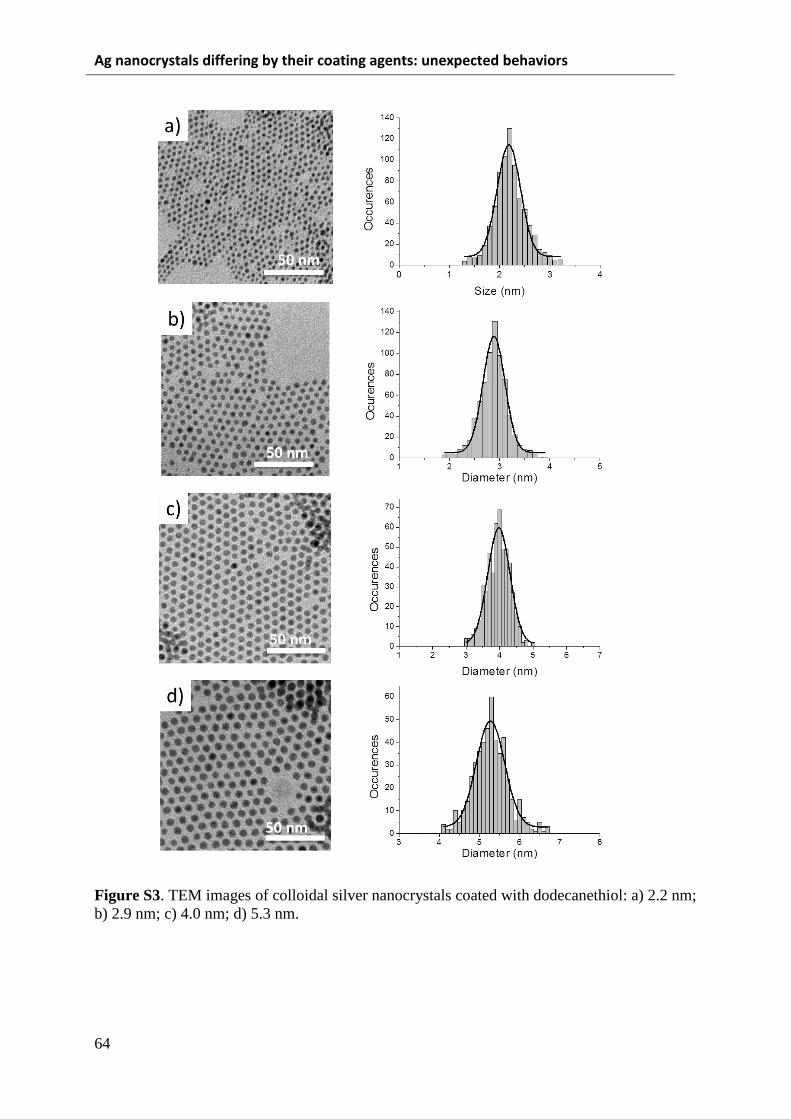
Ag nanocrystals differing by their coating agents: unexpected behaviors
64
Figure S3. TEM images of colloidal silver nanocrystals coated with dodecanethiol: a) 2.2 nm;
b) 2.9 nm; c) 4.0 nm; d) 5.3 nm.

Chapter 3 Ag Nanocrystals : Effect of Ligands on Plamonic Properties
65
Figure S4. TEM images of the colloidal silver nanocrystals coated with hexadeanethiol : a)
2.9 nm; b) 4.0 nm; c) 5.0 nm; d) 7.8 nm.

Ag nanocrystals differing by their coating agents: unexpected behaviors
66

Chapter 4 Surface Plasmon Resonance of Silver Nanocrystals Differing by Sizes and Coating Agents
Ordered In 3D Supracrystals
67
Chapter 4
Surface Plasmon Resonance of Silver Nanocrystals
Differing by Sizes and Coating Agents Ordered In 3D
Supracrystals
4.1 Abstract
In this part, silver nanocrystals coated with oleylamine or dodecylamine with rather narrow
distribution are synthesized by hot injection and one-pot method. Then ligand exchange
strategy is used to prepare nanocrystals coated with dodecanethiols. Silver nanocrystals
differing by their coating agents and sizes are self-assembled in thin supracrystalline films.
The surface plasmon resonance (SPR) properties of such assemblies are presented.
Nanocrystal size, interparticle distance and coating agent play key roles in the plasmonic
coupling of Ag nanocrystals within supracrystals. By either increasing the diameter of
nanocrystals or shortening the interparticle distance, the SPR band shifts to lower energy due
to stronger coupling effect. Then, we demonstrate experimentally the predictions for 2D self-
assemblies remains valid for thin 3D superlattices. The absorption spectra in the visible range
are markedly dependent on the incidence of the light source and confirm the apparition of a
splitting of the dipolar surface band into two components, namely longitudinal band and
transverse band, upon increasing the incidence angle. The major parameter inducing the
splitting of the SPR band is the relative ratio between the average distance of nanocrystals and
their diameters. The nature of the coating agent is also of particular importance; it is hereby
shown that theoretical predictions and experimental data are in agreement for alkylamine
coating agents, whereas they differ for thiol-coated nanocrystals.

Ag nanocrystals differing by their coating agents: unexpected behaviors
68
4.2 Article: Surface Plasmon Resonance of Silver Nanocrystals Differing by
Sizes and Coating Agents Ordered In 3D Supracrystals
Surface Plasmon Resonance of Silver Nanocrystals Differing by Sizes and
Coating Agents Ordered In 3D Supracrystals
Jingjing Wei,a,b Nicolas Schaeffer,a,b Pierre-Antoine Albouy,c Marie-Paule Pileni*a,b,d
a Sorbonne Universités, UPMC Univ Paris 06, UMR 8233, MONARIS, F-75005, Paris,
France
b CNRS, UMR 8233, MONARIS, F-75005, Paris, France
c Laboratoire de Physique des Solides, Université Paris-Sud, 91405 Orsay, France
d CEA/IRAMIS, CEA Saclay, 91191, Gif-sur-Yvette, France
INTRODUCTION
Inorganic nanocrystals self-assembled in two-dimensional (2D) or three-dimensional
(3D), referred to as supracrystals, have received great interest over the last two decades.1-5
Hence, long-range ordered assemblies of nanocrystals can in some cases exhibit novel optical,
electronic, mechanical or magnetic properties, thus providing a route to the manufacture of
metamaterials with unique chemical and physical properties.6-9 For example, vibrational
coherence in supracrystals was first discovered by Low-Frequency Raman Spectroscopy
(LFRS) measurements for fcc supracrystals of 5-nm Ag nanocrystals, and is in good
agreement with theoretical calculations carried out on similar system.10 This vibrational
coherence was demonstrated by a decrease in the quadrupolar mode bandwidth. Propagative
vibrations in supracrystals have also been evidenced by time-resolved pump probe
measurement (phonons are associated to long-range order: they can be evidenced not
demonstrated). Long-time scale differential reflectivity dynamics reveal large oscillations for
the ordered systems, whereas a monotonous decay was observed in the disordered system.
Furthermore, it was shown that the electron transport properties can be controlled by the
degree of ordering in the nanocrystal assemblies. 11- 14

Chapter 4 Surface Plasmon Resonance of Silver Nanocrystals Differing by Sizes and Coating Agents
Ordered In 3D Supracrystals
69
The bright and fascinating colors of noble-metal nanocrystals (i.e. Au, Ag…) have attracted
considerable interest since historical times for their use as decorative pigments in stained
glasses and artworks.15-17 Nowadays, the attention is focused on applications ranging from
photonics to biomedicine.18, 19 Noble-metal nanocrystals, when dispersed in solvent, exhibit a
strong localized surface plasmon resonance (SPR) peaks resulting from the collective
resonance oscillation of conduction electrons under the irradiation light.20, 21 The SPR
frequency depends not only on the type of nanomaterials, but also on its size and shape,20, 22
and on the dielectric properties of the carrier solvent.23, 24 Colloidal Ag nanocrystals are
attractive candidates as nanoscale plasmonic building blocks because of their sharper
resonance, greater electromagnetic field enhancement and lower loss, compared to that of Au
or Cu for instance.25 Recent studies on the size-dependence SPR absorption band show a
strong blue-shift when increasing the nanocrystal size from 2 to 12 nm, which is in opposition
with observations made for this type of materials in the size range of tens of nanometers.21,24
When 5-nm Ag nanocrystals are self-assembled in 2D superlattices, it has been
demonstrated by reflectivity, 26 photo-induced STM, 27 ellipsometry that splitting of the SPR
band takes place. More recently it was also shown that this splitting was due to inter-particle
coupling interactions,13 and consequently the optical properties of noble-metal nanocrystals
can be modulated efficiently through tailor-made design. The sensitivity of the SPR to the
inter-particle interactions has been explored.26,28,29 The discrete dipolar approximation (DDA)
method pioneered by Purcell and Pennypacker 30 has been applied to simulate the absorption
spectra of metal nanoparticles assembled in a 2D hexagonal network. However, the
experimental demonstration of collective SPR of 3D supracrystals made of noble-metal
nanocrystals remains to be demonstrated. Near-field-coupled noble-metal nanocrystals have
been studied, revealing the coupled SPR in plasmonic dimers composed of octahedral gold
nanocrystals within the near-field range.31 Long-range periodic assemblies of noble-metal
nanocrystals, are frequently studied through theoretical approaches, but rarely
experimentally.13, 23, 32
Here we demonstrate that the SPR bands of nanocrystals with various sizes and coating
agents self-assembled in thin supra-crystalline films are strongly red-shifted with increasing
of the nanocrystal size and behave oppositely when the same nanocrystals are dispersed in a
solvent. The size-dependent and ligand-dependent collective SPR properties of Ag
nanocrystal supracrystals are demonstrated. Finally, the influence of the angle of incidence of
the light onto the optical measurement reveals a size-dependent splitting within the SPR at
Ag nanocrystals differing by their coating agents: unexpected behaviors
70
large enough angles; no SPR variation was observed when the coating agent and the
interparticle distance remains constant.
METHODS
A. Materials. Silver nitrate (99.9%) was purchased from Sigma, toluene (98%) from
Riedel de Haen, ethanol (99.8%) from Prolabo, o-dichlorobenzene (99%) from Sigma,
oleylamine (70%) from Sigma, and dodecanediol (99%) from Sigma. All reagents were used
as received without further purification.
B. Equipment. Transmission electron microscopy (TEM) images were obtained with
a JEOL JEM 1011(100 kV). The UV-visible absorption measurements presented here were
performed using a Varian Cary 5000 double monochromator recording spectrophotometer. To
perform measurements in transmission geometry at various angles of incidence, the
spectrophotometer was equipped with a Harrick Scientific (Pleasantville, NY) variable angle
transmission accessory (VATA), which has been specially designed for transmission studies
of samples up to 3 mm thick. The VATA allows a given sample and a blank (which should
match the former in both thickness and refractive index) to be placed in the light beam at the
same angle of incidence, but in the opposite orientation, in order to avoid any misalignment of
the detected beam that could affect the measured transmittance. A Glan-Taylor polarizer was
also used in all our measurements to polarize the light parallel to the plane of incidence.
Under such a configuration, information on the optical anisotropy of the sample can
interestingly be achieved by considering the fact that the electric field is then projected in
both perpendicular and parallel directions to the nanocrystal 2D assembly. For particles in
solution, absorption spectra were recorded in 1-mm cuvettes. Small-angle X-ray Scattering
measurements were performed with a homemade system mounted on a rotating copper anode
generator (focus size: 0.1 × 0.1 mm2; 40 kV, 20 mA).
C. Synthesis of Ag nanocrystals. Nanocrystals with diameter of 2.2 nm, 4.1 nm, 5.9 nm
are synthesized by the hot injection method and the coating agent used is oleylamine except
2.2 nm with both oleylamine and Oleic acid as coating agents.21 The 8.7 nm and 12.9 nm
nanocrystals were synthesized with a one-pot method and the coating agent is also oleyl
amine.24 Nanocrystals using dodecylamine as coating agent were similarly prepared by hot
injection methods. 24 The nanocrystals coated with dodecanethiol were prepared by ligand
exchange with the nanocrystals coated with oleylamine obtained above. Thiol coated Ag
nanocrystals were prepared from the pre-formed oleylamine coated nanocrystals described

Chapter 4 Surface Plasmon Resonance of Silver Nanocrystals Differing by Sizes and Coating Agents
Ordered In 3D Supracrystals
71
above and a ligand exchange procedure. The ligand exchange procedure was as follows:
small amount of dodecanethiol (
to the suspension of Ag nanocrystals and the mixture was kept under vigorous stirring for 1
hour. Then, ethanol was added to the solution, inducing flocculation. The excess
dodecanethiol was removed with the supernatant and the nanocrystals was re-dispersed in
toluene. Ultimately, all the nanocrystals were dispersed in toluene and exhibited a size
distribution below 10% (Figure S1 and Figure S2, Supporting Information).
D. Preparation of the three-dimensional supracrystals. Preparation of the supracrystals
is as follows: Ag nanocrystals differing by their diameters and their coating agents were
synthesized and dispersed in toluene to obtain colloidal solution (cAg ≈ 1.0 mg/mL). Two
specimens were prepared simultaneously: two glass wafers were deposited on paper sheet. On
one of the wafer an amorphous carbon coated copper mesh TEM grid was deposited. The
same amount of colloidal solution (50 μL) was deposited on the two glass wafers. In order to
slow down the evaporation rate the substrate was covered by watch glass. At the end of
evaporation (≈ 30 min), a thin film is deposited either on TEM grid or on the glass wafer.
RESULTS AND DISCUSSION
Colloidal solution of Ag nanocrystals differing by their diameters and their coating
agents are synthesized as described in the experimental section and dispersed in toluene (cAg ≈
1.0 mg/mL). The so-formed supracrystalline films made of oleylamine (C18-NH2) coated Ag
nanocrystals of varying sizes and recovered on the wafer carrying the TEM grid are presented
in Figure 1. The Ag nanocrystals display long-range order (1-3 μm) as shown on Figure 1 and
confirmed by the corresponding Fast Fourier Transform (FFT) pattern as shown in insets. The
thickness of the films was evaluated to be 2-7 layers from those images. Note that insets (b),
(c), (d) and (e) in Figure 1 show hexagonal patterns whereas inset in panel (a) shows only a
rectangular one.

Ag nanocrystals differing by their coating agents: unexpected behaviors
72
Figure 1. TEM images of thin supracrystalline films of Ag nanocrystals coated with
oleyamine (C18-NH2) differing by their diameters: (a) 2.2 nm; (b) 4.1 nm; (c) 5.9 nm; (d) 8.7
nm; (e) 12.9 nm. The inserted scale bars are 100 nm.

Chapter 4 Surface Plasmon Resonance of Silver Nanocrystals Differing by Sizes and Coating Agents
Ordered In 3D Supracrystals
73
Figure 2. Optical images of the supracrystalline films on glass substrate and corresponding
X-ray diffraction patterns for thin supracrystals of Ag nanocrystals coated with oleylamine
(C18-NH2) and differed by their diameters: (a, f) 2.2 nm (b, g) 4.1 nm (c, h) 5.9 nm (d, i) 8.7
nm (e, j) 12.9 nm. The scale bars in the optical images all are 1cm. 1:√2:√3 (resp. 1:2/√3)
positions for first diffraction lines are presently typical for bcc (resp. fcc) structures. Stacking
faults in fcc result in streaks.
Specimens of 3D superlattices for UV-vis absorption spectroscopy were prepared by
depositing the same amount of Ag nanocrystals on the glass wafer as the one used to record
TEM images (wafer: 2x2 cm2). Those colored films of nanocrystals differing by their sizes
are

Ag nanocrystals differing by their coating agents: unexpected behaviors
74
depicted in Figures 2a-2e and look rather inhomogeneous. However, the corresponding
grazing incidence small angle X-ray scattering patterns confirm that the nanocrystals forming
the films are well ordered in a supracrystalline structure (Figures 2f-2j). For 2.2-nm, as
expected from the Landman theory,34 the diffraction pattern corresponds to a body-centered
cubic (bcc) structure (Figure 2f). On increasing the nanocrystals diameter, from 4.1 to 12.9
nm, the characteristic patterns of face-centered cubic (fcc) symmetry are produced (Fig. 2g-2j).
The inter-particle distance, δpp, between nanocrystals deduced from SAXRS measurements
remains in the same order of magnitude (Table 1).
Figure 3. (a) Normalized UV-Vis absorption spectra recorded under normal incident light
of thin supracrystalline films made of C18-NH2 coated Ag nanocrystals of various diameters
(b) SPR peak position values of dispersed nanocrystals (red sphere) and corresponding
supracrystalline films (black square) as a function of the nanocrystal diameter.

Chapter 4 Surface Plasmon Resonance of Silver Nanocrystals Differing by Sizes and Coating Agents
Ordered In 3D Supracrystals
75
Table 1. Interparticle distance (pp) between Ag nanocrystal coated with C18-NH2 within the
supracrystals, deduced from small-angle X-ray scattering measurements. Maximum energy of
the surface plasmon resonance (SPR) spectrum and the corresponding maximum wavelength
(λmax) of Ag nanocrystals either dispersed in toluene, E (dispersed nanocrystals/eV) or
embedded within the supracrystals and measured at 0° angle, E (supracrystal films/eV). ΔE is
the difference of E values between Ag nanocrystals dispersed in toluene and deposited on a
glass substrate forming supracrystals.
Nanocrystal size/ nm 2.2 4.1 5.9 8.7 12.9
Size distribution 9% 8% 8% 8% 8%
pp /nm 3.2 3.2 3.1 2.8 2.5
E (dispersed nanocrystals/eV) 2.90 2.98 3.02 3.03 3.04
E (supracrystal films/eV) 2.83 2.77 2.67 2.62 2.50
λ max (supracrystal films/nm) 438 448 464 473 496
ΔE (dispersed supracrystal/eV) 0.07 0.21 0.35 0.41 0.54
The Surface Plasmon Resonance (SPR) spectra of the supracrystal films deposited on
a glass wafer are recorded using a horizontally polarized light source and keeping the incident
light parallel to the substrate. The SPR spectra of Ag nanocrystals, differing by their average
diameters and coated with oleylamine (C18-NH2) are red-shifted (low energy shift) on
increasing the nanocrystal diameters, as depicted in Figure 3a. This is in complete opposition
with what has been observed with the same nanocrystals dispersed in toluene (and thus
considered as isolated nanocrystals). As already described in our previous paper and by others
21, 24, a blue shift is observed on increasing the nanocrystal sizes in solution. This was
explained by the lower conductivity of the outer layer in smaller nanocrystals. Figure 3b
shows an increase in the maximum absorption wavelength (λmax) of the SPR spectrum of
nanocrystals dispersed in toluene when increasing the nanocrystal size, whereas a marked
drop in the λmax is observed when the same nanocrystals are assembled in thin supracrystals
and deposited on a glass wafer. Table 1 and Figure S3 show the energy differences in the SPR
band peak position between the dispersed nanocrystals and the corresponding thin
supracrystalline films, ΔE. These non-negligible energy differences are attributed to the
interactions between the Ag nanocrystals embedded in the supracrystals. In fact, due to an
increase in the dipole moments led by an increase in the nanocrystals diameters, the
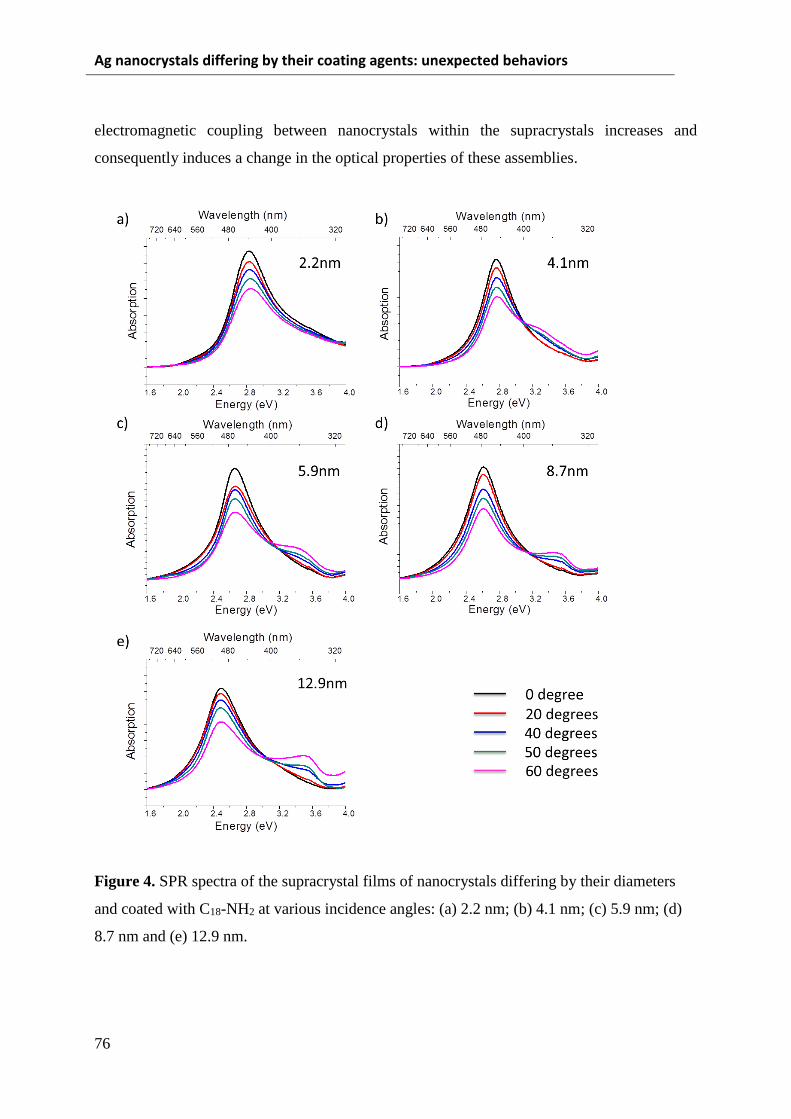
Ag nanocrystals differing by their coating agents: unexpected behaviors
76
electromagnetic coupling between nanocrystals within the supracrystals increases and
consequently induces a change in the optical properties of these assemblies.
Figure 4. SPR spectra of the supracrystal films of nanocrystals differing by their diameters
and coated with C18-NH2 at various incidence angles: (a) 2.2 nm; (b) 4.1 nm; (c) 5.9 nm; (d)
8.7 nm and (e) 12.9 nm.

Chapter 4 Surface Plasmon Resonance of Silver Nanocrystals Differing by Sizes and Coating Agents
Ordered In 3D Supracrystals
77
By using polarized light parallel to the plane of incidence at various incident angles
(θ), the absorption spectra of the ordered 3D assemblies show the appearance of a secondary
peak, at higher energies (compared to that of the SPR) for relatively large incident angle
above 40°. Figure 4 and Table 2 show that the splitting of the SPR band is not well-defined
for supracrystals of 2.2-nm nanocrystals whereas it is clearly discernible for larger Ag
nanocrystals sizes and angles larger than 40°. However, through deconvolution of SPR band
under incidence angle of 60° it is possible to detect a second peak for 2.2-nm Ag supracrystals.
On increasing the nanocrystal diameters, the second peak at higher energy is becoming more
pronounced. This reveals that the SPR spectra in the visible range are markedly dependent on
the incidence of the light source. These data confirm those predicted by DDA simulation13 and
observed experimentally by reflectivity26 for 5-nm Ag nanocrystals self-assembled in 2D
superlattices. Appearance of a higher energy band is interpreted as follows: for incident angle
θ ≠ 0°, the electric field of the incident radiation projects in both parallel and perpendicular
direction to the nanocrystal arrays. The amplitudes of these two bands evolve in the opposite
trends when varying the incident angle. The perpendicular component increases with θ, and
the resonant excitation of both the longitudinal and transverse surface plasmon eigenmodes of
the supracrystal films result in the appearance of two bands in the absorption spectra. This
feature points out the optical anisotropy of the 3-D array of the nanocrystals. Such variations
in the amplitude of both longitudinal and transverse SPR are well observed by plotting their
correspondent energies with γ (γ = pp /D), where D and pp are the nanocrystal diameter and
the interparticle distance between nanocrystals within the supracrystals (Figure 5 and Table 2).
Table 2. SPR peak position of the longitudinal and transverse peaks with various Ag-
nanocrystal sizes coated with oleylamine (C18-NH2) for an incident angle 60o.
Nanocrystal diameter/nm 2.2 4.1 5.9 8.7 12.9
E (longitudinal peak/eV) 2.84 2.78 2.67 2.62 2.50
λ max (longitudinal/nm) 436 446 464 473 496
E (transverse peak/eV) 3.13 3.27 3.38 3.45 3.48
λ max (transverse/nm) 396 379 367 359 356

Ag nanocrystals differing by their coating agents: unexpected behaviors
78
Figure 5. (a) Comparison of the experimental and simulated longitudinal and transversal SPR
band position13 values against γ = pp /D of nanocrystals differing by their coating agents and
sizes; (b-c) local magnifications of the Figure 5a.
The two SPR peaks tend, on increasing the γ value, to reach values close to their
counterparts in supracrystals of 2.2-nm Ag nanocrystals. Such a feature, observed
experimentally with nanocrystals differing by their sizes self-assembled in 3D superlattices
with pp rather constant (Table 2), was recently predicted by DDA simulation of 2D
superlattices and is attributed to an increase in the dipolar interactions.13
Comparison between the data presented hereby and those deduced from simulations
shows a good agreement for energy values of the transverse SPR energy band for C18-NH2
coated Ag-nanocrystals differing by their sizes, shown in Figure 5, whereas discrepancies are
observed between experimental and theoretical energy values for the longitudinal SPR bands.
This can be attributed to the fact that the longitudinal peak is more sensitive to the coating
agent compared to the transverse one. In fact DDA simulations mentioned above did not take
the surface coating agent into account, only assuming spheres surrounded by a continuous
medium.13 These data also show that the transversal SPR peak do not markedly depend on a
weak coating agent as C18-NH2 whereas the longitudinal modes could be highly sensitive to
this factor.
At this stage we raise a question on what is the influence of the coating agent on the
SPR spectra of “thin 3D superlattices”. To answer this question let us replace oleylamine
(C18-NH2) by dodecylamine (C12-NH2) or by dodecanthiol (C12-SH) keeping a similar average

Chapter 4 Surface Plasmon Resonance of Silver Nanocrystals Differing by Sizes and Coating Agents
Ordered In 3D Supracrystals
79
diameter (ca. 6-nm). Unfortunately it has been impossible to produce supracrystals with
various sizes of Ag nanocrystals coated with C12-NH2 or C12-SH. In a similar manner to what
has been described above with C18-NH2 coated nanocrystals, those new Ag nanocrystals are
deposited on a glass wafer and form thin films. Figure 6a and 6b show, as observed in Figure
2 for C18-NH2 coated Ag nanocrystals ordered on the substrates, that the films on glass are
relatively inhomogeneous. Nevertheless the corresponding SAXRS patterns (Figure 6c, e and
6d, f) show that the ~6-nm nanocrystals coated with C12-NH2 and C12-SH are ordered in fcc
crystalline structure as observed with C18-NH2. Table 3 shows that the interparticle distance,
pp, remains similar (1.8-1.9 nm) for those specimens, those values being smaller than those
obtained with C18-NH2 (3.1 nm).
The optical properties of these C12-NH2 and C12-SH supracrystals (Figure 6e) differing
by the nature of their coating agent show similar behavior as described above with C18-NH2
(Figure 2). Figure 6e shows a red shift of the SPR spectrum of supracrystals of ~6-nm Ag
nanocrystals coated with C12-NH2 and C12-SH compared to the same nanocrystals dispersed in
toluene. Table 3 shows that the differences in the energies determined from the maximum of
the SPR spectra between deposited and dispersed remain the same (ΔE ≈ 0.40 eV), when
nanocrystals within the supracrystal keep similar interparticle distance (~1.8-nm) i.e.
nanocrystals are coated with C12 derivatives. This difference is larger with supracrystals of
5.9-nm Ag nanocrystals coated with longer chain length of C18-NH2 (ΔE = 0.35 eV). The
interparticle distance of the latter is larger (3.1 nm) than that obtained with C12 derivatives
(~1.8-nm). This clearly supports our claim that these differences in the maximum SPR
positions between deposited and dispersed nanocrystals are due to dipolar interactions.
Furthermore, the SPR spectrum of supracrystals coated with C12-SH is red shifted compared
to that of C12-NH2 with a difference in energy of 0.12 eV (Table 3 and Figure 6e). This
difference can hardly be attributed to the slight variations in the average diameter between the
two samples (6.3-nm and 6.0-nm, respectively) and is thought to stem from the decrease in
the conductivity of the outer layer of the Ag-nanocrystals within the supracrystals compared
to the inner core. That confirms the influence of the coating agent on the SPR spectra.

Ag nanocrystals differing by their coating agents: unexpected behaviors
80
Figure 6. Optical images, X-ray diffraction patterns and SPR spectra of the thin
supracrystalline films on glass made from 5.9-nm Ag nanocrystals with different coating
agents: (a, c) dodecylamine (C12-NH2); (b, d) dodecanethiol (C12-SH); (e) SPR spectra of the
supracrystalline films coated with either C12-NH2 (red) or C12-SH (green) and the SPR spectra
of dispersed nanocrystals coated with either C12-NH2 (black) or C12-SH (blue). The scale bar
in the optical images is 1 cm.
Table 3. The interparticle distance (pp) between Ag nanocrystals in the supracrystals
differing by the coating agent C12-NH2 and C12-SH. The maximum SPR wavelength and the
corresponding energy of the SPR peak of Ag nanocrystals either dispersed in toluene or
within the supracrystals recorded when the incident angle is 0°
Ag nanocrystal 6.3-nm C12-NH2 6.0-nm C12-SH
Size distribution 8% 9%
pp / nm 1.8 1.9
Dispersed nanocrystal SPR peak
value /eV 3.02 2.89
Supracrystal SPR peak value/eV 2.61 2.49
ΔE /eV 0.41 0.40
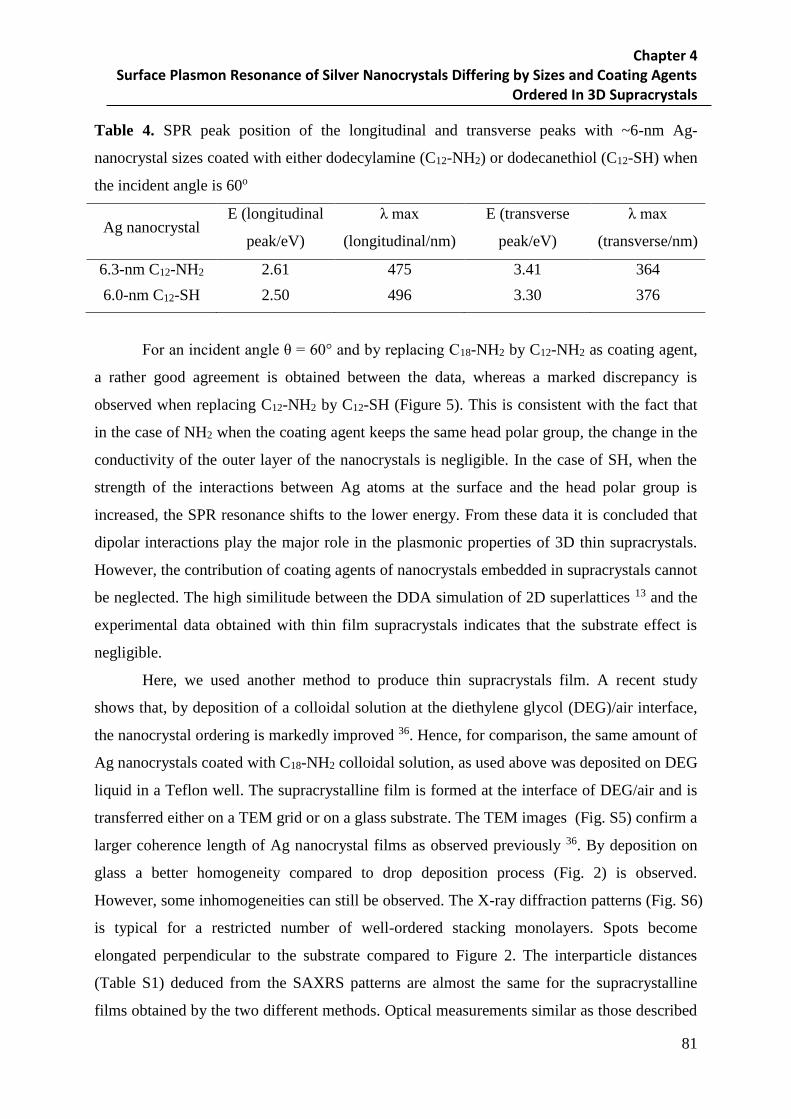
Chapter 4 Surface Plasmon Resonance of Silver Nanocrystals Differing by Sizes and Coating Agents
Ordered In 3D Supracrystals
81
Table 4. SPR peak position of the longitudinal and transverse peaks with ~6-nm Ag-
nanocrystal sizes coated with either dodecylamine (C12-NH2) or dodecanethiol (C12-SH) when
the incident angle is 60o
Ag nanocrystal E (longitudinal
peak/eV)
λ max
(longitudinal/nm)
E (transverse
peak/eV)
λ max
(transverse/nm)
6.3-nm C12-NH2 2.61 475 3.41 364
6.0-nm C12-SH 2.50 496 3.30 376
For an incident angle θ = 60° and by replacing C18-NH2 by C12-NH2 as coating agent,
a rather good agreement is obtained between the data, whereas a marked discrepancy is
observed when replacing C12-NH2 by C12-SH (Figure 5). This is consistent with the fact that
in the case of NH2 when the coating agent keeps the same head polar group, the change in the
conductivity of the outer layer of the nanocrystals is negligible. In the case of SH, when the
strength of the interactions between Ag atoms at the surface and the head polar group is
increased, the SPR resonance shifts to the lower energy. From these data it is concluded that
dipolar interactions play the major role in the plasmonic properties of 3D thin supracrystals.
However, the contribution of coating agents of nanocrystals embedded in supracrystals cannot
be neglected. The high similitude between the DDA simulation of 2D superlattices 13 and the
experimental data obtained with thin film supracrystals indicates that the substrate effect is
negligible.
Here, we used another method to produce thin supracrystals film. A recent study
shows that, by deposition of a colloidal solution at the diethylene glycol (DEG)/air interface,
the nanocrystal ordering is markedly improved 36. Hence, for comparison, the same amount of
Ag nanocrystals coated with C18-NH2 colloidal solution, as used above was deposited on DEG
liquid in a Teflon well. The supracrystalline film is formed at the interface of DEG/air and is
transferred either on a TEM grid or on a glass substrate. The TEM images (Fig. S5) confirm a
larger coherence length of Ag nanocrystal films as observed previously 36. By deposition on
glass a better homogeneity compared to drop deposition process (Fig. 2) is observed.
However, some inhomogeneities can still be observed. The X-ray diffraction patterns (Fig. S6)
is typical for a restricted number of well-ordered stacking monolayers. Spots become
elongated perpendicular to the substrate compared to Figure 2. The interparticle distances
(Table S1) deduced from the SAXRS patterns are almost the same for the supracrystalline
films obtained by the two different methods. Optical measurements similar as those described
Ag nanocrystals differing by their coating agents: unexpected behaviors
82
above were carried out on those supracrystalline films (Figure S7a). Similar trends are
observed with a normal incident light to the substrate; that is, a red shift (low energy shift)
occurs when increasing the nanocrystal sizes. However, Figure S7b shows a non-negligible
decrease of the maximum energy of the SPR band that does not follow the same trend as that
observed in Figure 3b. Similarly, by increasing θ from 0O to 60O, a splitting in the SPR
spectrum takes place as observed in Figure S8. However, a careful analysis of these spectra
shows that the evolution of the longitudinal and transverse SPR maximum energies with γ
markedly change compared to what is shown on Figure 6 (Figure S9). These differences
cannot be attributed to the changes in the interparticle distances that remain similar to those
obtained by drop deposition (Table S1). Hence such differences are attributed to diffusion of
DEG molecules inducing a change in the nanocrystal environments and consequently in the
optical properties of nanocrystals within the supracrystals. This is also supported by the fact
that it is impossible to image by STM the supracrystal film produced by using the DEG
method and deposited on HOPG, whereas by simple solvent evaporation of same amount of
colloidal solutions on HOPG, the film is very easily imaged with the appearance of well-
defined Ag nanocrystals.
CONCLUSIONS
By comparing the SPR spectra of dispersed Ag nanocrystals and their assemblies of
supracrystalline films, marked changes were discovered. Very surprisingly, data obtained here
show a good agreement between simulated optical properties in 2D superlattices with 3D thin
films self-assembled in fcc crystalline structure. The energy discrepancy (ΔE), determined
from the difference in SPR band between dispersed nanocrystals and their assemblies was
used to evaluate the collective optical properties due to nanocrystal ordering. It is found that
ΔE is mainly determined by both the nanocrystals sizes and the interparticle distances inside
the supracrystal. Upon increasing the nanocrystals sizes while keeping the interparticle
distance constant, ΔE values showed a monotonic increase. Furthermore, it was shown that
engineering the interparticle distance of nanocrystals of similar size within a supracrystal, can
effectively modulate the optical properties of the Ag supracrystalline films.

Chapter 4 Surface Plasmon Resonance of Silver Nanocrystals Differing by Sizes and Coating Agents
Ordered In 3D Supracrystals
83
REFERENCES
1. Pileni, M. P., Nanocrystal self-assemblies: Fabrication and collective properties. J.
Phys. Chem. B 2001, 105, 3358-3371.
2. Pileni, M. P., Self organization of inorganic nanocrystals: Unexpected chemical and
physical properties. J. Colloid Interface Sci, 2012, 388, 1-8.
3. Sun, S. H.; Murray, C. B.; Weller, D.; Folks, L.; Moser, A., Monodisperse FePt
nanoparticles and ferromagnetic FePt nanocrystal superlattices. Science 2000, 287,
1989-1992.
4. Shevchenko, E. V.; Talapin, D. V.; Kotov, N. A.; O'Brien, S.; Murray, C. B.,
Structural diversity in binary nanoparticle superlattices. Nature 2006, 439, 55-59.
5. Murray, C. B.; Kagan, C. R.; Bawendi, M. G., Synthesis and characterization of
monodisperse nanocrystals and close-packed nanocrystal assemblies. Annu. Rev.
Mater. Sci. 2000, 30, 545-610.
6. Yang, Z.; Lisiecki, I.; Walls, M.; Pileni, M.-P., Nanocrystallinity and the Ordering of
Nanoparticles in Two-Dimensional Superlattices: Controlled Formation of Either
Core/Shell (Co/CoO) or Hollow CoO Nanocrystals. ACS Nano 2013, 7, 1342-1350.
7. Talgorn, E.; Abellon, R. D.; Kooyman, P. J.; Piris, J.; Savenije, T. J.; Goossens, A.;
Houtepen, A. J.; Siebbeles, L. D. A., Supercrystals of CdSe Quantum Dots with High
Charge Mobility and Efficient Electron Transfer to TiO2. ACS Nano 2010, 4, 1723-
1731.
8. Goubet, N.; Yan, C.; Polli, D.; Portales, H.; Arfaoui, I.; Cerullo, G.; Pileni, M.-P.,
Modulating Physical Properties of Isolated and Self-Assembled Nanocrystals through
Change in Nanocrystallinity. Nano Lett. 2013, 13, 504-508.
9. Goubet, N.; Pileni, M. P., Analogy Between Atoms in a Nanocrystal and Nanocrystals
in a Supracrystal: Is It Real or Just a Highly Probable Speculation? J. Phys. Chem. Lett.
2011, 2, 1024-1031.
10. Courty, A.; Mermet, A.; Albouy, P. A.; Duval, E.; Pileni, M. P., Vibrational coherence
of self-organized silver nanocrystals in f.c.c. supra-crystals. Nat. Mater. 2005, 4, 395-
398.
11. Remacle, F.; Collier, C. P.; Markovich, G.; Heath, J. R.; Banin, U.; Levine, R. D.,
Networks of quantum nanodots: The role of disorder in modifying electronic and
optical properties. J. Phys. Chem. B 1998, 102, 7727-7734.

Ag nanocrystals differing by their coating agents: unexpected behaviors
84
12. Yang, P.; Arfaoui, I.; Cren, T.; Goubet, N.; Pileni, M.P.; Electronic properties probed
by scanning tunneling spectroscopy: From isolated gold nanocrystal to well-defined
supracrystals; Phys. Rev. B, 2012, 86, 075409.
13. Yang, P.; Portalès, H.; Pileni, M.P.; Ability to discern the splitting between
longitudinal and transverse plasmon resonances in Au compared to Ag Nanoparticles
in close-packed planar arrays; Phys. Rev. B, 2010, 81, 205405.
14. Parthasarathy, R.; Lin, X. M.; Jaeger, H. M., Electronic transport in metal nanocrystal
arrays: The effect of structural disorder on scaling behavior. Phys. Rev. Lett. 2001, 87.
15. Shalaev, V. M., Transforming light. Science 2008, 322, 384-386.
16. Wertime, T. A., Begingins of Metallurgy-New Science 1973, 182, 875-887.
17. Rycenga, M.; Cobley, C. M.; Zeng, J.; Li, W.; Moran, C. H.; Zhang, Q.; Qin, D.; Xia,
Y., Controlling the Synthesis and Assembly of Silver Nanostructures for Plasmonic
Applications. Chem. Rev. 2011, 111, 3669-3712.
18. Lal, S.; Link, S.; Halas, N. J., Nano-optics from sensing to waveguiding. Nat.
Photonics 2007, 1, 641-648.
19. Jain, P. K.; Lee, K. S.; El-Sayed, I. H.; El-Sayed, M. A., Calculated absorption and
scattering properties of gold nanoparticles of different size, shape, and composition:
Applications in biological imaging and biomedicine. J. Phys. Chem. B 2006, 110,
7238-7248.
20. Kelly, K. L.; Coronado, E.; Zhao, L. L.; Schatz, G. C., The optical properties of metal
nanoparticles: The influence of size, shape, and dielectric environment. J. Phys. Chem.
B 2003, 107, 668-677.
21. Wei, J. J.; Schaeffer N.; Pileni, M. P. J. Phys. Chem. B 2014, 118, 14070-14075.
22. Salzemann, C.; Brioude, A.; Pileni, M. P., Tuning of copper nanocrystals optical
properties with their shapes. J. Phys. Chem. B 2006, 110, 7208-7212.
23. Lazarides, A. A.; Schatz, G. C., DNA-linked metal nanosphere materials: Structural
basis for the optical properties. J. Phys. Chem. B 2000, 104, 460-467.
24. Peng, S.; McMahon, J. M.; Schatz, G. C.; Gray, S. K.; Sun, Y., Reversing the size-
dependence of surface plasmon resonances. Proc. Nat. Acad. Sci. U. S. A. 2010, 107,
14530-14534.
25. Link, S.; El-Sayed, M. A., Spectral properties and relaxation dynamics of surface
plasmon electronic oscillations in gold and silver nanodots and nanorods. J. Phys.
Chem. B 1999, 103, 8410-8426.
Chapter 4 Surface Plasmon Resonance of Silver Nanocrystals Differing by Sizes and Coating Agents
Ordered In 3D Supracrystals
85
26. Taleb, A.; Russier, V.; Courty, A.; Pileni, M. P., Collective optical properties of silver
nanoparticles organized in two-dimensional superlattices. Phys. Rev. B 1999, 59,
13350-13358.
27. Nilius, N.; Ernst, N.; Freund, H. J., Photon Emission Spectroscopy of Individual
Oxide-Supported Silver Clusters in a Scanning Tunneling Microscope. Phys. Rev. Lett.
2000, 84 , 3994-3997.
28. Su, K. H.; Wei, Q. H.; Zhang, X.; Mock, J. J.; Smith, D. R.; Schultz, S., Interparticle
coupling effects on plasmon resonances of nanogold particles. Nano Lett. 2003, 3,
1087-1090.
29. Ye, X.; Chen, J.; Diroll, B. T.; Murray, C. B., Tunable Plasmonic Coupling in Self-
Assembled Binary Nanocrystal Super lattices Studied by Correlated Optical
Microspectrophotometry and Electron Microscopy. Nano Lett. 2013, 13, 1291-1297.
30. Purcell, E. M.; Pennypac Cr, Scattering and Absorption of Light by Nonspherical
Dielectric Grains. Astrophysical J. 1973, 186, 705-714.
31. Yang, S.-C.; Kobori, H.; He, C.-L.; Lin, M.-H.; Chen, H.-Y.; Li, C.; Kanehara, M.;
Teranishi, T.; Gwo, S., Plasmon Hybridization in individual Gold Nanocrystal Dimers:
Direct Observation of Bright and Dark Modes. Nano Lett. 2010, 10, 632-637.
32. Amendola, V.; Bakr, O. M.; Stellacci, F., A Study of the Surface Plasmon Resonance
of Silver Nanoparticles by the Discrete Dipole Approximation Method: Effect of
Shape, Size, Structure, and Assembly. Plasmonics 2010, 5, 85-97.
33. Henry, A. I.; Courty, A.; Pileni, M. P.; Albouy, P. A.; Israelachvili, J., Tuning of solid
phase in supracrystals made of silver nanocrystals. Nano Lett. 2008, 8, 2000-2005.
34. Whetten, R. L.; Khoury, J. T.; Alvarez, M.M.; Murthy, S.; Vezmar, I.; Wang, Z.L.;
Cleveland, C.C.; Luedtke, W.D.; Landman, U. Adv. Mater. 1996, 8, 428-433.
35. Alaeian, H.; Dionne, J. A., Plasmon nanoparticle superlattices as optical-frequency
magnetic metamaterials. Opt. Express 2012, 20, 15781-15796.
36. Dong, A. G.; Chen, J.; Vora, P. M.; Kikkawa, J. M.; Murray, C. B., Binary nanocrystal
superlattice membranes self-assembled at the liquid-air interface. Nature 2010, 466,
474-477.
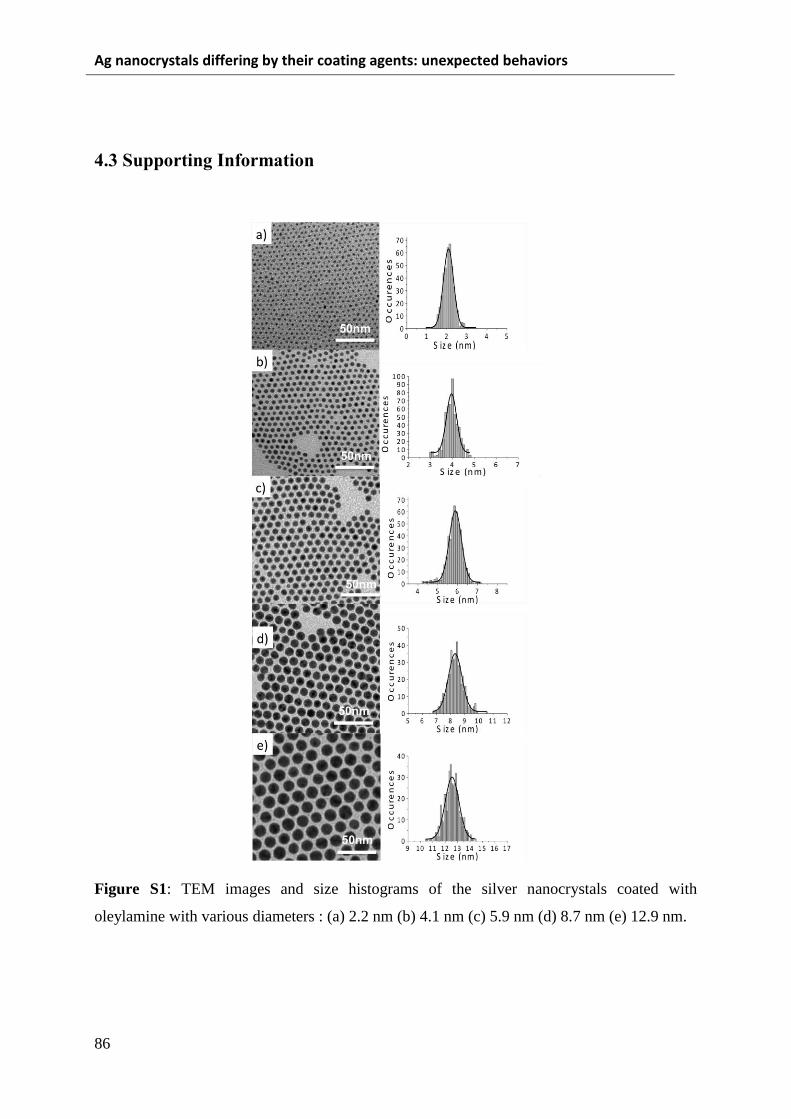
Ag nanocrystals differing by their coating agents: unexpected behaviors
86
4.3 Supporting Information
Figure S1: TEM images and size histograms of the silver nanocrystals coated with
oleylamine with various diameters : (a) 2.2 nm (b) 4.1 nm (c) 5.9 nm (d) 8.7 nm (e) 12.9 nm.
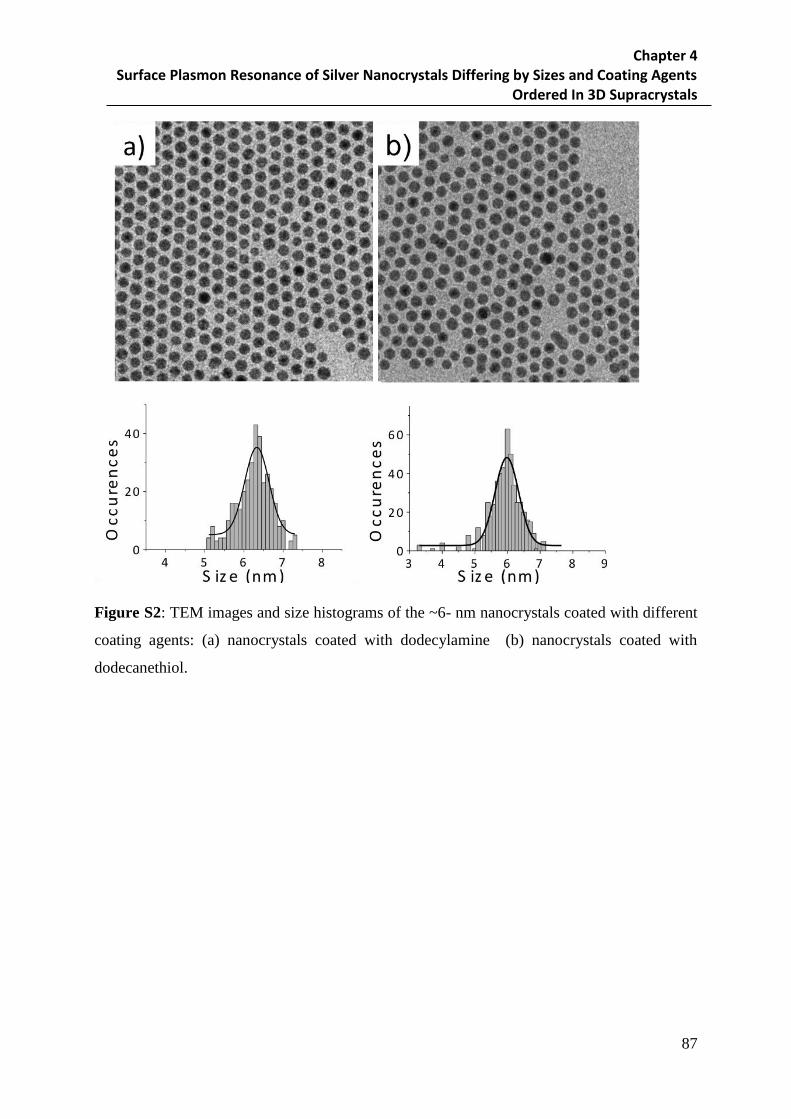
Chapter 4 Surface Plasmon Resonance of Silver Nanocrystals Differing by Sizes and Coating Agents
Ordered In 3D Supracrystals
87
Figure S2: TEM images and size histograms of the ~6- nm nanocrystals coated with different
coating agents: (a) nanocrystals coated with dodecylamine (b) nanocrystals coated with
dodecanethiol.
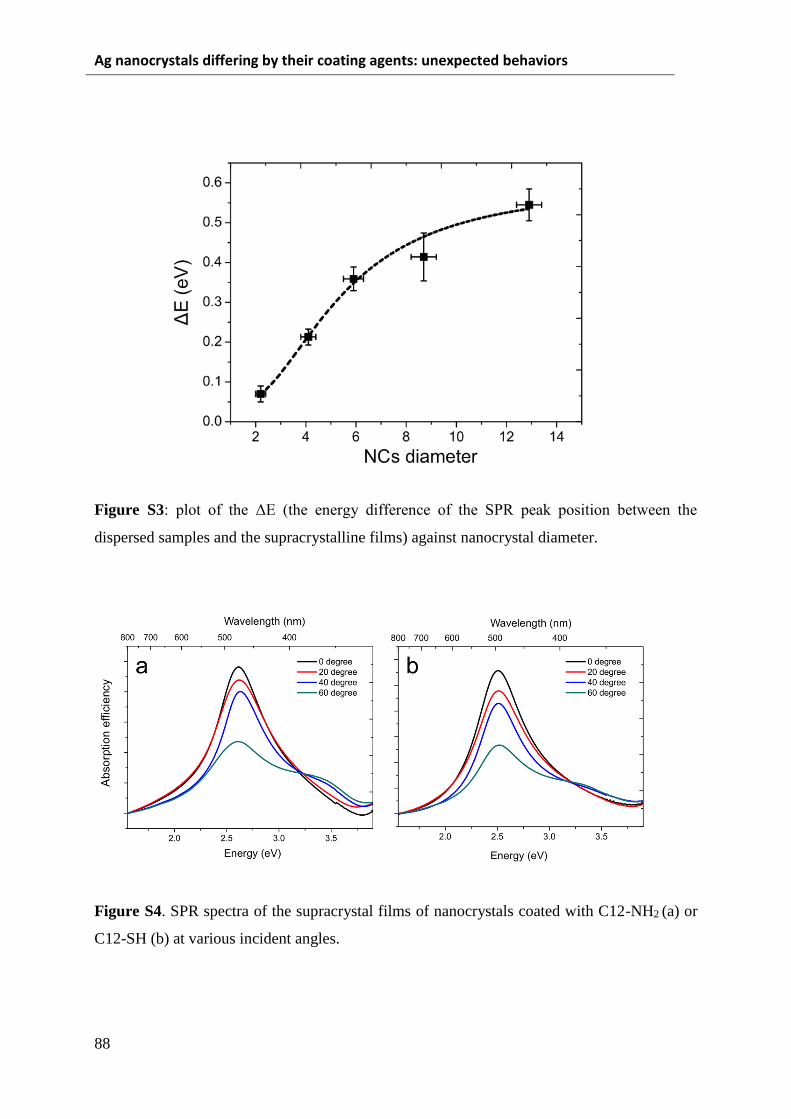
Ag nanocrystals differing by their coating agents: unexpected behaviors
88
Figure S3: plot of the ΔE (the energy difference of the SPR peak position between the
dispersed samples and the supracrystalline films) against nanocrystal diameter.
Figure S4. SPR spectra of the supracrystal films of nanocrystals coated with C12-NH2 (a) or
C12-SH (b) at various incident angles.
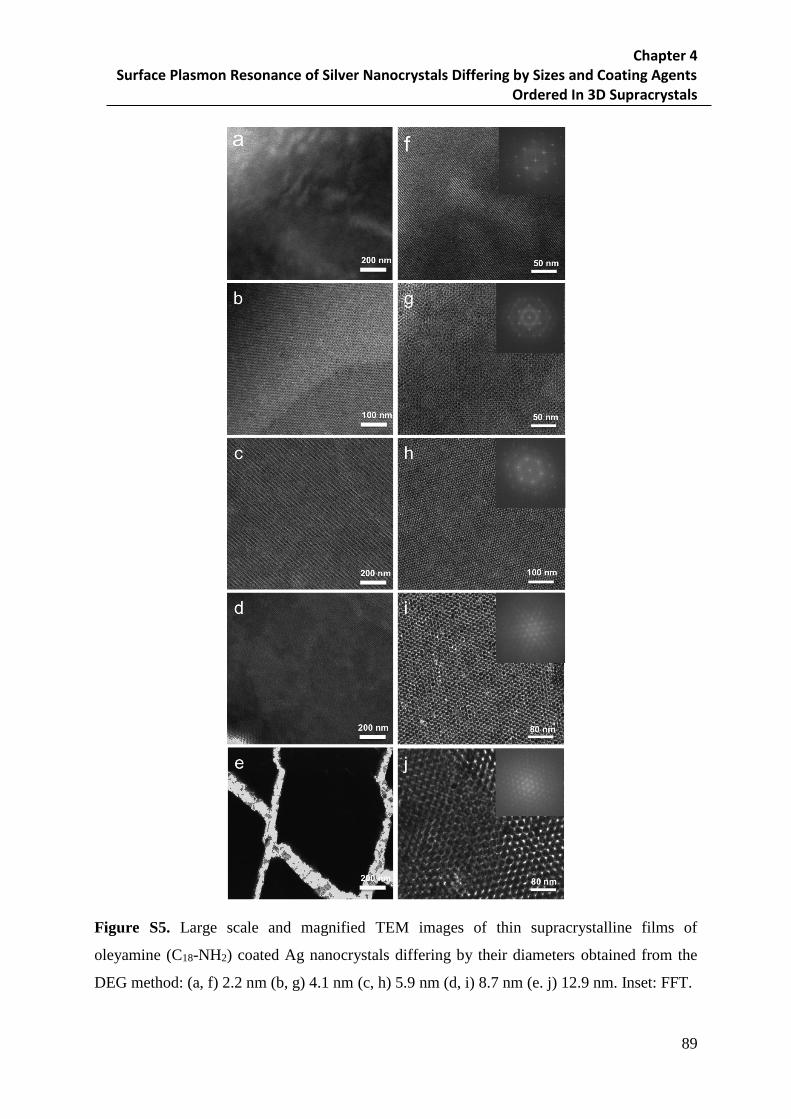
Chapter 4 Surface Plasmon Resonance of Silver Nanocrystals Differing by Sizes and Coating Agents
Ordered In 3D Supracrystals
89
Figure S5. Large scale and magnified TEM images of thin supracrystalline films of
oleyamine (C18-NH2) coated Ag nanocrystals differing by their diameters obtained from the
DEG method: (a, f) 2.2 nm (b, g) 4.1 nm (c, h) 5.9 nm (d, i) 8.7 nm (e. j) 12.9 nm. Inset: FFT.

Ag nanocrystals differing by their coating agents: unexpected behaviors
90
Figure S6. Optical images of the supracrystalline films on glass substrate obtained by DEG
method and corresponding small angle X-ray scattering (SAXRS) of thin supracrystals of Ag
nanocrystals coated with oleylamine (C18-NH2) and differed by their diameters: (a, f) 2.2 nm
(b, g) 4.1 nm (c, h) 5.9 nm (d, i) 8.7 nm (e, j) 12.9 nm. The scale bars in the optical images all
are 1cm.

Chapter 4 Surface Plasmon Resonance of Silver Nanocrystals Differing by Sizes and Coating Agents
Ordered In 3D Supracrystals
91
NCs Diameter (nm)
En
erg
y (
eV
)
Wa
ve
leng
th (
nm
)
in the presence of DEG
in the absence of DEG
aaaaaa aaa
a
b
Energy (eV)
Ab
so
rptio
n e
ffic
ien
cy (
a.
u.)
a
Figure S7. (a) Normalized SPR spectra of Ag supracrystalline films coated with C18-NH2
differing by nanocrystal sizes obtained from the DEG method at incident angle of 0O. (b)
Plots of the SPR peak positions with various Ag nanocrytal sizes: (red sphere) supracrystals
produced in the presence of DEG; (black triangle) supracrystals produced in the absence of
DEG.

Ag nanocrystals differing by their coating agents: unexpected behaviors
92
Ab
so
rption
effic
ien
cy
Energy (eV)
Figure S8. SPR spectra of the supracrystal films of nanocrystals coated with C18-NH2
differing by nanocrystal sizes obtained from DEG method at incidence angles of 60 o
absence of DEG
presence of DEG
SP
R p
ea
k p
ositio
n (
eV
)
δ pp /D
Wave
len
gth
(n
m)
Figure S9. Plot of the longitudinal and transverse SPR peak position value against δpp/D in
the absence (black) and presence of DEG (red).

Chapter 4 Surface Plasmon Resonance of Silver Nanocrystals Differing by Sizes and Coating Agents
Ordered In 3D Supracrystals
93
Table S1. Interparticle distance (δpp) between Ag nanocrystal coated with C18-NH2 within
the supracrystals obtained by DEG method, deduced from small angle X-ray scattering
(SAXRS) measurements; Longitudinal and transverse SPR peak position of the supracrystals
obtained from DEG method with various Ag-nanocrystal sizes coated with oleylamine (C18-
NH2).
Incident angle
Nanocrystal
size/nm 2.2 4.1 5.9 8.7 12.9
δpp /nm 2.9 2.8 3.1 3.3 2.7
0o E/eV 2.72 2.75 2.66 2.62 2.60
λ max /nm 456 451 466 473 477
60O
E/eV
longitudinal 2.71 2.75 2.67 2.62 2.60
λ max /nm 457 451 464 473 477
E/eV transverse 3.37 3.30 3.35 3.47 3.48
λ max /nm 367 376 370 357 356

Ag nanocrystals differing by their coating agents: unexpected behaviors
94

Chapter 5 Surface Chemistry Controls the Crystal Structures in Binary Nanocrystal
95
Chapter 5
Surface Chemistry Controls the Crystal Structures in
Binary Nanocrystal Superlattices
5.1 Abstract
Surface chemistry is of particular importance for nanocrystals in modulating their
chemistry and physical properties. In this chapter, we demonstrate that the hydrophobic
coating agent of nanocrystals can play a role in the formation of binary nanocrystal
superlattices where two distinct nanocrystals, coated with either the same or two different
coating agents. First we consider Ag nanorystals differing by their average diameters with
the same coating agent: oleylamine (OAM). Crystalline structures of the binary nanocrystal
superlattices, such as NaCl, AlB2, NaZn13 and MgZn2, are obtained and are in good
agreement with the hard sphere model predicted from the space-filling curves.
However, when the binary nancrystals differing by their diameters are coated with two
different ligands oleylamine (OAM) and dodecanethiol (DDT), the supercrystal structures
produced cannot be simple predicted from the space-filling curves and various structures
such as Cu3Au, CaB6, quasicrystalline ordering are produced. This ligands effect is also
extended to other binary system, such as Ag-Au and CoFe2O4-Ag. In the case of CoFe2O4-
Ag, packing motif of the periodic (32.4.3.4) Archimedean tiling can also be observed. For
binary nanocrystal mixtures containing two or more kinds of coating agents, rich crystal
phases can be produced, while the phase purity of the binary superlattices is much more
difficult to control despite the crystal domain size can also be up to micrometer scale in
some cases. These data implies that the ability to control the surface chemistry (ligand
exchange process) in binary system may provide another fruitful way to modify the crystal
phases in binary nanocrystal superlattices.
Ligand exchange mechanism is proposed in the binary system with multiple ligands,
which may affect the thermodynamics in the system. Hence the formation of a binary
superlattice with lower packing density may be favored kinetically because the required
energetic penalty is smaller than that for a denser structure.

Ag nanocrystals differing by their coating agents: unexpected behaviors
96
5.2 Article : Surface Chemistry Controls the Crystal Structures in Binary
Nanocrystal Superlattices
Surface Chemistry Controls the Crystal Structures in Binary
Nanocrystal Superlattices
Jingjing Wei,a,b Nicolas Schaeffer,a,b Marie-Paule Pileni*a, b, c
a Sorbonne Universités, UPMC Univ Paris 06, UMR 8233, MONARIS, F-75005, Paris,
France
b CNRS, UMR 8233, MONARIS, F-75005, Paris, France
c CEA/IRAMIS, CEA Saclay, 91191, Gif-sur-Yvette, France
INDRODUCTION
Self-assembly of micrometer-sized colloids have been intensively studied, and the
phase behavior of those colloids is determined by minimizing the free energy F = U – TS
or, since those colloids are forbidden to interpenetrate and the thermal energy U is a
constant, by maximizing the entropy S.1-5 Coming to the nanoscale, owing to the surface
coat of flexible organic molecules, the assembly process is accompanied by effective
control over the interactions between the nanocrystals and all entropic forces.6-8 The
interaction between nanocrystals can be described by a soft model, which assumes
isotropic nanocrystal interaction potentials and, thus predicts the formation of close-packed
arrays.9,10 However, the electrical charge induced by ligand and the surface coverage of the
ligand introduces important perturbations that can lead to the formation of superlattices
with lower packing density.11,12 Although advances have been made using a variety of
electrostatic forces, covalent and noncovalent molecular interactions, to control the crystal
structure, it remains a challenge to use spontaneous self-assembly to predict the phase
structures comprised of two different types of building blocks, namely binary nanocrystal
superlattices.13
A variety of crystal phases in binary nanocrystal superlattices have been fabricated
from nanocrystals of semiconductors, metals and oxides, and the prediction of crystal

Chapter 5 Surface Chemistry Controls the Crystal Structures in Binary Nanocrystal
97
structures is mainly replies on the space-filling principles. In addition to the well-known
crystal structures analogous to NaCl, AlB2, NaZn13 and laves phases that observed in
binary microcolloids,14-16 other phases such as CuAu-type, Cu3Au-type, Fe4C-type, CaB6-
type as well as quasicrystalline ordering are also discovered in binary nanocrystal
superlattices.17-20 The emergence of these binary nanocrystal superlattices that cannot be
simply predicted from the hard-sphere models needs to be further studied.
In the present paper, colloidal binary nanocrystal mixtures containing two distinct
nanocrystals with either the same surface coating, or the different surface coating, are used
to grow binary nanocrystal superlattices, respectively. We describe a systematic study on
binary nanocrystal superlattices from Ag-Ag binary mixtures with two distinct nanocrystal
sizes, aiming to shed light on the effect of surface capping on the structure control of
binary nanocrystal superlattices. Furthermore, this effect can be extended to the other
binary systems, such as Ag-Au, and CoFe2O4-Ag.
EXPERIMENTAL SECTIONS
Materials. Silver nitrate (99.9%), methanol (99.8%), o-dichlorobenzene (99%),
oleylamine (70%), dodecanediol (99%), dodecanethiol (99%) and tert-butylamine (97%)
were purchased from Sigma, Chloro(triphenylphosphine)gold (98%) was purchased from
STREM, toluene (98%) from Riedel de Haen, ethanol (99.8%) from Prolabo,. All reagents
were used as received without further purification.
Apparatus. Transmission electron microscopy (TEM) images were obtained with a
JEOL JEM 1011(100 kV). High-resolution scanning electron microscopy (HRSEM)
images were obtained with Hitachi Su-70 instrument. The optical spectra Measurements
have been performed on a conventional Varian Cary 5000 spectrophotometer in the energy
interval 1.9-4.9 eV.
Synthesis of nanocrystals. Ag Nanocrystals with diameter of 3.7-nm and 5.5-nm
were synthesized with hot injection method and the coating agent used is oleylamine 21.
For the synthesis of smaller 2.9-nm Ag nanocrystals, 100 μL of oleic acid and 1 mL of
oleylamine were added. While the oleic acid was washed five times with ethanol-toluene
cycle, and additional 50 μL of oleylamine was added during the washing cycle. The 7.5,
8.2, 9.6 and 11.9 nm Ag nanocrystals were synthesized with one-pot method and the
coating agent is also oleylamine.22 Thiol coated 4-nm Ag nanocrystals were prepared by
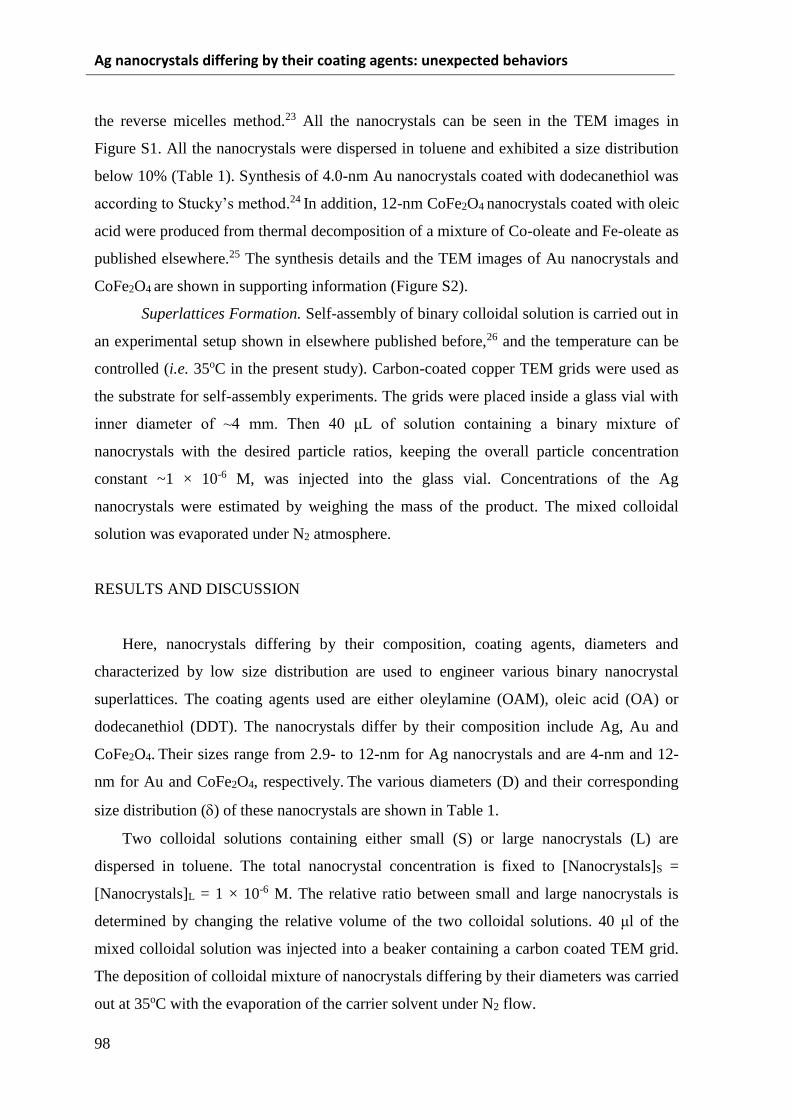
Ag nanocrystals differing by their coating agents: unexpected behaviors
98
the reverse micelles method.23 All the nanocrystals can be seen in the TEM images in
Figure S1. All the nanocrystals were dispersed in toluene and exhibited a size distribution
below 10% (Table 1). Synthesis of 4.0-nm Au nanocrystals coated with dodecanethiol was
according to Stucky’s method.24 In addition, 12-nm CoFe2O4 nanocrystals coated with oleic
acid were produced from thermal decomposition of a mixture of Co-oleate and Fe-oleate as
published elsewhere.25 The synthesis details and the TEM images of Au nanocrystals and
CoFe2O4 are shown in supporting information (Figure S2).
Superlattices Formation. Self-assembly of binary colloidal solution is carried out in
an experimental setup shown in elsewhere published before,26 and the temperature can be
controlled (i.e. 35oC in the present study). Carbon-coated copper TEM grids were used as
the substrate for self-assembly experiments. The grids were placed inside a glass vial with
inner diameter of ~4 mm. Then 40 μL of solution containing a binary mixture of
nanocrystals with the desired particle ratios, keeping the overall particle concentration
constant ~1 × 10⁻⁶ M, was injected into the glass vial. Concentrations of the Ag
nanocrystals were estimated by weighing the mass of the product. The mixed colloidal
solution was evaporated under N2 atmosphere.
RESULTS AND DISCUSSION
Here, nanocrystals differing by their composition, coating agents, diameters and
characterized by low size distribution are used to engineer various binary nanocrystal
superlattices. The coating agents used are either oleylamine (OAM), oleic acid (OA) or
dodecanethiol (DDT). The nanocrystals differ by their composition include Ag, Au and
CoFe2O4. Their sizes range from 2.9- to 12-nm for Ag nanocrystals and are 4-nm and 12-
nm for Au and CoFe2O4, respectively. The various diameters (D) and their corresponding
size distribution () of these nanocrystals are shown in Table 1.
Two colloidal solutions containing either small (S) or large nanocrystals (L) are
dispersed in toluene. The total nanocrystal concentration is fixed to [Nanocrystals]S =
[Nanocrystals]L = 1 × 10⁻⁶ M. The relative ratio between small and large nanocrystals is
determined by changing the relative volume of the two colloidal solutions. 40 μl of the
mixed colloidal solution was injected into a beaker containing a carbon coated TEM grid.
The deposition of colloidal mixture of nanocrystals differing by their diameters was carried
out at 35oC with the evaporation of the carrier solvent under N2 flow.

Chapter 5 Surface Chemistry Controls the Crystal Structures in Binary Nanocrystal
99
Table 1. Various parameters of nanocrystals used as building blocks for the growth binary
nanocrystal superlattices in the present work.
Nanocrystal@coating
agent Diameter/nm
Diameter
distribution Deff/nm
Deff
distribution
Ag@OAM#
2.9 8% 5.9 7%
3.7 6% 6.3 6%
5.5 7% 8.0 6%
7.5 8% 9.9 7%
8.2 7% 10.8 5%
9.6 7% 12.1 6%
11.9 6% 14.3 5%
Ag@DDT* 4.0 9% 6.0 9%
Au@DDT* 4.0 8% 5.9 6%
CoFe2O4@OA& 12.0 5% 14.0 6%
OAM#: oleylamine; DDT*: dodecanethiol; OA&: oleic acid
The effective nanocrystal diameter, Deff, is defined as the center-to-center distance
between nanocrystals self-ordered in a compact hexagonal network, i.e., as the sum of
metal core diameter and twice the thickness of the organic ligand. The Deff of the
nanocrystals in this study are shown in Table 1. The effective diameter ratio, γeff, is defined
as γeff = Deff-small/Deff-large, plays a determining role during the assembly of binary
mixtures.28 By mixing the two colloidal solutions and by depositing the mixture on the
TEM grid, during the evaporation process, the system is expected to adopt the crystal
structure corresponding to the most efficient space filling system and reach the maximum
packing density ρ for a given ratio of the sphere radii γ.29
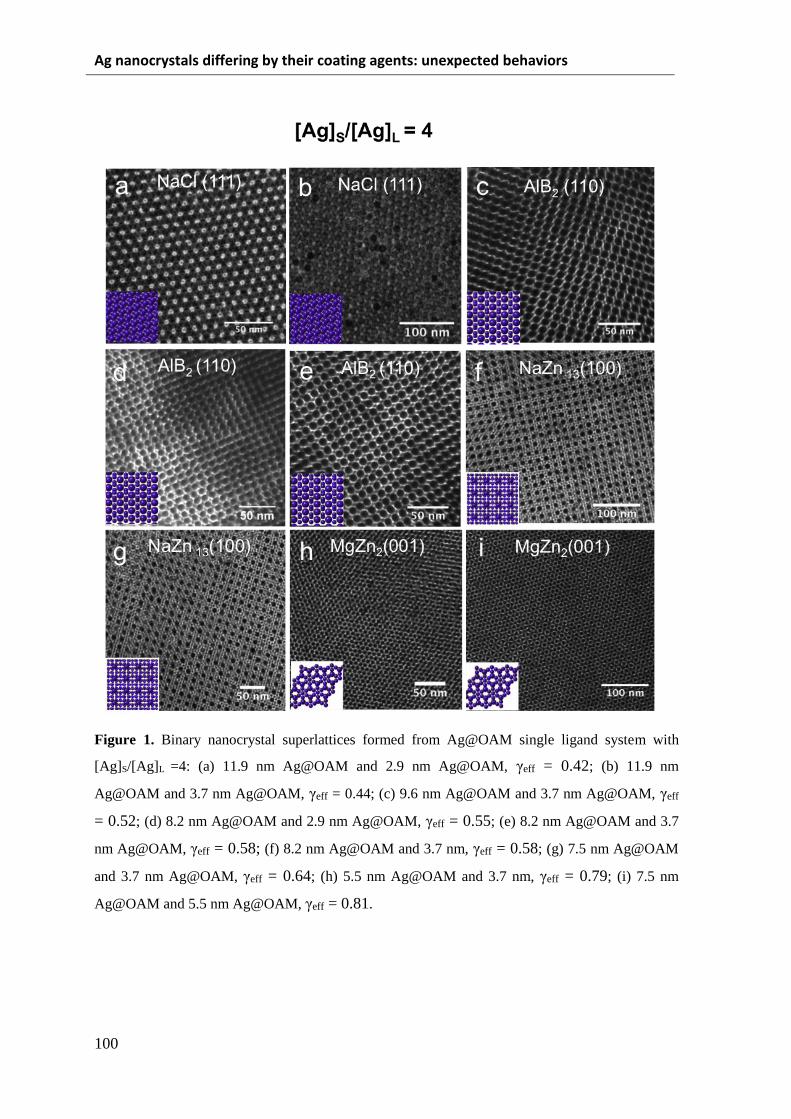
Ag nanocrystals differing by their coating agents: unexpected behaviors
100
Figure 1. Binary nanocrystal superlattices formed from Ag@OAM single ligand system with
[Ag]S/[Ag]L =4: (a) 11.9 nm Ag@OAM and 2.9 nm Ag@OAM, γeff = 0.42; (b) 11.9 nm
Ag@OAM and 3.7 nm Ag@OAM, γeff = 0.44; (c) 9.6 nm Ag@OAM and 3.7 nm Ag@OAM, γeff
= 0.52; (d) 8.2 nm Ag@OAM and 2.9 nm Ag@OAM, γeff = 0.55; (e) 8.2 nm Ag@OAM and 3.7
nm Ag@OAM, γeff = 0.58; (f) 8.2 nm Ag@OAM and 3.7 nm, γeff = 0.58; (g) 7.5 nm Ag@OAM
and 3.7 nm Ag@OAM, γeff = 0.64; (h) 5.5 nm Ag@OAM and 3.7 nm, γeff = 0.79; (i) 7.5 nm
Ag@OAM and 5.5 nm Ag@OAM, γeff = 0.81.

Chapter 5 Surface Chemistry Controls the Crystal Structures in Binary Nanocrystal
101
Binary mixtures of Ag nanocrystals differing by their diameters and coated with
oleylamine (OAM) called for simplicity Ag@OAM are first considered. The concentration
ratio [Ag]S/[Ag]L is fixed to 4. The large nanocrystals is characterized by an average
diameter of 11.9-nm with a size distribution of 6% whereas the diameter and size
distribution of small nanocrystals are 2.9 nm and 8% respectively with γeff = 0.42. In these
conditions, AB-type binary superlattices were produced as shown in Figure 1a, where the
small Ag@OAM nanocrystals are located into the vacancies between large Ag
nanocrystals, isostructural with NaCl (Space Group Fm3m).30 The TEM images show
typical (111) crystal planes of NaCl-type binary superlattices with the corresponding
crystal model in the insets. The size of crystal domains of this NaCl-type binary structures
is up to ~10 micrometers (Figure S3, Supporting Information). Note that in addition to the
binary system, in some part of the TEM grid, single-component superlattices self-
assembled from 2.9-nm Ag nanocrystals can also be found. Although we mainly focused
on the formation of binary structures, the formation of single component nanocrystal
superlattices are also mentioned when observed and summarized in Tables 2. By keeping
the large nanocrystals as 11.9-nm while replacing the smaller ones with 3.7-nm that
induces the γeff increasing to 0.44, similar features are obtained with the formation of
NaCl-type binary structures (Figure 1b and Figure S4). To increase the γeff value to 0.52,
the average size of larger nanocrystals used was set to be 9.6-nm and the same small
nanocrystals (3.7nm) were kept. In those conditions, the TEM images show the appearance
of AlB2-type structures (Figure 1c). A further increase of γeff to 0.55 and 0.58 by using
large (8.2-nm) and small (2.9-nm and 3.7-nm) nanocrystals, respectively, long-range
ordered AlB2-type superlattices (Figure 1d) without any detectable single-component
superlattices were produced. Yet another increase of γeff to 0.58 (8.2-nm and 3.7-nm) and
0.64 (7.5-nm and 3.7-nm) induces the formation of NaZn13- (Figure 1f and 1g) binary
structures. Finally, increasing the γeff value to 0.79 (5.5-nm and 3.7-nm) and 0.81 (7.5-nm
and 5.5-nm) led to the formation of long-range ordered MgZn2-type binary structures
(Figure 1h and1i).
The data presented above are obtained for [Ag]S/[Ag]L = 4. Previous studies showed that
the change of the relative volume of colloidal solutions can induce the phase
transformation in binary nanocrystal superlattices.31 Here, the relative volume of colloidal
solutions containing either small or large Ag@OAM nanocrystals were modulated, and the
results in Table 2 show that similar data were produced with [Ag]S/[Ag]L= 2 and 10 (See

Ag nanocrystals differing by their coating agents: unexpected behaviors
102
figures S5 and S6 for TEM images). In some cases, it appears amorphous phases and
single-component Ag superlattices.
Table 2. The influence of the nanocrystal concentration ratios [Ag]S/[Ag]L and effective
diameter ratios γeff on the crystal structures of binary superlattices assembled from
bidisperse Ag@OAM nanocrystals.
Nanocrystal ratios
[Ag]S/[Ag]L
2:1 4:1 10:1
Aglarge
size
Agsmall
size
Effective
size ratio
γeff
11.9 nm 2.9 nm ~0.42 NaCl NaCl+ SCS* NaCl + SCS*
11.9 nm 3.7 nm ~0.44 NaCl NaCl + SCS* NaCl + SCS*
9.6 nm 3.7 nm ~0.52 AlB2 SCS* + AlB2 SCS* + AlB2
8.2 nm 2.9 nm ~0.55 AlB2 AlB2 AlB2 + SCS*
8.2 nm 3.7 nm ~0.58 AlB2 AlB2 + NaZn13 NaZn13
7.5 nm 3.7 nm ~0.64 NaZn13 +
Am⌘ NaZn13+ Am⌘ NaZn13 + Am⌘
5.5 nm 3.7 nm ~0.79 MgZn2 + Am⌘ MgZn2 +SCS* +
Am⌘ SCS*+ Am⌘
7.5 nm 5.5 nm ~0.81 MgZn2 MgZn2 +SCS* MgZn2+SCS*+
Am⌘
SCS*: single component nanocrystal superlattices
Am⌘: amorphous films

Chapter 5 Surface Chemistry Controls the Crystal Structures in Binary Nanocrystal
103
Stable in hard
sphere model NaCl AlB2 NaZn13 MgZn2
Ag@OAM
single
ligand
system NaCl
AlB2
AlB2
NaZn13
NaZn13 MgZn2
AlB2
a
b
Size ratio geff
NaZn13 CaB6
QC Ag@OAM
Ag@DDT
two ligands
system
AlB2
Cu3Au
AlB2
AlB2
NaZn13
Cu3Au NaZn13
Cu3Au
Amorphous
0.4 0.5 0.6 0.7 0.8 0.9
c NaCl
Figure 2. Various binary structures formed: (a) single ligand system (Ag@OAM); (b) hard
sphere theoretical predictions; (c) two ligands (Ag@OAM) and (Ag@DDT) system.
Figures 2a and 2b clearly show a sequential structural evolution with the increase of γ
going from NaCl, AlB2, NaZn13, to MgZn2. All these crystal phases can also be observed
in the microsized colloidal systems without the “soft” surface layer coating, called hard-
sphere phases.16 In the hard sphere system, the self-organization of micrometer-sized
colloidal balls into binary structures was generally driven by pure entropic forces. During
the condensation of the colloidal balls, the entropic change is positive and reaches
maximum when the ordering has the highest packing density. To date, available theoretical
predictions can be made based on the calculation of free energy of entropy contribution,
and it was pointed out that NaCl, AlB2 and NaZn13 are stable in the range of 0.414 ≤ γ ≤
0.45, 0.45 ≤ γ ≤ 0.61 and 0.54 ≤ γ ≤ 0.625 respectively. Laves phases (MgZn2, MgCu2,
MgNi2) is stable in the range of 0.76 ≤ γ ≤ 0.84.14 Our results are highly consistent with the
theoretical calculation for hard spheres models. These data confirm that the hard sphere
model produced with microcolloids is also valid for nanocrystals with the same coating

Ag nanocrystals differing by their coating agents: unexpected behaviors
104
agent. Consequently the space filing curves can be applied to predict the crystal phases of
binary nanocrystal superlattices for the single ligand system.
The influence of the coating agent on the formation of binary structures was then
investigated in order to verify if the hard sphere model is still responsible for the crystal
phases of binary nanocrystal superlattices in the case of colloidal binary mixtures contain
two kinds of nanocrystals differing by their coatings agents. Thus, 11.9-nm Ag@OAM
nanocrystals were used as large nanocrystals, whereas small nanocrystals was replaced by
4.0-nm Ag nanocrystals coated with dodecanethiol (Ag@DDT). This corresponds to γeff
value of ~0.42. The other experimental conditions remained the same and [Ag]S/[Ag]L was
kept equal to 4. Remarkable changes occur with this replacement. Figure 3b shows long-
range ordered crystal domains up to micrometer scale of CaB6-type superlattices, where six
small Ag nanocrystals forming the octahedron, and this octahedron is surrounded by the
simple cubic packed large Ag nanocrystal and matched well with the corresponding crystal
model (inset in Figure 3b). This corresponds to the (100) plane of the CaB6 phase. Note
that this is opposite to what was observed with Ag@OAM binary systems, where neither
the NaCl structure nor the single component superlattices could be observed. In some
regions of the TEM grid, it was observed that the octahedral shape with six small Ag
nanocrystals and single small Ag nanocrystals are separated by the large Ag nanocrystals
in a random manner (Figure. 3d). While the fast Fourier transform (FFT) pattern shows the
12-fold symmetry for those structures, revealing its dodecagonal quasicrystalline (QC)
order, which well agrees with the result of previous observation of such aperiodic
structure.32 Figure 3g shows that the layer-by-layer growth process of such QC
superlattices is detected. The domain size of such QC order is very large and reaches
several micrometers shown in Figure 4. It is of importance to note that the crystal domain
boundaries between CaB6 phase and QC phase are observed, as shown in Figure 3f, and
agree with the reported growth mechanism based on entropic force.31 It is also worth
noting that this is the first demonstration on the QC order in the silver/silver binary
materials. Similar experiments were carried out by changing the relative concentration
[Ag]S/[Ag]L from 2 to 10 and keeping the γeff =0.42, QC ordered superlattices were
obtained for 2<[Ag]S/[Ag]L<4. For [Ag]S/[Ag]L=10, only CaB6 and single component
superlattices were produced (Table 3).

Chapter 5 Surface Chemistry Controls the Crystal Structures in Binary Nanocrystal
105
Figure 3. TEM images of binary superlattices formed with 11.9-nm Ag@OAM and 4.0-
nm Ag@DDT binary mixtures: (a) schematic information of multiple ligand system; (b)
TEM images of CaB6-type binary nanocrystal superlattices with (100) planes parallel to the
substrate; (c) corresponding FFT pattern to panel (b); (d) TEM images of QC order; (e)
corresponding FFT pattern to panel (d); (f) mixture of the QC order in binary nanocrystal
superlattices and CaB6-type binary nanocrystal superlattices; (g) TEM images of large-
scale QC with layer by layer structures (the numbers correspond to the different layers of
QC order).

Ag nanocrystals differing by their coating agents: unexpected behaviors
106
Figure 4. (a) HRSEM (High-Resolution Scanning Electron Microscopy) images of QC
ordered superlattices formed with 11.9-nm Ag@OAM and 4.0-nm Ag@DDT binary
mixtures; (b) low magnified TEM images of QC ordered superlattices formed with 11.9-
nm Ag@OAM and 4.0-nm Ag@DDT binary mixtures.
Building on these data, we studied the influence on the overall binary system phase
diagram when the large and small nanocrystals are stabilized by two distinct coating agent,
respectively. Hence, experiments similar to those described above were carried out with
Ag@OAM as the larger nanocrystals (5.5-nm ≤ D ≤ 11.9-nm) and Ag@DDT as the
smaller one (D = 4-nm). By changing these parameters the γeff values evolve from 0.42 to

Chapter 5 Surface Chemistry Controls the Crystal Structures in Binary Nanocrystal
107
0.75. The total Ag concentration remained unchanged (1 × 10⁻⁶ M) and the relative
concentration [Ag]S/[Ag]L evolved from 2 to 10. On increasing γeff to 0.50, various phases,
including NaCl, AlB2, Cu3Au and NaZn13 structures appear, as depicted in Table 3 and
TEM images in Figure 5. It is worth noting that AlB2, NaCl and NaZn13 phases are still
present in these conditions. According to hard sphere theoretical predictions, AlB2 is the
predictable product, whereas the other structures, such as NaCl, Cu3Au and NaZn13, are not
expected to be the outcome at this size ratio (γeff = 0.50) (Figure 2c). Furthermore, when
γeff is increased to 0.56 and 0.61, unstable phase, such as Cu3Au structure with a rather low
packing efficiency was formed, and is not expected (see Figure S7, Supporting
Information). Furthermore, MgZn2 structure that is a highly stable phase in hard sphere
model, but is not produced at a large γeff (~0.75), instead is the amorphous film without any
ordering.
Table 3. The influence of the nanocrystal concentration ratios [Ag]S/[Ag]L and effective
diameter ratios γeff on the crystal structures of binary superlattices assembled of Ag
nanocrystals differing by their sizes and coating agents (Ag@OAM and Ag@DDT)
Nanocrystal ratios
[Agsmall]/[Aglarge]
2:1 4:1 10:1
Aglarge size effective size
ratio γ
11.9 nm ~0.42 quasicrystal +
CaB6+ Am⌘
CaB6+quasicrystal CaB6+SCS*
9.6 nm ~0.50 NaCl + AlB2 +
Cu3Au
AlB2 + Cu3Au AlB2 + Cu3Au +
NaZn13
8.2 nm ~0.56 AlB2 + NaZn13 AlB2 + NaZn13+
Cu3Au
NaZn13
7.4 nm ~0.61 AlB2 + NaZn13 AlB2 + Cu3Au Am + SCS*
5.5 nm ~0.75 Am⌘ Am⌘ Am⌘
SCS*: single-component nanocrystal superlattices
Am⌘: amorphous film

Ag nanocrystals differing by their coating agents: unexpected behaviors
108
Figure 5. TEM images of binary superlattices formed with Ag@OAM and Ag@DDT
binary mixtures: (a) schematic information of multiple ligand system; (b1-b4) TEM images
of Cu3Au, AlB2, NaCl and NaZn13 phases with γeff ≈ 0.50; (c1-c3) TEM images of NaZn13,
Cu3Au and AlB2 phases with γeff ≈ 0.56; (d1-d3) TEM images of NaZn13, AlB2 and Cu3Au
phases with γeff ≈ 0.61. Insets in all figures are the corresponding crystal models,
respectively.

Chapter 5 Surface Chemistry Controls the Crystal Structures in Binary Nanocrystal
109
From these data it is clearly shown that the binary structures produced with two
different coating agents cannot be simply predicted from the hard sphere model.
Furthermore, the phase diagram in Figure 2b and 2c show marked changes compared to
what was obtained with same coating agents for both small and large nanocrystals.
At this stage we have to raise the following question: is the use of two different
ligands to coat the nanocrystals one of the key parameters to produce binary superlattices
with lower packing density, such as QC and CaB6 structure? To answer this question,
Ag@DDT was replaced by Au@DDT while keeping the same average diameter of 4.0-nm
for Au nanocrystals. Hence we can consider a binary mixture of 11.9-nm Ag@OAM and
4.0-nm Au@DDT with an effective size ratio of γeff = 0.41. The overall Ag and Au
nanocrystals concentration remains the same (10-6 M) and the nanocrystal concentration
ratio, [Au]S/[Ag]L = 4. In those conditions, CaB6 and dodecahedral QC structures are
clearly observed (Figure 6), which is consistent with the result obtained from Ag@OAM +
Ag@DDT binary system with a similar γeff value. Note that the size of the crystal domains
of either CaB6 or dodecahedral QC structures produced are smaller than that of Ag@OAM
+ Ag@DDT binary system.

Ag nanocrystals differing by their coating agents: unexpected behaviors
110
Figure 6. TEM images of binary nanocrystal superlattices from Au-Ag binary mixtures
produced with [Au]S/[Ag]L = 4: (a) schematic information of multiple ligands system:
11.9-nm Ag@OAM and 4-nm Au@DDT; (b) low magnification of TEM images of QC
superlattices and CaB6-type superlattices; (c) and (e) magnification of the area of panel
(b); (d) and (f) corresponding FFT pattern of panel (c) and (e).
From these data it is reasonable to assume that a way to produce QC order in binary
superlattices is related to the fact that small and large nanocrystals involved in the binary
systems need to be coated by two different ligands. To support this claim we consider other
types of nanocrystals differing by sizes and coating agents: 12-nm CoFe2O4 nanocrystals
coated with oleic aid (OA) and either Ag nanocrystals coated either with oleylamine
(Ag@OAM) or with dodecanethiol (Ag@DDT) having an average diameter of 3.7nm and
4-nm, respectively. Figure 7 shows binary systems of CoFe2O4@OA + Ag@OAM
(Figures 7a, 7b and 7c) and of CoFe2O4@OA + Ag@DDT (Figures 7d, 7e and 7f). TEM
image in Figure 7b shows the packing motif of the periodic (32.4.3.4) Archimedean tiling,
and the corresponding FFT pattern inset indicates its 4-fold rotational symmetry in the case
of CoFe2O4@OA and 3.7-nm Ag@OAM binary mixture.32,33 In addition, dodecagonal QC
structures and AlB2-type structures can also be observed in Figure 7c. With CoFe2O4@OA

Chapter 5 Surface Chemistry Controls the Crystal Structures in Binary Nanocrystal
111
+ Ag@DDT binary system, CaB6-type and dodecagonal QC structures are observed
(Figure 7e and 7f). Hence, in both cases CaB6-type and dodecagonal QC structures are
observed instead of that expected from the hard sphere model (NaCl). This clearly
demonstrates that the use of two different coating agents for small and large nanocrystals
induces the formation of both CaB6-type and dodecagonal QC structures.
Figure 7. (a) Schematic information of multiple ligands system: CoFe2O4@OA and
Ag@OAM; (b) and (c) TEM image of the binary nanocrystal superlattices formed with
12.0-nm CoFe2O4@OA and 3.7-nm@ Ag@OAM binary mixtures with [Ag]S/[CoFe2O4]L
= 4; (d) schematic information of multiple ligands system: CoFe2O4@OA and Ag@DDT;
(e) and (f) TEM image of the binary nanocrystal superlattices formed with 12.0-nm
CoFe2O4@OA and 3.7-nm@ Ag@DDT binary mixtures with [Ag]S/[CoFe2O4]L = 4.
A careful survey on the literature shows that the formation of either CaB6 or QC
structure in binary superlattices is obtained with nanocrystals having two different coating
agents. This is observed for Fe2O3@oleic acid (OA) + Au@DDT, Fe3O4@OA + Au@DDT
and PbS@OA + Pd@DDT binary systems (Summarized in Table S1).32-34 These data
highly support our claim saying that, in order to produce either CaB6 and QC structures in

Ag nanocrystals differing by their coating agents: unexpected behaviors
112
binary superlattices, the small and large nanocrystals need to be coated by two different
coating agents.
To explain this effect, the first attempt could be to consider the van der Waals
interactions. A recent simulation has shown that these interactions between metal
nanocrystals are strong and the pair potential that exceeds the thermal energy (kBT) could
play a major role during the assembly of binary nanocrystal superlattices.14 The Hamaker
constant for the various nanocrystals used (Ag, Au or CoFe2O4) changes with the material
used, the nanocrystal size and the coating agents differ from one binary system to another.
This indicates that the van der Waals interactions evolve from one system to another and
such parameter cannot be the unique one. The similarity of the data indicates that even
though the van der Waals interactions play a role, other forces have to be taken into
account. Previous studies pointed out that the additional surfactant could induce the
electrical charges on nanocrystals even in non-polar solvent, and this surface electrical
charge may play a role in the binary assemblies in terms of electrostatic interactions.13 As
mentioned above, the nanocrystals were washed several times to get rid of residual
surfactant molecules such as either OAM or DDT. Hence the electrostatic interaction or
Coulombic interaction is not account for the forces involved in the binary system. Besides,
our recent studies demonstrated that the magnetic force could play a role during the
evaporation-induced-binary-assembly process, but it is a unique example where
ferromagnetic nanocrystals are involved.35
Then we have to take into account the procedure used to grow nanocrystal
superlattices: the deposition process takes place at 35oC and the solvent evaporation time is
close to 4h. During the continuous drying process, dynamic ligand adsorption/desorption
on nanocrystal surface will take place in the colloidal solution even though the bonding
between the nanocrystal cores and the coating agents differ from one system to another.
The bonding between nanocrystal core and coating agent can be described by its
adsorption and desorption equilibrium constant, K, and the adsorption and desorption
kinetic constants, ka and kd, respectively.
For single ligand system, where QC structure are not detected, we can assume that the
adsorption and desorption kinetic constants, ka and kd, are kept constant and are
independent on the nanocrystals’ sizes.36 Then the thermodynamic term K in binary system
remains the same. Hence the assembly of binary nanocrystal mixture with the same coating
agents is mainly determined by their effective size ratios. Pure entropic force is responsible

Chapter 5 Surface Chemistry Controls the Crystal Structures in Binary Nanocrystal
113
for the formation of binary nanocrystal superlattices regardless of the other forces. As a
result, the binary nanocrystal superlattices can be well predicted from the space-filling
curves at a certain size ratio. As is known, for the single-component nanocrystal system,
the solvent-evaporation induced fcc superlattices with the highest packing density of ~0.74
are frequently observed,37,38 which agrees well with the hard sphere model purely driven
by the entropic force.
While for binary system with two different kinds of coating agents, the
thermodynamic constant K differs from one kind of nanocrystal to another. During the
continuous evaporation of the carrier solvent, we can assume that ligand exchange
processes take place as illustrated by the Scheme S1 (Supporting Information). This can be
inferred from our previous study where we used a ligand exchange procedure to change the
coating agents of Ag nanocrystals.21 The complete evaporation of the carrier solvent
provides sufficient time for the ligand exchange process in the colloidal solution. During
the formation of nanocrystal superlattices, the system must pay a large energetic penalty to
take the ligand exchange process, which may affect the thermodynamics of the assembly of
binary nanocrystal superlattices during the solvent evaporation. Thus the formation of a
superlattice with lower packing density may be favored kinetically because the required
energetic penalty is smaller than that for a denser structure. In other words, a binary
structure is probably in a kinetically trapped state at a local free energy minimum despite
the lower packing density. As a result, binary superlattices, such as CaB6, QC, and Cu3Au
phases with lower packing density that are known not to be found in hard sphere systems
can be produced in the nanoscale binary system. These data implies that the ability to
control the surface chemistry in binary system may provide another fruitful way to control
the crystal structures in binary nanocrystal superlattices.
CONCLUSIONS
Here it is shown that by using one given coating agent, the binary superlattices are
predicted by using the model set up for atoms that takes into account the space-filling
principle. Four types of binary structures, NaCl, AlB2 and NaZn13, MgZn2 can be produced
driven by entropy. When two different coating agents are used to coat either the small or
large nanocrystals the phase diagram observed previously markedly changes with
appearance of various phases as quasicrystals, CaB6 and Cu3Au. The ligand exchange
process is responsible for the interparticle interactions between neighboring nanocrystals,
Ag nanocrystals differing by their coating agents: unexpected behaviors
114
resulting in diversity in binary nanocrystal superlattices including some structures with
lower packing density. These structures are formed probably due to the fact that it is in a
kinetically trapped state at a local free energy minimum. Our findings are of particular
importance for the design of novel 3D metamaterials from the numerous high-quality
colloidal nanocrystals available now.
REFERENCES
1. Sanders, J. V., Nature 1964, 204, 1151-1153.
2. Allpress, J. G.; Sanders, J. V., Surf. Sci. 1967, 7, 1-25.
3. Bartlett, P.; Ottewill, R. H.; Pusey, P. N., Phys. Rev. Lett. 1992, 68, 3801-3804.
4. Eldridge, M. D.; Madden, P. A.; Frenkel, D., Nature 1993, 365, 35-37.
5. Ohara, P. C.; Leff, D. V.; Heath, J. R.; Gelbart, W. M., Phys. Rev. Lett. 1995, 75 ,
3466-3469.
6. Korgel, B. A.; Fullam, S.; Connolly, S.; Fitzmaurice, D., J. Phys. Chem. B 1998,
102, 8379-8388.
7. Murray, C. B.; Kagan, C. R.; Bawendi, M. G., Annu. Rev. Mater. Sci. 2000, 30,
545-610.
8. Henry, A. I.; Courty, A.; Pileni, M. P.; Albouy, P. A.; Israelachvili, J., Nano Lett.
2008, 8, 2000-2005.
9. Murray, C. B.; Kagan, C. R.; Bawendi, M. G., Science 1995, 270, 1335-1338.
10. Pileni, M. P., Acc. Chem. Res. 2007, 40, 685-693.
11. Choi, J. J.; Bealing, C. R.; Bian, K.; Hughes, K. J.; Zhang, W.; Smilgies, D.-M.;
Hennig, R. G.; Engstrom, J. R.; Hanrath, T., J. Am. Chem. Soc. 2011, 133, 3131-3138.
12. Chan, H.; Demortiere, A.; Vukovic, L.; Kral, P.; Petit, C., ACS Nano 2012, 6, 4203-
4213.
13. Shevchenko, E. V.; Talapin, D. V.; Kotov, N. A.; O'brien, S.; Murray, C. B., Nature
2006, 439, 55-59;
14. Evers, W. H.; Nijs, B. D.; Filion, L.; Castillo, S.; Dijkstra, M.; Vanmaekelbergh, D.,
Nano Lett. 2010, 10, 4235-4241.
15. Bodnarchuk, M. I.; Kovalenko, M. V.; Heiss, W.; Talapin, D. V., J. Am. Chem. Soc.
2010, 132, 11967-11977.
16. Filion, L.; Dijkstra, M., Phys. Rev. E 2009, 79.
17. Vanmaekelbergh, D., Nano Today 2011, 6, 419-437.
Chapter 5 Surface Chemistry Controls the Crystal Structures in Binary Nanocrystal
115
18. Bodnarchuk, M. I.; Shevchenko, E. V.; Talapin, D. V., J. Am. Chem. Soc. 2011,
133, 20837-20849.
19. Shevchenko, E. V.; Talapin, D. V.; Murray, C. B.; O'brien, S., J. Am. Chem. Soc.
2006, 128, 3620-3637.
20. Bodnarchuk, M. I.; Erni, R.; Krumeich, F.; Kovalenko, M. V., Nano Lett. 2013, 13,
1699-1705.
21. Wei, J.; Schaeffer, N.; Pileni, M.-P., J. Phys. Chem. B 2014, 118, 14070-14075.
22. Peng, S.; Mcmahon, J. M.; Schatz, G. C.; Gray, S. K.; Sun, Y., Proc. Natl. Acad.
Sci. U. S. A. 2010, 107, 14530-14534.
23. Courty, A.; Richardi, J.; Albouy, P.-A.; Pileni, M.-P., Chem. Mater. 2011, 23,
4186-4192.
24. Zheng, N.; Fan, J.; Stucky, G. D. J. Am. Chem. Soc. 2006, 128, 6550-6551.
25. Goubet, N.; Portales, H.; Yan, C.; Arfaoui, I.; Albouy, P. A.; Mermet, A.; Pileni, M. P.,
J. Am. Chem. Soc. 2012, 134, 3714-3719.
26. Bodnarchuk, M. I.; Kovalenko, M. V.; Groiss, H.; Resel, R.; Reissner, M.; Hesser,
G.; Lechner, R. T.; Steiner, W.; Schaeffler, F.; Heiss, W., Small 2009, 5, 2247-2252.
27. Wan, Y. F.; Goubet, N.; Albouy, P. A.; Pileni, M. P., Langmuir 2013, 29, 7456-
7463.
28. Chen, Z.; O’Brien, S., ACS Nano 2008, 2, 1219-1229.
29. Parthe E., Z. Kristallogr. 1961, 115, 52-79.
30. Saunders, A. E.; Korgel, B. A., ChemPhysChem 2005, 6, 61-65.
31. Yang, Z.; Wei, J.; Pileni, M. P., Chem. Mater. 2015, 27,2152.
32. Talapin, D. V.; Shevchenko, E. V.; Bodnarchuk, M. I.; Ye, X.; Chen, J.; Murray, C.
B., Nature 2009, 461, 964-967.
33. Ye, X.; Chen, J.; Murray, C. B., J. Am. Chem. Soc. 2011, 133, 2613-2620.
34. Bodnarchuk, M.I.; Erni, R.; Krumeich, F.; Kovalenko, M.V. Nano Lett. 2013, 13,
1699–1705.
35. Yang, Z.; Wei, J.; Bonville, P.; Pileni, M.-P., J. Am. Chem. Soc. 2015, 137, 4487-4493.
36. Ji, X.; Copenhaver, D.; Sichmeller, C.; Peng, X., J. Am. Chem. Soc. 2008, 130, 5726-
5735.
37. Nagaoka, Y.; Chen, O.; Wang, Z.; Cao, Y. C., J. Am. Chem. Soc. 2012, 134, 2868-
2871.

Ag nanocrystals differing by their coating agents: unexpected behaviors
116
38. Wan, Y.; Goubet, N.; Albouy, P.-A.; Schaeffer, N.; Pileni, M.-P., Langmuir 2013,
29, 13576-13581.
Chapter 5 Surface Chemistry Controls the Crystal Structures in Binary Nanocrystal
117
5.3 Supporting Information
EXPERIMENTAL DETAILS
Synthesis of 4.0-nm Au@DDT nanocrystals
Au nanocrystals with 4.0 nm in diameter are synthesized by revisiting the Stucky
method.S1 Typically, two solutions are used. One consists of 0.20 mmol of
Chlorotriphenylphosphine Au (I) dissolved in 25 mL of toluene to which 500 μL of
dodecanethiol (DDT) is added. While the other one contains 5 mmol of tert-butylamine
borane dissolved in 2 mL of toluene. The two solutions are placed in a silicone oil bath at
100 oC and are stirred for 10 min. Subsequently tert-butylamine borane solution is injected
into the solution with gold salt swiftly. The colorless and clear mixture turns to brown and
reaches a dark purple red solution in 1 min, and this solution is kept at 100 oC for another 4
min followed by the remove of the oil bath. The Au nanocrystals are precipitated from the
colloidal solution by adding 10 mL of methanol. The supernatant is removed. The black
precipitate is dried in a nitrogen flow in order to eliminate the remaining solvent. The Au
nanocrystals are weighted and redispersed in toluene with desired nanocrystal
concentration.
Synthesis of 12.0-nm CoFe2O4@OA nanocrystals
12 nm CoFe2O4 nanocrsytals with an oleic acid capping are synthesized by
revisiting the method described by Bodnarchuk et al.S2 using octadecene and octyl ether as
the solvent. (Co,Fe) oleate mixture is prepared by combing 4.33 g FeCl36H2O in 40 mL
methanol are mixed with 2.00 g Co(Ac)24H2O in 20 mL methanol and with 20.1 g oleic
acid. 2.56 g NaOH in 160 mL methanol are added dropwise to the above solution under
vigorous stirring. A dark viscous product is separated and washed by 100 mL methol and
dissolved in 100 mL of hexane. The hexane solution is further washed 3 times by warm
water (~50 oC) and separated in a separatory funnel. The viscous product is obtained by
evaporating the hexane in a rotary evaporator. A stock precursor solution with a
concentration of 0.5 mol/kg is prepared by adding 1.48 g of octadecene to each gram of
mixed oleate.

Ag nanocrystals differing by their coating agents: unexpected behaviors
118
In a typical synthesis of 12 nm CoFe2O4 nanocrsytals, 4.8 g of precursor solution is
mixed with 0.38 g oleic acid and with 6.0 g oecadecene and 0.9 g octylether. The mixture
is heated to 110 oC and maintained at this temperature for 60 min under N2 protection.
Then the solution is heated to the boiling point of the solution (~308 oC) and is kept at this
temperature for 30 min followed by removal of the heater. The colloidal solution is washed
5 times using ethanol/hexane (1:1 v/v) by sedimenting and redispersing using
centrifugation. Finally, the CoFe2O4 nanocrsytals are weighted and redispersed in toluene
with desired nanocrystal concentration.
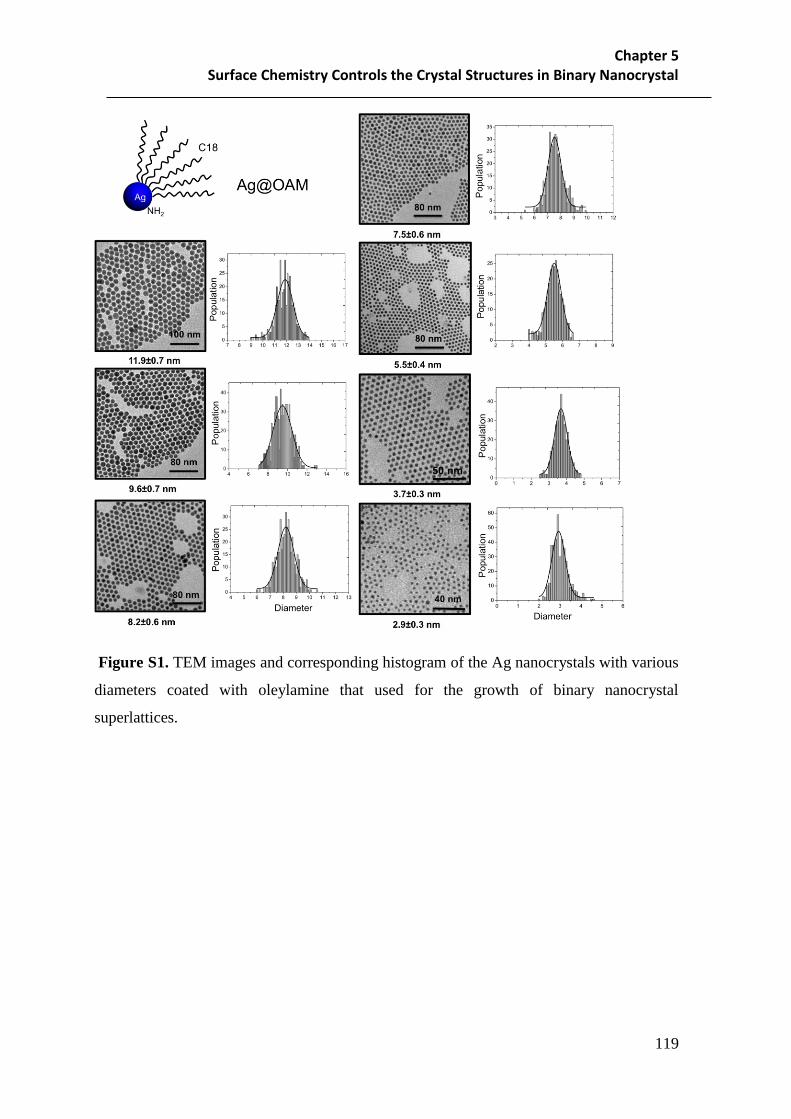
Chapter 5 Surface Chemistry Controls the Crystal Structures in Binary Nanocrystal
119
Figure S1. TEM images and corresponding histogram of the Ag nanocrystals with various
diameters coated with oleylamine that used for the growth of binary nanocrystal
superlattices.

Ag nanocrystals differing by their coating agents: unexpected behaviors
120
4.0±0.4 nm
Ag@DDT
30 nm
4.0±0.3 nm
Au@DDT CoFe2O4@OA
12.0±0.6 nm
100 nm
Diameter (nm) Diameter (nm) Diameter (nm)
Po
pu
lation
Po
pu
lation
Po
pu
lation
Figure S2. TEM images and corresponding histogram of the nanocrystals with various
diameters coated with different ligands that used for the growth of binary nanocrystal
superlattices.

Chapter 5 Surface Chemistry Controls the Crystal Structures in Binary Nanocrystal
121
Figure S3. Low magnification of TEM images of the binary nanocrystals superlattices : (a)
Binary nanocrystal superlattices formed from 8.2 nm Ag@OAM and 2.9 nm Ag@OAM
nanocrystals with [Ag]S/[Ag]L =4; (b) Binary nanocrystal superlattices formed from 11.9
nm Ag@OAM and 2.9 nm Ag@OAM nanocrystals with [Ag]S/[Ag]L =4; (c) Binary
nanocrystal superlattices formed from 8.2 nm Ag@OAM and 3.7 nm Ag@OAM
nanocrystals with [Ag]S/[Ag]L =4; (d) Binary nanocrystal superlattices formed from 7.5 nm
Ag@OAM and 5.5 nm Ag@OAM nanocrystals with [Ag]S/[Ag]L =4. The high contrast is
due to the low electron dosage in low magnification mode.
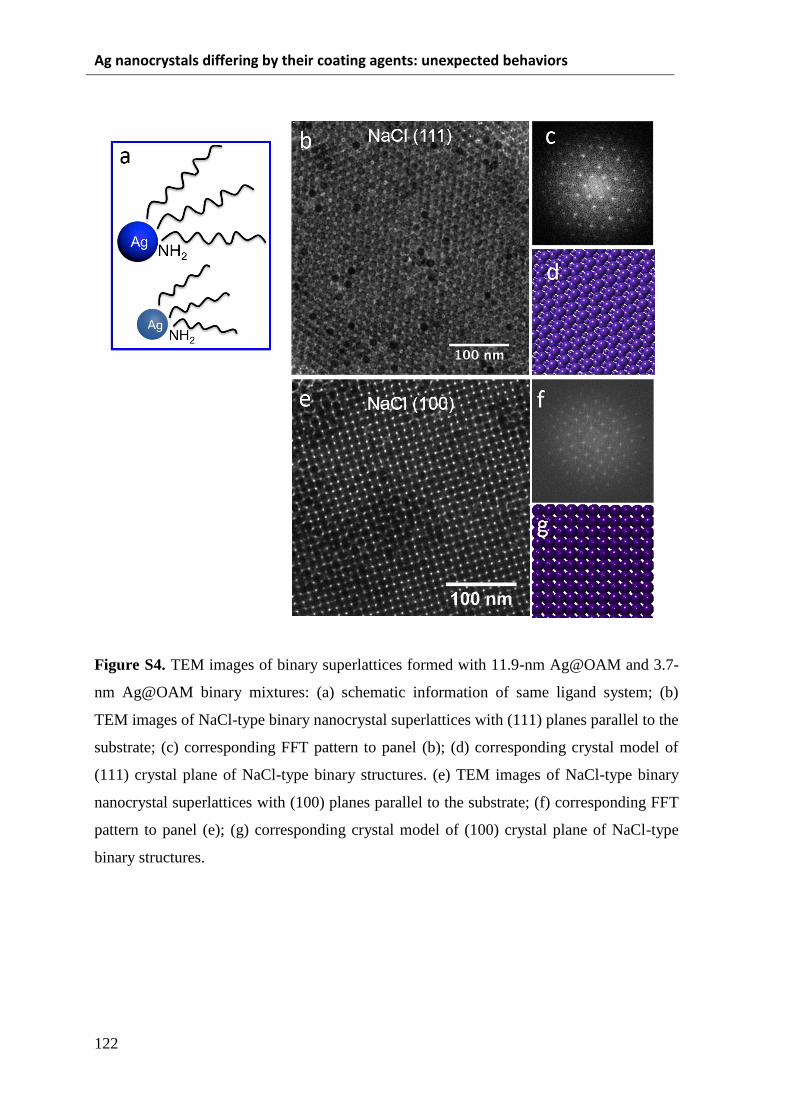
Ag nanocrystals differing by their coating agents: unexpected behaviors
122
Figure S4. TEM images of binary superlattices formed with 11.9-nm Ag@OAM and 3.7-
nm Ag@OAM binary mixtures: (a) schematic information of same ligand system; (b)
TEM images of NaCl-type binary nanocrystal superlattices with (111) planes parallel to the
substrate; (c) corresponding FFT pattern to panel (b); (d) corresponding crystal model of
(111) crystal plane of NaCl-type binary structures. (e) TEM images of NaCl-type binary
nanocrystal superlattices with (100) planes parallel to the substrate; (f) corresponding FFT
pattern to panel (e); (g) corresponding crystal model of (100) crystal plane of NaCl-type
binary structures.

Chapter 5 Surface Chemistry Controls the Crystal Structures in Binary Nanocrystal
123
Figure S5. Binary nanocrystal superlattices formed from Ag@OAM single ligand system
with [Ag]S/[Ag]L=2: (a) 11.9 nm Ag@OAM and 2.9 nm Ag@OAM, γeff = 0.42; (b) 11.9
nm Ag@OAM and 3.7 nm Ag@OAM, γeff = 0.44; (c) 9.6 nm Ag@OAM and 3.7 nm
Ag@OAM, γeff = 0.52; (d) 8.2 nm Ag@OAM and 2.9 nm Ag@OAM, γeff = 0.55; (e) 8.2
nm Ag@OAM and 3.7 nm Ag@OAM, γeff = 0.58; (f) 7.5 nm Ag@OAM and 3.7 nm
Ag@OAM, γeff = 0.64; (g) 5.5 nm Ag@OAM and 3.7 nm, γeff = 0.79; (h) 7.5 nm
Ag@OAM and 5.5 nm Ag@OAM, γeff = 0.81.
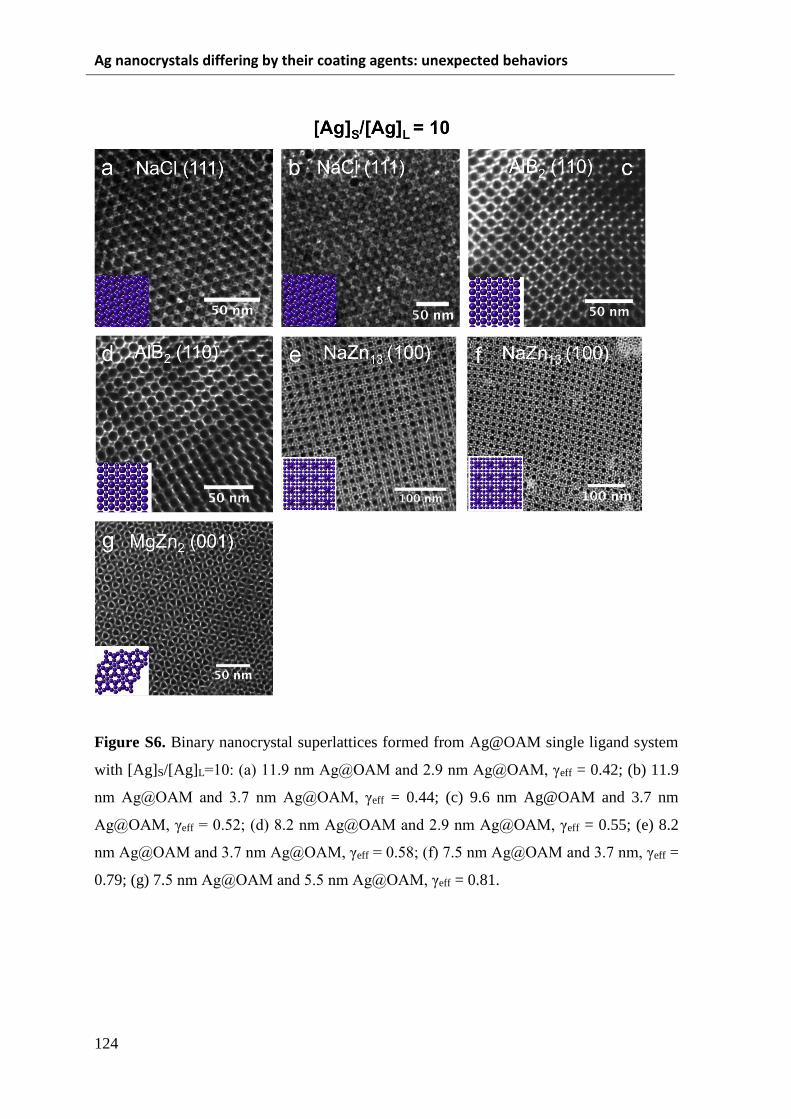
Ag nanocrystals differing by their coating agents: unexpected behaviors
124
Figure S6. Binary nanocrystal superlattices formed from Ag@OAM single ligand system
with [Ag]S/[Ag]L=10: (a) 11.9 nm Ag@OAM and 2.9 nm Ag@OAM, γeff = 0.42; (b) 11.9
nm Ag@OAM and 3.7 nm Ag@OAM, γeff = 0.44; (c) 9.6 nm Ag@OAM and 3.7 nm
Ag@OAM, γeff = 0.52; (d) 8.2 nm Ag@OAM and 2.9 nm Ag@OAM, γeff = 0.55; (e) 8.2
nm Ag@OAM and 3.7 nm Ag@OAM, γeff = 0.58; (f) 7.5 nm Ag@OAM and 3.7 nm, γeff =
0.79; (g) 7.5 nm Ag@OAM and 5.5 nm Ag@OAM, γeff = 0.81.
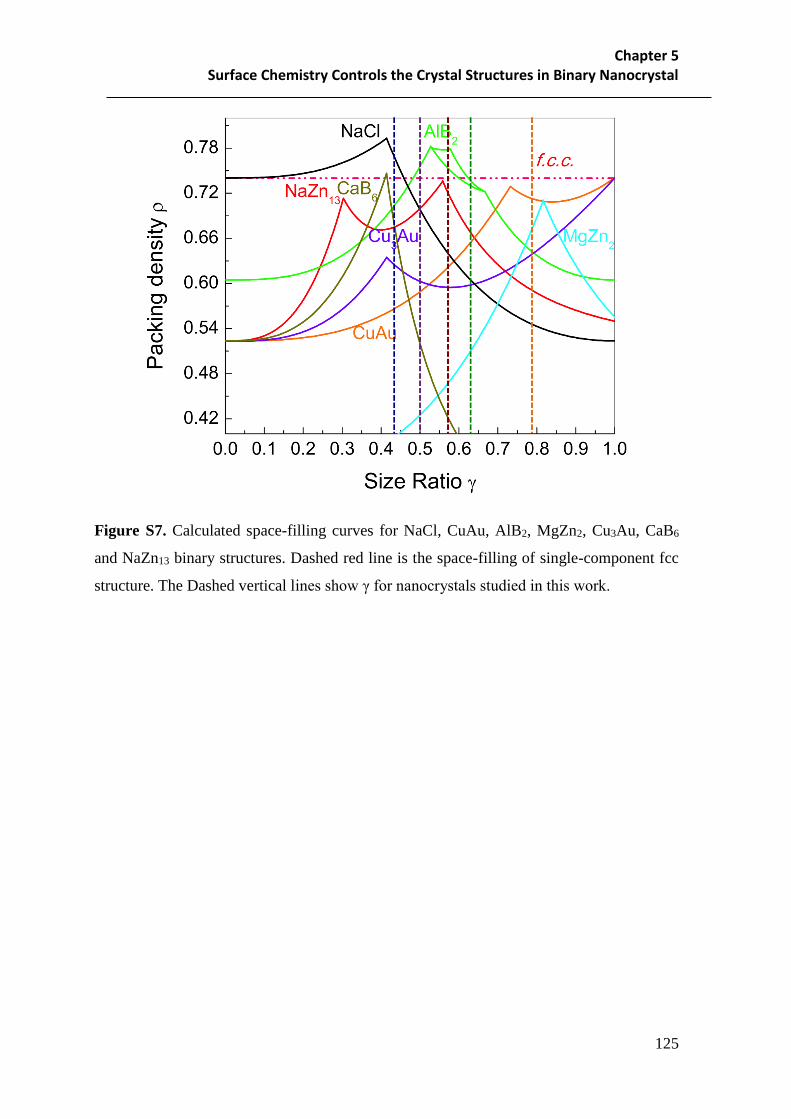
Chapter 5 Surface Chemistry Controls the Crystal Structures in Binary Nanocrystal
125
Figure S7. Calculated space-filling curves for NaCl, CuAu, AlB2, MgZn2, Cu3Au, CaB6
and NaZn13 binary structures. Dashed red line is the space-filling of single-component fcc
structure. The Dashed vertical lines show γ for nanocrystals studied in this work.

Ag nanocrystals differing by their coating agents: unexpected behaviors
126
+ ka
kd X
(A)
(B) Y
ka
kd Y
+
(C)
X
+ +
X X
X
X
X
X
X
X
Y
Y
Y Y
Y
Y Y
Y
X X
X
X
X
Y
X
X
Y
Y
Y Y
X
Y Y
Y
Scheme S1. (A) and (B) are the equilibrium of the bonding of nanocrystal-ligand with
different size and different coating agents by adsorption and desorption kinetic constants,
ka and kd; (C) Ligand exchange takes places between the nanocrsytals with different surface
coatings.

Chapter 5 Surface Chemistry Controls the Crystal Structures in Binary Nanocrystal
127
Table S1. Summarized structures of binary nanoparticle superlattices that cannot be
observed from hard sphere binary systems.
‘A’ site ‘A’
ligand
‘B’ site ‘B’ ligand Binary References
14nm-
Fe3O4
OA 4.6nm-Au C12-SH CaB6,QC, S3
14nm-
Fe3O4
OA 5.8nm-Au C12-SH BCC-AB6 S3
8.1nm-PbS OA 2.9nm-
POM
C12-SH QC S4
5.8nm-PbSe OA 3.4nm-Ag C12-SH Cu3Au S5
5.8nm-PbSe OA 3.0nm-Pd C12-SH Fe4C S5
6.3nm-PbSe OA 3.6nm-Ag C12-SH CaCu5 S5
7.2nm-PbSe OA 5.0nm-Au C12-SH CaCu5 S5
6.2nm-PbSe OA 5.0nm-Au C12-SH CaCu5 S5
13.4nm-
Fe2O3
OA 5.0nm-Au C12-SH CaB6, QC S6
12.6nm-
Fe3O4
OA 4.7nm-Au C12-SH CaB6 QC S6
9nm-PbS OA 3.0nm-Pd C12-SH QC S6
7.7nm-PbSe OA 3.4nm-Pd C12-SH CuAu,Cu3Au,
AB4
S7
7.7nm-PbSe OA 4.9nm-Pd C12-SH CuAu,Cu3Au, S7
PbSe OA CdSe OA A6B19 S8
REFERENCES
S1. Zheng, N.; Fan, J.; Stucky, G. D. J. Am. Chem. Soc. 2006, 128, 6550-6551.
S2. Bodnarchuk, M. I.; Kovalenko, M. V.; Groiss, H.; Resel, R.; Reissner, M.; Hesser,
G.; Lechner, R. T.; Steiner, W.; Schaeffler, F.; Heiss, W., Small 2009, 5, 2247-2252.
S3. Ye, X.; Chen, J.; Murray, C. B., J. Am. Chem. Soc. 2011, 133, 2613-2620.
S4. Bodnarchuk, M. I.; Erni, R.; Krumeich, F.; Kovalenko, M. V., Nano Lett. 2013, 13,
1699-1705.
S5. Shevchenko, E. V.; Talapin, D. V.; Murray, C. B.; O'Brien, S., J. Am. Chem. Soc.
2006, 128, 3620-3637.
S6. Talapin, D. V.; Shevchenko, E. V.; Bodnarchuk, M. I.; Ye, X.; Chen, J.; Murray, C.
B., Nature 2009, 461, 964-967.
S7. Bodnarchuk, M. I.; Kovalenko, M. V.; Heiss, W.; Talapin, D. V., J. Am. Chem. Soc.
2010, 132, 11967-11977.

Ag nanocrystals differing by their coating agents: unexpected behaviors
128
S8. Boneschanscher, M. P.; Evers, W. H.; Qi, W.; Meeldijk, J. D.; Dijkstra, M.;
Vanmaekelbergh, D., Nano Lett. 2013, 13, 1312-1316.

Conclusions and Perspetives
129
Conclusions and Perspectives
Nanocrystals, which are of importance artificial materials, have been synthesized with
purposive design and show their potential application in many different fields. Silver
nanocrystals, which are famous for its optical properties, are highly investigated recent years.
Commonly silver nanocrystals are composed of inorganic nanocrystal cores and surrounding
organic molecule coatings. These molecule coatings can on one hand protect the nanocrystals
from aggregates and bring new properties on the other. For example, by changing the
parameters of silver nanocrystals, i.e. the diameter of nanocrystals or the coating agtens, the
surface plamon resonance which is arised from the oscillations of nanocrystals electrons and
the incident light can be rational tuned. Furthermore, the assemblies of nanocrystals can also
influence the properties of the nanocrystals by inducing the collective effect. In this thesis, we
focused on silver nanocrystals, and investigate the nanaocrystals size, coating agents, and the
ordering on the optical properties of silver nanocrystals.
In the first part, silver nanocrystals ranging from 4 nm to 7 nm that are coated by
dodecanethiol are synthesized with reverse micelleds method and same sized gold
nanocrystals are produced from modified Stuky’s method. After deposition onto a glass wafer,
these nanocrystals self-organize in thin layer films where interparticle spacing is short enough
to promote near-field coupling between nanocrystals and the emergence of collective optical
properties. The UV-visible absorption spectra of 2D assemblies of Ag and Au NCs are
recorded at various incidence angles. In 2D assemblies of Ag NCs, due to the optical
anisotropy of the system, the SPR absorption band splits in two contributions, namely, the
longitudinal and transverse SPR modes. For Ag NCs, these features are satisfactorily
reproduced in the absorption spectra calculated using the DDA method. At variance, in
similar assemblies of Au NCs, only one SPR band is observed whatever the incidence angle
and NC size. The transverse SPR mode is difficult to observe experimentally, partially due to
the strong ligands-metal interactions that lower the electron conductivity in the outermost
metal atomic layer of the nanocrystals.
In the second part, we develop a new method to synthesize silver nanocrysals with
narrow distribution based on hot-injection methods. The sizes of nanocrystals are ranging 2-
12 nm and nanocrystals are coated with oleylamine. With this method, nanocrystals coated
with dodecylamine with varying diameters can also be produced. By using ligand exchange

Ag nanocrystals differing by their coating agents: unexpected behaviors
130
method, the coating layer of these nanocrystals is replaced by thiol-terminated coating agent.
The optical properties of these different speciments reveal that SPR band position is not only
dependent on the nanocrystals size, but also on the nature of the coating agents; would it be
through the influence of the head-group (amine or thiol) or the chain length.
In the third part, we use the silver nanocrystals obtained above to grow thin layers
superlattices (2-7 layers), then study the optical properties of these superlattices. By
comparing the SPR spectra of dispersed Ag nanocrystals and their assemblies of
supracrystalline films, marked changes are discovered. Very surprisingly, data obtained here
show a good agreement between simulated optical properties in 2D superlattices with 3D thin
films self-assembled in fcc crystalline structure. The energy discrepancy (ΔE), determined
from the difference in SPR band between dispersed nanocrystals and their assemblies was
used to evaluate the collective optical properties due to nanocrystal ordering. It is found that
ΔE is mainly determined by both the nanocrystals sizes and the interparticle distances inside
the supracrystal. Upon increasing the nanocrystals sizes while keeping the interparticle
distance constant, ΔE values showed a monotonic increase. Furthermore, it was shown that
engineering the interparticle distance of nanocrystals of similar size within a supracrystal, can
effectively modulate the optical properties of the Ag supracrystalline films.
In the last part, we use the nanocrystals produced in the second part to assemble to
binary nanocrystals superlattices. By studying the structure of the binary superlattices we
obtained, we find that by using one given coating agent, the binary superlattices are predicted
by using the model set up for atoms that takes into account the space-filling principle. Four
types of binary structures, NaCl, AlB2 and NaZn13, MgZn2 can be produced driven by entropy.
When two different coating agents are used to coat either the small or large nanocrystals the
phase diagram observed previously markedly changes with appearance of various phases as
quasicrystals, CaB6 and Cu3Au. The ligand exchange process is responsible for the
interparticle interactions between neighboring nanocrystals, resulting in diversity in binary
nanocrystal superlattices including some structures with lower packing density. These
structures are formed probably due to the fact that it is in a kinetically trapped state at a local
free energy minimum. Our findings are of particular importance for the design of novel 3D
metamaterials from the numerous high-quality colloidal nanocrystals available now.
As presented above, the optical properties of silver nanocrystals are highly dependent
on the silver nanocrystal size, the coating agent, especially the ordering of the nanocrystals.

Conclusions and Perspetives
131
Furthermore, the coating agenes with different kinds can also influent the chemical properties
of assemblies of nanocrystals. These findings allow further designing the optical properties on
more complex system, especially binary nanocrystals superlattices.

Ag nanocrystals differing by their coating agents: unexpected behaviors
132

Bibliography
133
Bibliography
1. Wu, Y.; Wang, D.; Li, Y., Nanocrystals from solutions: catalysts. Chemical Society
Review 2014, 43 (7), 2112-24.
2. Cushing, B. L.; Kolesnichenko, V. L.; O'Connor, C. J., Recent Advances in the
Liquid-Phase Syntheses of Inorganic Nanoparticles. Chemical Reviews 2004, 104 (9), 3893-
3946.
3. Gao, J.; Gu, H.; Xu, B., Multifunctional Magnetic Nanoparticles: Design, Synthesis,
and Biomedical Applications. Accounts of Chemical Research 2009, 42 (8), 1097-1107.
4. Shenhar, R.; Rotello, V. M., Nanoparticles: Scaffolds and building blocks. Accounts of
Chemical Research 2003, 36 (7), 549-561.
5. Belloni, J., Photography: enhancing sensitivity by silver-halide crystal doping.
Radiation Physics and Chemistry 2003, 67 (3), 291-296.
6. Gramotnev, D. K.; Bozhevolnyi, S. I., Plasmonics beyond the diffraction limit. Nature
Photonics. 2010, 4 (2), 83-91.
7. Rycenga, M.; Cobley, C. M.; Zeng, J.; Li, W.; Moran, C. H.; Zhang, Q.; Qin, D.; Xia,
Y., Controlling the Synthesis and Assembly of Silver Nanostructures for Plasmonic
Applications. Chemical Reviews 2011, 111 (6), 3669-3712.
8. Tao, A. R., Nanocrystal assembly for bottom-up plasmonic materials and surface-
enhanced Raman spectroscopy (SERS) sensing. Pure and Applied Chemistry 2009, 81 (1),
61-71.
9. Michaels, A. M.; Nirmal, M.; Brus, L. E., Surface enhanced Raman spectroscopy of
individual rhodamine 6G molecules on large Ag nanocrystals. Journal of the American
Chemical Society 1999, 121 (43), 9932-9939.
10. Tian, Z. Q.; Ren, B.; Wu, D. Y., Surface-enhanced Raman scattering: From noble to
transition metals and from rough surfaces to ordered nanostructures. The Journal of Physical
Chemistry B 2002, 106 (37), 9463-9483.
11. Mulvihill, M. J.; Ling, X. Y.; Henzie, J.; Yang, P. D., Anisotropic Etching of Silver
Nanoparticles for Plasmonic Strutures Capable of Single-Particle SERS. Journal of the
American Chemical Society 2010, 132 (1), 269-274.
12. Sun, Y., Silver nanowires--unique templates for functional nanostructures. Nanoscale
2010, 2 (9), 1626-42.

Ag nanocrystals differing by their coating agents: unexpected behaviors
134
13. Jia, C.-J.; Schüth, F., Colloidal metal nanoparticles as a component of designed
catalyst. Physical Chemistry Chemical Physics 2011, 13 (7), 2457-2487.
14. Christopher, P.; Xin, H. L.; Linic, S., Visible-light-enhanced Catalystic Oxidation
Reaction on Plasmonic Silver Nanostructures. Nature Chemistry 2011, 3, 467-472.
15. Huang, X.; Neretina, S.; El-Sayed, M. A., Gold nanorods: from synthesis and
properties to biological and biomedical applications. Advanced Materials 2009, 21 (48),
4880-910.
16. Kwon, S. G.; Hyeon, T., Colloidal Chemical Synthesis and Formation Kinetics of
Uniformly Sized Nanocrystals of Metals, Oxides, and Chalcogenides. Accounts of Chemical
Research 2008, 41 (12), 1696-1709.
17. Shenhar, R.; Rotello, V. M., Nanoparticles: Scaffolds and Building Blocks. Accounts
of Chemical Research 2003, 36 (7), 549-561.
18. Jones, M. R.; Osberg, K. D.; Macfarlane, R. J.; Langille, M. R.; Mirkin, C. A.,
Templated Techniques for the Synthesis and Assembly of Plasmonic Nanostructures.
Chemical Reviews 2011, 111 (6), 3736-3827.
19. Jia, C. J.; Sun, L. D.; Yan, Z. G.; You, L. P.; Luo, F.; Han, X. D.; Pang, Y. C.; Zhang,
Z.; Yan, C. H., Single-Crystalline Iron Oxide Nanotubes. Angewandte Chemie 2005, 117,
4402-4407.
20. Burda, C.; Chen, X.; Narayanan, R.; El-Sayed, M. A., Chemistry and Properties of
Nanocrystals of Different Shapes. Chemical Reviews 2005, 105 (4), 1025-1102.
21. Noguez, C., Surface Plasmons on Metal Nanoparticles: The Influence of Shape and
Physical Environment. The Journal of Physical Chemistry C 2007, 111 (10), 3806-3819.
22. Chen, Z.; Moore, J.; Radtke, G.; Sirringhaus, H.; O'Brien, S., Binary Nanoparticle
Superlattices in the Semiconductor−Semiconductor System: CdTe and CdSe. Journal of the
American Chemical Society 2007, 129 (50), 15702-15709.
23. Sun, Y., Controlled synthesis of colloidal silver nanoparticles in organic solutions:
empirical rules for nucleation engineering. Chemical Society Review 2013, 42 (7), 2497-511.
24. Thanh, N. T.; Maclean, N.; Mahiddine, S., Mechanisms of nucleation and growth of
nanoparticles in solution. Chemical Reviews 2014, 114 (15), 7610-30.
25. Pileni, M. P., Supracrystals of Inorganic Nanocrystals: An Open Challenge for New
Physical Properties. Accounts of Chemical Research 2008, 41 (12), 1799-1809.
26. Pileni, M. P., Self-Assembly of Inorganic Nanocrystals: Fabrication and Collective
Intrinsic Properties. Accounts of Chemical Research 2007, 40 (8), 685-693.
27. Faraday, M., Philos. Trans. R. Soc. London 1857, 147, 145.

Bibliography
135
28. Brust, M.; Kiely, C. J., Some recent advances in nanostructure preparation from gold
and silver particles: a short topical review. Colloids and Surfaces A: Physicochemical and
Engineering Aspects 2002, 202 (2–3), 175-186.
29. Enustun, B. V.; Turkevich, J., Coagulation of Colloidal Gold. Journal of the American
Chemical Society 1963, 85 (21), 3317-3328.
30. Turkevich, J., Colloidal gold. Part II. Gold Bulletin 1985, 18 (4), 125-131.
31. Petit, C.; Lixon, P.; Pileni, M. P., Structural study of divalent metal bis(2-ethylhexyl)
sulfosuccinate aggregates. Langmuir 1991, 7 (11), 2620-2625.
32. Lisiecki, I.; Lixon, P.; Pileni, M. P., Synthesis in Situ in Reverse Micelle of Copper
Metallic Clusters. In Trends in Colloid and Interface Science V, Corti, M.; Mallamace, F., Eds.
Steinkopff: 1991, 84, 342-344.
33. Lisiecki, I.; Boulanger, L.; Lixon, P.; Pileni, M. P., Synthesis of copper metallic
particles using functionalized surfactants in w/o and o/w microemulsions. In Trends in
Colloid and Interface Science VI, Helm, C.; Lösche, M.; Möhwald, H., Eds. Steinkopff: 1992,
89, 103-105.
34. Brust, M.; Fink, J.; Bethell, D.; Schiffrin, D. J.; Kiely, C., Synthesis and Reactions of
Functionalised Gold Nanoparticles. Journal of the Chemical Society, Chemical
Communications 1995, 1655-1656.
35. Peng, X.; Manna, L.; Yang, W.; Wickham, J.; Scher, E.; Kadavanich, A.; Alivisatos, A.
P., Shape control of CdSe nanocrystals. Nature 2000, 404 (6773), 59-61.
36. William, W., Synthesis of monodisperse iron oxide nanocrystals by thermal
decomposition of iron carboxylate salts. Chemical Communications 2004, (20), 2306-2307.
37. Sun, S.; Murray, C.; Weller, D.; Folks, L.; Moser, A., Monodisperse FePt
nanoparticles and ferromagnetic FePt nanocrystal superlattices. Science 2000, 287 (5460),
1989-1992.
38. Murray, C. B.; Norris, D. J.; Bawendi, M. G., Synthesis and characterization of nearly
monodisperse CdE (E = sulfur, selenium, tellurium) semiconductor nanocrystallites. Journal
of the American Chemical Society 1993, 115 (19), 8706-8715.
39. Park, J.; Joo, J.; Kwon, S. G.; Jang, Y.; Hyeon, T., Synthesis of Monodisperse
Spherical Nanocrystals. Angewandte Chemie International Edition 2007, 46 (25), 4630-4660.
40. Kwon, S. G.; Hyeon, T., Formation Mechanisms of Uniform Nanocrystals via
Hot‐Injection and Heat‐Up Methods. Small 2011, 7 (19), 2685-2702.

Ag nanocrystals differing by their coating agents: unexpected behaviors
136
41. Xia, X. H.; Zeng, J.; Zhang, Q.; Moran, C. H.; Xia, Y. N., Recent Development in
Shape-Controlled Synthesis of Silver Nanocrystals. Journal of Physical Chemistry C 2012,
116, 21647-21656.
42. Sellers, H.; Ulman, A.; Shnidman, Y.; Eilers, J. E., Structure and Binding of
Alkanethiolates on Gold and Silver Surfaces - Implications for Self-Assembled Monolayers.
Journal of the American Chemical Society 1993, 115 (21), 9389-9401.
43. Peng, S.; McMahon, J. M.; Schatz, G. C.; Gray, S. K.; Sun, Y., Reversing the size-
dependence of surface plasmon resonances. Proceedings of the National Academy of Sciences
of the United States of America 2010, 107 (33), 14530-14534.
44. Pradhan, N.; Reifsnyder, D.; Xie, R.; Aldana, J.; Peng, X., Surface Ligand Dynamics
in Growth of Nanocrystals. Journal of the American Chemical Society 2007, 129 (30), 9500-
9509.
45. Templeton, A. C.; Pietron, J. J.; Murray, R. W.; Mulvaney, P., Solvent refractive index
and core charge influences on the surface plasmon absorbance of alkanethiolate monolayer-
protected gold clusters. Journal of Physical Chemistry B 2000, 104 (3), 564-570.
46. Seoudi, R.; Shabaka, A.; El Sayed, Z. A.; Anis, B., Effect of stabilizing agent on the
morphology and optical properties of silver nanoparticles. Physica E-Low-Dimensional
Systems & Nanostructures 2011, 44 (2), 440-447.
47. Wan, Y.; Portalès, H.; Goubet, N.; Mermet, A.; Pileni, M.-P., Impact of
nanocrystallinity segregation on the growth and morphology of nanocrystal superlattices.
Nano Research 2013, 6 (8), 611-618.
48. Lee, P.; Meisel, D., Adsorption and surface-enhanced Raman of dyes on silver and
gold sols. The Journal of Physical Chemistry 1982, 86 (17), 3391-3395.
49. Deng, Z.; Mansuipur, M.; Muscat, A. J., New Method to Single-Crystal Micrometer-
Sized Ultra-Thin Silver Nanosheets: Synthesis and Characterization. The Journal of Physical
Chemistry C 2008, 113 (3), 867-873.
50. Lim, P. Y.; Liu, R. S.; She, P. L.; Hung, C. F.; Shih, H. C., Synthesis of Ag
nanospheres particles in ethylene glycol by electrochemical-assisted polyol process. Chemical
Physics Letters 2006, 420 (4-6), 304-308.
51. Courty, A.; Richardi, J.; Albouy, P.-A.; Pileni, M.-P., How To Control the Crystalline
Structure of Supracrystals of 5-nm Silver Nanocrystals. Chemistry of Materials 2011, 23 (18),
4186-4192.

Bibliography
137
52. Stoeva, S. I.; Huo, F.; Lee, J.-S.; Mirkin, C. A., Three-Layer Composite Magnetic
Nanoparticle Probes for DNA. Journal of the American Chemical Society 2005, 127 (44),
15362-15363.
53. Zhang, Q.; Li, W.; Moran, C.; Zeng, J.; Chen, J.; Wen, L.-P.; Xia, Y., Seed-Mediated
Synthesis of Ag Nanocubes with Controllable Edge Lengths in the Range of 30−200 nm and
Comparison of Their Optical Properties. Journal of the American Chemical Society 2010, 132
(32), 11372-11378.
54. Jana, N. R.; Gearheart, L.; Murphy, C. J., Seed-Mediated Growth Approach for Shape-
Controlled Synthesis of Spheroidal and Rod-like Gold Nanoparticles Using a Surfactant
Template. Advanced Materials 2001, 13 (18), 1389-1393.
55. Pietrobon, B.; McEachran, M.; Kitaev, V., Synthesis of Size-Controlled Faceted
Pentagonal Silver Nanorods with Tunable Plasmonic Properties and Self-Assembly of These
Nanorods. ACS Nano 2008, 3 (1), 21-26.
56. Wiley, B.; Sun, Y. G.; Xia, Y. N., Polyol Synthesis of Silver Nanostructures- Control
of Product Morphology with Fe(II) or Fe(III) species. Langmuir 2005, 21 (18), 8077-8080.
57. Nadagouda, M. N.; Varma, R. S., Microwave-Assisted Shape-Controlled Bulk
Synthesis of Ag and Fe Nanorods in Poly(ethylene glycol) Solutions. Crystal Growth &
Design 2007, 8 (1), 291-295.
58. Peng, S.; Sun, Y., Synthesis of Silver Nanocubes in a Hydrophobic Binary Organic
Solvent. Chemistry of Materials 2010, 22 (23), 6272-6279.
59. Chen, S.; Fan, Z.; Carroll, D. L., Silver Nanodisks: Synthesis, Characterization, and
Self-Assembly. The Journal of Physical Chemistry B 2002, 106 (42), 10777-10781.
60. Maillard, M.; Giorgio, S.; Pileni, M.-P., Silver nanodisks. Advance Materials 2002, 14
(15), 1084.
61. Schuller, J. A.; Barnard, E. S.; Cai, W.; Jun, Y. C.; White, J. S.; Brongersma, M. L.,
Plasmonics for extreme light concentration and manipulation. Nature Materials 2010, 9 (4),
368-368.
62. Shalaev, V. M., Transforming Light. Science 2008, 322 (5900), 384-386.
63. Lazarides, A. A.; Schatz, G. C., DNA-linked metal nanosphere materials: Structural
basis for the optical properties. Journal of Physical Chemistry B 2000, 104 (3), 460-467.
64. Kelly, K. L.; Coronado, E.; Zhao, L. L.; Schatz, G. C., The optical properties of metal
nanoparticles: The influence of size, shape, and dielectric environment. Journal of Physical
Chemistry B 2003, 107 (3), 668-677.

Ag nanocrystals differing by their coating agents: unexpected behaviors
138
65. Hao, E.; Li, S. Y.; Bailey, R. C.; Zou, S. L.; Schatz, G. C.; Hupp, J. T., Optical
properties of metal nanoshells. Journal of Physical Chemistry B 2004, 108 (4), 1224-1229.
66. Haes, A. J.; Van Duyne, R. P., A nanoscale optical blosensor: Sensitivity and
selectivity of an approach based on the localized surface plasmon resonance spectroscopy of
triangular silver nanoparticles. Journal of the American Chemical Society 2002, 124 (35),
10596-10604.
67. Portales, H.; Pinna, N.; Pileni, M.-P., Optical Response of Ultrafine Spherical Silver
Nanoparticles Arranged in Hexagonal Planar Arrays Studied by the DDA Method. Journal of
Physical Chemistry A 2009, 113 (16), 4094-4099.
68. Salzemann, C.; Brioude, A.; Pileni, M. P., Tuning of copper nanocrystals optical
properties with their shapes. Journal of Physical Chemistry B 2006, 110 (14), 7208-7212.
69. Liang, H.; Rossouw, D.; Zhao, H.; Cushing, S. K.; Shi, H.; Korinek, A.; Xu, H.; Rosei,
F.; Wang, W.; Wu, N.; Botton, G. A.; Ma, D., Asymmetric Silver “Nanocarrot” Structures:
Solution Synthesis and Their Asymmetric Plasmonic Resonances. Journal of the American
Chemical Society 2013, 135 (26), 9616-9619.
70. Yang, S.-C.; Kobori, H.; He, C.-L.; Lin, M.-H.; Chen, H.-Y.; Li, C.; Kanehara, M.;
Teranishi, T.; Gwo, S., Plasmon Hybridization in individual Gold Nanocrystal Dimers: Direct
Observation of Bright and Dark Modes. Nano Letters 2010, 10 (2), 632-637.
71. Bakr, O. M.; Amendola, V.; Aikens, C. M.; Wenseleers, W.; Li, R.; Dal Negro, L.;
Schatz, G. C.; Stellacci, F., Silver Nanoparticles with Broad Multiband Linear Optical
Absorption. Angewandte Chemie 2009, 121 (32), 6035-6040.
72. Gunnarsson, L.; Rindzevicius, T.; Prikulis, J.; Kasemo, B.; Kall, M.; Zou, S. L.;
Schatz, G. C., Confined plasmons in nanofabricated single silver particle pairs: Experimental
observations of strong interparticle interactions. Journal of Physical Chemistry B 2005, 109
(3), 1079-1087.
73. Mie, G., ANN. Phys. (Weinheim. Ger.) 1908, 25, 377.
74. Bohren, C. F.; Huffman, D. R., Absorption and scattering of light by small particles.
John Wiley & Sons: 2008.
75. Liu, M.; Guyot-Sionnest, P., Synthesis and optical characterization of Au/Ag
core/shell nanorods. The Journal of Physical Chemistry B 2004, 108 (19), 5882-5888.
76. Wang, H.; Tam, F.; Grady, N. K.; Halas, N. J., Cu Nanoshells: Effects of Interband
Transitions on the Nanoparticle Plasmon Resonance. The Journal of Physical Chemistry B
2005, 109 (39), 18218-18222.

Bibliography
139
77. Mulvaney, P., Surface plasmon spectroscopy of nanosized metal particles. Langmuir
1996, 12 (3), 788-800.
78. Wiley, B.; Sun, Y.; Mayers, B.; Xia, Y., Shape‐Controlled Synthesis of Metal
Nanostructures: The Case of Silver. Chemistry-A European Journal 2005, 11 (2), 454-463.
79. Hutter, E.; Fendler, J. H., Exploitation of localized surface plasmon resonance.
Advanced Materials 2004, 16 (19), 1685-1706.
80. Wiley, B. J.; Im, S. H.; Li, Z.-Y.; McLellan, J.; Siekkinen, A.; Xia, Y., Maneuvering
the Surface Plasmon Resonance of Silver Nanostructures through Shape-Controlled Synthesis.
The Journal of Physical Chemistry B 2006, 110 (32), 15666-15675.
81. Xia, Y.; Halas, N. J., Shape-controlled synthesis and surface plasmonic properties of
metallic nanostructures. MRS bulletin 2005, 30 (05), 338-348.
82. Wei, J.; Schaeffer, N.; Pileni, M.-P., Ag Nanocrystals: 1. Effect of Ligands on
Plasmonic Properties. The Journal of Physical Chemistry B 2014, 118 (49), 14070-14075.
83. Redl, F. X.; Cho, K. S.; Murray, C. B.; O'Brien, S., Three-dimensional binary
superlattices of magnetic nanocrystals and semiconductor quantum dots. Nature 2003, 423
(6943), 968-971.
84. Sun, S. H., Recent advances in chemical synthesis, self-assembly, and applications of
FePt nanoparticles. Advanced Materials 2006, 18 (4), 393-403.
85. Chen, Z. Y.; Moore, J.; Radtke, G.; Sirringhaus, H.; O'Brien, S., Binary nanoparticle
superlattices in the semiconductor-semiconductor system: CdTe and CdSe. Journal of the
American Chemical Society 2007, 129 (50), 15702-15709.
86. Yang, Z.; Lisiecki, I.; Walls, M.; Pileni, M.-P., Nanocrystallinity and the Ordering of
Nanoparticles in Two-Dimensional Superlattices: Controlled Formation of Either Core/Shell
(Co/CoO) or Hollow CoO Nanocrystals. ACS Nano 2013, 7 (2), 1342-1350.
87. Taleb, A.; Russier, V.; Courty, A.; Pileni, M. P., Collective optical properties of silver
nanoparticles organized in two-dimensional superlattices. Physcial Review B 1999, 59 (20),
13350-13358.
88. Yang, P.; Arfaoui, I.; Cren, T.; Goubet, N.; Pileni, M.-P., Unexpected Electronic
Properties of Micrometer-Thick Supracrystals of Au Nanocrystals. Nano Letters 2012, 12 (4),
2051-2055.
89. Ye, X.; Chen, J.; Diroll, B. T.; Murray, C. B., Tunable Plasmonic Coupling in Self-
Assembled Binary Nanocrystal Super lattices Studied by Correlated Optical
Microspectrophotometry and Electron Microscopy. Nano Letters 2013, 13 (3), 1291-1297.

Ag nanocrystals differing by their coating agents: unexpected behaviors
140
90. Urban, J. J.; Talapin, D. V.; Shevchenko, E. V.; Kagan, C. R.; Murray, C. B.,
Synergism in binary nanocrystal superlattices leads to enhanced p-type conductivity in self-
assembled PbTe/Ag2Te thin films. Nature Materials 2007, 6 (2), 115-121.
91. Taleb, A.; Petit, C.; Pileni, M. P., Optical properties of self-assembled 2D and 3D
superlattices of silver nanoparticles. Journal of Physical Chemistry B 1998, 102 (12), 2214-
2220.
92. Pileni, M. P., Inorganic nanocrystals self ordered in 2D superlattices: how versatile are
the physical and chemical properties? Physical Chemistry Chemical Physics 2010, 12 (38),
11821-11835.
93. Dong, A.; Ye, X.; Chen, J.; Murray, C. B., Two-dimensional binary and ternary
nanocrystal superlattices: the case of monolayers and bilayers. Nano Lett 2011, 11 (4), 1804-9.
94. Yockell-Lelievre, H.; Gingras, D.; Lamarre, S.; Vallee, R.; Ritcey, A. M., In Situ
Monitoring of the 2D Aggregation Process of Thiol-Coated Gold Nanoparticles Using
Interparticle Plasmon Coupling. Plasmonics 2013, 8 (3), 1369-1377.
95. Paul, S.; Pearson, C.; Molloy, A.; Cousins, M. A.; Green, M.; Kolliopoulou, S.;
Dimitrakis, P.; Normand, P.; Tsoukalas, D.; Petty, M. C., Langmuir−Blodgett Film
Deposition of Metallic Nanoparticles and Their Application to Electronic Memory Structures.
Nano Letters 2003, 3 (4), 533-536.
96. Tao, A.; Kim, F.; Hess, C.; Goldberger, J.; He, R.; Sun, Y.; Xia, Y.; Yang, P.,
Langmuir−Blodgett Silver Nanowire Monolayers for Molecular Sensing Using Surface-
Enhanced Raman Spectroscopy. Nano Letters 2003, 3 (9), 1229-1233.
97. Dong, A. G.; Chen, J.; Vora, P. M.; Kikkawa, J. M.; Murray, C. B., Binary nanocrystal
superlattice membranes self-assembled at the liquid-air interface. Nature 2010, 466 (7305),
474-477.
98. Gong, J.; Li, G.; Tang, Z., Self-assembly of noble metal nanocrystals: Fabrication,
optical property, and application. Nano Today 2012, 7 (6), 564-585.
99. Talapin, D. V.; Shevchenko, E. V.; Murray, C. B.; Titov, A. V.; Král, P.,
Dipole−Dipole Interactions in Nanoparticle Superlattices. Nano Letters 2007, 7 (5), 1213-
1219.
100. Sun, Z.; Luo, Z.; Fang, J., Assembling Nonspherical 2D Binary Nanoparticle
Superlattices by Opposite Electrical Charges: The Role of Coulomb Forces. ACS Nano 2010,
4 (4), 1821-1828.
101. Bodnarchuk, M. I.; Kovalenko, M. V.; Heiss, W.; Talapin, D. V., Energetic and
Entropic Contributions to Self-Assembly of Binary Nanocrystal Superlattices: Temperature as

Bibliography
141
the Structure-Directing Factor. Journal of the American Chemical Society 2010, 132 (34),
11967-11977.
102. Talapin, D. V.; Shevchenko, E. V.; Murray, C. B.; Titov, A. V.; Kral, P., Dipole-
dipole interactions in nanoparticle superlattices. Nano Letters 2007, 7 (5), 1213-1219.
103. Talapin, D. V.; Shevchenko, E. V.; Kornowski, A.; Gaponik, N.; Haase, M.; Rogach,
A. L.; Weller, H., A new approach to crystallization of CdSe nanoparticles into ordered three-
dimensional superlattices. Advanced Materials 2001, 13 (24), 1868.
104. Quan, Z.; Fang, J., Superlattices with non-spherical building blocks. Nano Today 2010,
5 (5), 390-411.
105. Rupich, S. M.; Shevchenko, E. V.; Bodnarchuk, M. I.; Lee, B.; Talapin, D. V., Size-
dependent multiple twinning in nanocrystal superlattices. Journal of the American Chemical
Society 2009, 132 (1), 289-296.
106. Lisiecki, I.; Albouy, P. A.; Pileni, M. P., Face-Centered-Cubic “Supracrystals” of
Cobalt Nanocrystals. Advanced Materials 2003, 15 (9), 712-716.
107. Talapin, D. V.; Lee, J. S.; Kovalenko, M. V.; Shevchenko, E. V., Prospects of
Colloidal Nanocrystals for Electronic and Optoelectronic Applications. Chemical Reviews
2010, 110 (1), 389-458.
108. Wan, Y. F.; Goubet, N.; Albouy, P. A.; Pileni, M. P., Hierarchy in Au nanocrystal
ordering in supracrystals: a potential approach to detect new physical properties. Langmuir
2013, 29 (24), 7456-63.
109. Shevchenko, E. V.; Talapin, D. V.; Kotov, N. A.; O'Brien, S.; Murray, C. B.,
Structural diversity in binary nanoparticle superlattices. Nature 2006, 439 (7072), 55-59.
110. Urban, J. J.; Talapin, D. V.; Shevchenko, E. V.; Kagan, C. R.; Murray, C. B.,
Synergismin binary nanocrystal superlattices leads to enhanced p-type conductivity in self-
assembled PbTe/Ag-2 Te thin films. Nature Materials 2007, 6 (2), 115-121.
111. Chen, Z.; O’Brien, S., Structure Direction of II−VI Semiconductor Quantum Dot
Binary Nanoparticle Superlattices by Tuning Radius Ratio. ACS Nano 2008, 2 (6), 1219-1229.
112. Shevchenko, E. V.; Ringler, M.; Schwemer, A.; Talapin, D. V.; Klar, T. A.; Rogach, A.
L.; Feldmann, J.; Alivisatos, A. P., Self-Assembled Binary Superlattices of CdSe and Au
Nanocrystals and Their Fluorescence Properties. Journal of the American Chemical Society
2008, 130 (11), 3274-3275.
113. Shevchenko, E. V.; Talapin, D. V.; Murray, C. B.; O'Brien, S., Structural
characterization of self-assembled multifunctional binary nanoparticle superlattices. Journal
of the American Chemical Society 2006, 128 (11), 3620-3637.
Ag nanocrystals differing by their coating agents: unexpected behaviors
142
114. Parthe, E. Z., Kirstallogr 1961, 115, 52-79.
115. Sanders, J., Close-packed structures of spheres of two different sizes I. Observations
on natural opal. Philosophical Magazine A 1980, 42 (6), 705-720.
116. Murray, M.; Sanders, J., Close-packed structures of spheres of two different sizes II.
The packing densities of likely arrangements. Philosophical Magazine A 1980, 42 (6), 721-
740.
117. Shevchenko, E. V.; Talapin, D. V.; O'Brien, S.; Murray, C. B., Polymorphism in
AB13 Nanoparticle Superlattices: An Example of Semiconductor−Metal Metamaterials.
Journal of the American Chemical Society 2005, 127 (24), 8741-8747.
118. Chen, J.; Ye, X.; Murray, C. B., Systematic Electron Crystallographic Studies of Self-
Assembled Binary Nanocrystal Superlattices. ACS Nano 2010, 4 (4), 2374-2381.
119. Evers, W. H.; Nijs, B. D.; Filion, L.; Castillo, S.; Dijkstra, M.; Vanmaekelbergh, D.,
Entropy-driven formation of binary semiconductor-nanocrystal superlattices. Nano letters
2010, 10 (10), 4235-4241.
120. Kalsin, A. M.; Fialkowski, M.; Paszewski, M.; Smoukov, S. K.; Bishop, K. J. M.;
Grzybowski, B. A., Electrostatic Self-Assembly of Binary Nanoparticle Crystals with a
Diamond-Like Lattice. Science 2006, 312 (5772), 420-424.
121. Gwo, S.; Lin, M.-H.; He, C.-L.; Chen, H.-Y.; Teranishi, T., Bottom-Up Assembly of
Colloidal Gold and Silver Nanostructures for Designable Plasmonic Structures and
Metamaterials. Langmuir 2012, 28 (24), 8902-8908.
122. Chen, C.-F.; Tzeng, S.-D.; Chen, H.-Y.; Lin, K.-J.; Gwo, S., Tunable Plasmonic
Response from Alkanethiolate-Stabilized Gold Nanoparticle Superlattices: Evidence of Near-
Field Coupling. Journal of the American Chemical Society 2007, 130 (3), 824-826.
123. Yang, P.; Portalès, H.; Pileni, M.-P., Ability to discern the splitting between
longitudinal and transverse plasmon resonances in Au compared to Ag nanoparticles in close-
packed planar arrays. Physical Review B 2010, 81 (20), 205405.
List of Publications
143
List of publications
1. “Ag Nanocrystals: 1. Effect of Ligands on Plasmonic Properties. ”, Wei, J. J.; Schaeffer, N.;
Pileni, M.-P., J. Phys. Chem. B 2014, 118, 14070-14075.
2. “Surface Plasmon Resonance of Silver Nanocrystals Differing by Sizes and Coating Agents
Ordered In 3D.”, Wei, J. J.; Schaeffer, N.; Albouy, P.-A.; Pileni, M.-P., submitted.
3. “Surface Chemstry Controls the Crystal Structures in Binary”, Wei, J. J.; Schaeffer, N.;
Pileni, M.-P., in preparation.
4. “Collective surface plasmon resonances in two-dimensional assemblies of Au and Ag
nanocrystals: Experiments and DDA simulation”, Wei, J. J.; Yang, P.; Portalès, H.; M.-P.
Pileni, in preparation.