SIKA MEDIA AND INVESTOR PRESENTATION … MEDIA AND INVESTOR PRESENTATION FEBRUARY 23, 2018 TABLE OF...
58
RECORD RESULTS IN 2017 SIKA MEDIA AND INVESTOR PRESENTATION FEBRUARY 23, 2018
Transcript of SIKA MEDIA AND INVESTOR PRESENTATION … MEDIA AND INVESTOR PRESENTATION FEBRUARY 23, 2018 TABLE OF...

RECORD RESULTS IN 2017 SIKA MEDIA AND INVESTOR PRESENTATION FEBRUARY 23, 2018

TABLE OF CONTENTS
2
1. HIGHLIGHTS PAUL SCHULER, CEO
2. FINANCIAL RESULTS ADRIAN WIDMER, CFO
3. STRATEGY PAUL SCHULER, CEO
4. OUTLOOK PAUL SCHULER, CEO IVO SCHÄDLER, EMEA CHRISTOPH GANZ, AMERICAS MIKE CAMPION, ASIA/PACIFIC THOMAS HASLER, INDUSTRY & AUTOMOTIVE
5. QUESTIONS & ANSWERS

1. HIGHLIGHTS
PAUL SCHULER, CEO

1. Record results
+9.0% sales growth in local currencies to CHF 6,248.3 million
CHF 896.3 million EBIT (+12.7%)
CHF 649.0 million net profit (+14.5%)
29.8% ROCE (2016: 28.7 %)
2. Key investments
3 new national subsidiaries
9 new factories
7 acquisitions
3. Strategy
Strategic targets for 2020 confirmed
HIGHLIGHTS 2017
4

KEY FIGURES RECORD RESULTS
5
in CHF mn 2016 2017 Δ %
Net sales 5,747.7 6.248.3 + 8.7%
EBIT 795.3 896.3 + 12.7%
Net profit 566.6 649.0 + 14.5%
ROCE 28.7% 29.8%

GROWTH MOMENTUM CONTINUES IN 2017 9.0% SALES GROWTH (8.7% IN CHF)
6
+ 7.5%
North America
Latin America EMEA
Asia/Pacific
(in CHF mn, growth in LC)
2,875
1,133
+ 5.2%
+ 3.3%
590
1,094
+ 18.4%
12M 2016 12M 2017

Opening of Sika plants:
5th plant in Mexico (Coatzacoalcos, March 2017)
New and expanded site in Kazakhstan (Almaty, May 2017)
1st plant in Tanzania (Dar es Salaam, June 2017)
5th plant in Russia (Lobnya, July 2017)
New and expanded site in Pakistan (Lahore, October 2017)
2nd plant in Angola (Luanda, October 2017)
New fiber plant for EMEA (Troisdorf, Germany, November 2017)
1st plant in Cameroon (Douala, December 2017)
22nd plant in the USA (Houston, December 2017)
KEY INVESTMENTS IN 2017 EXPANSION IN EMERGING MARKETS
7
New production for PVC membranes in Russia New fiber plant in Troisdorf, Germany New plant for admixtures and mortars in Houston

New subsidiaries:
Senegal (April 2017)
El Salvador (September 2017)
Bangladesh (December 2017)
Now present in 100 countries with own national subsidiaries
KEY INVESTMENTS IN 2017 EXPANSION IN EMERGING MARKETS
8

9

CONTINUING HIGH OPERATING SPEED 2017/2018 ACQUISITIONS Company Country Target Market
Bitbau Dörr Austria Waterproofing
ABC Sealants Turkey Sealing & Bonding
KVK Czech Republic Roofing, Waterproofing, Refurbishment
Butterfield USA Concrete
Faist ChemTec Global Industry, Automotive
Grupo Industrial Alce Mexico Roofing, Waterproofing
Emseal Joint Systems USA Sealing & Bonding, Refurbishment
Index Construction Systems and Products Italy Roofing, Waterproofing
Total annual sales: CHF 482 million
11 Faist ChemTec Grupo Industrial Alce KVK

Acquisition of Faist ChemTec, Global Leading manufacturer of
high-performance engineered, structure-borne acoustic solutions for automotive industry
Faist ChemTec’s innovations are driven by megatrends, such as increased need for comfort and lightweight construction of vehicles
Manufacturing footprint supports the aim to achieve global reach combined with local presence when serving customers worldwide
CHF 190 million additional sales
KEY INVESTMENTS IN 2017 ACQUISITIONS AS GROWTH PLATFORM
11

Acquisition of Emseal Joint Systems, USA
US-based market leader in development and manufacturing of structural expansion joint products for new construction and refurbishment
Extensive cross-selling opportunities for other Sika technologies
Reach new contractor customers and better penetrate key projects - perfect fit with Sika’s existing growth strategy in North America
CHF 40 million additional sales
KEY INVESTMENTS IN 2017 ACQUISITIONS AS GROWTH PLATFORM
12

Acquisition of Index Construction Systems and Products, Italy
Leading manufacturer of roofing and waterproofing systems with annual sales of CHF 115 million
Acquisition leads to strong number one position in Italian roofing market
New site will function as Sika’s Southern European production hub for bituminous systems, with potential to serve Middle East and Africa
KEY INVESTMENTS IN 2018 ACQUISITIONS AS GROWTH PLATFORM
13

2. FINANCIAL RESULTS 2017
ADRIAN WIDMER, CFO

New and all time records in:
Net Sales: CHF 6,248.3 million (+9.0% in LC, 8.7% in CHF)
EBIT: CHF 896.3 million (+12.7%) reaching 14.3% of net sales, +CHF 101 million in absolute terms
Net Profit: CHF 649.0 million (+14.5%)
Tax rate further improved to 24.7%
Continued improvement in capital efficiency (ROCE) to 29.8% driven by strong profitability and efficient capital management
Ongoing investments of CHF 163 million (2016: CHF 155 million)
FINANCIAL HIGHLIGHTS 2017
15

REVENUES 2017 9.0% GROWTH IN LOCAL CURRENCIES
16
in CHF mn 2016 2017
Net sales 5,747.7 6,248.3
Organic growth +360.5
Acquisition effect +153.1
Currency effect -13.0 5,748
6,248
-0.3%
6.3%
2.7%
2016 2017

REVENUES 2017 EXECUTION ON ALL PILLARS OF THE STRATEGY
17
5,747.7
6,248.3
-13
189
172
153
2016 Organic GrowthMature Market
Organic GrowthEmerging Market
Acquisitions Translation Impact 2017

SALES GROWTH 2015 TO 2017 STRONG ORGANIC GROWTH
18
acquisition organic
in LC
4.0% 4.6%
6.3%
2.2% 0.9%
2.7% 6.2%
5.5%
9.0%
2015 2016 2017
in CHF mn
Sales 5,489.2 5,747.7 6,248.3

SALES GROWTH BY QUARTER DYNAMIC GROWTH MOMENTUM
19
acquisition
organic
in LC
3.6% 3.0%
8.5%
3.4% 5.0%
8.8% 0.4%
0.4%
2.2%
2.6%
2.4%
3.5%
0%
2%
4%
6%
8%
10%
12%
Q3 PY Q4 PY Q1 CY Q2 CY Q3 CY Q4 CY
in CHF mn Q3 16 Q4 16 Q1 17 Q2 17 Q3 17 Q4 17
Quarterly sales
1,525.6 1,415.9 1,389.0 1,605.9 1,632.6 1,620.8
6.0%
10.7%
4.0% 3.4%
12.3%
7.4%

INCOME STATEMENT ANOTHER YEAR OF STRONG PROFIT GROWTH
20
in CHF mn 2016 NS 2017 NS Growth
Net sales 5,747.7 100% 6,248.3 100% 8.7%
Gross result 3,181.1 55.3% 3,399.1 54.4% 6.9%
Personnel costs -1,159.1 -20.1% -1,212.1 -19.4% 4.6%
Other OPEX -1,056.3 -18.4% -1,118.5 -17.9% 5.9%
Depreciation and amortization -170.4 -3.0% -172.2 -2.8% 1.1%
EBIT 795.3 13.8% 896.3 14.3% 12.7%
Financial expense -39.5 -34.2
Income taxes -189.2 -213.1
Net profit 566.6 9.9% 649.0 10.4% 14.5%
Tax rate 25.0% 24.7%
Non-material costs -2,385.8 -41.5% -2,502.8 -40.1% 4.9%

CONSOLIDATED BALANCE SHEET STRONG BALANCE SHEET AND IMPROVED EQUITY RATIO OF 58.9%
21
in CHF mn 31.12.2016 31.12.2017 Δ %
Cash and cash equivalents 1,155.0 1,037.9 -10.1
Other current assets 1,742.0 2,046.5 17.5
Current assets 2,897.0 3,084.4 6.5
Non-current assets 2,202.2 2,707.8 23.0
Total assets 5,099.2 5,792.2 13.6
Current liabilities 968.0 1,200.0 24.0
Bonds (current) 0.0 150.0
Bonds (non-current) 698.7 549.0
Other non-current liabilities 484.8 482.1 -0.6
Total liabilities 2,151.5 2,381.1 10.7
Equity incl. minorities 2,947.7 3,411.1 15.7
Total liabilities and equity 5,099.2 5,792.2 13.6
Net cash 415.6 293.8

CASH FLOW STATEMENT
22
in CHF mn 2016 2017
Cash flow from operating activities 735.7 651.9
CapEx/sale of assets/acquisitions -172.7 -478.2
Free cash flow 563.0 173.7
Acquisitions/financial assets 23.5 323.1
Operating free cash flow 586.5 496.8
Free cash flow 563.0 173.7
Cash flow from financing activities -473.3 -289.2
Exchange differences -9.1 -1.6
Net change in liquid funds 80.6 -117.1

INVESTMENTS EFFICIENT CAPITAL MANAGEMENT
23
70 73 79
73 82 85
17 5 40 159 160
204
2015 2016 2017
Fixed assets through M&A
Maintenance capex
Capacity capex
9 new Factories 5th plant in Mexico New and expanded plant in
Kazakhstan 1st plant in Tanzania 5th plant in Russia New and expanded site in
Pakistan 2nd plant in Angola New fiber plant in Germany 1st plant in Cameroon 22nd plant in the USA
Capex (% NS) 2.6% 2.7% 2.6%
Fixed Assets through M&A (%NS)
0.3% 0.1% 0.7% (w/o Acquisitions)

RETURN ON CAPITAL EMPLOYED (ROCE 2012 – 2017) CONTINUED INCREASE IN SPITE OF GROWTH INVESTMENTS
24
18.5%
21.0%
23.3% 24.3%
28.7% 29.8%
2012 2013 2014 2015 2016 2017

RECORD DIVIDEND PROPOSAL OF THE BOARD OF DIRECTORS
25
Dividend payment CHF 111.00 per bearer share
CHF 18.50 per registered share
in CHF mn 2016 2017
Group profit (after minorities) 563.1 643.5
Dividend out of retained earnings 243.7 281.8
Total payout ratio 43.3% 43.8%

3. SUCCESSFUL STRATEGY EXECUTION
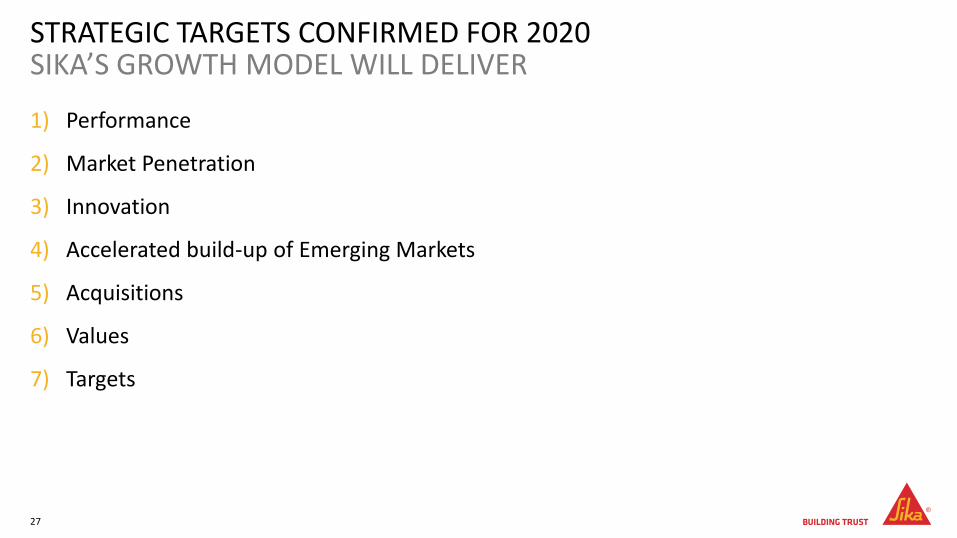
1) Performance
2) Market Penetration
3) Innovation
4) Accelerated build-up of Emerging Markets
5) Acquisitions
6) Values
7) Targets
STRATEGIC TARGETS CONFIRMED FOR 2020 SIKA’S GROWTH MODEL WILL DELIVER
27

1) PERFORMANCE

SIKA’S GROWTH MODEL DELIVERS KEY INVESTMENTS SINCE 2015

SIKA’S GROWTH MODEL DELIVERS CONTINUED GROWTH IN SALES AND PROFIT (FULL YEAR)
30
NET SALES
7.6%
9.0%
10.2%
11.4%
12.3%
13.8% 14.3%
2.0 %
4.0 %
6.0 %
8.0 %
10. 0%
12. 0%
14. 0%
16. 0%
100
200
300
400
500
600
700
800
900
100 0
110 0
2011 2012 2013 2014 2015 2016 2017
as % of net sales
EBIT
5.3% 9.4% 13.0% 6.2% 5.5% 9.0%
2.0 %
4.0 %
6.0 %
8.0 %
10. 0%
12. 0%
14. 0%
16. 0%
400 0
450 0
500 0
550 0
600 0
650 0
700 0
2011 2012 2013 2014 2015 2016 2017
% growth in local currencies
NET SALES

2) MARKET PENETRATION

SIKA’S MARKET POTENTIAL LARGE AND GROWING MARKET SEGMENTS
32
CONCRETE
WATER-PROOFING
SEALING & BONDING
ROOFING
FLOORING
INDUSTRY
2017 > CHF 70 BILLION
CONCRETE
WATER-PROOFING
SEALING & BONDING
ROOFING
FLOORING
INDUSTRY
2020 CHF 80 BILLION
TOTAL MARKET SIZE
REFURBISHMENT REFURBISHMENT

MEGATRENDS DRIVE OUR GROWTH URBANIZATION, NEW VEHICLE DESIGN AND SUSTAINABILITY
33
Higher demand for infrastructure and
refurbishment solutions
Sustainability: Increasing demand for safe-to-use and
low-emission products
Increased safety, fire, water, earthquake and quality requirements
Increasing world population with urbanization and
megacities
New modular vehicle
manufacturing concepts need fast,
high strength bonding systems
New vehicle design with material mix requires bonding
solutions
Rising demand for high performance concrete, sealing
and waterproofing

MARKET PENETRATION - FOCUS ON ATTRACTIVE MARKETS: CROSS-SELLING, LIFE-CYCLE MANAGEMENT, A STRONG BRAND
Sealing & Bonding Refurbishment Industry
Concrete Waterproofing Roofing Flooring & Coating
34

GROWTH MODEL WITH EARLY MARKET PENETRATION FROM NEW BUILD TO REFURBISHMENT
35
Emerging markets Developing markets Mature markets
Sika
’s m
arke
t p
ote
nti
al
Infrastructure
Higher building standards
Repair and refurbishment
Long-term market potential Sika
SIKA HAS SOLUTIONS FOR ALL MARKETS

3) INNOVATION

INNOVATION STRONG TRACK RECORD
37
217 patents were filed since 2015
More than
900 employees are dedicated to Research and Development
283 invention disclosures Since 2015
20 Technology Centers worldwide
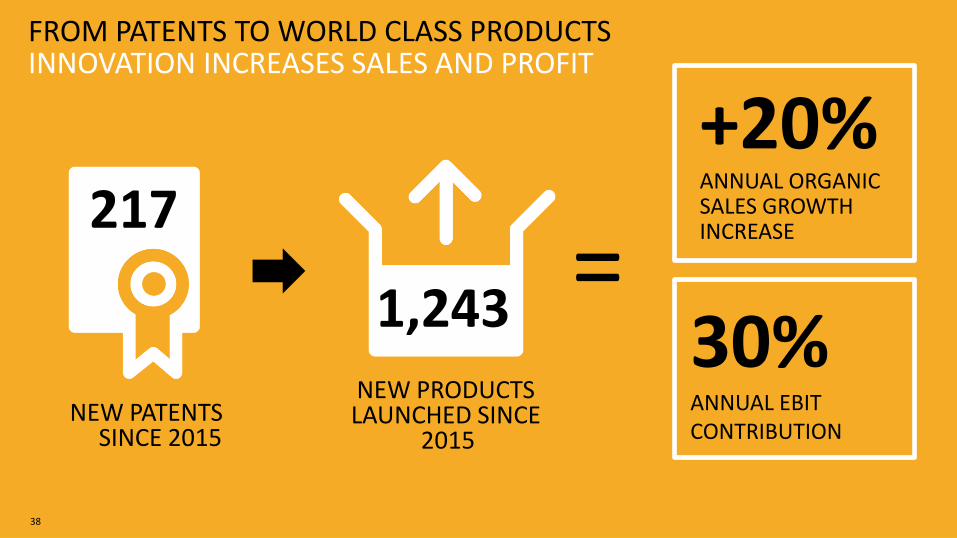
FROM PATENTS TO WORLD CLASS PRODUCTS INNOVATION INCREASES SALES AND PROFIT
38
NEW PATENTS SINCE 2015
NEW PRODUCTS LAUNCHED SINCE
2015
217
1,243 =
+20% ANNUAL ORGANIC SALES GROWTH INCREASE
30% ANNUAL EBIT CONTRIBUTION

SIKA INNOVATIONS DRIVE GROWTH E.G. TIME AND COST EFFECTIVENESS IN FIRE PROTECTION
FAST CURING AND ROBUST SURFACE ALLOW TRANSPORTATION AND ASSEMBLY WITHIN
24 HOURS
Sika® Unitherm® Platinum-120 FIRE PROTECTION COATING DELAYS HEAT BUILD-UP AND PROLONGS EVACUATION TIME BY UP TO
150 MINUTES
• INCREASED SAFETY • SHORT CONSTRUCTION TIME • LOWER PROJECTS COSTS • FIRE AND CORROSION
PROTECTION IN ONE
39

SIKA INNOVATIONS DRIVE GROWTH E.G. REDUCING APPLICATION TIME IN FLOORING
40
3 INSTEAD OF 13 DAYS
IS HOW LONG IT TAKES TO REFURBISH 1,000m2 OF FLOORING WITH SikaScreed® HardTop, COMPARED TO REFURBISHMENT WITH CONVENTIONAL PRODUCTS
SikaScreed® HardTop INCREASES
PRODUCTIVITY AND EFFICIENCY ALLOWING FOR SHORT SHUT-DOWN PERIODS AND COST SAVINGS FOR HEAVY-DUTY FLOORS
UNIQUE WORLDWIDE: • FEWER WORKING
STEPS • RAPID CURING • HIGH DURABILITY

4) ACCELERATED BUILD-UP OF EMERGING MARKETS

EMERGING MARKETS BUILD-UP SINCE 2015 CAPTURING GROWTH POTENTIAL IN NEW MARKETS
26 new plants opened
10 new national subsidiaries
36% of sales in emerging markets
42
5 acquisitions

5) ACQUISITIONS

SIKA’S MARKET POTENTIAL FRAGMENTATION OFFERS ACQUISITION OPPORTUNITIES
44
Sika
CONSTRUCTION CHEMICAL MARKET 2017 > CHF 60 BILLION
Top 10 companies with a combined market share of 40%
Other

ACQUISITIONS SINCE 2015 GROWTH PLATFORMS FOR THE FUTURE
45
17 acquisitions
705 million CHF additional turnover
In all
7 Target Markets
In all
4 regions

6) VALUES AND PRINCIPLES

Customer first
Courage for innovation
Sustainability & integrity
Empowerment and respect
Manage for results
SIKA’S VALUES AND PRINCIPLES STRONG CORPORATE CULTURE
47

7) TARGETS 2020

SIKA’S GROWTH MODEL WILL DELIVER STRATEGIC TARGETS 2020
49
6 - 8% ANNUAL GROWTH MARKET PENETRATION
INNOVATION
EMERGING MARKETS
ACQUISITIONS
VALUES
30 NEW PLANTS
14 - 16% EBIT MARGIN PER YEAR
> 25% ROCE PER YEAR
105 NATIONAL SUBSIDIARIES
> 10% OPERATING FREE CASH FLOW PER YEAR

4. OUTLOOK PAUL SCHULER, CEO, IVO SCHÄDLER, EMEA CHRISTOPH GANZ, AMERICAS MIKE CAMPION, ASIA/PACIFIC THOMAS HASLER, INDUSTRY & AUTOMOTIVE

Positive outlook for EMEA
Over-proportional growth in Africa and strong growth in Eastern Europe
Middle East: well positioned in major projects such as new Istanbul Airport and Dubai Creek Harbour Tower Project
Good position in mature markets driven by substantial infrastructure project wins: Grand Paris, France; Battersea Power Station, London, UK; Gubrist Tunnel, Switzerland; Brenner Tunnel, Italy; Stuttgart 21, Germany
Opening of new production sites to increase local footprint and capacities
Using synergies from newly acquired companies
Further strengthen Distribution Channels, especially Eastern Europe, Germany and Middle East
OUTLOOK EMEA
51

Positive Market environment expected for the US and Canada (US infrastructure, tax reform etc.)
Positive outlook for Mexico and Argentina, still challenging situations in Brazil, Peru and Chile
Major business opportunities in North America: Data and distribution center boom, repair works from hurricanes in the South, from heavy rain falls in the West and from a strong winter in the East/Central US and Canada
Distribution business focus in Latin American markets where we face a lack of large projects
Big City focus: cross- and project selling, on-boarding of new plants (Houston, Los Angeles, Lima)
Supply chain and procurement opportunities in new Region Americas
Acquisitions: sales integration of Butterfield and EMSEAL into Sika US, of Alkoat into Sika Mexico; well filled acquisition projects pipeline in all of Region Americas
Digitalization: from a strong position in off-line markets to an strong position in on-line markets
OUTLOOK AMERICAS
52

The market in Asia/Pacific remains strong with huge growth potential in all Target Markets
Double digit growth in Greater China and Pacific Areas
Continued development of large infrastructure projects throughout Southeast Asia and India
Tokyo 2020 Olympics will continue to be a major focus in Japan
Continued expansion of our production base and supply chain with the completion of 4 more production sites
Continuation of acquisition activity in our key market to spur additional growth
OUTLOOK ASIA/PACIFIC
53
OUTLOOK AUTOMOTIVE & INDUSTRY
Dynamic and positive market conditions with growth in all key markets. Global car production is forecasting a 2% base growth rate
Additional growth potential fueled by increased needs for light weight, multi-material concepts, comfort and safety
Full electric and hybrid vehicles (car, bus and truck) offer additional 20% market potential in dielectric, thermal conductive and fire/safety protection solutions
Expansion of global supply footprint with new or extended workshops in all key markets (Japan, China, EU, US, Brazil, Mexico)
Leveraging of full range of acoustic solutions for the automotive, transportation and appliance industry by fast integration of Faist ChemTec

Sales increase of more than 10% expected in 2018
Volatile and rising commodity prices will continue to be a
challenge
Disproportionally high growth in profit expected for the year 2018 as a whole
STRONG OUTLOOK 2018 FOR SIKA CONTINUATION OF SUCCESSFUL GROWTH STRATEGY
55

5. QUESTIONS AND ANSWERS

THANK YOU FOR YOUR ATTENTION

This presentation contains certain forward-looking statements. These forward-looking statements may be identified by words such as ‘expects’, ‘believes’, ‘estimates’, ‘anticipates’, ‘projects’, ‘intends’, ‘should’, ‘seeks’, ‘future’ or similar expressions or by discussion of, among other things, strategy, goals, plans or intentions. Various factors may cause actual results to differ materially in the future from those reflected in forward-looking statements contained in this presentation, among others:
Fluctuations in currency exchange rates and general financial market conditions
Interruptions in production
Legislative and regulatory developments and economic conditions
Delay or inability in obtaining regulatory approvals or bringing products to market
Pricing and product initiatives of competitors
Uncertainties in the discovery, development or marketing of new products or new uses of existing products, including without limitation negative results of research projects, unexpected side-effects of pipeline or marketed products
Increased government pricing pressures
Loss of ability to obtain adequate protection for intellectual property rights
Litigation
Loss of key executives or other employees
Adverse publicity and news coverage.
Any statements regarding earnings per share growth are not a profit forecast and should not be interpreted to mean that Sika’s earnings or earnings per share for this year or any subsequent period will necessarily match or exceed the historical published earnings or earnings per share of Sika.
For marketed products discussed in this presentation, please see information on our website: www.sika.com
All mentioned trademarks are legally protected.
FORWARD-LOOKING STATEMENT
58