Airline Deregulation and Airline Economics. Airports you have known?
15th International Conference on Business Management (ICBM 2018)
1131
Significance of Meal Forecasting in Airline Catering on Food Waste
Minimization
Megodawickrama, P.L.,
University of Moratuwa, Sri Lanka
Abstract
Forecasting demand for products and services in the airline industry is particularly important. Research
objectives are to assess the relationship of meal demand variance and kitchen wise waste per meal and to
identify the importance of having forecasted meal demands before 24 hours to the estimated time of departure
(ETD). Initial meal demand, final meal demand, meal demand variance and number of meals catered per day
are the independent variables, and the dependent variable is production waste per meal (kg). A combination
of descriptive research, correlation research and applied research were used. The population of this study was
all the airlines catered to from July to October 2017. The selected sample for the study was 75% percent of
total meals and 80% of sectors during the research period. Irrespective of the month, the pattern of the average
daily meal count for weekdays has continued throughout the period of the research. Each sub kitchens has
reported the lowest average waste per meal on August which is the Peak period with highest meal demand of
the research period.
The least waste per meal and the standard deviation were detected in the confectionery. Minimum waste per
meal was achieved when the initial meal demand was 100% of the flight with zero meal demand variance. The
highest portion of average waste per meal was generated by the vegetable room followed by the hot kitchen.
The average meal demands of all the classes of the airlines have increased representing that the risk of the
increasing of the meal demands within last 24 hours has transferred to the caterer by the airline. The company
has to invest for a better forecasting system and should search for other options such as standard meals for
the increases (Meal Bank), standard uplift with the agreement of the customer airline to uplift standard quantity
of meals for each class.
Keywords: Food Waste, Flight Catering Industry, Meal Forecast, Variance, Initial Meal Demand, Final Meal
Demand, Estimated Time of Departure
INTRODUCTION
The tourism industry is a highly variable industry and the seasonality has a significant impact on the
demand for the airline industry with travel patterns being most unpredictable. The passenger airline
industry operates on low profit margins with many competitors. Airline carriers sustain profitability
through operational efficiency improvements and by maintaining or increasing market share (Jason,
1999). Catering Flights is an important part of an airline’s operations. The meal service has a critical
impact on customer service quality and represents significant costs. Unfortunately, due to high
passenger load variability and minimum production lead-time requirements, it is difficult to get the
15th International Conference on Business Management (ICBM 2018)
1132
number of meals to exactly match the passenger count on each flight. (Morency,1999).The flight
catering is a very large, global industry. The total market size is estimated to be around 12 billion
euros. More than 1 billion passengers are served each year. It is probably one of the most complex
operational systems in the world (Jones, 2007).
Forecasting demand for the products and services in the airline industry is particularly
important. Importance of forecasting the meal demand for the passengers by seat class as
the meal options, quality and number of meals needed vary between classes. Forecasting
meal demand is a complex exercise as a number of factors influence, whether a passenger
will consume a meal, including the type of airline, seat class, and time of the flight.
Research conducted by the Travel Catering Research Centre found that the caterers made
little contribution to innovations inflight catering. Furthermore, there has been a
minimum focus on the food as an area for new product development (Jones, 2007).
There is a variability between the initial passenger loads and the final passenger loads
provided by the customer airline within 24 hours to the estimated time of departure and
this has created an uncertainty in the Production Floor of a flight catering company. The
average daily Flight kitchen waste per meal fluctuate throughout the year and this affect
average profit margin (Profit per Meal) significantly.A catering system has to be
designed and organized to produce the right quantity of food at the correct standard, for
the required number of people, on time and using the resources of staff, equipment and
materials effectively and efficiently. A central constraint is that inflight catering,
production is separated from service by distance and time(Jones, 2004).Significant lead
time is required to produce a meal order. Meal provisioning involves preparation,
cooking, assembling, blast chilling/ chilling and transporting the meal order, and in some
airports, large flights depart within minutes of each other (Jason, 1999).There is a
variation of the average daily waste per meal in a flight catering company. Production of
the flight kitchen vary in terms of total Pax count, types of meals, airline classes, etc.
The average daily kitchen waste is fluctuating throughout the year. The average profit
margin (Profit per Meal) is significantly depending on the average waste per meal.This
research will guidethe flight catering companies to identify the importance of having
accurate forecasting system to identify, measure and control the production waste.
RESEARCH OBJECTIVES
The research was conducted in order to,
Assess the relationship ofmeal demandvariance and kitchen wise waste per meal
15th International Conference on Business Management (ICBM 2018)
1133
Identify the importance of having forecasted Meal demands before 24 hours to the estimated time
of departure (ETD)
METHODOLOGY
The research was conducted in the Flight Catering Company in Sri Lanka. Initial meal
demand, final meal demand, meal demand variance and the number of meals catered per
day are the independent variables, and the dependent variable is production waste per
meal (kg). A combination of descriptive research, correlation research and the applied
research were used. The population of this study was all the airlines catered to from July
to October 2017. Stratified and judgmental sampling techniques were used for sampling
procedure. Primary data collection form which was developed to collect the daily kitchen
waste (kg) was used as the main research instrument of the research.The passenger flight
loads data were collected using a secondary data collection method which was found
suitable to the context of the study.
The selected sample for the study was two Airlines which generated 75% percent of total
meals demand and 80% of the sectors, catered by the Flight Catering Company during
the research period. Meal demand data were collected using secondary data collection
method from the Inflair ERP system and the production waste data was collected using
primary data collection sheet. The data analysis was done using the MINITAB statistical
software. The descriptive data analysis, simple linear regression, Pearson Correlation
Coefficient techniques were mainly used in data analysis.
In the empirical analysis multiple linear regression analysis was employed. Using the
regression analysis, function y = f(x) was analysed.
Daily Flight Kitchen Waste per Meal = * Meal Demand Variance + ℇ
: Coefficient, ℇ: Error, Meal Demand Variance = Final Meal demand – Initial
MealDemand
Pearson - Correlation Coefficient
• No of Meals per Day Vs. Kitchen Waste Per Meal
• Meal DemandVariance Vs. Individual Kitchen Waste Per Meal
Research Hypothesis
• H0 : Meal DemandVariance and Production Waste Per Meal(kg) are independent
• HA : Meal DemandVariance and Production Waste Per Meal(kg) are associated

15th International Conference on Business Management (ICBM 2018)
1134
RESULTS AND DISCUSSION
Descriptive analysis was used to provide summary of the data collected from the sample
of the study.
Table 1.1: Population of the Research
July August September October
Total Meal Count 613072 715675 627928 620676
No of flights 3082 3234 3134 3272
No of Sectors 4263 3694 3553 3703
The population of the research was all the regular and charter flights catered by the flight
catering company in the period of July to October 2017. The purpose of selecting this
period was the period included both peak month (August- Total Meal Demand 715675)
and off-peak months (July – Total Meal Demand 613072) for the company production.
The selected sample flights meal demands, represent approximately 80% of the
population of the Research. Approximately 80% of the total production is represented by
the selected Sample for the Period of July to October 2017.
The figure1.2represent the daily meal demand fluctuation of the Period from July to
October 2017. The daily meal demand has fluctuated from 24861 (maximum) on 10th
August 2017 to 14156 (minimum) 07thJuly 2017.
Airline 1 Airline 2
Figure 1.1: Percentage - Sample Size of the Research
0%
10%
20%
30%
40%
50%
60%
70%
80%
90%
100%
July August September October
Per
cen
tage
Figure 1.2: Daily Meal Demand Fluctuation
12000
14000
16000
18000
20000
22000
24000
26000
7/1
/201
7
7/8
/201
7
7/1
5/2
017
7/2
2/2
017
7/2
9/2
017
8/5
/201
7
8/1
2/2
017
8/1
9/2
017
8/2
6/2
017
9/2
/201
7
9/9
/201
7
9/1
6/2
017
9/2
3/2
017
9/3
0/2
017
10
/7/2
017
10
/14/2
017
10
/21/2
017
10
/28/2
017
Mea
l C
ou
nt
15th International Conference on Business Management (ICBM 2018)
1135
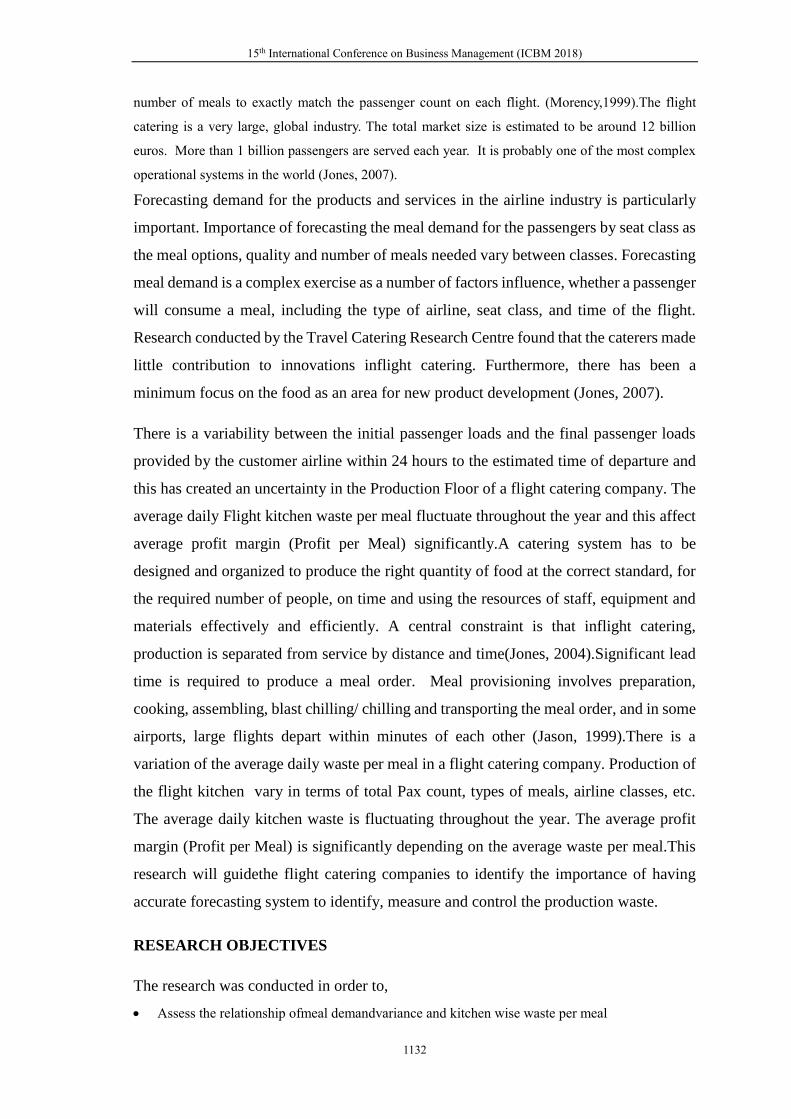
The figure 1.3 represents the fluctuation of the total daily waste in each Sub-kitchen in
the production department in kilograms (kg).
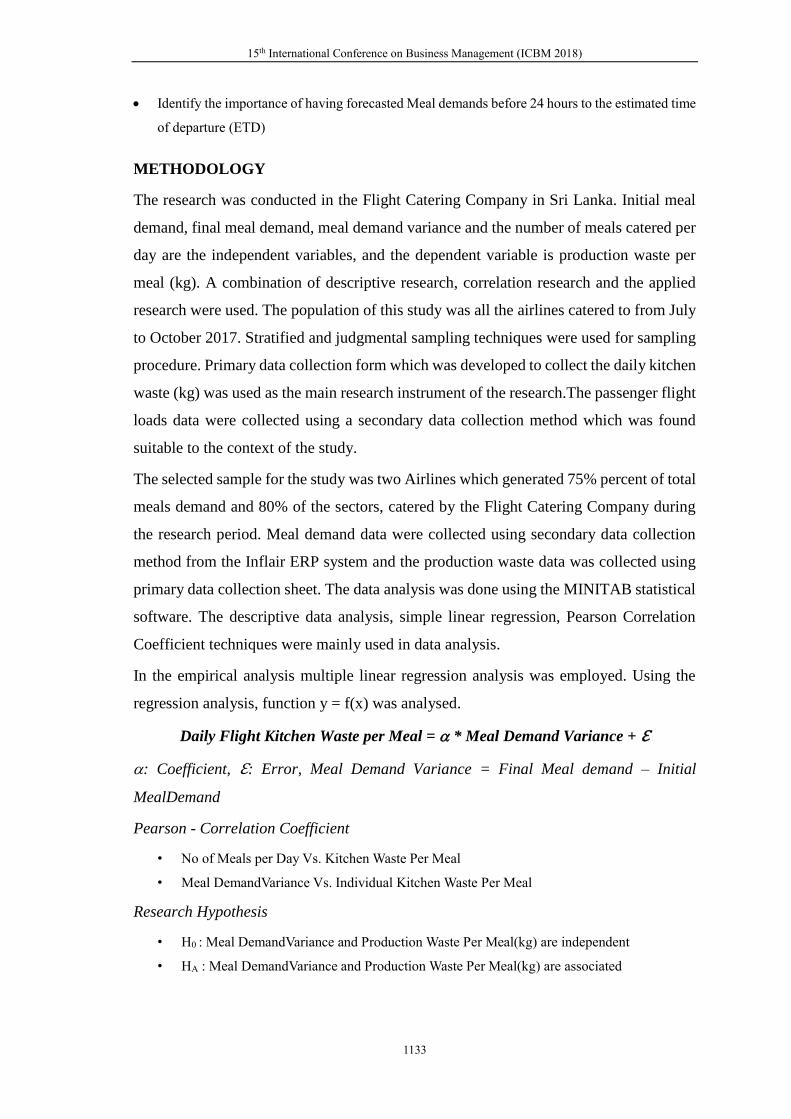
Irrespective of the month, the pattern of the average daily meal count for weekdays has
continued throughout the period of the research (Figure 1.4).
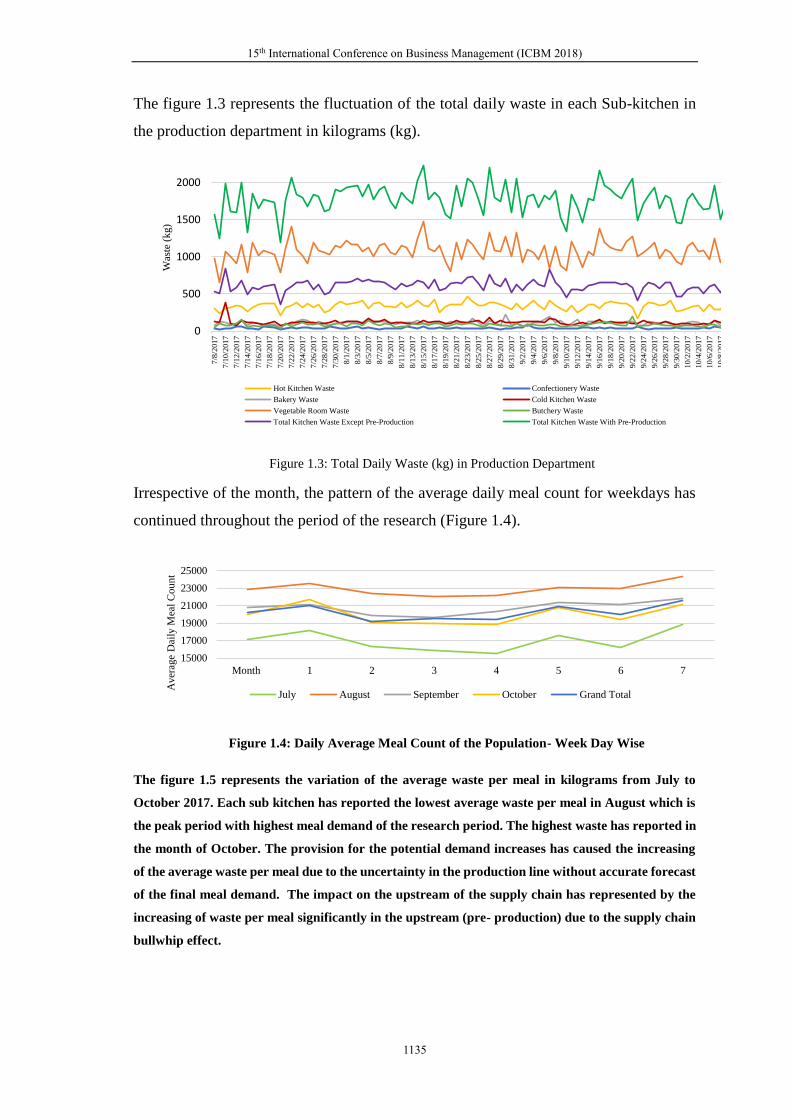
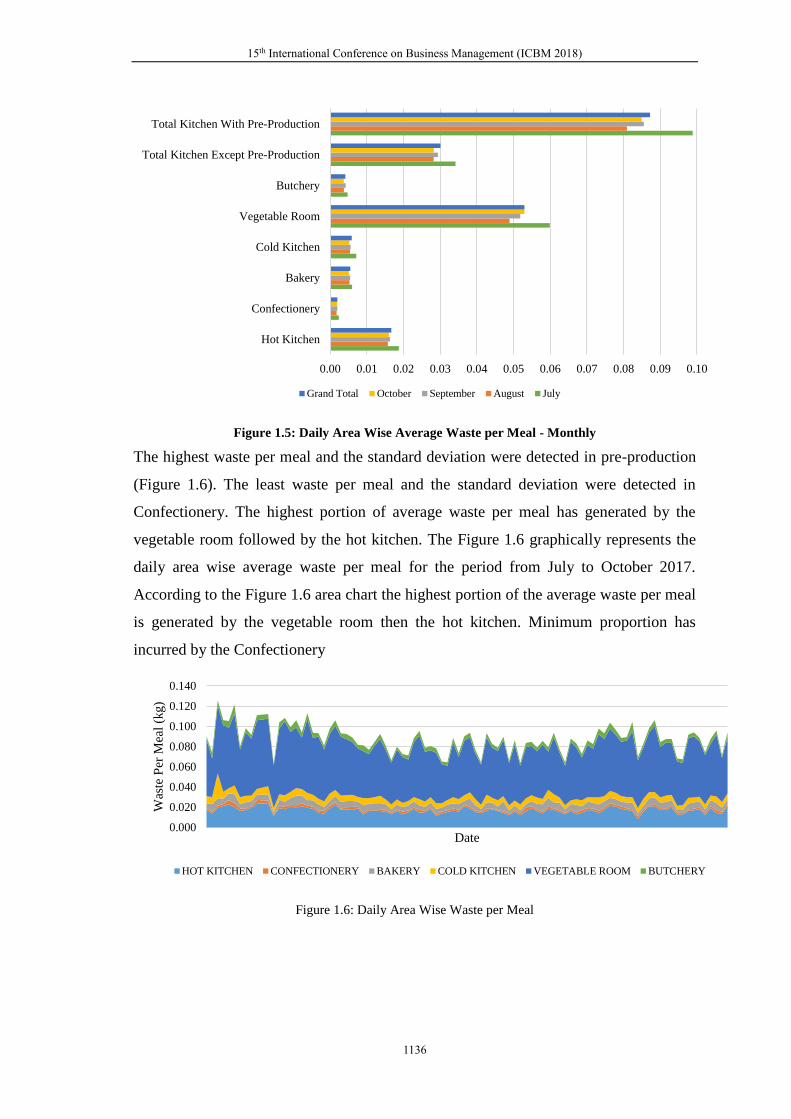
The figure 1.5 represents the variation of the average waste per meal in kilograms from July to
October 2017. Each sub kitchen has reported the lowest average waste per meal in August which is
the peak period with highest meal demand of the research period. The highest waste has reported in
the month of October. The provision for the potential demand increases has caused the increasing
of the average waste per meal due to the uncertainty in the production line without accurate forecast
of the final meal demand. The impact on the upstream of the supply chain has represented by the
increasing of waste per meal significantly in the upstream (pre- production) due to the supply chain
bullwhip effect.
Figure 1.4: Daily Average Meal Count of the Population- Week Day Wise
15000
17000
19000
21000
23000
25000
Month 1 2 3 4 5 6 7
Aver
age
Dai
ly M
eal
Cou
nt
July August September October Grand Total
Figure 1.3: Total Daily Waste (kg) in Production Department
0
500
1000
1500
2000
7/8
/2017
7/1
0/2
017
7/1
2/2
017
7/1
4/2
017
7/1
6/2
017
7/1
8/2
017
7/2
0/2
017
7/2
2/2
017
7/2
4/2
017
7/2
6/2
017
7/2
8/2
017
7/3
0/2
017
8/1
/2017
8/3
/2017
8/5
/2017
8/7
/2017
8/9
/2017
8/1
1/2
017
8/1
3/2
017
8/1
5/2
017
8/1
7/2
017
8/1
9/2
017
8/2
1/2
017
8/2
3/2
017
8/2
5/2
017
8/2
7/2
017
8/2
9/2
017
8/3
1/2
017
9/2
/2017
9/4
/2017
9/6
/2017
9/8
/2017
9/1
0/2
017
9/1
2/2
017
9/1
4/2
017
9/1
6/2
017
9/1
8/2
017
9/2
0/2
017
9/2
2/2
017
9/2
4/2
017
9/2
6/2
017
9/2
8/2
017
9/3
0/2
017
10/2
/2017
10/4
/2017
10/6
/2017
10/8
/2017
Was
te (
kg)
Hot Kitchen Waste Confectionery Waste
Bakery Waste Cold Kitchen Waste
Vegetable Room Waste Butchery Waste
Total Kitchen Waste Except Pre-Production Total Kitchen Waste With Pre-Production
15th International Conference on Business Management (ICBM 2018)
1136
Figure 1.5: Daily Area Wise Average Waste per Meal - Monthly
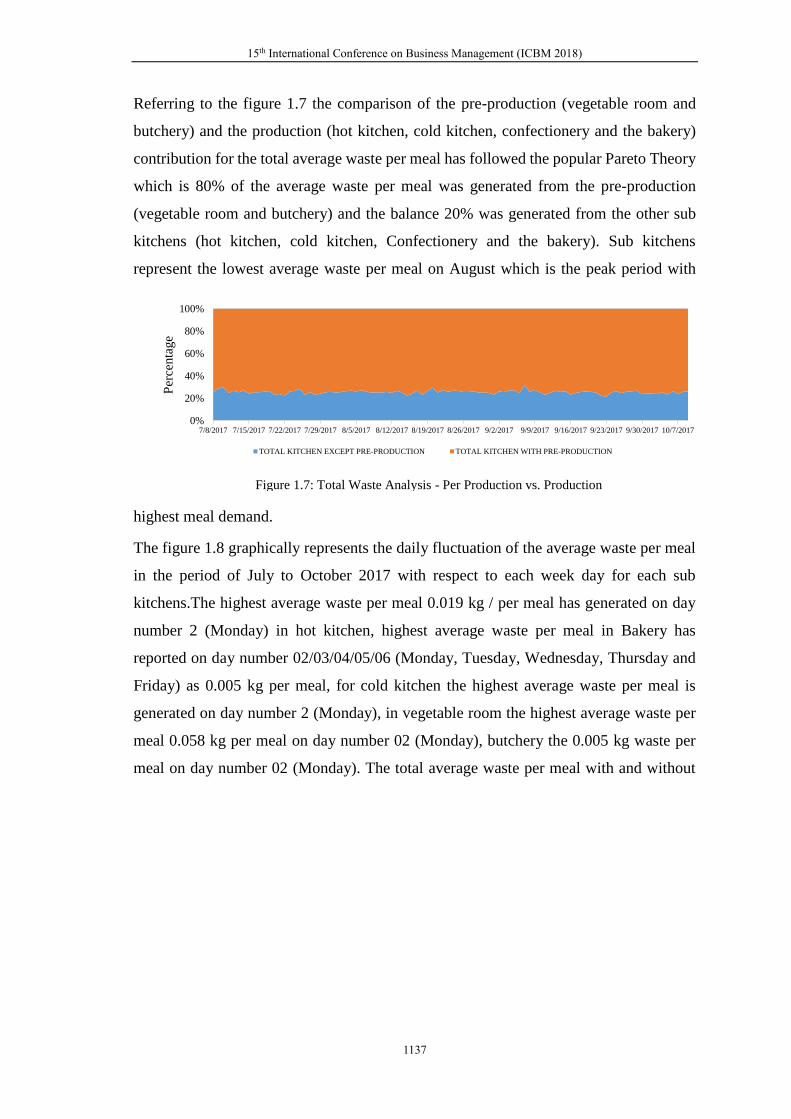
The highest waste per meal and the standard deviation were detected in pre-production
(Figure 1.6). The least waste per meal and the standard deviation were detected in
Confectionery. The highest portion of average waste per meal has generated by the
vegetable room followed by the hot kitchen. The Figure 1.6 graphically represents the
daily area wise average waste per meal for the period from July to October 2017.
According to the Figure 1.6 area chart the highest portion of the average waste per meal
is generated by the vegetable room then the hot kitchen. Minimum proportion has
incurred by the Confectionery
Figure 1.6: Daily Area Wise Waste per Meal
0.00 0.01 0.02 0.03 0.04 0.05 0.06 0.07 0.08 0.09 0.10
Hot Kitchen
Confectionery
Bakery
Cold Kitchen
Vegetable Room
Butchery
Total Kitchen Except Pre-Production
Total Kitchen With Pre-Production
Grand Total October September August July
0.000
0.020
0.040
0.060
0.080
0.100
0.120
0.140
Was
te P
er M
eal
(kg)
Date
HOT KITCHEN CONFECTIONERY BAKERY COLD KITCHEN VEGETABLE ROOM BUTCHERY
15th International Conference on Business Management (ICBM 2018)
1137
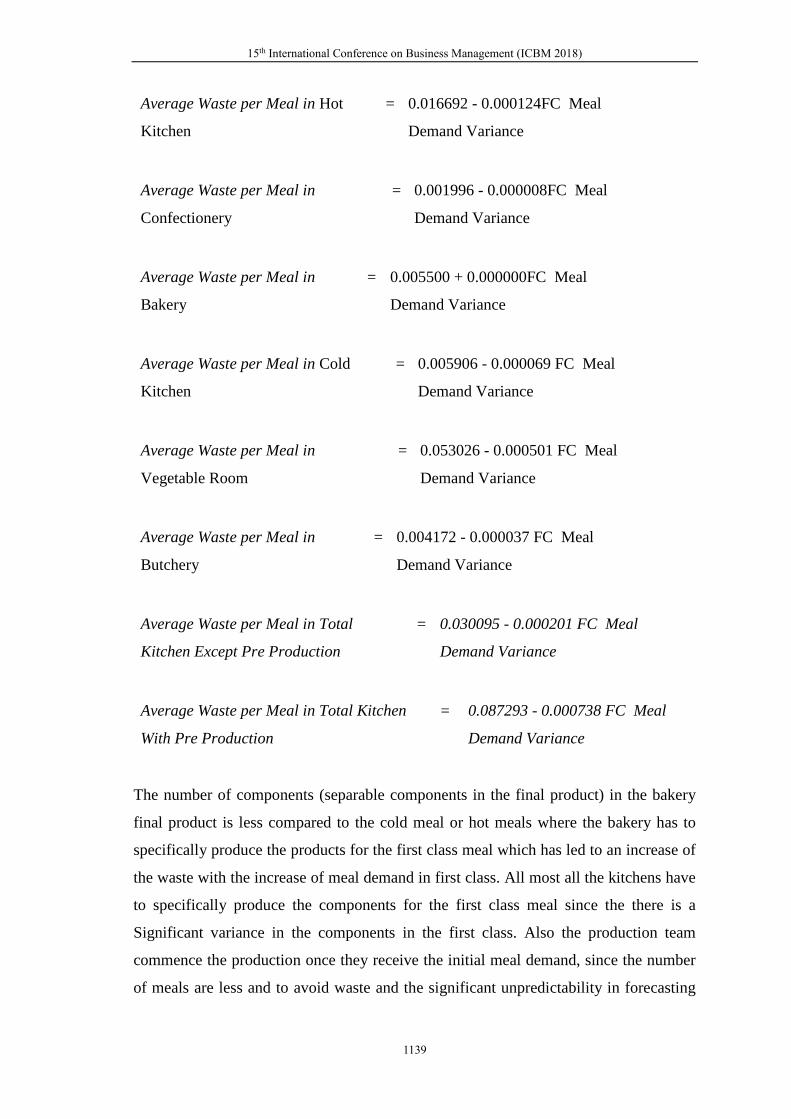
Referring to the figure 1.7 the comparison of the pre-production (vegetable room and
butchery) and the production (hot kitchen, cold kitchen, confectionery and the bakery)
contribution for the total average waste per meal has followed the popular Pareto Theory
which is 80% of the average waste per meal was generated from the pre-production
(vegetable room and butchery) and the balance 20% was generated from the other sub
kitchens (hot kitchen, cold kitchen, Confectionery and the bakery). Sub kitchens
represent the lowest average waste per meal on August which is the peak period with
highest meal demand.
The figure 1.8 graphically represents the daily fluctuation of the average waste per meal
in the period of July to October 2017 with respect to each week day for each sub
kitchens.The highest average waste per meal 0.019 kg / per meal has generated on day
number 2 (Monday) in hot kitchen, highest average waste per meal in Bakery has
reported on day number 02/03/04/05/06 (Monday, Tuesday, Wednesday, Thursday and
Friday) as 0.005 kg per meal, for cold kitchen the highest average waste per meal is
generated on day number 2 (Monday), in vegetable room the highest average waste per
meal 0.058 kg per meal on day number 02 (Monday), butchery the 0.005 kg waste per
meal on day number 02 (Monday). The total average waste per meal with and without
Figure 1.7: Total Waste Analysis - Per Production vs. Production
0%
20%
40%
60%
80%
100%
7/8/2017 7/15/2017 7/22/2017 7/29/2017 8/5/2017 8/12/2017 8/19/2017 8/26/2017 9/2/2017 9/9/2017 9/16/2017 9/23/2017 9/30/2017 10/7/2017
Per
centa
ge
TOTAL KITCHEN EXCEPT PRE-PRODUCTION TOTAL KITCHEN WITH PRE-PRODUCTION

15th International Conference on Business Management (ICBM 2018)
1138
pre-production has generated on day number 02 (Monday) following 0.034 kg per meal
and 0.097 kg per meal.
Figure 1.8: Daily Average Waste per Meal – Week Day Wise
Minimum wastes per meal were reported as, hot kitchen day number 07 (Saturday) with
0.014 kg per meal, bakery day number 01/07(Saturday/ Sunday) with 0.005 kg per meal,
vegetable room 0.048 kg per meal on day number 01 (Sunday), butchery day number
07(Saturday), total kitchen except pre-production on day number 07 (Saturday) with
0.027 kg per meal and finally total production with pre-production on day number 01/ 07
(Sunday and Saturday) with 0.081 kg per meal.
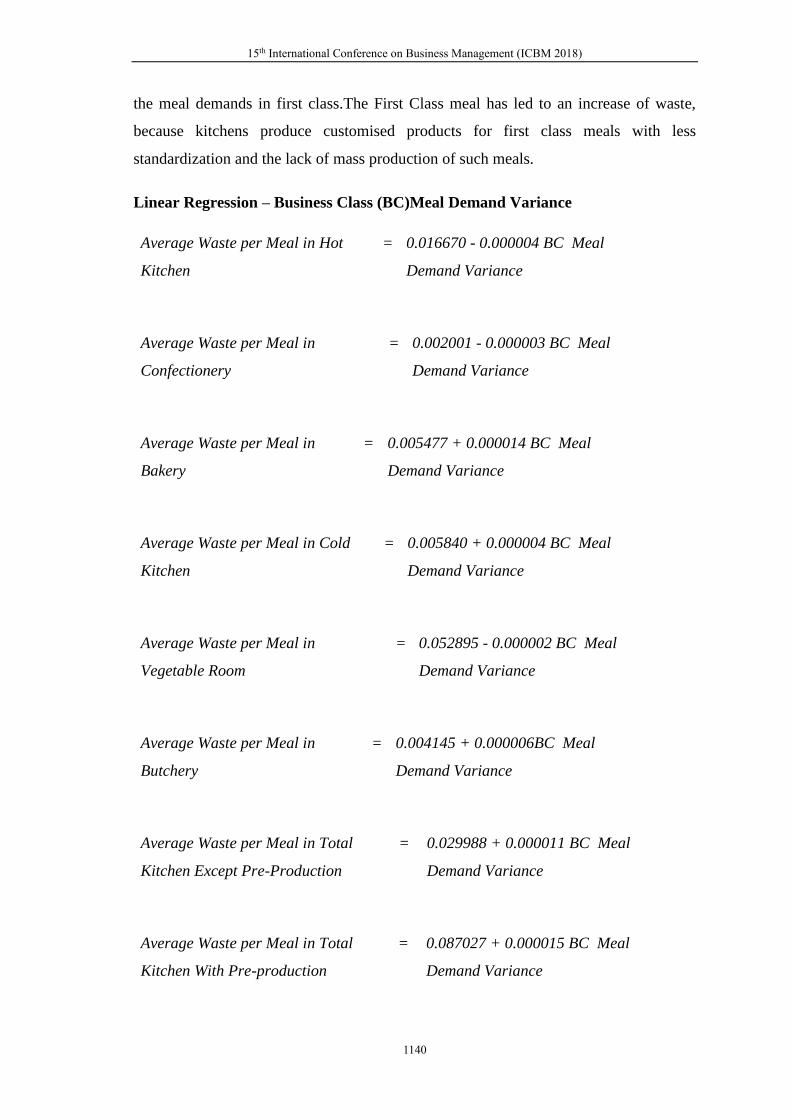
Linear Regression – First Class (FC)Meal Demand Variance
The below linear regressions summarize the relationships of average waste per meal in
each sub kitchens with FC meal demand variance,except bakery all the other sub kitchens
have negative linear relationships with the FC meal demand variance, indicating that the
increasing of FC meal demand will marginally reduce the average waste per meal. This
is due to the provision for the potential meal demand increased by the production staff
when they receive the initial meal demand for the first class, and the possibility of share
some product components for the increased meal demands which have currently
preparedas bulk in pre-production.
0.000.010.020.030.040.050.060.070.080.090.10
Hot Kitchen Confectionery Bakery Cold Kitchen Vegetable
Room
Butchery Total Kitchen
Except Pre-
Production
Total Kitchen
With Pre-
Production
Aver
age
Was
te p
er M
eal
D1 D2 D3 D4 D5 D6 D7 Grand Total
15th International Conference on Business Management (ICBM 2018)
1139
Average Waste per Meal in Hot
Kitchen
= 0.016692 - 0.000124FC Meal
Demand Variance
Average Waste per Meal in
Confectionery
= 0.001996 - 0.000008FC Meal
Demand Variance
Average Waste per Meal in
Bakery
= 0.005500 + 0.000000FC Meal
Demand Variance
Average Waste per Meal in Cold
Kitchen
= 0.005906 - 0.000069 FC Meal
Demand Variance
Average Waste per Meal in
Vegetable Room
= 0.053026 - 0.000501 FC Meal
Demand Variance
Average Waste per Meal in
Butchery
= 0.004172 - 0.000037 FC Meal
Demand Variance
Average Waste per Meal in Total
Kitchen Except Pre Production
= 0.030095 - 0.000201 FC Meal
Demand Variance
Average Waste per Meal in Total Kitchen
With Pre Production
= 0.087293 - 0.000738 FC Meal
Demand Variance
The number of components (separable components in the final product) in the bakery
final product is less compared to the cold meal or hot meals where the bakery has to
specifically produce the products for the first class meal which has led to an increase of
the waste with the increase of meal demand in first class. All most all the kitchens have
to specifically produce the components for the first class meal since the there is a
Significant variance in the components in the first class. Also the production team
commence the production once they receive the initial meal demand, since the number
of meals are less and to avoid waste and the significant unpredictability in forecasting
15th International Conference on Business Management (ICBM 2018)
1140
the meal demands in first class.The First Class meal has led to an increase of waste,
because kitchens produce customised products for first class meals with less
standardization and the lack of mass production of such meals.
Linear Regression – Business Class (BC)Meal Demand Variance
Average Waste per Meal in Hot
Kitchen
= 0.016670 - 0.000004 BC Meal
Demand Variance
Average Waste per Meal in
Confectionery
= 0.002001 - 0.000003 BC Meal
Demand Variance
Average Waste per Meal in
Bakery
= 0.005477 + 0.000014 BC Meal
Demand Variance
Average Waste per Meal in Cold
Kitchen
= 0.005840 + 0.000004 BC Meal
Demand Variance
Average Waste per Meal in
Vegetable Room
= 0.052895 - 0.000002 BC Meal
Demand Variance
Average Waste per Meal in
Butchery
= 0.004145 + 0.000006BC Meal
Demand Variance
Average Waste per Meal in Total
Kitchen Except Pre-Production
= 0.029988 + 0.000011 BC Meal
Demand Variance
Average Waste per Meal in Total
Kitchen With Pre-production
= 0.087027 + 0.000015 BC Meal
Demand Variance

15th International Conference on Business Management (ICBM 2018)
1141
The BC meal demand variance has significantly negative correlate with the waste per
meal in hot kitchen, confectionery and vegetable room sub areas in the production
department. This represents that the pre-preparation of the meals in advance for the
business class meal demands because if the meal demand increases the average waste per
meal get reduced, vice versa. The minimum waste per meal has achieved when the BC
meal demand variance was minimum in hot kitchen, confectionery and the vegetable
room. Because the risk to the producer for potential increasesis zero, because of that the
producer can produce the exact quantity and the risk taken by the pre-production by
producing the full configuration in advance is match with the initial meal demand
received.
Linear Regression – Economy Class (EY) Meal Demand Variance
Average Waste per Meal in Hot
Kitchen
= 0.016662 + 0.000002 EY Meal
Demand Variance
Average Waste per Meal in
Confectionery
= 0.001999 - 0.000000 EY Meal
Demand Variance
Average Waste per Meal in
Bakery
= 0.005486 + 0.000002 EY Meal
Demand Variance
Average Waste per Meal in Cold
Kitchen
= 0.005843 + 0.000000 EY Meal
Demand Variance
Average Waste per Meal in
Vegetable Room
= 0.052870 + 0.000012 EY Meal
Demand Variance
Average Waste per Meal in
Butchery
= 0.004146 + 0.000002 EY Meal
Demand Variance

15th International Conference on Business Management (ICBM 2018)
1142
Average Waste per Meal in Total Kitchen
Except Pre-Production
= 0.029989 + 0.000005 EY Meal
Demand Variance
Average Waste per Meal in Total Kitchen
With Pre-production
= 0.087005 + 0.000019 EY Meal
Demand Variance
The linear regressions of EY-meal demand variance has indicated a positive correlation
with the average waste per meal in all the sub- kitchens except confectionery. When the
EY-meal demand has increased the average Waste per meal also has increased, vice
versa, except the Confectionery. The increases in the meal demands in the last 24 hours
to the estimated time, the average waste per meal has increased due to the discrepancies
to the continuous production flow. Better forecasting of this factor will significantly
control the average waste per meal in bakery.
The production waste per meal reduces with the increase in number of meal demand per
day (Figure 1.9 & Figure 1.10). Demand uncertainty has significantly affected the
increase of waste in the production area. Production uncertainty where the caterer has to
take into account the risk of last minutes demand top-ups in advance and produce more
than the initial order placed by the airline has created the supply chain bullwhip effect.
Minimum waste per meal was achieved when the initial Meal Demand was 100% of the
Flight.
Figure 1.9: Scatterplot of Total Kitchen except Pre-
Production Waste per Meal Vs Daily Meal Demand
Figure 1.10: Scatterplot of Total Kitchen with Pre-
Production Waste per Meal Vs Daily Meal Demand
2500022500200001750015000
0.055
0.050
0.045
0.040
0.035
0.030
0.025
0.020
Daily Meal Count
To
tal
Kit
ch
en
Wast
e P
er
Meal
Excep
t P
re P
rod
ucti
on
2500022500200001750015000
0.13
0.12
0.11
0.10
0.09
0.08
0.07
0.06
Daily Meal Count
To
tal
Kit
ch
en
Wast
e P
er
Meal
Wit
h P
re P
rod
ucti
on
15th International Conference on Business Management (ICBM 2018)
1143
CONCLUSION AND RECOMMENDATIONS
The current available literature in foodservices has little published on pre consumer food
waste. There is also a gap in the current literature providing qualitative insight to the
issue of food waste in organizations. Furthermore, the airline catering industry is an area
with minimal publicly available waste research. The present study aims to assess the food
waste in sub production kitchens of an airline catering company, explore the relationship
with the meal demand Fluctuations.There is a variation of the average daily waste in the
flight catering company, Sri Lanka. Production of the flight kitchen are vary in terms of
total meal demand, types of meals, airline classes, etc. The average daily kitchen waste
per meal has fluctuated throughout the year.The average meal demands for all the classes
of the airlines has increased (positive variance), represent that the risk of the increasing
of the meal demands within last 24 hours has transferred to the caterer by the customer
airline. Airline has not given a significant provision for potential meal demand increases
when they place the initial order (initial meal demand) to the caterer. This creates
production uncertainty whereas the caterer has to take the risk of last minutes top-ups in
advance and produce more than the initial order placed by the airline creating the Supply
chain bullwhip effect. If the top-ups not received the caterer has to bear the cost of over-
production.Each month the pattern of the meal demand fluctuation with the week day
number can be observed. Irrespective of the month the pattern of the average daily meal
demand of the week day has continued over the period of the research.
There is a variation of the variability of the meal demand variance from customer airline
to airline. Because of that the impact to the waste is varying, therefore I is necessary tp
consider in costing and pricing. The variability of the passenger meal demand is less in
the peak months for all the classes. The meal bank inventory levels should be adjusted
according to the month of the year.The Passenger meal demand variability is high in short
haul flights compared to the medium haul and the long haul flights. This need to consider
when calculating the inventory levels of the meal bank with standard meals. All the
independent variables are scientifically significant (P- Value < 0.05) for the average
waste per meal in total kitchen except pre-production (vegetable room and butchery)
indicating that the importance of focusing on meal demand forecasting in order to reduce
the production waste.The highest absolute value coefficient (-0.01677) is incurred by the
15th International Conference on Business Management (ICBM 2018)
1144
EY- final meal demand, which the company need to focus and forecast efficiently in
order to reduce the average waste per meal in total kitchen with pre-production.
The provision for the potential increases might cause the average waste per meal due to
the uncertainty in the production line without accurate forecast for the final meal demand.
The impact of the upstream in the supply chain can be seen that the waste has increased
significantly in the Upstream (Pre- production) due to the Supply Chain bullwhip
Effect.The company has to invest for a better Forecasting system or search for another
options such as standard meals for the increases (meal bank), standard uplift with the
agreement of the customer airline to uplift standard quantity of meals for each class (E.g.:
business class 5 Nos. and economy class 10 Nos.) by charging a standard percentage
(E.g. – Cost of the meals) if the actual meal demands not increased, if increased the
normal price of the meals.
Based on the research findings the economy class meal demand has a significant impact
on the production waste per meal, propose to commence the meal bank with economy
class meals initially. The company should decide the percentage of meals for the meal
bank based on the total daily economy class meal demand to cater the meal demand
increases within 24 Hours. But this should agree with the customer airlines to provide
standard meal for the increases within 24 Hours to the departure. The company should
check the possibility of reducing the cycle time of the process by identifying the current
bottlenecks such as blast chilling which consume approximately 4 to 6 hours of the total
cycle time of the meal production. It is recommended to restructure the production
process to operate with 24 hours of production cycle time to eliminate the uncertainty in
the floor due to the non-availability of the passenger meal demands to plan the production
accordingly. The company should adjust the strategies which are required to manage the
over-ordered and over-produced food. One way to achieve this would be to create more
standardization between customer menus, especially for economy meals which make up
the majority of meals produced. More standardization between menus would give more
opportunities for over-produced or over-ordered food to be utilized, decreasing the
amount of food wasted.This Research allowed the flight catering companies to identify
the importance of having accurate forecasting system to minimize the production waste.

15th International Conference on Business Management (ICBM 2018)
1145
FUTURE STUDY POTENTIALS
Based on the available literature, there are very limited research studies have carried out
in the flight catering industry which is abillion dollar business with high risk and
responsibility due to the nature of the industry. The researcher propose to further study
the below areas in order to provide more information for decision making and improve
the industry as a whole.
Evaluate the financial and operational impact of the meal demand variance
Evaluate the feasibility of different meal demands forecast systems and the financial and
operational impact of implementing the systems
Financial and operational feasibility of static and mobile meal bank
Analyze the waste with categorization of the waste which will provide more information for
decision making on waste reduction
Analyze the customer agreements and their impact on the waste generation and the load factor
uncertainty, and identify the agreements/ terms which has created a win-win situation for
both customer airline and the flight caterer by improving the flight catering industry as a
whole.
REFERENCES
Daniel. F. (2014), Demand Forecasting for Perishable Commodities: A Case Study of Inflight Food
Demand for Low Cost Airline.
Goto, Jason H. (1999). A Markov Decision Process Model for Airline Meal Provisioning.
Johan, N.& Jones, P. (2018), Forecasting the Demand for Airline Meals.
Jones, P. (2004) Flight Catering, Butterworth Heinemann: Oxford.
Morency, V. (1999). A proposal for improving the meal provisioning process at Canadian Airlines.

15th International Conference on Business Management (ICBM 2018)
1146
Notes