Signboard Optical Character Recognitionby using the Matlab’s built-in OCR function on the cropped...
6
1 Abstract—A text recognition scheme specifically for signboard recognition is presented. The scheme increases the recognition success rate of traditional OCR by combining traditional OCR with SIFT feature matching. Prior to performing the recognition, both MSER and Multi-Scale Morphology segmentation techniques are used in conjunction to increase the chance of correctly determining the text bounding box. The scheme achieves a success rate of 86% with 113 randomly selected testing image. I. INTRODUCTION PTICAL Character Recognition (OCR) has been discussed greatly and has had good success in recent years such as in license plate identification [1] and text documents [2]. However, OCR in natural settings is still very challenging due to the numerous variables that exist, such as wide range of text font, size, lighting, obstruction, tilt, angle, and nearby clutter noise [12]. In this project, we focus on a specific case of the latter by creating an OCR algorithm for signboards of stores. We will refer to this algorithm as Signboard OCR (SOCR). Not only is this idea interesting, it is also useful. The vision is that SOCR can be used as part of a mobile app for business reviews and ratings companies such as Yelp. The end user can take a picture of any store’s signboard and the app will be able to output information regarding the store. SOCR works in three phases: Database Training, Text Segmentation, and Image Recognition. For the latter two phases, SOCR uses two segmentation techniques and two recognition techniques in order to obtain four different outputs. It then uses a set of tests to determine which (if any) of the four outputs to choose as the final output. The subsequent discussion will be organized as follows. Section II presents an overview of the SOCR algorithm. We then go into details. Section III discusses database training (Phase 1); Section IV details text segmentation (Phase 2). Section V finishes the algorithm by discussing image recognition (Phase 3). Section VI shows the final results. Section VII concludes the discussion with a brief summary. II. TOP-LEVEL ALGORITHM SOCR is split into three phases. Phase 1 is the Database Training Phase, which creates a database required by SIFT in Phase 3. This phase is only executed once at the beginning to initialize SOCR. Phase 2 is the Text Segmentation Phase, which crops out the image so that only the portion of the image with text is kept. There are two segmentation techniques: MSER and Multi-Scale Morphology. Phase 3 is the Recognition Phase, which uses the segmented image and converts the image into text. There are two recognition techniques SOCR uses: SIFT features matching and traditional OCR. The exact algorithm is as follows. Signboard Optical Character Recognition Isaac Wu and Hsiao-Chen Chang [email protected], [email protected] O trainDatabase() // Only run once at the start mserCroppedImg = mserSegment(img) siftMserMatches = performSift(mserCroppedImg) if (siftMserMatches > THRESH) return siftMserMatches morphCroppedImg = morphSegment(img) siftMorphMatches = performMorph(morphCroppedImg) if (siftMorphMatches > THRESH) return siftMorphMatches ocrMserMatches = performOcr(mserCroppedImg) if (ocrMserMatches is valid) return ocrMserMatches ocrMorphMatches = performOcr(morphCroppedImg) if (ocrMorphMatches is valid) return ocrMorphMatches Fig. 1. Phase 1: Database Training
Transcript of Signboard Optical Character Recognitionby using the Matlab’s built-in OCR function on the cropped...

1
Abstract—A text recognition scheme specifically for signboard
recognition is presented. The scheme increases the recognition
success rate of traditional OCR by combining traditional OCR
with SIFT feature matching. Prior to performing the recognition,
both MSER and Multi-Scale Morphology segmentation
techniques are used in conjunction to increase the chance of
correctly determining the text bounding box. The scheme achieves
a success rate of 86% with 113 randomly selected testing image.
I. INTRODUCTION
PTICAL Character Recognition (OCR) has been
discussed greatly and has had good success in recent years
such as in license plate identification [1] and text documents
[2]. However, OCR in natural settings is still very challenging
due to the numerous variables that exist, such as wide range of
text font, size, lighting, obstruction, tilt, angle, and nearby
clutter noise [12].
In this project, we focus on a specific case of the latter by
creating an OCR algorithm for signboards of stores. We will
refer to this algorithm as Signboard OCR (SOCR). Not only is
this idea interesting, it is also useful. The vision is that SOCR
can be used as part of a mobile app for business reviews and
ratings companies such as Yelp. The end user can take a picture
of any store’s signboard and the app will be able to output
information regarding the store.
SOCR works in three phases: Database Training, Text
Segmentation, and Image Recognition. For the latter two
phases, SOCR uses two segmentation techniques and two
recognition techniques in order to obtain four different outputs.
It then uses a set of tests to determine which (if any) of the four
outputs to choose as the final output.
The subsequent discussion will be organized as follows.
Section II presents an overview of the SOCR algorithm. We
then go into details. Section III discusses database training
(Phase 1); Section IV details text segmentation (Phase 2).
Section V finishes the algorithm by discussing image
recognition (Phase 3). Section VI shows the final results.
Section VII concludes the discussion with a brief summary.
II. TOP-LEVEL ALGORITHM
SOCR is split into three phases. Phase 1 is the Database
Training Phase, which creates a database required by SIFT in
Phase 3. This phase is only executed once at the beginning to
initialize SOCR. Phase 2 is the Text Segmentation Phase, which
crops out the image so that only the portion of the image with
text is kept. There are two segmentation techniques: MSER and
Multi-Scale Morphology. Phase 3 is the Recognition Phase,
which uses the segmented image and converts the image into
text. There are two recognition techniques SOCR uses: SIFT
features matching and traditional OCR. The exact algorithm is
as follows.
Signboard Optical Character Recognition
Isaac Wu and Hsiao-Chen Chang
[email protected], [email protected]
O
trainDatabase() // Only run once at the start
mserCroppedImg = mserSegment(img)
siftMserMatches = performSift(mserCroppedImg)
if (siftMserMatches > THRESH)
return siftMserMatches
morphCroppedImg = morphSegment(img)
siftMorphMatches = performMorph(morphCroppedImg)
if (siftMorphMatches > THRESH)
return siftMorphMatches
ocrMserMatches = performOcr(mserCroppedImg)
if (ocrMserMatches is valid)
return ocrMserMatches
ocrMorphMatches = performOcr(morphCroppedImg)
if (ocrMorphMatches is valid)
return ocrMorphMatches
return null
Fig. 1. Phase 1: Database Training

2
The algorithm is written in such a way such that only the
functions that are needed are called. Once SOCR finds the
matches that meets its test criterion, the algorithm is short-
circuited and immediately returns the result. The testing
precedence in descending order is: SIFT-MSER, SIFT-
MORPH, OCR-MSER, OCR-MORPH. The precedence is
chosen such that the higher the success rate, the higher the
precedence. This is done in order to minimize the amount of
computation performed.
III. PHASE 1: DATABASE TRAINING
The flow for Phase 1 is shown in Fig. 1. SOCR first gathers
N manually segmented, well representative images. It then
extracts 128-dimension SIFT descriptors from all of these
images and constructs a Codebook using K-Means as in [5].
This Codebook will later be used in Phase 3 as part of the SIFT
matching algorithm for quickly selecting the top five database
image matches. K-Means is a clustering method that generates
K centroids from V vectors (where K << V). Using K-Means,
we generate K centroids that SOCR use as the K codes to form
the Codebook. In this work, we took K to be 3000.
After forming the Codebook, we take each descriptor for a
particular training image and see which code it quantizes to.
After quantizing every descriptor for the image, we form a
histogram. This process is performed on every training image
and the resulting N histograms are saved to a local file.
IV. PHASE 2: TEXT SEGMENTATION
Text Segmentation is necessary for both SIFT and traditional
OCR in Phase 3. SIFT will use the Codebook formed in Phase
1 to determine the top five database image matches, and the
Codes needs to be ideally formed only by descriptors that
describes the text. Also, traditional OCR is designed primarily
for documents and simply cannot tolerate background level
variations.
For Phase 2, two text segmentation techniques are used. Both
flows are shown in Fig. 2.
A. Maximally Stable Extremal Region (MSER)
Maximally Stable Extremal Regions denote a set of extremal
regions that are detected in a grayscale image [11]. An extremal
region is a connected region in an image with all pixel
intensities above (or below) a threshold. To be considered
maximally stable, the size of these extremal region needs to be
nearly constant when the intensity threshold is perturbed.
MSER can be used to detect texts in natural images because the
consistent color and high contrast of texts lead to stable
intensity profile [13].
To segment using the MSER technique, we first convert the
image into grayscale. Then, we obtain the MSER regions by
using the algorithm proposed in [8].
From [9, 10], common texts have the properties of having an
aspect ratio of less than 3, an eccentricity of less than 0.995, an
solidity of greater than 0.3, an extent between 0.2 and 0.9, and
an Euler number of greater than -0.4. We use this fact to remove
MSER regions that do not satisfy these conditions.
Next, we look at the stroke width of a region, i.e. the outer
curves and lines that delineates a character. We utilize the fact
that most texts has little stroke width variation to further
separate out the text regions from the non-text regions.
We then create a bounding box for each region that passes
the tests. These bounding box are likely to be individual letters.
The boxes are then expanded horizontally a little bit to have the
regions overlap. Overlapping bounding boxes are then merged
to form a single bounding box. Finally, the horizontally longest
Fig. 2. Phase 2: Text Segmentation

3
bounding box is returned as the final output since signboard
texts are likely to be long in the horizontal direction.
B. Multi-Scale Morphology
The “Multi-Scale” in Multi-Scale Morphology refers to
morphology being performed by iterating through multiple
assumptions of text size during the algorithm process.
For Multi-Scale Morphology, the first step is to perform
thresholding. SOCR does that by first converting the image into
grayscale. Then, we increase the contrast of the grayscale
image. This step is necessary in order to prevent background
adjacent to the text to be thresholded into the foreground.
Afterwards, we apply adaptive thresholding using 40x40 square
regions.
Now, we try to segment out the text using morphology. First,
we try a large scale and arbitrarily select the white region to be
the foreground text. We perform morphological opening and
small region removal, with “small” being determined by the
scale at which we are at.
Then, the regions are labeled and we perform a set of
heuristic tests shown in Table I to remove the background
regions. The exact parameters are determined by conducting
experiments and selecting for highest success rate.
TABLE I: HEURISTIC TESTS
Test Description
1 The aspect ratio of letters are somewhat close to 1.
2 A letter has to be close horizontally to other letters.
3
A letter cannot take up too much space compared
to the entire image.
4 Letters are probably of similar height.
5
Letters are probably located at similar y-coordinate
region.
After the tests are conducted, we count to see how many
regions are left. If the number of regions is above a certain
threshold, we conclude that we have found the text and we
return the bounding box containing the regions. However, if the
number of regions is below a certain threshold, we conclude
that either we incorrectly guessed the foreground text to be
white or that the scale in which we ran at is too large and
therefore removed the text region during the small region
removal step. Thus, the process is repeated by now assuming
the text to be black. If the number of region at the end is still
below threshold, we repeat the entire process by lowering the
scale. The entire algorithm is summarized below.
V. PHASE 3: IMAGE RECOGNITION
For Phase 3, two recognition techniques are used. Both flows
are shown in Fig. 3.
A. SIFT Feature Matching
The first step in SIFT Feature Matching is to extract the SIFT
descriptors of the cropped testing image. We then quantize each
descriptor to a particular code in the K-Means Codebook.
Similar to Phase 1, we form a histogram of the cropped testing
image. This histogram is then compared with the histograms of
the training images, with the top five most similar training
images selected to perform pairwise SIFT Feature Matching.
This histogram comparison to narrow down to five potential
training images to pairwise compare greatly improves runtime
as SIFT Feature Matching is very slow.
Using VLFEAT’s vl_ubcmatch function, SOCR performs a
pairwise SIFT Feature Matching between the cropped test
image and the selected training image [6]. The feature matches
are then run through RANSAC with homography model for
1000 iterations. The character string that represents the training
image with the highest number of matches is returned as output.
img = grayscale(img)
img = increaseContrast(img)
img = adaptiveThresh(img)
for scale in largeToSmallScales
for isTextWhite in [true false] {
imgTest = isTextWhite ? img : ~img
imgTest = morphOpen(imgTest)
imgTest = smallRegionRemoval(imgTest, scale)
regions = regionLabeling(imgTest)
regions = passTests(regions)
if (len(regions) > threshold)
return boundingBox(regions)
}
}
Fig. 3. Phase 3: Recognition
4
B. Traditional OCR Text Recognition
SOCR also performs traditional OCR used for text scanning
by using the Matlab’s built-in OCR function on the cropped
testing image, but taking care to restrict the OCR function to
match only to English letters. We then post-process the OCR
output by removing short length words and removing spaces.
VI. MEASUREMENT RESULTS
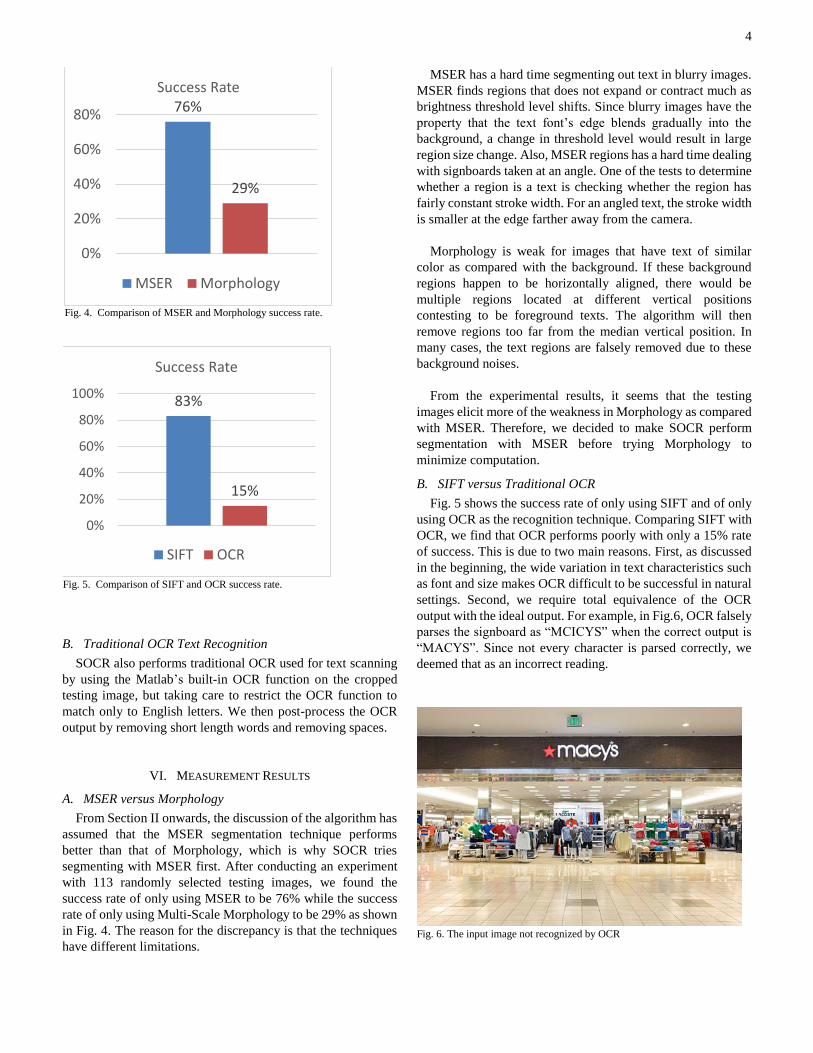
A. MSER versus Morphology
From Section II onwards, the discussion of the algorithm has
assumed that the MSER segmentation technique performs
better than that of Morphology, which is why SOCR tries
segmenting with MSER first. After conducting an experiment
with 113 randomly selected testing images, we found the
success rate of only using MSER to be 76% while the success
rate of only using Multi-Scale Morphology to be 29% as shown
in Fig. 4. The reason for the discrepancy is that the techniques
have different limitations.
MSER has a hard time segmenting out text in blurry images.
MSER finds regions that does not expand or contract much as
brightness threshold level shifts. Since blurry images have the
property that the text font’s edge blends gradually into the
background, a change in threshold level would result in large
region size change. Also, MSER regions has a hard time dealing
with signboards taken at an angle. One of the tests to determine
whether a region is a text is checking whether the region has
fairly constant stroke width. For an angled text, the stroke width
is smaller at the edge farther away from the camera.
Morphology is weak for images that have text of similar
color as compared with the background. If these background
regions happen to be horizontally aligned, there would be
multiple regions located at different vertical positions
contesting to be foreground texts. The algorithm will then
remove regions too far from the median vertical position. In
many cases, the text regions are falsely removed due to these
background noises.
From the experimental results, it seems that the testing
images elicit more of the weakness in Morphology as compared
with MSER. Therefore, we decided to make SOCR perform
segmentation with MSER before trying Morphology to
minimize computation.
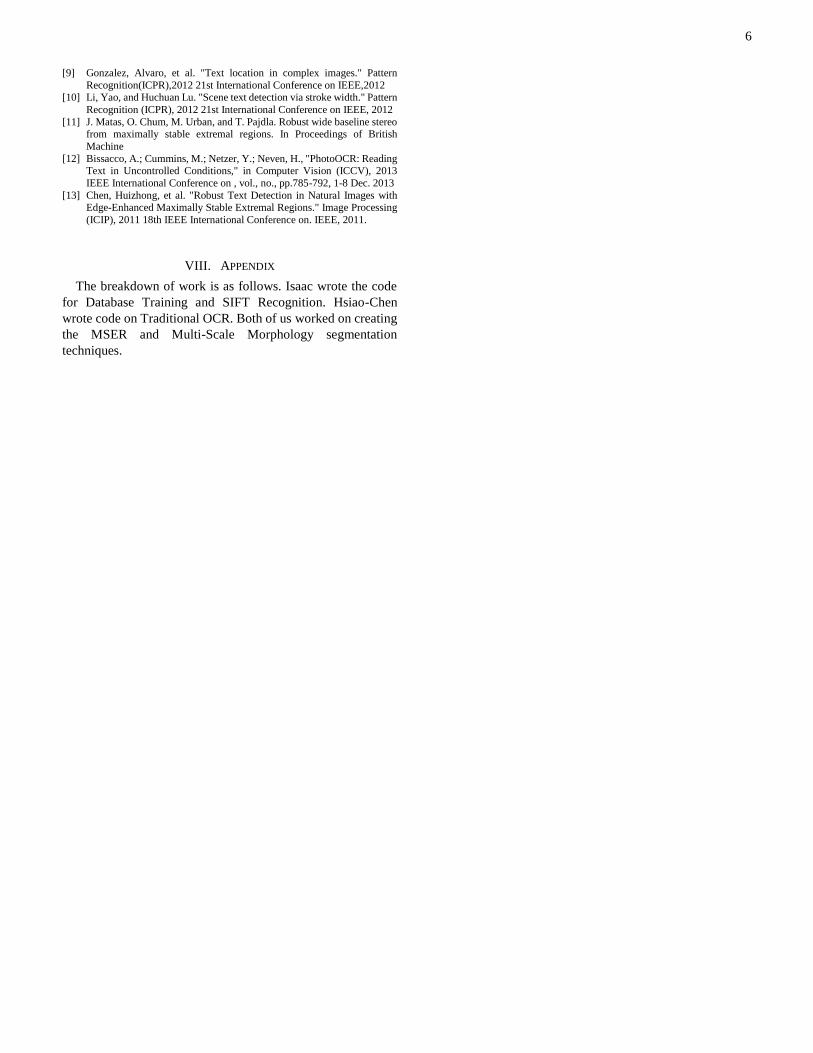
B. SIFT versus Traditional OCR
Fig. 5 shows the success rate of only using SIFT and of only
using OCR as the recognition technique. Comparing SIFT with
OCR, we find that OCR performs poorly with only a 15% rate
of success. This is due to two main reasons. First, as discussed
in the beginning, the wide variation in text characteristics such
as font and size makes OCR difficult to be successful in natural
settings. Second, we require total equivalence of the OCR
output with the ideal output. For example, in Fig.6, OCR falsely
parses the signboard as “MCICYS” when the correct output is
“MACYS”. Since not every character is parsed correctly, we
deemed that as an incorrect reading.
Fig. 4. Comparison of MSER and Morphology success rate.
76%
29%
0%
20%
40%
60%
80%
Success Rate
MSER Morphology
Fig. 5. Comparison of SIFT and OCR success rate.
83%
15%
0%
20%
40%
60%
80%
100%
Success Rate
SIFT OCR
Fig. 6. The input image not recognized by OCR

5
C. Final Results
Combining both MSER and Morphology, SOCR achieves a
success rate of 86% with the same 113 randomly selected
testing images as shown in Fig. 7. This is a 10% improvement
as compared with only relying on MSER.
Fig. 8, Fig. 9, Fig. 10 shows signboard correctly parsed by
MSER-SIFT, Morphology-SIFT, MSER-OCR, respectively.
Fig. 8 is hard to be segmented correctly by Morphology due
to the numerous horizontally nearby black regions below the
black “CHANEL” text.
Fig. 9 failed under MSER because of the angle of the
“STARBUCKS COFFEE” text, resulting in letters with non-
constant stroke width.
Fig. 10 with the signboard text of “sunglass hut” failed with
SIFT even after correct segmentation but is successfully
deciphered using OCR.
VII. CONCLUSION
Natural OCR has always been a hard problem to approach.
By narrowing the focus to only signboard text, SIFT image
matching technique can be combined with traditional OCR to
improve the success rate. Before performing recognition on
images, preprocessing the image by finding the bounding box
containing the text is necessary. In this work, we combined
MSER with Multi-Scale Morphology to improve the chance of
correctly finding the bounding box.
We want to acknowledge Matt Yu, Andre Araujo, and the
rest of the teaching staff for mentoring us through the project.
REFERENCES
[1] Wanniarachchi, W.; Sonnadara, D.U.J.; Jayananda, M.K., "License plate
identification based on image processing techniques," in Industrial and Information Systems, 2007. ICIIS 2007. International Conference on ,
vol., no., pp.373-378, 9-11 Aug. 2007
[2] Amin, A.; Wu, S., "Robust skew detection in mixed text/graphics documents," in Document Analysis and Recognition, 2005. Proceedings.
Eighth International Conference on , vol., no., pp.247-251 Vol. 1, 29
Aug.-1 Sept. 2005
[3] Nister, D.; Stewenius, H., "Scalable Recognition with a Vocabulary
Tree," in Computer Vision and Pattern Recognition, 2006 IEEE Computer Society Conference on , vol.2, no., pp.2161-2168, 2006
[4] Liu, F, “Fast and Robust Realtime Storefront Logo Recognition,” in
EE368, Spring 2013/14 [5] Sivic, J.; Zisserman, A., "Video Google: a text retrieval approach to object
matching in videos," in Computer Vision, 2003. Proceedings. Ninth IEEE
International Conference on , vol., no., pp.1470-1477 vol.2, 13-16 Oct. 2003
[6] VLFEAT, Available: http:// http://www.vlfeat.org/
[7] Mathworks, “Automatically Detect and Recognize Text in Natural Images”, 2015
[8] Nister, D., and H. Stewenius, "Linear Time Maximally Stable Extremal
Regions", Lecture Notes in Computer Science. 10th European Conference on Computer Vision, Marseille, France: 2008, no. 5303, pp. 183–196.
Fig. 7. Techniques used to determine the correct output.
89.7%
7.2%3.1%
Techniques Used
MSER x SIFT
MORPH x SIFT
MSER x OCR
MORPH xOCR
Fig. 9. Image correctly segmented by Morphology.
Fig. 10. Image correctly recognized by OCR.
Fig. 8. Image correctly segmented by MSER.
6
[9] Gonzalez, Alvaro, et al. "Text location in complex images." Pattern
Recognition(ICPR),2012 21st International Conference on IEEE,2012 [10] Li, Yao, and Huchuan Lu. "Scene text detection via stroke width." Pattern
Recognition (ICPR), 2012 21st International Conference on IEEE, 2012
[11] J. Matas, O. Chum, M. Urban, and T. Pajdla. Robust wide baseline stereo from maximally stable extremal regions. In Proceedings of British
Machine
[12] Bissacco, A.; Cummins, M.; Netzer, Y.; Neven, H., "PhotoOCR: Reading Text in Uncontrolled Conditions," in Computer Vision (ICCV), 2013
IEEE International Conference on , vol., no., pp.785-792, 1-8 Dec. 2013
[13] Chen, Huizhong, et al. "Robust Text Detection in Natural Images with Edge-Enhanced Maximally Stable Extremal Regions." Image Processing
(ICIP), 2011 18th IEEE International Conference on. IEEE, 2011.
VIII. APPENDIX
The breakdown of work is as follows. Isaac wrote the code
for Database Training and SIFT Recognition. Hsiao-Chen
wrote code on Traditional OCR. Both of us worked on creating
the MSER and Multi-Scale Morphology segmentation
techniques.