Signatures of Selection at Drug Resistance Loci in … · 2018-02-15 · known drug resistance loci...
16
Signatures of Selection at Drug Resistance Loci in Mycobacterium tuberculosis Tatum D. Mortimer, a,b Alexandra M. Weber, a,b Caitlin S. Pepperell a,b a Division of Infectious Diseases, Department of Medicine, University of Wisconsin—Madison, Madison, Wisconsin, USA b Department of Medical Microbiology and Immunology, University of Wisconsin—Madison, Madison, Wisconsin, USA ABSTRACT Tuberculosis (TB) is the leading cause of death by an infectious disease, and global TB control efforts are increasingly threatened by drug resistance in Myco- bacterium tuberculosis. Unlike most bacteria, where lateral gene transfer is an impor- tant mechanism of resistance acquisition, resistant M. tuberculosis arises solely by de novo chromosomal mutation. Using whole-genome sequencing data from two natu- ral populations of M. tuberculosis, we characterized the population genetics of known drug resistance loci using measures of diversity, population differentiation, and convergent evolution. We found resistant subpopulations to be less diverse than susceptible subpopulations, consistent with ongoing transmission of resistant M. tuberculosis. A subset of resistance genes (“sloppy targets”) were characterized by high diversity and multiple rare variants; we posit that a large genetic target for re- sistance and relaxation of purifying selection contribute to high diversity at these loci. For “tight targets” of selection, the path to resistance appeared narrower, evi- denced by single favored mutations that arose numerous times in the phylogeny and segregated at markedly different frequencies in resistant and susceptible sub- populations. These results suggest that diverse genetic architectures underlie drug resistance in M. tuberculosis and that combined approaches are needed to identify causal mutations. Extrapolating from patterns observed for well-characterized genes, we identified novel candidate variants involved in resistance. The ap- proach outlined here can be extended to identify resistance variants for new drugs, to investigate the genetic architecture of resistance, and when phenotypic data are available, to find candidate genetic loci underlying other positively se- lected traits in clonal bacteria. IMPORTANCE Mycobacterium tuberculosis, the causative agent of tuberculosis (TB), is a significant burden on global health. Antibiotic treatment imposes strong selective pressure on M. tuberculosis populations. Identifying the mutations that cause drug resistance in M. tuberculosis is important for guiding TB treatment and halting the spread of drug resistance. Whole-genome sequencing (WGS) of M. tuberculosis iso- lates can be used to identify novel mutations mediating drug resistance and to pre- dict resistance patterns faster than traditional methods of drug susceptibility testing. We have used WGS from natural populations of drug-resistant M. tuberculosis to characterize effects of selection for advantageous mutations on patterns of diversity at genes involved in drug resistance. The methods developed here can be used to identify novel advantageous mutations, including new resistance loci, in M. tubercu- losis and other clonal pathogens. KEYWORDS Mycobacterium tuberculosis, antibiotic resistance, evolution, genomics, positive selection Received 18 August 2017 Accepted 8 January 2018 Published 30 January 2018 Citation Mortimer TD, Weber AM, Pepperell CS. 2018. Signatures of selection at drug resistance loci in Mycobacterium tuberculosis. mSystems 3:e00108-17. https://doi.org/10 .1128/mSystems.00108-17. Editor Jack A. Gilbert, University of Chicago Copyright © 2018 Mortimer et al. This is an open-access article distributed under the terms of the Creative Commons Attribution 4.0 International license. Address correspondence to Caitlin S. Pepperell, [email protected]. RESEARCH ARTICLE Ecological and Evolutionary Science crossm January/February 2018 Volume 3 Issue 1 e00108-17 msystems.asm.org 1
-
Upload
vuongduong -
Category
Documents
-
view
212 -
download
0
Transcript of Signatures of Selection at Drug Resistance Loci in … · 2018-02-15 · known drug resistance loci...
Signatures of Selection at Drug Resistance Loci inMycobacterium tuberculosis
Tatum D. Mortimer,a,b Alexandra M. Weber,a,b Caitlin S. Pepperella,b
aDivision of Infectious Diseases, Department of Medicine, University of Wisconsin—Madison, Madison,Wisconsin, USA
bDepartment of Medical Microbiology and Immunology, University of Wisconsin—Madison, Madison,Wisconsin, USA
ABSTRACT Tuberculosis (TB) is the leading cause of death by an infectious disease,and global TB control efforts are increasingly threatened by drug resistance in Myco-bacterium tuberculosis. Unlike most bacteria, where lateral gene transfer is an impor-tant mechanism of resistance acquisition, resistant M. tuberculosis arises solely by denovo chromosomal mutation. Using whole-genome sequencing data from two natu-ral populations of M. tuberculosis, we characterized the population genetics ofknown drug resistance loci using measures of diversity, population differentiation,and convergent evolution. We found resistant subpopulations to be less diversethan susceptible subpopulations, consistent with ongoing transmission of resistantM. tuberculosis. A subset of resistance genes (“sloppy targets”) were characterized byhigh diversity and multiple rare variants; we posit that a large genetic target for re-sistance and relaxation of purifying selection contribute to high diversity at theseloci. For “tight targets” of selection, the path to resistance appeared narrower, evi-denced by single favored mutations that arose numerous times in the phylogenyand segregated at markedly different frequencies in resistant and susceptible sub-populations. These results suggest that diverse genetic architectures underlie drugresistance in M. tuberculosis and that combined approaches are needed to identifycausal mutations. Extrapolating from patterns observed for well-characterizedgenes, we identified novel candidate variants involved in resistance. The ap-proach outlined here can be extended to identify resistance variants for newdrugs, to investigate the genetic architecture of resistance, and when phenotypicdata are available, to find candidate genetic loci underlying other positively se-lected traits in clonal bacteria.
IMPORTANCE Mycobacterium tuberculosis, the causative agent of tuberculosis (TB), isa significant burden on global health. Antibiotic treatment imposes strong selectivepressure on M. tuberculosis populations. Identifying the mutations that cause drugresistance in M. tuberculosis is important for guiding TB treatment and halting thespread of drug resistance. Whole-genome sequencing (WGS) of M. tuberculosis iso-lates can be used to identify novel mutations mediating drug resistance and to pre-dict resistance patterns faster than traditional methods of drug susceptibility testing.We have used WGS from natural populations of drug-resistant M. tuberculosis tocharacterize effects of selection for advantageous mutations on patterns of diversityat genes involved in drug resistance. The methods developed here can be used toidentify novel advantageous mutations, including new resistance loci, in M. tubercu-losis and other clonal pathogens.
KEYWORDS Mycobacterium tuberculosis, antibiotic resistance, evolution, genomics,positive selection
Received 18 August 2017 Accepted 8January 2018 Published 30 January 2018
Citation Mortimer TD, Weber AM, PepperellCS. 2018. Signatures of selection at drugresistance loci in Mycobacterium tuberculosis.mSystems 3:e00108-17. https://doi.org/10.1128/mSystems.00108-17.
Editor Jack A. Gilbert, University of Chicago
Copyright © 2018 Mortimer et al. This is anopen-access article distributed under the termsof the Creative Commons Attribution 4.0International license.
Address correspondence to Caitlin S. Pepperell,[email protected].
RESEARCH ARTICLEEcological and Evolutionary Science
crossm
January/February 2018 Volume 3 Issue 1 e00108-17 msystems.asm.org 1

Mycobacterium tuberculosis, the causative agent of tuberculosis (TB), is estimated tohave caused 1.4 million deaths in 2015, making it the leading cause of death due
to an infectious disease. The proportion of TB due to multidrug-resistant (MDR) M.tuberculosis resistant to the first-line antituberculosis drugs isoniazid (INH) and rifampin(RIF) is increasing (1), which poses a major threat to global public health. Unlike mostbacteria, M. tuberculosis evolves clonally, so resistance cannot be transferred amongstrains or acquired from other species of bacteria: drug resistance in M. tuberculosisresults from de novo mutation within patients and transmission of drug-resistant clones(2–4). The relative contributions of de novo emergence and transmitted drug resistancevary across sampling locations (5–9). Another potential variable in the emergence ofdrug-resistant TB is M. tuberculosis’s lineage structure: seven distinct lineages have beenidentified among globally extant populations of M. tuberculosis. Of these lineages,lineage 2 (L2) has been associated with relatively high rates of drug resistance, and ithas been postulated that the acquisition of resistance is a result of higher rates ofmutation in this lineage (10). Studies of M. tuberculosis evolution within hosts with TBhave shown that the emergence of drug resistance is associated with clonal replace-ments that lead to reductions in genetic diversity of the bacterial population (11, 12).
Many of the methods developed to identify advantageous mutations, such as thoseconferring antibiotic resistance, depend on recombination to differentiate target locifrom neutral variants (13). However, in clonal organisms like M. tuberculosis, neutral anddeleterious mutations that are linked to advantageous variants will evolve in tandemwith them. This linkage among sites can also cause competition between geneticbackgrounds with beneficial mutations, decreasing the rate of fixation for beneficialalleles, while deleterious alleles are purged less efficiently (14–16).
While the majority of the M. tuberculosis genome is subject to purifying selection(i.e., selection against deleterious mutations) (3), antibiotic pressure exerts strongselection for advantageous variants that confer resistance. M. tuberculosis drug resis-tance has been the focus of extensive investigation, and a variety of resistancemutations have been characterized for commonly used antituberculosis drugs (17).Drug resistance mutations can be associated with fitness costs (18–20), and compen-satory mutations that ameliorate these fitness costs have been identified in the contextof rifampin resistance (21, 22). Resistance mutations found to have lower fitness costsin vitro—as measured by competition assays—are found at higher frequencies amongM. tuberculosis clinical isolates and appear to be transmitted at higher rates relative tomutations with high in vitro fitness costs (18, 23). Candidate loci involved in resistanceand compensation for its fitness effects have been identified previously by screeningfor homoplastic variants (i.e., mutations that emerge more than once in the phylogeny)that are significantly associated with drug-resistant phenotypes (24) and genes withhigher dN/dS (ratio of nonsynonymous mutations to synonymous mutations) in resis-tant compared to sensitive isolates (25). Application of these methods to whole-genome sequence data from M. tuberculosis clinical isolates has recovered known drugresistance loci, as well as loci associated with cell surface lipids and biosynthesis, DNAreplication, and metabolism.
The goal of the present study was to use patterns of genetic diversity at known drugresistance loci to identify the population genomic signatures of positive selection innatural populations of M. tuberculosis. Using whole-genome sequence data from twopopulations for which phenotypic resistance data were available, we have identifiedseveral distinct signatures associated with these loci under selection. On the basis ofthese results, we propose methods of identifying loci under positive selection, includ-ing novel drug resistance loci, in clonal bacteria such as M. tuberculosis.
RESULTS
We inferred the phylogeny of 1,161 M. tuberculosis isolates from Russia and SouthAfrica (see Materials and Methods and see Table S1 in the supplemental material) usingthe approximate maximum likelihood method implemented in FastTree 2 (Fig. 1). Themajority of the isolates belong to lineage 2 (L2) (n � 667) and L4 (n � 481). M.
Mortimer et al.
January/February 2018 Volume 3 Issue 1 e00108-17 msystems.asm.org 2

tuberculosis nucleotide diversity was similar to previous estimates from a globallydistributed sample (26). We identified lineage-specific patterns in overall diversity, withL4 having higher diversity than L2 (average number of pairwise differences of L2 [�L2],3.6 � 10�5, �L4, 1.5 � 10�4). Previously published analyses of whole-genome sequencedata from L2 indicate that the majority of L2 isolates worldwide belong to a sublineagethat has undergone relatively recent expansion (27, 28). In this sample from Russia andSouth Africa, the majority of L2 isolates belong to this sublineage, while the L4 isolatesare associated with deeper branching sublineages. This likely contributes to the ob-served differences in diversity.
The overall diversity of L2 was lower than that of L4 in our sample (Fig. 2, P � 2.2 �
FIG 1 Phylogeny of Mycobacterium tuberculosis sample. The phylogeny was inferred using FastTree (60).Lineages are colored as follows: lineage 1 (L1) is shown in pink, lineage 2 (L2) in blue, lineage 3 (L3) inpurple, and lineage 4 (L4) in red. Lineage 4 is associated with deeper branching sublineages incomparison with lineage 2. Bar, 5.0E�5 (5.0 � 10�5) nucleotide substitutions per position.
FIG 2 Distributions of gene-wise nucleotide diversity for all isolates, as well as lineages 4 and 2considered separately. Repetitive regions of the alignment were masked. Sites were included in estima-tion of � if 95% of isolates in the alignment had a valid nucleotide at the position. We used Egglib tocalculate statistics (64). The nucleotide diversity is lower in lineage 2 than in lineage 4 (P � 2.2 � 10�16
by Welch two-sample t test).
Selection at Drug Resistance Loci in M. tuberculosis
January/February 2018 Volume 3 Issue 1 e00108-17 msystems.asm.org 3

10�16). A total of 762 of the isolates in our sample (66%) are resistant to one or moreantituberculosis drugs (Table 1).
Drug-resistant TB can be acquired as a result of de novo mutations within a patientor by infection with a resistant strain. When resistance is primarily mediated by de novomutations, diversity should be similar in susceptible and resistant populations, asresistance will arise on multiple genetic backgrounds. In contrast, if resistance developsprimarily via transmission of resistant strains, the resistant subpopulation should be lessdiverse than the susceptible subpopulation. We compared the nucleotide diversity ofsusceptible and resistant subpopulations and found genome-wide estimates of nucle-otide diversity to be higher in isolates susceptible to a range of drugs for whichphenotyping data were available (P � 0.029 by paired t test). In comparisons ofgene-wise diversity in susceptible and resistant populations, we found that resistantisolates had a greater number of genes with no diversity, but levels of diversity withingenes in which it was measurable were similar between resistant and susceptiblepopulations (Fig. 3).
Of the 3,162 genes included in our analyses, 109 (3%) were invariant across allisolates in our sample. This is likely due to strong purifying selection on these genes. Anadditional 136 genes harbored variation in the drug-susceptible populations but wereinvariant across all of the drug-resistant populations. We did not observe the converse,i.e., genes that were invariant in susceptible isolates specifically, which supports theconclusion from genome-wide diversity estimates that resistant isolates represent asubset of the diversity found in susceptible populations and suggests that there may bepurifying selection that is specific to the setting of drug resistance. In order to evaluate
TABLE 1 Frequency of resistance in the data set
Druga
Frequency of the following characteristic in the data set:
Resistant Susceptible Unknown
INH 0.59 0.33 0.08STR 0.53 0.39 0.07RIF 0.50 0.43 0.07EMB 0.30 0.59 0.11PZA 0.21 0.67 0.12OFL 0.16 0.39 0.45PRO 0.15 0.22 0.62CAP 0.10 0.41 0.49MOX 0.09 0.41 0.49ETO 0.06 0.07 0.88AMI 0.05 0.34 0.61KAN 0.05 0.12 0.83aAMI, amikacin; CAP, capreomycin; EMB, ethambutol; ETO, ethionamide; INH, isoniazid; KAN, kanamycin;MOX, moxifloxacin; OFL, ofloxacin; PRO, prothionamide; PZA, pyrazinamide; RIF, rifampin; STR, streptomycin.
FIG 3 Diversity of resistant and susceptible isolates. (A) Counts of genes with no nucleotide diversity in resistant andsusceptible subpopulations. (B) Gene-wise nucleotide diversity (excluding invariant genes) in susceptible and resistant isolates.Among genes in which nucleotide diversity is measurable, it is similar between resistant and susceptible isolates even whendrug resistance-associated genes and targets of independent mutation identified by Farhat et al. (24) are removed (P � 0.13).Abbreviations: AMI, amikacin; CAP, capreomycin; EMB, ethambutol; ETO, ethionamide; INH, isoniazid; KAN, kanamycin; MOX,moxifloxacin; OFL, ofloxacin; PRO, prothionamide; PZA, pyrazinamide; RIF, rifampin; STR, streptomycin.
Mortimer et al.
January/February 2018 Volume 3 Issue 1 e00108-17 msystems.asm.org 4

whether the observed pattern was likely to arise by chance, we performed weightedrandom sampling of genes. The weighting was based on diversity in susceptiblepopulations, assuming that genes with low diversity in susceptible populations aremore likely to be invariant in resistant populations. After randomly sampling genes ineach drug-resistant population 1,000 times, we found that no samples containedshared genes among all resistant populations (first- and second-line drugs). Thissuggests that specific genes tend to lose diversity in the setting of drug resistance,which could result from purifying selection specific to this setting. A potentiallyimportant caveat is that in our data set, drug-resistant populations are not indepen-dent, and the same isolates are often resistant to multiple drugs. Since resistance tosecond-line drugs frequently arises on genetic backgrounds already resistant to one ormore first-line drugs, we repeated the sampling with only first-line drugs and foundthat the maximum number of sampled genes shared across all populations was 2(median, 0). Overall, these results suggest that certain genes are more likely to losediversity as drug resistance evolves, but we cannot completely rule out the possibilitythat the pattern arose as a result of overlapping membership in resistant populations.
We compared the diversity of drug resistance-associated genes (Table 2) with therest of the genome using two measures of diversity: average number of pairwisedifferences (�) and number of segregating sites (�). We found the resistance genes gid,rpsL, and pncA to be in the top fifth percentile of gene-wise � and/or � values. rrs andethA are in the top fifth percentile of �, but not �. Surprisingly, despite katG being atarget of multiple drug resistance mutations (Table 2), we did not identify extremelevels of diversity in katG (80th and 82nd percentiles of � and �, respectively).
We also examined gene-wise diversity values within each lineage to look forlineage-specific high-diversity genes. In both L2 and L4, gid, rpsL, pncA, ethA, and thyAwere in the top fifth percentile of diversity (� and/or �). In L2, rpoB, embB, Rv1772, andfolC were additionally in the top fifth percentile of gene-wise � and/or � values. In L4,Rv0340 was in the top fifth percentile of gene-wise � and/or �. While rpoB and embBwere not in the top 5th percentile of gene-wise � in L4, they still had high diversity (91stand 82nd percentiles, respectively). The lineage-specific differences in diversity ofRv1772, folC, and Rv0340 suggest that there are interactions between these loci and locithat differentiate L2 and L4.
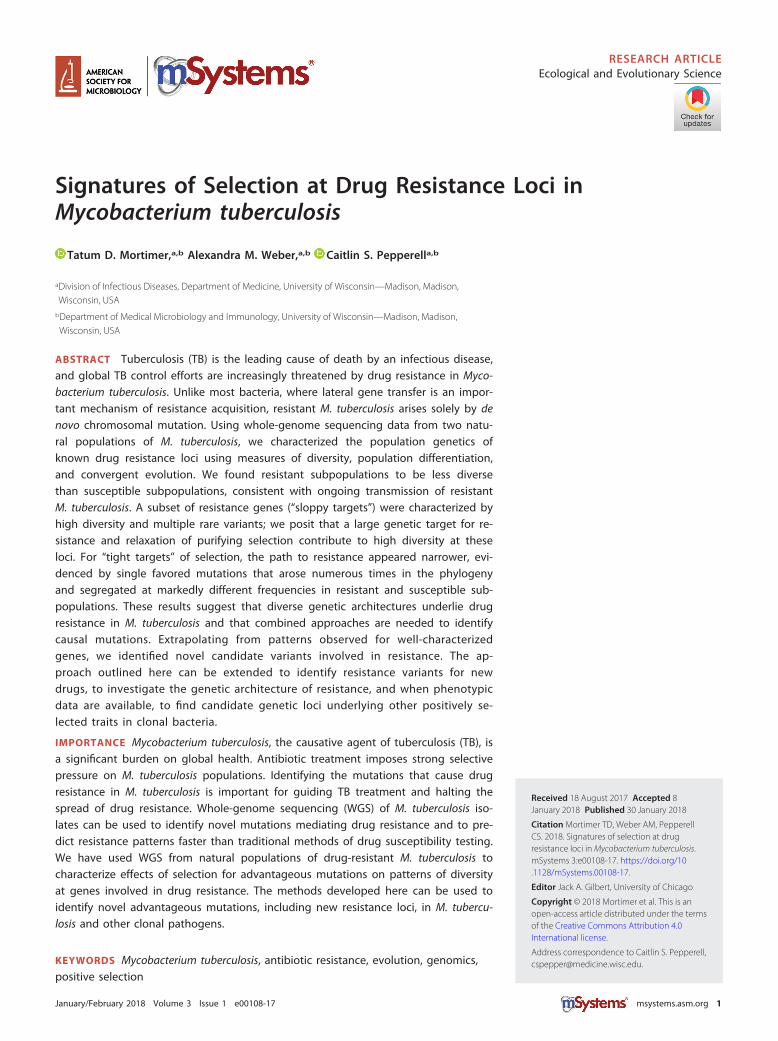
We used gene-wise estimates of Tajima’s D values to investigate gene-specific skewsin the site frequency spectrum that could result from selection, where negative valuesindicate an excess of rare variants and positive values indicate an excess of interme-diate frequency variants. We previously identified a relationship between gene lengthand gene-wise estimates of Tajima’s D values for M. tuberculosis (26), and this findingwas corroborated here (R2 � 0.3 after log2 transformation). In order to identify geneswith extreme values of Tajima’s D values— out of proportion with their length—weperformed linear regression on log2-transformed gene lengths and Tajima’s D valuesand identified genes with the largest residuals (Fig. 4). pncA, ethA, and embC all hadTajima’s D values lower than expected based on their length (fifth percentile of residualvalues). This indicates that these genes contain an excess of rare variants compared toother genes in the genome. Excess rare variants can result from a population expan-sion, a selective sweep, or purifying selection.
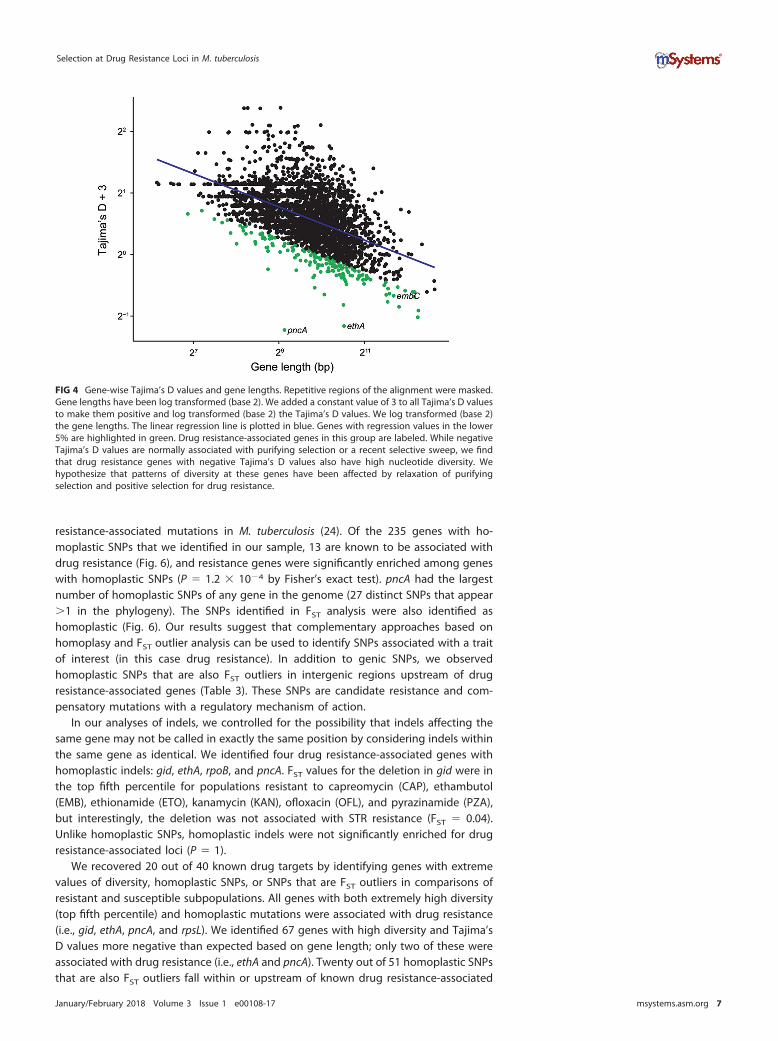
We calculated the ratio of � and � of resistance-associated genes in isolatessusceptible and resistant to first-line drugs and identified genes with markedly differentdiversities in resistant and susceptible subpopulations (Fig. 5A). Among resistancegenes in the top fifth percentile of gene-wise � and � overall, diversity of pncA and ethAis relatively high among resistant isolates, whereas diversity of gid is similar in resistantand susceptible populations. We also examined differences in this ratio betweenisolates in L2 and L4 (Fig. 5B). Rv1772 and embR were more diverse in resistant isolatesin L2, and kasA and tlyA were more diverse in resistant isolates in L4.
We used fixation index (FST) outlier analysis to identify single nucleotide polymor-phisms (SNPs) and indels that exhibited extreme differences in frequency betweensusceptible and resistant populations. Our a priori expectation was that variants me-
Selection at Drug Resistance Loci in M. tuberculosis
January/February 2018 Volume 3 Issue 1 e00108-17 msystems.asm.org 5

diating resistance would be at markedly higher frequency in the drug-resistant sub-population and that drug targets would be enriched among genes harboring variantswith high FST. After removing SNPs in regions corresponding to indels and variants atsites missing data for greater than 5% of isolates, the highest FST SNPs in comparisonsof resistant and susceptible subpopulations to first-line drugs are in katG (2155168,FST � 0.89, INH), rpoB (761155, FST � 0.72, RIF), and rpsL (781687, FST � 0.37,streptomycin [STR]). These SNPs were also FST outliers in the lineage-specific analyses.We used a randomization procedure to assess the significance of observed FST valuesand found the maximum FST values after randomly assigning resistant and susceptibledesignations to be 0.023 for INH, 0.019 for RIF, and 0.018 for STR. In addition to SNPswithin known drug resistance-associated genes, we identified FST outliers in genes thatmay be novel targets for drug resistance (Table 3).
Homoplastic SNPs—i.e., SNPs that evolve more than once in a phylogeny—arecandidate loci under positive selection and have previously been used to identify
TABLE 2 Signatures of selection in known drug resistance genes
GeneLocus tag(Rv no.) Drug(s) TB Dreama �b �b TDc Homoplasyd FST
e Type(s)f
katG Rv1908c INH 226 0.80 0.82 0.34 Y Y TightpncA Rv2043c PZA 195 0.97 1.00 0.00 Y N SloppyembB Rv3795 EMB 117 0.77 0.89 0.08 Y Y HybridahpC Rv2428 INH 31 0.20 0.21 0.61 Y NtlyA Rv1694 CAP 28 0.37 0.89 0.06 N NembC Rv3793 EMB 28 0.59 0.74 0.01 N NembR Rv1267c EMB 25 0.46 0.49 0.28 N Nrrs Rvnr01 STR, KAN, CAP 24 0.89 1.00 0.08 N NethA Rv3854c ETO 23 0.72 1.00 0.00 Y Y (IG) Sloppy,
tight (IG)gid Rv3919c STR 22 1.00 1.00 0.07 Y N SloppygyrB Rv0005 MOX, OFL 15 0.58 0.91 0.00 Y NfabG1 Rv1483 INH, ETO 13 0.60 0.66 0.30 Y Y (IG) TightinhA Rv1484 INH, ETO 13 0.56 0.59 0.32 Y NrpsL Rv0682 STR 13 0.99 0.95 0.80 Y Y HybridgyrA Rv0006 MOX, OFL 12 0.81 0.94 0.10 Y Y TightembA Rv3794 EMB 11 0.77 0.38 0.79 N NkasA Rv2245 INH 7 0.73 0.18 0.86 N Nndh Rv1854c INH 5 0.57 0.52 0.28 N NiniA Rv0342 EMB, INH 4 0.64 0.33 0.56 N NRv0340 Rv0340 INH 3 0.89 0.88 0.57 N NiniB Rv0341 EMB, INH 3 0.07 0.07 0.79 N NfbpC Rv0129c INH 3 0.78 0.19 0.89 N NrmlD Rv3266c EMB 2 0.75 0.36 0.75 N NiniC Rv0343 EMB, INH 2 0.49 0.67 0.08 N NthyA Rv2764c PAS 2 0.84 0.94 0.28 N Nnat Rv3566c INH 2 0.76 0.55 0.63 N NaccD6 Rv2247 INH 1 0.90 0.63 0.90 N NfurA Rv1909c INH 1 0.80 0.63 0.62 N NRv1772 Rv1772 INH 1 0.50 0.35 0.54 N NfabD Rv2243 INH 1 0.26 0.28 0.54 N NfadE24 Rv3139 INH 1 0.36 0.58 0.12 N NrpoB Rv0667 RIF 1 0.82 0.92 0.18 Y Y HybridefpA Rv2846c INH 1 0.10 0.11 0.65 N NethR Rv3855 ETO 0.58 0.77 0.22 N NRv0678 Rv0678 BDQ 0.37 0.72 0.25 N Neis Rv2416c KAN 0.51 0.28 0.54 N NmshA Rv0486 ETO 0.86 0.48 0.87 N NrpsA Rv1630 PZA 0.88 0.62 0.84 N NfolC Rv2447c PAS 0.66 0.78 0.11 Y NrplC Rv0701 LZD 0.57 0.77 0.21 N NaThe number of distinct entries in the TB Drug Resistance Mutation Database for each gene is reported in the TB Dream column.b� and � are the percentiles for each diversity value, respectively.cTD is the percentile of the residual after linear regression of Tajima’s D values with gene length.dGenes with homoplastic SNPs are indicated with “Y” (for Yes) in the Homoplasy column. N, no.eIf a homoplastic SNP was also an FST outlier, it is indicated with a “Y” in the FST column. N, no.fGenes are classified as tight, sloppy, or hybrid targets of selection based on diversity, homoplasy, and FST results. (IG) indicates an intergenic SNP.
Mortimer et al.
January/February 2018 Volume 3 Issue 1 e00108-17 msystems.asm.org 6
resistance-associated mutations in M. tuberculosis (24). Of the 235 genes with ho-moplastic SNPs that we identified in our sample, 13 are known to be associated withdrug resistance (Fig. 6), and resistance genes were significantly enriched among geneswith homoplastic SNPs (P � 1.2 � 10�4 by Fisher’s exact test). pncA had the largestnumber of homoplastic SNPs of any gene in the genome (27 distinct SNPs that appear�1 in the phylogeny). The SNPs identified in FST analysis were also identified ashomoplastic (Fig. 6). Our results suggest that complementary approaches based onhomoplasy and FST outlier analysis can be used to identify SNPs associated with a traitof interest (in this case drug resistance). In addition to genic SNPs, we observedhomoplastic SNPs that are also FST outliers in intergenic regions upstream of drugresistance-associated genes (Table 3). These SNPs are candidate resistance and com-pensatory mutations with a regulatory mechanism of action.
In our analyses of indels, we controlled for the possibility that indels affecting thesame gene may not be called in exactly the same position by considering indels withinthe same gene as identical. We identified four drug resistance-associated genes withhomoplastic indels: gid, ethA, rpoB, and pncA. FST values for the deletion in gid were inthe top fifth percentile for populations resistant to capreomycin (CAP), ethambutol(EMB), ethionamide (ETO), kanamycin (KAN), ofloxacin (OFL), and pyrazinamide (PZA),but interestingly, the deletion was not associated with STR resistance (FST � 0.04).Unlike homoplastic SNPs, homoplastic indels were not significantly enriched for drugresistance-associated loci (P � 1).
We recovered 20 out of 40 known drug targets by identifying genes with extremevalues of diversity, homoplastic SNPs, or SNPs that are FST outliers in comparisons ofresistant and susceptible subpopulations. All genes with both extremely high diversity(top fifth percentile) and homoplastic mutations were associated with drug resistance(i.e., gid, ethA, pncA, and rpsL). We identified 67 genes with high diversity and Tajima’sD values more negative than expected based on gene length; only two of these wereassociated with drug resistance (i.e., ethA and pncA). Twenty out of 51 homoplastic SNPsthat are also FST outliers fall within or upstream of known drug resistance-associated
FIG 4 Gene-wise Tajima’s D values and gene lengths. Repetitive regions of the alignment were masked.Gene lengths have been log transformed (base 2). We added a constant value of 3 to all Tajima’s D valuesto make them positive and log transformed (base 2) the Tajima’s D values. We log transformed (base 2)the gene lengths. The linear regression line is plotted in blue. Genes with regression values in the lower5% are highlighted in green. Drug resistance-associated genes in this group are labeled. While negativeTajima’s D values are normally associated with purifying selection or a recent selective sweep, we findthat drug resistance genes with negative Tajima’s D values also have high nucleotide diversity. Wehypothesize that patterns of diversity at these genes have been affected by relaxation of purifyingselection and positive selection for drug resistance.
Selection at Drug Resistance Loci in M. tuberculosis
January/February 2018 Volume 3 Issue 1 e00108-17 msystems.asm.org 7
genes. The remaining SNPs may be false-positive results or novel drug resistancemutations.
DISCUSSION
Highly virulent bacterial pathogens such as M. tuberculosis, Yersinia pestis (29),Francisella tularensis (30), and Mycobacterium ulcerans (31) appear to evolve clonally, i.e.,with little to no evidence of lateral gene transfer. It is important to identify advanta-geous mutations in these and other organisms, as they are likely to be associated withphenotypes such as drug resistance, heightened transmissibility, or host adaptation.However, few methods are available for identifying loci under positive selection in thesetting of clonal evolution. We adopted an empirical approach to this problem andused natural population data to characterize patterns of diversity at loci known to beunder positive selection in M. tuberculosis.
In this analysis of clinical isolates from settings where drug resistance is endemic, wefound genome-wide diversity to be higher in susceptible M. tuberculosis subpopula-tions than in the subpopulations resistant to first- and second-line drugs (with theexception of populations resistant to prothionamide [PRO] and moxifloxacin [MOX]).The observation of higher diversity in drug-susceptible populations is consistent with
FIG 5 Ratios of nucleotide diversity in resistance-associated genes. Genes with zero diversity were transformed to1 � 10�16 before calculating ratios. Genes with ratios more extreme than 10�1.5 or 101.5 are all filled with thedeepest shade. Genes associated with resistance to each drug are outlined in black. (A) Ratio of nucleotide diversityin resistant and susceptible isolates. Green genes are more diverse in resistant isolates, which could be due todiversifying selection and/or relaxation of purifying selection. Purple genes are more diverse in susceptible isolates,likely due to increased purifying selection. White genes have similar diversities in resistant and susceptible isolates.(B) Comparison of ratios in lineage 2 and lineage 4. Teal genes are more diverse in resistant isolates of lineage 2,suggesting diversifying selection/relaxation of purifying selection specific to this lineage. Brown genes are morediverse in resistant isolates of lineage 4. White genes have similar diversities in lineages 2 and 4.
Mortimer et al.
January/February 2018 Volume 3 Issue 1 e00108-17 msystems.asm.org 8

a significant role for transmitted resistance in the propagation of drug-resistant M.tuberculosis. A recent study of extensively drug-resistant (XDR) M. tuberculosis infectionin South Africa concluded that XDR cases result primarily from transmission of resis-tance, rather than de novo evolution of resistance mutations during infection (9). Theprimary studies for the sequence data analyzed here also identified clusters of drug-resistant isolates (5, 6), suggesting that resistant isolates were being transmitted. Ourresults, along with these previously published observations, suggest that the fitness ofdrug-resistant isolates can be high enough to allow them to circulate in regions where
TABLE 3 Homoplastic FST outliers
Location Genea Type
wcFSTb value for the following drug:
Knownc LineageAMI CAP EMB ETO INH KAN MOX OFL PRO PZA RIF STR
1821 dnaN Intergenic 0.43 0.57 0.10 N All7570 gyrA Missense 0.33 0.11 0.46 0.66 0.29 0.18 Y All7572 gyrA Missense 0.06 Y All7581 gyrA Missense 0.07 Y All7582 gyrA Missense 0.35 0.22 Y All75233 icd2 Intergenic 0.05 N All94388 hycQ Synonymous 0.07 0.12 0.12 0.13 N All230170 Rv0194 Missense 0.12 0.05 0.12 0.13 N All332916 vapC25 Missense 0.10 0.09 0.20 N All761155 rpoB Missense 0.31 0.58 0.10 0.72 0.41 Y All761161 rpoB Missense 0.33 0.09 0.51 0.71 0.13 0.16 Y All764817 rpoC Missense 0.19 N All781687 rpsL Missense 0.10 0.32 0.15 0.37 Y All922004 Rv0830 Missense 0.30 0.12 0.43 0.10 0.21 N All1076880 Rv0965c Synonymous 0.12 0.12 0.13 N All1673425 fabG1 Intergenic 0.11 Y All1673432 fabG1 Intergenic 0.52 0.65 Y All1722228 pks5 Missense 0.08 0.28 0.07 0.17 0.26 N All2122395 lldD2 Synonymous 0.06 N All2155168 katG Missense 0.36 0.89 0.13 0.32 0.60 0.66 Y All2174216 Rv1922 Synonymous 0.08 N All2207525 Rv1958c Intergenic 0.09 N All2422824 Rv2161c Missense 0.30 0.43 0.57 0.10 N All2660319 mbtF Missense 0.06 N All2715369 Rv3413c Intergenic 0.17 0.09 0.28 0.30 0.13 N All2866647 lppA Synonymous 0.12 0.07 N All2867298 lppB Synonymous 0.13 N All2867347 lppB Synonymous 0.13 0.06 0.12 0.14 N All2867756 lppB Synonymous 0.14 N All3500149 Rv3134c Synonymous 0.11 N All3550789 Rv3183 Synonymous 0.12 0.13 N All3680932 lhr Synonymous 0.12 0.12 0.13 N All4001622 fadA6 Intergenic 0.11 N All4247429 embB Missense 0.25 0.45 0.23 0.05 0.11 0.31 0.21 0.20 Y All4247574 embB Synonymous 0.19 0.07 0.27 0.30 Y All4327480 ethA Intergenic 0.20 0.07 0.27 0.30 Y All764948 rpoC Missense 0.06 Y L24248003 embB Missense 0.16 Y L2698 dnaA Missense 0.10 N L460185 Rv0057 Missense 0.06 N L4761110 rpoB Missense 0.66 Y L4764822 rpoC Missense 0.06 Y L4781822 rpsL Missense 0.12 0.13 0.14 Y L42123145 lldD2 Missense 0.06 N L42372550 dop Missense 0.64 N L42715344 Rv2413c Intergenic 0.06 N L42986827 Rv2670c Missense 0.16 0.17 0.15 N L44247431 embB Missense 0.11 0.11 0.07 Y L44248003 embB Missense 0.06 Y L4aFor intergenic SNPs, the closest gene is listed.bWeir and Cockerham’s FST (wcFST) values in the top 1% of values genome-wide are reported for each drug.cWe identified mutations in genes previously associated with drug resistance (Y for Yes in the Known column) and novel putative resistance or compensatorymutations (N for Novel in the Known column).
Selection at Drug Resistance Loci in M. tuberculosis
January/February 2018 Volume 3 Issue 1 e00108-17 msystems.asm.org 9

drug-resistant M. tuberculosis is endemic. As discussed below, the fitness effects of M.tuberculosis drug resistance mutations appear to vary substantially; the finding oftransmitted resistance in this and other studies suggests that the fitness of isolatesharboring low-cost mutations is comparable to that of susceptible M. tuberculosis. Thepopulations in our study have a high burden of drug-resistant TB, and the role oftransmitted drug resistance may differ in other settings.
An alternative— but not mutually exclusive— explanation for the observation ofhigher diversity in susceptible populations is that drug-resistant M. tuberculosis is underdistinct evolutionary constraints that reduce average genome-wide levels of diversity.In support of this hypothesis, we identified a specific subset of genes that wereinvariant across drug-resistant populations. Interestingly, while average diversity waslower for resistant subpopulations, the gene-wise diversity distributions had heaviertails, indicating there were more genes with extreme levels of diversity.
We found the genetic architecture of resistance to vary among targets, andresistance-associated genes tended to fall within categories that we term “sloppy,”“tight,” and “hybrid” targets of selection (the latter has a combination of tight andsloppy features and applies to rpsL, embB, and rpoB). “Sloppy” resistance genes arecharacterized by high levels of diversity. Genes associated with PZA, EMB, ETO, and STRresistance (i.e., pncA, gid, rpsL, rrs, and ethA) have high levels of diversity; some also hadan excess of rare variants (pncA, ethA, and embC). The finding that these genesaccumulate multiple, individually rare mutations implies that there is a large target forresistance and/or compensatory mutations within the gene: that is, resistance can resultfrom multiple different variants acting individually or in concert.
In addition to its numerous rare mutations, pncA also contains the highest numberof homoplastic SNPs (27 SNPs emerged more than once in the phylogeny) of any genein the data set. Among the 62 nonsynonymous pncA mutations in our data set, 55 havebeen previously reported in association with drug resistance (TB Drug ResistanceMutation Database [32]). The newly described SNPs may mediate drug resistance orcompensation for the fitness effects of other variants. Relaxed purifying selection islikely to play a role in concert with selection for diverse advantageous resistancemutations in the accumulation of diversity in pncA and other sloppy targets. The factthat numerous mutations are segregating in a natural population suggests that alter-ations to these genes are generally associated with negligible fitness costs. An M.tuberculosis strain harboring a deletion in pncA conferring resistance to PZA wasestimated to be endemic in Quebec, Canada, by 1800, long before the use of PZA for
FIG 6 Homoplastic SNPs in drug resistance-associated genes. SNPs with FST in the top 1% of genome-wide values are labeled withthe population (associated drug resistance) and the FST value. pncA is remarkable for harboring diverse homoplastic mutations, eachof which occurs relatively infrequently (“sloppy target”). embB, gyrA, katG, rpoB, and rpsL harbor dominant mutations that occurfrequently in the phylogeny and are strongly associated with resistant populations (“tight targets”).
Mortimer et al.
January/February 2018 Volume 3 Issue 1 e00108-17 msystems.asm.org 10

the treatment of TB (33–35). This supports the idea that purifying selection on pncA isrelatively weak, which would contribute to its exceedingly high diversity and broadenthe adaptive paths to resistance.
In contrast to pncA, gid, which is associated with low-level STR resistance (36), doesnot appear to have the signatures of a “sloppy” target for resistance despite its highdiversity. We identified just three homoplastic SNPs within gid, and previous studieshave found that STR-resistant isolates do not carry the same gid mutations (37). Thiscould indicate that a multitude of mutations within gid confer resistance, but levels ofdiversity in the gene were similar in resistant and susceptible isolates. Previous studiesof sequence polymorphism in gid have identified high diversity in this gene in bothresistant and susceptible isolates (37–39): gid appears to be subject to relaxed purifyingselection in the presence and absence of antibiotic pressure. Since gid mutations conferlow-level resistance, it is also possible that misclassification of resistance phenotypescontributed to the lack of differentiation we and others have observed betweenputatively STR-resistant and -susceptible subpopulations. In addition, mutations in rpsL,which cause high-level resistance, could mask the contribution of gid to STR resistance.
We found some drug targets to be highly diverse in resistant subpopulations ofeither L2 or L4 (but not both), suggesting that resistance mutations in these genesinteract with the genetic background; the fitness effects of mutations in these genescould, for example, vary on different genetic backgrounds. Lineage-specific FST outliersare another category of candidate locus with lineage-dependent roles in drug resis-tance (Table 3). Epistatic interactions between drug resistance mutations and M.tuberculosis lineage have been reported previously: for example, specific mutations inthe inhA promoter have been associated with the L1 and M. africanum geneticbackgrounds (40, 41).
In contrast to “sloppy” targets, we discovered individual homoplastic SNPs associ-ated with drug-resistant subpopulations (i.e., with high FST) representing “tight” targetsof selection in genes conferring resistance to INH, RIF, and STR. Numerous resistancemutations have been reported for katG, rpoB, rpsL, embB, and gyrA, but we finddrug-resistant subpopulations to be defined by a specific subset of mutations in thesegenes. This suggests that certain mutations are strongly favored relative to othersconferring resistance to the same drugs when M. tuberculosis is in its natural environ-ment. Antibiotic resistance can impose fitness costs on M. tuberculosis during in vitrogrowth, with the range of fitness costs differing among mutations, even within thesame gene (18). Mutations can also have different fitness effects depending on thegenetic background, but the most fit mutants were the same across M. tuberculosislineages in a study of RIF resistance (18).
In our analyses, we found the dominant INH resistance mutation in katG to affect theserine at position 315. This change reduces affinity to INH but preserves catalase activity(42) and is associated with lower fitness costs than other katG mutations, both in vitroand in a mouse model (43, 44). This mutation was recently shown to precede mutationsconferring resistance to other drugs during accumulation of resistance in the evolutionof multidrug-resistant M. tuberculosis (45). The dominant mutations we identified inrpoB (codon 450) and rpsL (codon 43) have also been found to have lower fitness costsin vitro compared to other mutations conferring resistance to RIF and STR in thesegenes (18, 44, 46). These results suggest that many of the findings regarding therelative fitness costs of M. tuberculosis resistance mutations in vitro and in animalmodels are relevant to the pathogen’s natural environment.
The fitness effects of mutations in gyrA (codon 94) and embB (codon 306) have notbeen measured; on the basis of our homoplasy and FST results, we propose that theyhave lower fitness costs than other mutations in these genes and that they represent“tight” targets of selection. Mutations at gyrA codon 94 were previously found to be themost prevalent in a survey of gyrA and gyrB mutations in fluoroquinolone-resistant M.tuberculosis clinical isolates (47). Interestingly, the mutation in embB codon 306 hasbeen previously associated with acquisition of multiple resistances (48), and we findthat this position is an FST outlier for all first-line drugs in L4. This mutation is not an FST
Selection at Drug Resistance Loci in M. tuberculosis
January/February 2018 Volume 3 Issue 1 e00108-17 msystems.asm.org 11

outlier in L2 (i.e., top fifth percentile), with the percentiles for FST values ranging from0.07 to 0.68 for first-line drugs in this lineage. These observations suggest that thegenetic background affects interactions among resistance mutations and that embBcodon 306 is important for acquisition of multidrug resistance in L4, but not in L2.
We searched for indels with the signature of a “tight” target, i.e., homoplasticmutations segregating at markedly different frequencies in drug-susceptible and-resistant subpopulations. Unlike the pattern observed with SNPs, genes associatedwith drug resistance were not significantly enriched among the genes harboringhomoplastic indels. We identified one homoplastic indel that was also an FST outlier—adeletion in gid that causes a frameshift. Patterns of variation in gid are complex andsuggest a role for relaxation of purifying selection (i.e., in the accumulation of excessSNPs in both resistant and susceptible isolates) and perhaps a tight target associatedwith multiresistance (i.e., this homoplastic/FST outlier deletion that was associated withresistance to CAP, EMB, ETO, KAN, OFL, and PZA).
Our finding that, save for the frameshift mutation in gid, indels in resistance genesdo not have the signature of “tight” targets suggests that they are generally associatedwith higher fitness costs than SNPs. Fifteen drug targets have been found in transposonmutagenesis experiments to be essential for M. tuberculosis growth in vitro, includingrpoB and rpsL; deletions in these genes are likely to interrupt important functions (49).Deletions in nonessential genes could also have fitness costs. Deletions in katG, whichis nonessential, can result in INH resistance, but they are not observed as frequently inclinical isolates as the KatG S315 SNP is, particularly among transmitted INH-resistantstrains (23).
There are several limitations to our study. Resistance to multiple drugs was commonin our sample, and in some cases, it was difficult to identify patterns of diversity andpopulation differentiation that were specific to individual drugs. Our results are alsolimited by the accuracy with which drug resistance phenotypes were determined anda lack of phenotypic data for some drugs (particularly second-line drugs). Our samplewas heavily skewed to lineages 2 and 4, and the results are not necessarily applicableto other M. tuberculosis lineages. Finally, the data analyzed here were generated withshort sequencing read technologies, and we were thus limited to characterizingdiversity in regions of the M. tuberculosis genome that can be resolved with thesemethods: regions that were masked from analysis (e.g., due to sequence repeats) mayinclude unknown resistance targets. We also used an L4 genome (H37Rv) as a reference,and gene content specific to L2 may not have been identified.
We were not able to recover all drug resistance-associated genes using the analysesperformed here. This is likely a result of limited phenotypic data for some drugs andtheir associated targets (e.g., thyA and folC, which are associated with aminosalicylicacid [PAS] resistance). Our list of drug targets was dominated by genes associated withINH resistance, and signatures in genes that harbor rare resistance-associated allelesmay be subtle compared to the KatG S315 mutation found at high frequency indrug-resistant populations.
We identified 31 SNPs that are not on the list of known drug resistance genes, whichboth emerged more than once in the phylogeny (homoplasies) and were segregatingat markedly different frequencies in resistant and susceptible subpopulations (FST
outliers). These SNPs may be novel resistance determinants; notably, all nonsynony-mous SNPs within this group are in genes linked with drug resistance in other studies(i.e., they are in genes encoding efflux pumps, genes differentially regulated in resistantisolates or in response to the presence of drug, potential drug targets, or genes in thesame pathways as drug targets or resistance determinants) (50–54). In addition to adirect, previously unrecognized role in resistance, these SNPs could compensate forfitness costs of drug resistance. For example, we identified a homoplastic FST outlier inrpoC, and mutations in rpoC have been shown to compensate for RIF resistance inexperimental evolution studies (22).
Intriguingly, we found lipid metabolism genes to be enriched among genes har-boring homoplastic SNPs (P � 0.013). We have previously shown that these genes have
Mortimer et al.
January/February 2018 Volume 3 Issue 1 e00108-17 msystems.asm.org 12

extreme values of diversity in a global sample of M. tuberculosis isolates and withinindividual hosts (26), suggesting that lipid metabolism genes may also be underpositive selection in M. tuberculosis populations. The results presented here could beextended by phenotypic characterization of lipid profiles and identification of ho-moplastic variants that are at markedly different frequencies in isolates with distinctlipid profiles.
Here we have used drug resistance loci in M. tuberculosis to identify the signaturesof positive selection in a clonal bacterium. We found these loci to be associated withdistinct patterns of diversity that likely reflect differing genetic architectures underlyingthe traits under selection. The evolutionary path to resistance is broad for some drugswith “sloppy targets,” whereas for drugs with “tight targets,” the means of acquiringresistance appear more limited. This is likely due to fitness effects of resistancemutations in M. tuberculosis’s natural environment, as numerous resistance mutationshave been identified in tight target genes. We also found evidence suggesting thatthere are important interactions among loci during the evolution of resistance. Ourresults suggest that purifying selection on a subset of genes intensifies in the settingof resistance, which could reflect epistatic interactions and/or a response to themetabolic milieu imposed by antimycobacterial agents. The results presented here canbe used to create more realistic models of resistance evolution in M. tuberculosis and todevelop novel strategies of preventing or mitigating the acquisition of resistance. Forexample, the narrow path to resistance for drugs with tight targets reveals potentiallyexploitable vulnerabilities, as does the finding of interdependencies among specific lociand the genetic background in the evolution of resistance and multiresistance. As newTB drugs become available for clinical use, the approach outlined here can be extendedto investigate their architectures of resistance.
Efforts are under way to sequence and perform drug susceptibility testing onthousands of M. tuberculosis isolates with the goal of creating an exhaustive catalogueof drug resistance mutations and eventually using whole-genome sequencing (WGS) todiagnose drug resistance in clinical settings (CRyPTIC project, http://modmedmicro.nsms.ox.ac.uk/cryptic/, last accessed 24 May 2017). We found that loci under positiveselection can be identified using relatively simple methods: “tight” targets are highlydifferentiated in their allele frequencies across phenotypic groups (i.e., FST outliers) andappear as homoplasies on the phylogeny; “sloppy” targets are characterized by highdiversity and/or low Tajima’s D values, as well as homoplasies. Extrapolating frompatterns observed among known resistance variants, we have discovered new candi-date regulatory and genic resistance variants. The methods used in this study arewidely available and should scale to analysis of the large collections of genomic andphenotypic data that are currently being generated. This approach can be extended toidentify novel resistance loci in bacteria for which drug susceptibility phenotypes aredefined, as well as other positively selected loci in clonal bacterial populations.
MATERIALS AND METHODSReference guided assembly. We downloaded sequencing read data from two large surveys of
drug-resistant M. tuberculosis in Russia (5) and South Africa (6). We used FastQC (55) and TrimGalore! (56)for quality assessment and adaptor trimming of the reads. Trimmed reads were mapped to M. tubercu-losis H37Rv (accession no. NC_000962.3) using BWA-MEM v 0.7.12 (57). We used Samtools v 1.2 (58) andPicard Tools (https://broadinstitute.github.io/picard/) for sorting, format conversion, and addition of readgroup information. Variants were identified using Pilon v 1.16 (59). A detailed description of the referenceguided assembly pipeline is available at https://github.com/pepperell-lab/RGAPepPipe. We removedisolates with mean coverage less than 20�, isolates with percentage of the genome covered at 10� lessthan 90%, isolates where a majority of reads did not map to H37Rv, and isolates where greater than 10%of sites were unknown after mapping. The final data set contains 1,161 M. tuberculosis isolates (seeTable S1 in the supplemental material). The alignment was masked to remove repetitive regions,including proline-glutamate (PE)/proline-proline-glutamate (PPE) genes.
Phylogenetic analysis. We estimated the approximately maximum likelihood phylogeny using themasked alignment from reference guided assembly with FastTree 2.1.9 (60). We compiled FastTree usingthe double precision option to accurately estimate branch lengths of closely related isolates. We usedFigTree (http://tree.bio.ed.ac.uk/software/figtree/) for tree visualization.
SNP annotation. A VCF (variant call format) file of single nucleotide variants was created from themasked alignment using SNP-sites v 2.3.2 (61). Single nucleotide polymorphisms (SNPs) were annotated
Selection at Drug Resistance Loci in M. tuberculosis
January/February 2018 Volume 3 Issue 1 e00108-17 msystems.asm.org 13

using SnpEff v 4.1j (62) to identify synonymous, nonsynonymous, and intergenic SNPs based on theannotation of M. tuberculosis H37Rv.
Indel identification. Insertions and deletions were identified during variant calling with Pilon. Weused Emu (63) to normalize indels across multiple isolates. We used a presence/absence matrix for thenormalized indels for further analyses of indel diversity.
Population genetics statistics. Whole-genome and gene-wise diversity (� and �) and neutrality(Tajima’s D) statistics were calculated using Egglib v 2.1.10 (64) for whole-genome alignments andgene-wise alignments. Isolates were further divided by lineage and drug resistance phenotype. Sites withmissing data due to indels or low-quality base calls in more than 5% of isolates in the alignment werenot included in calculation of statistics. Tajima’s D values showed a correlation with gene length in oursample. To find genes with extreme values of Tajima’s D, we performed linear regression in R (65) onlog-transformed Tajima’s D values and gene length and identified genes with large residual values. Toidentify alleles with marked differences in frequency in resistant and susceptible isolates, Weir andCockerham’s FST (66) was calculated using populations of resistant and susceptible isolates for each drugusing vcflib v1.0.0-rc0-262-g50a3 (https://github.com/vcflib/vcflib). For nonbiallelic SNPs, we calculatedFST for the two most common variants.
Homoplasy. We used TreeTime (67) to perform ancestral reconstruction and place SNPs and indelsin the phylogeny. We identified homoplastic SNPs and indels as those arising multiple times in thephylogeny.
Data availability. Unless otherwise noted, all data and scripts associated with this study are availableat https://github.com/pepperell-lab/mtbDrugResistance.
SUPPLEMENTAL MATERIALSupplemental material for this article may be found at https://doi.org/10.1128/
mSystems.00108-17.TABLE S1, TXT file, 0.02 MB.
ACKNOWLEDGMENTSWe thank members of the Pepperell laboratory for their input on analyses and data
visualization.This material is based upon work supported by the National Science Foundation
Graduate Research Fellowship Program under grant DGE-1256259 to T.D.M. T.D.M. isalso supported by National Institutes of Health National Research Service award (T32GM07215). C.S.P. is supported by National Institutes of Health (R01AI113287). Fundingfor this project was provided by the University of Wisconsin School of Medicine andPublic Health from the Wisconsin Partnership Program.
Any opinions, findings, and conclusions or recommendations expressed in thismaterial are those of the authors and do not necessarily reflect the views of theNational Science Foundation or other funding agencies.
REFERENCES1. World Health Organization. 2016. Global tuberculosis report 2016. World
Health Organization, Geneva, Switzerland.2. Supply P, Warren RM, Bañuls A-L, Lesjean S, Van Der Spuy GD, Lewis L-A,
Tibayrenc M, Van Helden PD, Locht C. 2003. Linkage disequilibriumbetween minisatellite loci supports clonal evolution of Mycobacteriumtuberculosis in a high tuberculosis incidence area. Mol Microbiol 47:529 –538. https://doi.org/10.1046/j.1365-2958.2003.03315.x.
3. Pepperell CS, Casto AM, Kitchen A, Granka JM, Cornejo OE, Holmes EC,Birren B, Galagan J, Feldman MW. 2013. The role of selection in shapingdiversity of natural M. tuberculosis populations. PLoS Pathog9:e1003543. https://doi.org/10.1371/journal.ppat.1003543.
4. Eldholm V, Balloux F. 2016. Antimicrobial resistance in Mycobacteriumtuberculosis: the odd one out. Trends Microbiol 24:637– 648. https://doi.org/10.1016/j.tim.2016.03.007.
5. Casali N, Nikolayevskyy V, Balabanova Y, Harris SR, Ignatyeva O,Kontsevaya I, Corander J, Bryant J, Parkhill J, Nejentsev S, Horstmann RD,Brown T, Drobniewski F. 2014. Evolution and transmission of drug-resistant tuberculosis in a Russian population. Nat Genet 46:279 –286.https://doi.org/10.1038/ng.2878.
6. Cohen KA, Abeel T, Manson McGuire A, Desjardins CA, Munsamy V, SheaTP, Walker BJ, Bantubani N, Almeida DV, Alvarado L, Chapman SB,Mvelase NR, Duffy EY, Fitzgerald MG, Govender P, Gujja S, Hamilton S,Howarth C, Larimer JD, Maharaj K, Pearson MD, Priest ME, Zeng Q,Padayatchi N, Grosset J, Young SK, Wortman J, Mlisana KP, O’Donnell
MR, Birren BW, Bishai WR, Pym AS, Earl AM. 2015. Evolution of exten-sively drug-resistant tuberculosis over four decades: whole genomesequencing and dating analysis of Mycobacterium tuberculosis isolatesfrom KwaZulu-Natal. PLoS Med 12:e1001880. https://doi.org/10.1371/journal.pmed.1001880.
7. Coscolla M, Barry PM, Oeltmann JE, Koshinsky H, Shaw T, Cilnis M, PoseyJ, Rose J, Weber T, Fofanov VY, Gagneux S, Kato-Maeda M, Metcalfe JZ.2015. Genomic epidemiology of multidrug-resistant Mycobacterium tu-berculosis during transcontinental spread. J Infect Dis 212:302–310.https://doi.org/10.1093/infdis/jiv025.
8. Guerra-Assunção JA, Crampin AC, Houben R, Mzembe T, Mallard K, CollF, Khan P, Banda L, Chiwaya A, Pereira RPA, McNerney R, Fine PEM,Parkhill J, Clark TG, Glynn JR. 2015. Large-scale whole genome sequenc-ing of M. tuberculosis provides insights into transmission in a highprevalence area. eLife 4:e05166. https://doi.org/10.7554/eLife.05166.
9. Shah NS, Auld SC, Brust JCM, Mathema B, Ismail N, Moodley P, MlisanaK, Allana S, Campbell A, Mthiyane T, Morris N, Mpangase P, van derMeulen H, Omar SV, Brown TS, Narechania A, Shaskina E, Kapwata T,Kreiswirth B, Gandhi NR. 2017. Transmission of extensively drug-resistanttuberculosis in South Africa. N Engl J Med 376:243–253. https://doi.org/10.1056/NEJMoa1604544.
10. Ford CB, Shah RR, Maeda MK, Gagneux S, Murray MB, Cohen T, JohnstonJC, Gardy J, Lipsitch M, Fortune SM. 2013. Mycobacterium tuberculosismutation rate estimates from different lineages predict substantial dif-
Mortimer et al.
January/February 2018 Volume 3 Issue 1 e00108-17 msystems.asm.org 14

ferences in the emergence of drug-resistant tuberculosis. Nat Genet45:784 –790. https://doi.org/10.1038/ng.2656.
11. Eldholm V, Norheim G, von der Lippe B, Kinander W, Dahle UR, CaugantDA, Mannsåker T, Mengshoel AT, Dyrhol-Riise AM, Balloux F. 2014.Evolution of extensively drug-resistant Mycobacterium tuberculosisfrom a susceptible ancestor in a single patient. Genome Biol 15:490.https://doi.org/10.1186/s13059-014-0490-3.
12. Black PA, de Vos M, Louw GE, van der Merwe RG, Dippenaar A, StreicherEM, Abdallah AM, Sampson SL, Victor TC, Dolby T, Simpson JA, vanHelden PD, Warren RM, Pain A. 2015. Whole genome sequencing revealsgenomic heterogeneity and antibiotic purification in Mycobacteriumtuberculosis isolates. BMC Genomics 16:857. https://doi.org/10.1186/s12864-015-2067-2.
13. Vitti JJ, Grossman SR, Sabeti PC. 2013. Detecting natural selection ingenomic data. Annu Rev Genet 47:97–120. https://doi.org/10.1146/annurev-genet-111212-133526.
14. Hill WG, Robertson A. 1966. The effect of linkage on limits to artificialselection. Genet Res 8:269 –294. https://doi.org/10.1017/S0016672300010156.
15. Felsenstein J. 1974. The evolutionary advantage of recombination. Ge-netics 78:737–756.
16. Birky CW, Walsh JB. 1988. Effects of linkage on rates of molecularevolution. Proc Natl Acad Sci U S A 85:6414 – 6418. https://doi.org/10.1073/pnas.85.17.6414.
17. Almeida Da Silva PE, Palomino JC. 2011. Molecular basis and mecha-nisms of drug resistance in Mycobacterium tuberculosis: classical andnew drugs. J Antimicrob Chemother 66:1417–1430. https://doi.org/10.1093/jac/dkr173.
18. Gagneux S, Long CD, Small PM, Van T, Schoolnik GK, Bohannan BJM.2006. The competitive cost of antibiotic resistance in Mycobacteriumtuberculosis. Science 312:1944 –1946. https://doi.org/10.1126/science.1124410.
19. Böttger EC, Springer B. 2008. Tuberculosis: drug resistance, fitness, andstrategies for global control. Eur J Pediatr 167:141–148. https://doi.org/10.1007/s00431-007-0606-9.
20. Strauss OJ, Warren RM, Jordaan A, Streicher EM, Hanekom M, Falmer AA,Albert H, Trollip A, Hoosain E, van Helden PD, Victor TC. 2008. Spread ofa low-fitness drug-resistant Mycobacterium tuberculosis strain in a set-ting of high human immunodeficiency virus prevalence. J Clin Microbiol46:1514 –1516. https://doi.org/10.1128/JCM.01938-07.
21. Brandis G, Wrande M, Liljas L, Hughes D. 2012. Fitness-compensatorymutations in rifampicin-resistant RNA polymerase. Mol Microbiol 85:142–151. https://doi.org/10.1111/j.1365-2958.2012.08099.x.
22. Comas I, Borrell S, Roetzer A, Rose G, Malla B, Kato-Maeda M, Galagan J,Niemann S, Gagneux S. 2011. Whole-genome sequencing of rifampicin-resistant Mycobacterium tuberculosis strains identifies compensatorymutations in RNA polymerase genes. Nat Genet 44:106 –110. https://doi.org/10.1038/ng.1038.
23. Gagneux S, Burgos MV, DeRiemer K, Encisco A, Muñoz S, Hopewell PC,Small PM, Pym AS. 2006. Impact of bacterial genetics on the transmis-sion of isoniazid-resistant Mycobacterium tuberculosis. PLoS Pathog2:e61. https://doi.org/10.1371/journal.ppat.0020061.
24. Farhat MR, Shapiro BJ, Kieser KJ, Sultana R, Jacobson KR, Victor TC,Warren RM, Streicher EM, Calver A, Sloutsky A, Kaur D, Posey JE, PlikaytisB, Oggioni MR, Gardy JL, Johnston JC, Rodrigues M, Tang PKC, Kato-Maeda M, Borowsky ML, Muddukrishna B, Kreiswirth BN, Kurepina N,Galagan J, Gagneux S, Birren B, Rubin EJ, Lander ES, Sabeti PC, Murray M.2013. Genomic analysis identifies targets of convergent positive selec-tion in drug-resistant Mycobacterium tuberculosis. Nat Genet 45:1183–1189. https://doi.org/10.1038/ng.2747.
25. Zhang H, Li D, Zhao L, Fleming J, Lin N, Wang T, Liu Z, Li C, Galwey N,Deng J, Zhou Y, Zhu Y, Gao Y, Wang T, Wang S, Huang Y, Wang M, ZhongQ, Zhou L, Chen T, Zhou J, Yang R, Zhu G, Hang H, Zhang J, Li F, Wan K,Wang J, Zhang X-E, Bi L. 2013. Genome sequencing of 161 Mycobacte-rium tuberculosis isolates from China identifies genes and intergenicregions associated with drug resistance. Nat Genet 45:1255–1260.https://doi.org/10.1038/ng.2735.
26. O’Neill MB, Mortimer TD, Pepperell CS. 2015. Diversity of Mycobacteriumtuberculosis across evolutionary scales. PLoS Pathog 11:e1005257.https://doi.org/10.1371/journal.ppat.1005257.
27. Luo T, Comas I, Luo D, Lu B, Wu J, Wei L, Yang C, Liu Q, Gan M, Sun G,Shen X, Liu F, Gagneux S, Mei J, Lan R, Wan K, Gao Q. 2015. Southern EastAsian origin and coexpansion of Mycobacterium tuberculosis Beijing
family with Han Chinese. Proc Natl Acad Sci U S A 112:8136 – 8141.https://doi.org/10.1073/pnas.1424063112.
28. O’Neill MB, Kitchen A, Zarley A, Aylward W, Eldholm V, Pepperell CS.2017. Lineage specific histories of Mycobacterium tuberculosis dispersalin Africa and Eurasia. bioRxiv https://doi.org/10.1101/210161.
29. Achtman M, Zurth K, Morelli G, Torrea G, Guiyoule A, Carniel E. 1999.Yersinia pestis, the cause of plague, is a recently emerged clone ofYersinia pseudotuberculosis. Proc Natl Acad Sci U S A 96:14043–14048.https://doi.org/10.1073/pnas.96.24.14043.
30. Larsson P, Elfsmark D, Svensson K, Wikström P, Forsman M, Brettin T,Keim P, Johansson A. 2009. Molecular evolutionary consequences ofniche restriction in Francisella tularensis, a facultative intracellularpathogen. PLoS Pathog 5:e1000472. https://doi.org/10.1371/journal.ppat.1000472.
31. Vandelannoote K, Meehan CJ, Eddyani M, Affolabi D, Phanzu DM, Eyan-goh S, Jordaens K, Portaels F, Mangas K, Seemann T, Marsollier L, MarionE, Chauty A, Landier J, Fontanet A, Leirs H, Stinear TP, de Jong BC. 2017.Multiple introductions and recent spread of the emerging human patho-gen Mycobacterium ulcerans across Africa. Genome Biol Evol 9:414 – 426.https://doi.org/10.1093/gbe/evx003.
32. Sandgren A, Strong M, Muthukrishnan P, Weiner BK, Church GM, MurrayMB. 2009. Tuberculosis Drug Resistance Mutation Database. PLoS Med6:e1000002. https://doi.org/10.1371/journal.pmed.1000002.
33. Nguyen D, Brassard P, Westley J, Thibert L, Proulx M, Henry K, SchwartzmanK, Menzies D, Behr MA. 2003. Widespread pyrazinamide-resistant Mycobac-terium tuberculosis family in a low-incidence setting. J Clin Microbiol 41:2878–2883. https://doi.org/10.1128/JCM.41.7.2878-2883.2003.
34. Nguyen D, Brassard P, Menzies D, Thibert L, Warren R, Mostowy S, Behr M.2004. Genomic characterization of an endemic Mycobacterium tuberculosisstrain: evolutionary and epidemiologic implications. J Clin Microbiol 42:2573–2580. https://doi.org/10.1128/JCM.42.6.2573-2580.2004.
35. Brassard P, Henry KA, Schwartzman K, Jomphe M, Olson SH. 2008.Geography and genealogy of the human host harbouring a distinctivedrug-resistant strain of tuberculosis. Infect Genet Evol 8:247–257.https://doi.org/10.1016/j.meegid.2007.11.008.
36. Okamoto S, Tamaru A, Nakajima C, Nishimura K, Tanaka Y, Tokuyama S,Suzuki Y, Ochi K. 2007. Loss of a conserved 7-methylguanosine modifi-cation in 16S rRNA confers low-level streptomycin resistance in bacteria.Mol Microbiol 63:1096 –1106. https://doi.org/10.1111/j.1365-2958.2006.05585.x.
37. Spies FS, Ribeiro AW, Ramos DF, Ribeiro MO, Martin A, Palomino JC, RossettiMLR, da Silva PEA, Zaha A. 2011. Streptomycin resistance and lineage-specific polymorphisms in Mycobacterium tuberculosis gidB gene. J ClinMicrobiol 49:2625–2630. https://doi.org/10.1128/JCM.00168-11.
38. Feuerriegel S, Oberhauser B, George AG, Dafae F, Richter E, Rüsch-Gerdes S, Niemann S. 2012. Sequence analysis for detection of first-linedrug resistance in Mycobacterium tuberculosis strains from a high-incidence setting. BMC Microbiol 12:90. https://doi.org/10.1186/1471-2180-12-90.
39. Jagielski T, Ignatowska H, Bakuła Z, Dziewit Ł, Napiórkowska A,Augustynowicz-Kopec E, Zwolska Z, Bielecki J. 2014. Screening for strep-tomycin resistance-conferring mutations in Mycobacterium tuberculosisclinical isolates from Poland. PLoS One 9:e100078. https://doi.org/10.1371/journal.pone.0100078.
40. Homolka S, Meyer CG, Hillemann D, Owusu-Dabo E, Adjei O, HorstmannRD, Browne ENL, Chinbuah A, Osei I, Gyapong J, Kubica T, Ruesch-GerdesS, Niemann S. 2010. Unequal distribution of resistance-conferring mu-tations among Mycobacterium tuberculosis and Mycobacterium africa-num strains from Ghana. Int J Med Microbiol 300:489 – 495. https://doi.org/10.1016/j.ijmm.2010.04.019.
41. Fenner L, Egger M, Bodmer T, Altpeter E, Zwahlen M, Jaton K, Pfyffer GE,Borrell S, Dubuis O, Bruderer T, Siegrist HH, Furrer H, Calmy A, Fehr J,Stalder JM, Ninet B, Böttger EC, Gagneux S, Swiss HIV Cohort Study,Swiss Molecular Epidemiology of Tuberculosis Study Group. 2012. Effectof mutation and genetic background on drug resistance in Mycobacte-rium tuberculosis. Antimicrob Agents Chemother 56:3047–3053. https://doi.org/10.1128/AAC.06460-11.
42. Wengenack NL, Uhl JR, St Amand AL, Tomlinson AJ, Benson LM, NaylorS, Kline BC, Cockerill FR, III, Rusnak F. 1997. Recombinant Mycobacteriumtuberculosis KatG(S315T) is a competent catalase-peroxidase with re-duced activity toward isoniazid. J Infect Dis 176:722–727. https://doi.org/10.1086/514096.
43. Pym AS, Saint-Joanis B, Cole ST. 2002. Effect of katG mutations on thevirulence of Mycobacterium tuberculosis and the implication for trans-
Selection at Drug Resistance Loci in M. tuberculosis
January/February 2018 Volume 3 Issue 1 e00108-17 msystems.asm.org 15

mission in humans. Infect Immun 70:4955– 4960. https://doi.org/10.1128/IAI.70.9.4955-4960.2002.
44. Spies FS, von Groll A, Ribeiro AW, Ramos DF, Ribeiro MO, Dalla Costa ER,Martin A, Palomino JC, Rossetti ML, Zaha A, da Silva PEA. 2013. Biologicalcost in Mycobacterium tuberculosis with mutations in the rpsL, rrs, rpoB,and katG genes. Tuberculosis 93:150 –154. https://doi.org/10.1016/j.tube.2012.11.004.
45. Manson AL, Cohen KA, Abeel T, Desjardins CA, Armstrong DT, Barry CE,III, Brand J, TBResist Global Genome Consortium, Chapman SB, Cho S-N,Gabrielian A, Gomez J, Jodals AM, Joloba M, Jureen P, Lee JS, Malinga L,Maiga M, Nordenberg D, Noroc E, Romancenco E, Salazar A, SsengoobaW, Velayati AA, Winglee K, Zalutskaya A, Via LE, Cassell GH, Dorman SE,Ellner J, Farnia P, Galagan JE, Rosenthal A, Crudu V, Homorodean D,Hsueh P-R, Narayanan S, Pym AS, Skrahina A, Swaminathan S, Van derWalt M, Alland D, Bishai WR, Cohen T, Hoffner S, Birren BW, Earl AM.2017. Genomic analysis of globally diverse Mycobacterium tuberculosisstrains provides insights into the emergence and spread of multidrugresistance. Nat Genet 49:395– 402. https://doi.org/10.1038/ng.3767.
46. Billington OJ, McHugh TD, Gillespie SH. 1999. Physiological cost ofrifampin resistance induced in vitro in Mycobacterium tuberculosis.Antimicrob Agents Chemother 43:1866 –1869.
47. Eilertson B, Maruri F, Blackman A, Herrera M, Samuels DC, Sterling TR.2014. High proportion of heteroresistance in gyrA and gyrB influoroquinolone-resistant Mycobacterium tuberculosis clinical isolates.Antimicrob Agents Chemother 58:3270 –3275. https://doi.org/10.1128/AAC.02066-13.
48. Hazbón MH, Bobadilla del Valle M, Guerrero MI, Varma-Basil M, Filliol I,Cavatore M, Colangeli R, Safi H, Billman-Jacobe H, Lavender C, Fyfe J,García-García L, Davidow A, Brimacombe M, León CI, Porras T, Bose M,Chaves F, Eisenach KD, Sifuentes-Osornio J, Ponce de León A, Cave MD,Alland D. 2005. Role of embB codon 306 mutations in Mycobacteriumtuberculosis revisited: a novel association with broad drug resistanceand IS6110 clustering rather than ethambutol resistance. AntimicrobAgents Chemother 49:3794–3802. https://doi.org/10.1128/AAC.49.9.3794-3802.2005.
49. DeJesus MA, Gerrick ER, Xu W, Park SW, Long JE, Boutte CC, Rubin EJ,Schnappinger D, Ehrt S, Fortune SM, Sassetti CM, Ioerger TR. 2017.Comprehensive essentiality analysis of the Mycobacterium tuberculosisgenome via saturating transposon mutagenesis. mBio 8:e02133-16.https://doi.org/10.1128/mBio.02133-16.
50. Shekar S, Yeo ZX, Wong JCL, Chan MKL, Ong DCT, Tongyoo P, Wong S-Y,Lee ASG. 2014. Detecting novel genetic variants associated withisoniazid-resistant Mycobacterium tuberculosis. PLoS One 9:e102383.https://doi.org/10.1371/journal.pone.0102383.
51. Danilchanka O, Mailaender C, Niederweis M. 2008. Identification of anovel multidrug efflux pump of Mycobacterium tuberculosis. Antimi-crob Agents Chemother 52:2503–2511. https://doi.org/10.1128/AAC.00298-08.
52. Fu LM, Shinnick TM. 2007. Genome-wide exploration of the drug actionof capreomycin on Mycobacterium tuberculosis using Affymetrix oligo-nucleotide GeneChips. J Infect 54:277–284. https://doi.org/10.1016/j.jinf.2006.05.012.
53. Phong TQ, Ha DTT, Volker U, Hammer E. 2015. Using a label freequantitative proteomics approach to identify changes in protein abun-dance in multidrug-resistant Mycobacterium tuberculosis. Indian J Mi-crobiol 55:219 –230. https://doi.org/10.1007/s12088-015-0511-2.
54. Phelan J, Coll F, McNerney R, Ascher DB, Pires DEV, Furnham N, Coeck N,Hill-Cawthorne GA, Nair MB, Mallard K, Ramsay A, Campino S, HibberdML, Pain A, Rigouts L, Clark TG. 2016. Mycobacterium tuberculosis wholegenome sequencing and protein structure modelling provides insightsinto anti-tuberculosis drug resistance. BMC Med 14:31. https://doi.org/10.1186/s12916-016-0575-9.
55. Andrews S. 2012. FastQC. Babraham Bioinformatics, Babraham Institute,Cambridge, United Kingdom.
56. Kreuger F. 2013. TrimGalore! Babraham Bioinformatics, Babraham Insti-tute, Cambridge, United Kingdom.
57. Li H. 2013. Aligning sequence reads, clone sequences and assemblycontigs with BWA-MEM. ArXiv:1303.3997 [q-bio.GN]
58. Li H, Handsaker B, Wysoker A, Fennell T, Ruan J, Homer N, Marth G,Abecasis G, Durbin R, 1000 Genome Project Data Processing Subgroup.2009. The Sequence Alignment/Map format and SAMtools. Bioinformat-ics 25:2078 –2079. https://doi.org/10.1093/bioinformatics/btp352.
59. Walker BJ, Abeel T, Shea T, Priest M, Abouelliel A, Sakthikumar S, CuomoCA, Zeng Q, Wortman J, Young SK, Earl AM. 2014. Pilon: an integratedtool for comprehensive microbial variant detection and genome assem-bly improvement. PLoS One 9:e112963. https://doi.org/10.1371/journal.pone.0112963.
60. Price MN, Dehal PS, Arkin AP. 2010. FastTree 2 – approximatelymaximum-likelihood trees for large alignments. PLoS One 5:e9490.https://doi.org/10.1371/journal.pone.0009490.
61. Page AJ, Taylor B, Delaney AJ, Soares J, Seemann T, Keane JA, Harris SR.2016. SNP-sites: rapid efficient extraction of SNPs from multi-FASTAalignments. Microb Genom 2:e000056. https://doi.org/10.1099/mgen.0.000056.
62. Cingolani P, Platts A, Wang LL, Coon M, Nguyen T, Wang L, Land SJ, LuX, Ruden DM. 2012. A program for annotating and predicting the effectsof single nucleotide polymorphisms, SnpEff: SNPs in the genome ofDrosophila melanogaster strain w1118; iso-2; iso-3. Fly 6:80 –92. https://doi.org/10.4161/fly.19695.
63. Salazar A, Earl A, Desjardins C, Abeel T. 2015. Normalizing alternaterepresentations of large sequence variants across multiple bacterialgenomes. BMC Bioinformatics 16:A8. https://doi.org/10.1186/1471-2105-16-S2-A8.
64. De Mita S, Siol M. 2012. EggLib: processing, analysis and simulation toolsfor population genetics and genomics. BMC Genet 13:27. https://doi.org/10.1186/1471-2156-13-27.
65. R Core Team. 2015. R: a language and environment for statistical com-puting. R Foundation for Statistical Computing, Vienna, Austria.
66. Weir BS, Cockerham CC. 1984. Estimating F-statistics for the analysis ofpopulation structure. Evolution 38:1358 –1370. https://doi.org/10.1111/j.1558-5646.1984.tb05657.x.
67. Sagulenko P, Puller V, Neher R. 2017. TreeTime: maximum likelihoodphylodynamic analysis. bioRxiv https://doi.org/10.1101/153494.
Mortimer et al.
January/February 2018 Volume 3 Issue 1 e00108-17 msystems.asm.org 16