Signal Detection and Management Examples
14
SIGNALING EXAMPLES Steve Jolley SJ Pharma Consulting, LLC
-
Upload
sj-pharma-consulting -
Category
Data & Analytics
-
view
21 -
download
1
Transcript of Signal Detection and Management Examples
SIGNALING EXAMPLES
Steve JolleySJ Pharma Consulting, LLC
© SJ Pharma Consulting, LLC 2
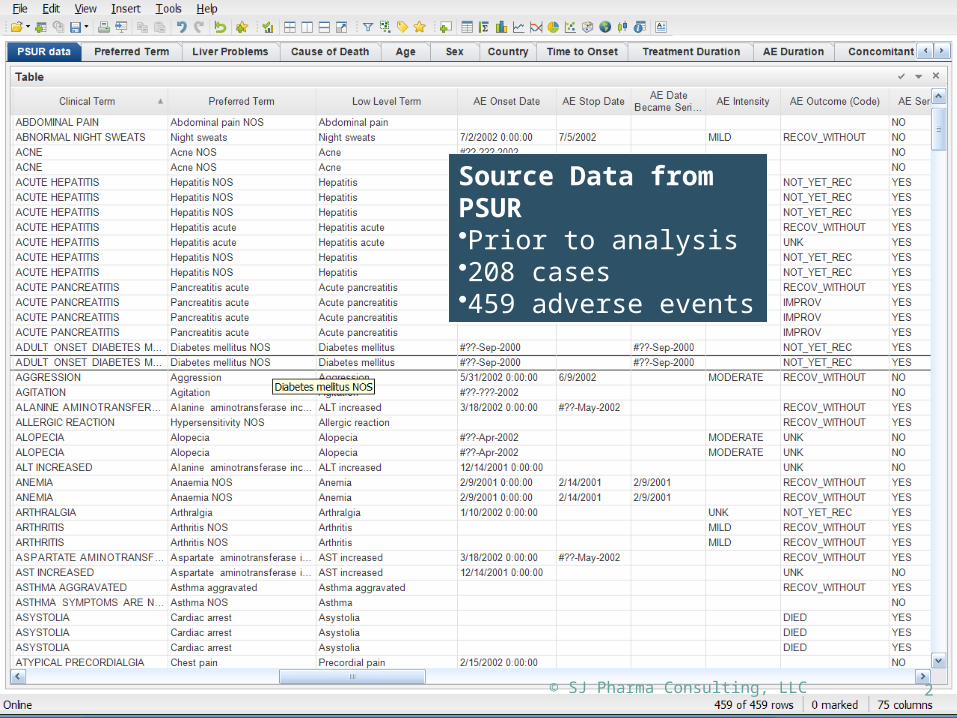
Source Data from PSUR•Prior to analysis•208 cases•459 adverse events
© SJ Pharma Consulting, LLC 3
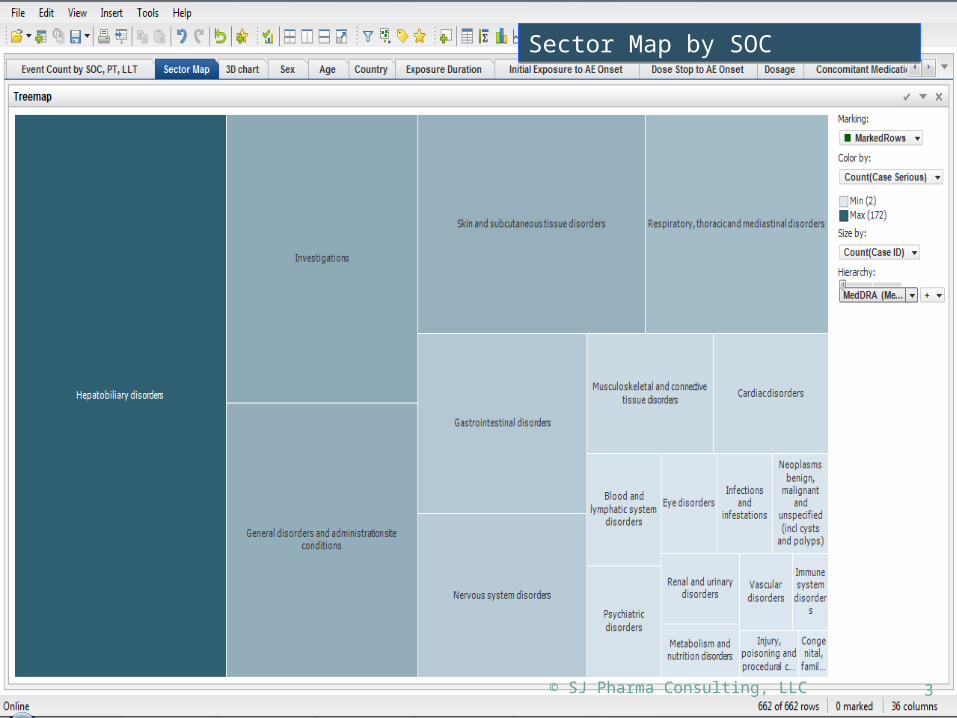
Sector Map by SOCSector Map by SOC
© SJ Pharma Consulting, LLC 4
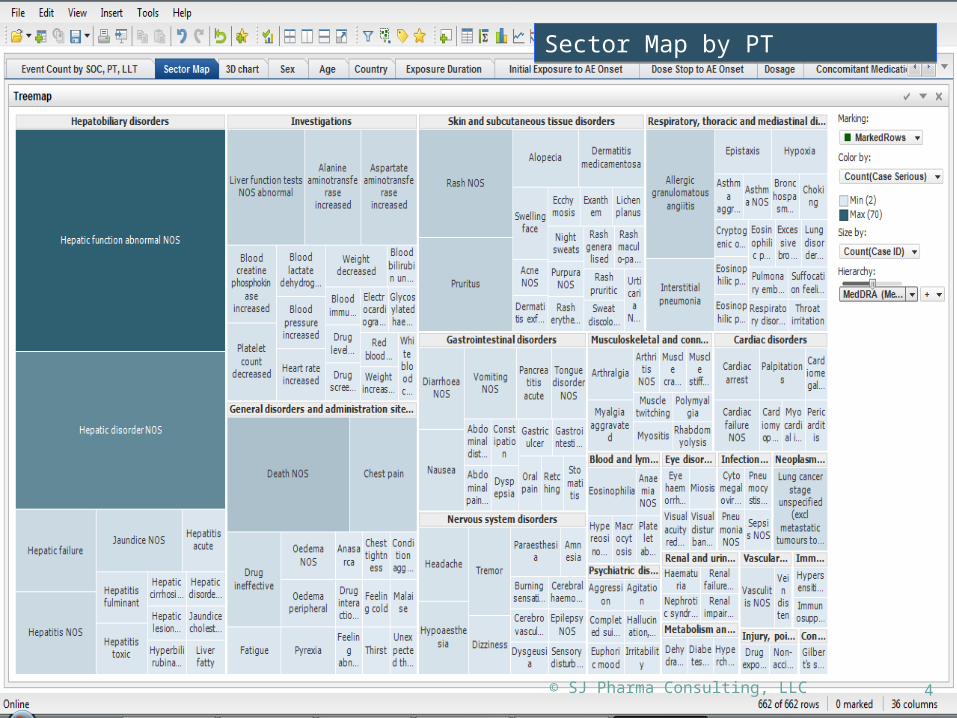
Sector Map by PTSector Map by PT
© SJ Pharma Consulting, LLC 5
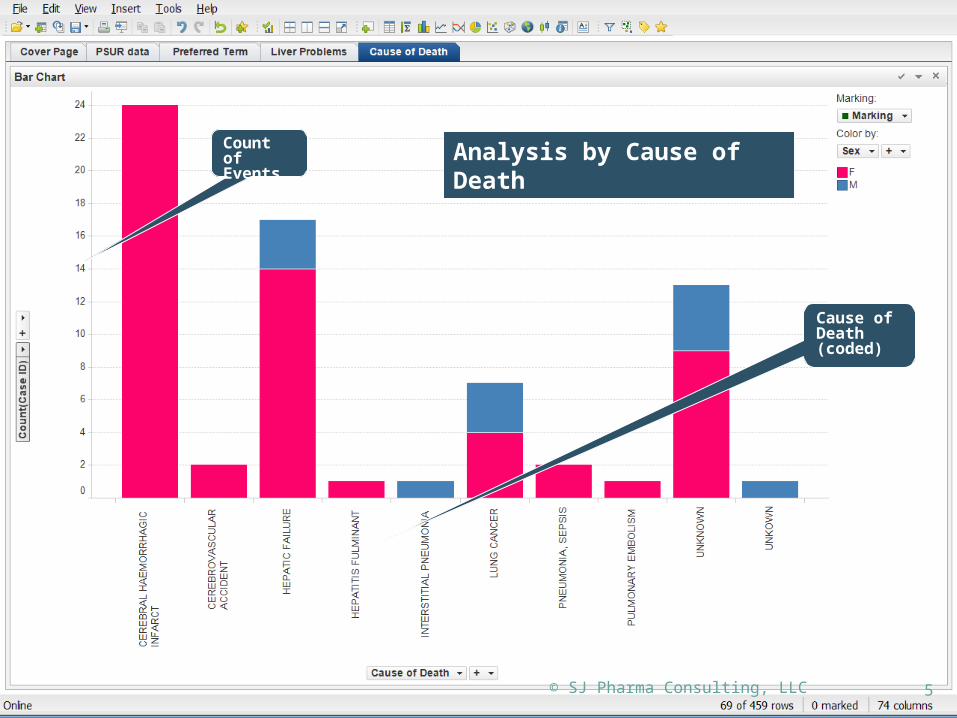
Cause of Death(coded)
Count of Events Analysis by Cause of Death
© SJ Pharma Consulting, LLC 6
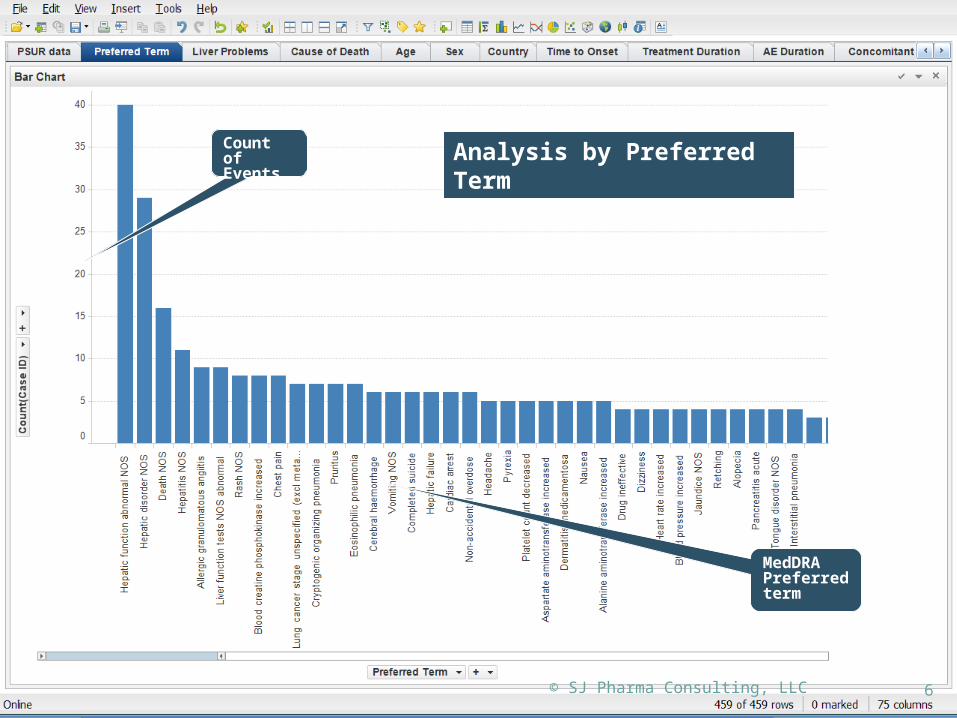
MedDRAPreferred term
Count of Events Analysis by Preferred Term
© SJ Pharma Consulting, LLC 7
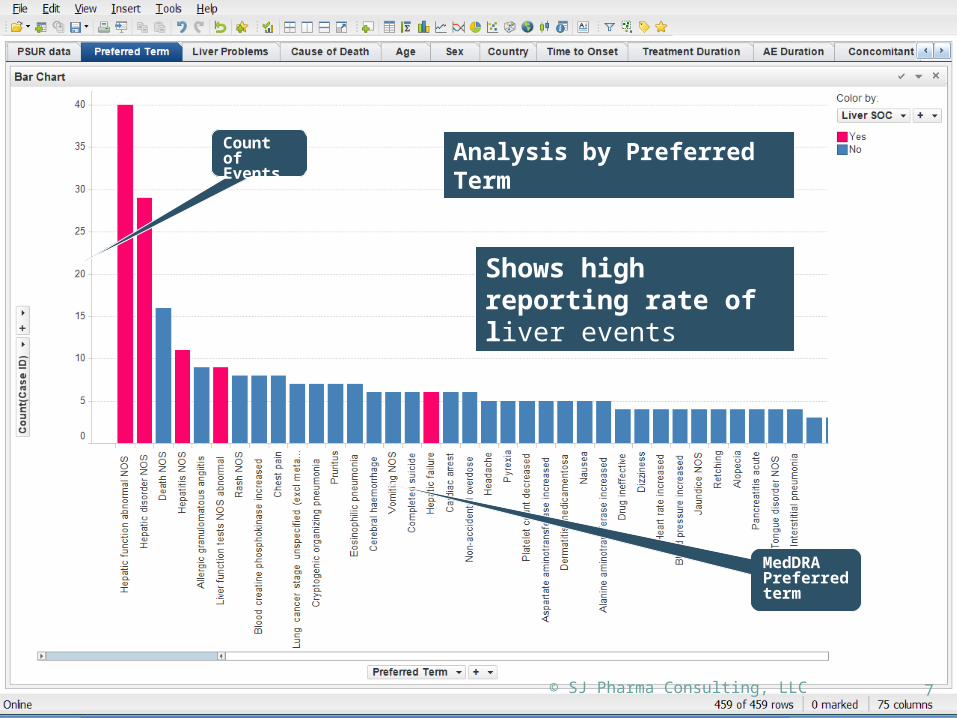
MedDRAPreferred term
Count of Events
Shows high reporting rate of liver events
Analysis by Preferred Term
© SJ Pharma Consulting, LLC 8
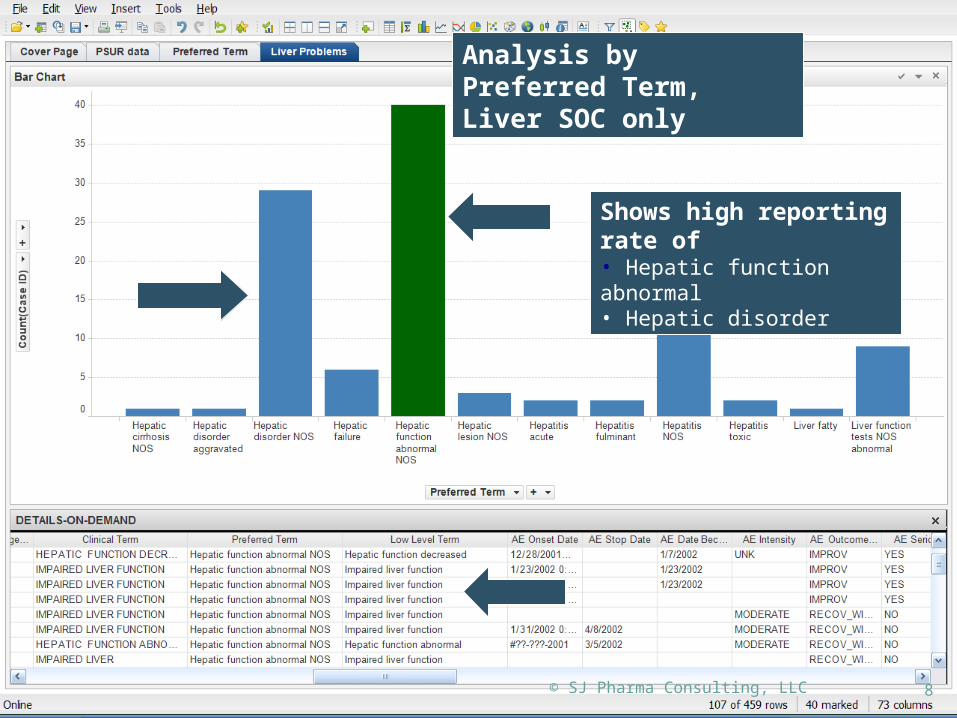
Shows high reporting rate of • Hepatic function abnormal• Hepatic disorder
Analysis by Preferred Term,Liver SOC only
© SJ Pharma Consulting, LLC 9
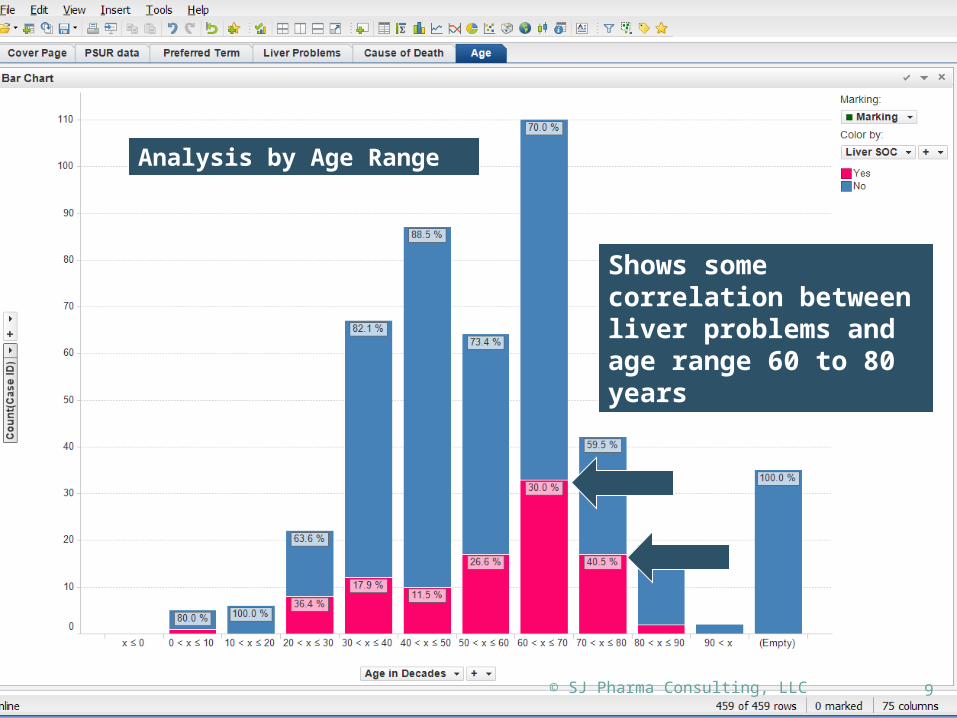
Analysis by Age Range
Shows some correlation between liver problems and age range 60 to 80 years
© SJ Pharma Consulting, LLC 10
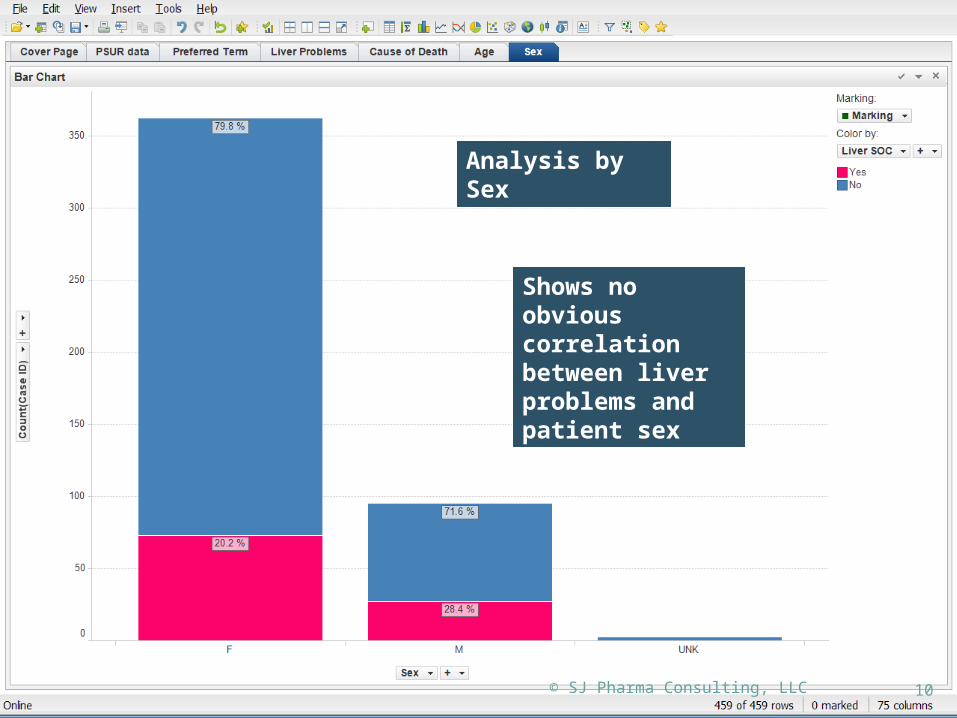
Analysis by Sex
Shows no obvious correlation between liver problems and patient sex
© SJ Pharma Consulting, LLC 11
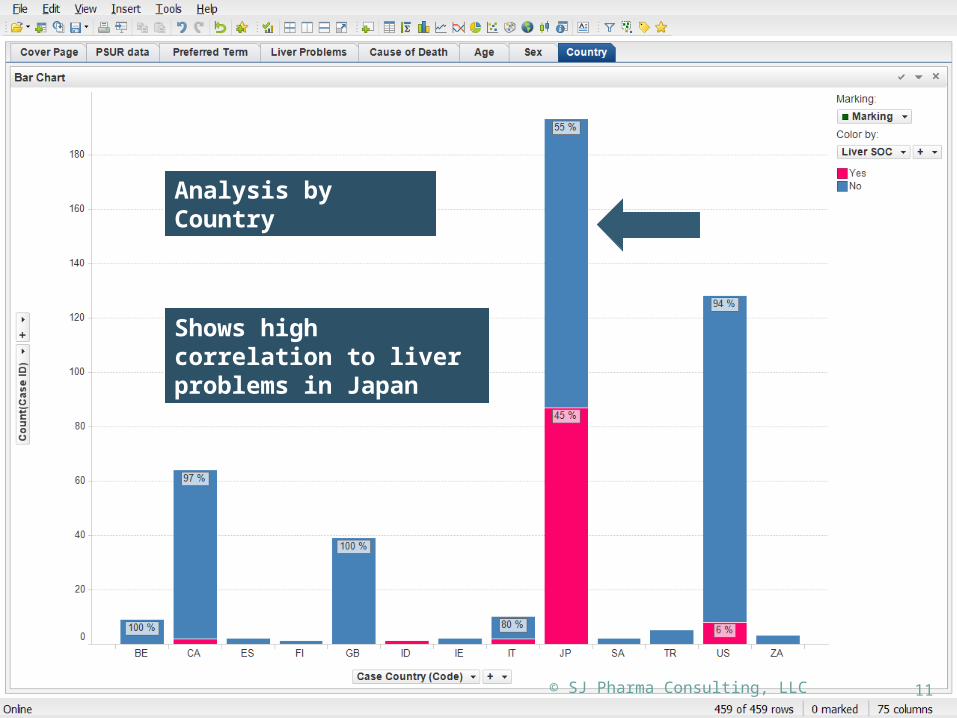
Analysis by Country
Shows high correlation to liver problems in Japan
© SJ Pharma Consulting, LLC 12
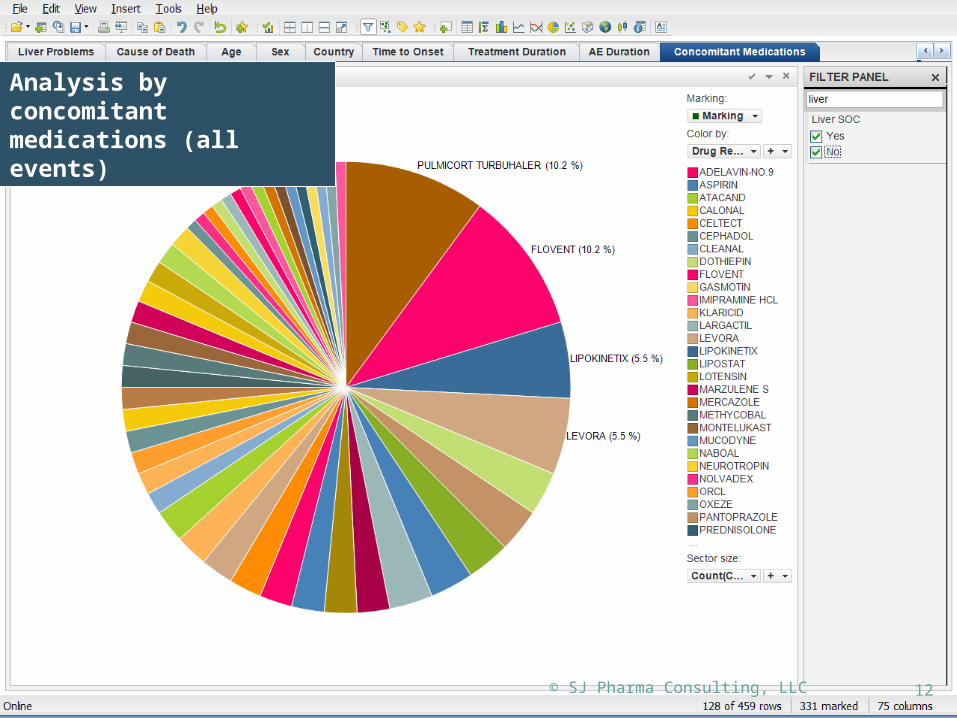
Analysis by concomitant medications (all events)

© SJ Pharma Consulting, LLC 13
Analysis by concomitant medications (liver events only)
Shows greater correlation with Flovent when look at liver events only
Increases strength of correlation between company drug, Flovent and liver events
14
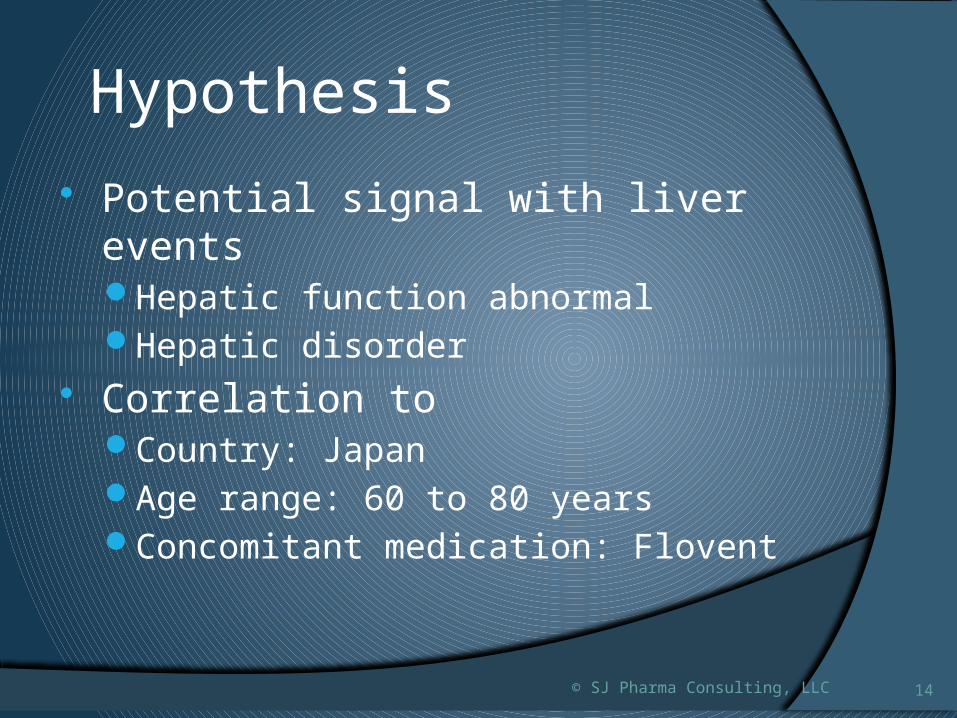
Hypothesis Potential signal with liver events
Hepatic function abnormalHepatic disorder
Correlation toCountry: JapanAge range: 60 to 80 yearsConcomitant medication: Flovent
© SJ Pharma Consulting, LLC