Signal-Detection Analysis of Group Decision Making · PDF fileSignal-Detection Analysis of...
21
Psychological Review 2001, Vol. 108, No. I, 183-203 Copyright 2001 by the American Psychological Association, Inc. 0033-295X/01/S5.00 DOI: 30.1037//0033-295X. 108.1.183 Signal-Detection Analysis of Group Decision Making Robert D. Sorkin, Christopher J. Hays, and Ryan West University of Florida How effectively can groups of people make yes-or-no decisions? To answer this question, we used signal-detection theory to model the behavior of groups of human participants in a visual detection task. The detection model specifies how performance depends on the group's size, the competence of the members, the correlation among members' judgments, the constraints on member interaction, and the group's decision rule. The model also allows specification of performance efficiency, which is a measure of how closely a group's performance matches the statistically optimal group. The performance of our groups was consistent with the theoretical predictions, but efficiency decreased as group size increased. This result was attributable to a decrease in the effort that members gave to their individual tasks rather than to an inefficiency in combining the information in the members' judgments. How effectively can groups of people perform yes-or-no deci- sion tasks, and how does their performance depend on the abilities of the individual members and the way they interact? We at- tempted to answer these questions by using signal-detection theory to model the behavior of groups of human participants in a visual detection task. The signal-detection model specifies how the ac- curacy of a group's performance depends on the group's size, the detection abilities of the individual members, the correlation among member judgments, the constraints on member interaction, and the group's decision rule. The model also allows specification of the efficiency of group performance; that is, it yields a measure of how closely the group's performance matches that of a hypo- thetical, statistically optimal group. This efficiency measure can be factored into separate components that describe how well the individual members performed their tasks and how effectively the group combined the information from the members into a group decision. The results of our experiments provide support for the signal-detection analysis and allow interesting conclusions to be made about the sources of inefficiency in the decision-making behavior of human groups. Statistical arguments about the effects of group size and member competence on group performance have existed for more than 200 years, since Condorcet (1785) and, more recently, Einhorn, Hogarth, and Klempner (1977). According to the statistical argu- ment, group performance should increase with group size, with the Robert D. Sorkin, Christopher J. Hays, and Ryan West, Department of Psychology, University of Florida. Christopher J. Hays is now with the U.S. Air Force. This work was partially supported by grants from the Air Force Office of Scientific Research. Christopher J. Hays conducted Experiment 1 as part of the requirements for the master of science degree at the University of Florida. We thank Dr. John Tangney for his encouragement and support. Much of the article was written while Robert D. Sorkin was the Norman Munn Distinguished Scholar at The Flinders University of South Australia. Correspondence concerning this article should be addressed to Robert D. Sorkin, Department of Psychology, University of Florida, P.O. Box 112250, Gainesville, Florida 32611. Electronic mail may be sent to [email protected]. most rapid increase occurring when the competence of the group's members is high and when independent information is available to each member. These models assume that there is a statistically effective way to combine the members' judgments. If the expertise of the members varies within the group, each member's input should be weighted proportionally by the member's competence at the task (Grofman, Feld, & Owen, 1984; Grofman, Owen, & Feld, 1983; Nitzan & Paroush, 1982, 1984; Shapley & Grofman, 1984). The empirical data on group performance indicate that human groups are generally less effective than would be predicted by statistical models that assume the optimal use of member infor- mation. In a fascinating sketch of 40 years of research on group decision making, Davis (1992) pointed out that most research has found group performance to be relatively inefficient. Group per- formance usually is superior to the average of individual perfor- mance but less than the statistical expectation (see also Hastie's, 1986, review). Moreover, many studies found that group perfor- mance either is insensitive to group size or that the advantage of size declines more rapidly than would be predicted from the statistical argument. All of these results can be attributed to inef- ficiencies in group function, such as might be caused by difficul- ties in member interaction or coordination, reduced member effort such as social loafing (Latane, Williams, & Harkins, 1979; Shep- perd, 1993), or problems in combining judgments from multiple sources (Myung, Ramamoorti, & Bailey, 1996; Wallsten, Budescu, Erev, & Diederich, 1997). Attempts to model group performance have used signal- detection theory (Batchelder & Romney, 1986; Erev, Gopher, Itkin, & Greenshpan, 1995; Metz & Shen, 1992; Pete, Pattipati, & Kleinman, 1993a, 1993b; Sorkin & Dai, 1994; Sorkin, West, & Robinson, 1998). In the group signal-detection situation, a group of observers is presented with an input that may have been either signal plus noise or noise alone. Each group member makes an observation and the group must then decide which of the two possible events gave rise to the input. Metz and Shen (1992) analyzed the gains in the detection accuracy of reading x-ray images that resulted from replicated readings by the same or multiple readers. Erev et al. (1995) examined the strategic inter- action between two observers in a signal-detection task (i.e., when 183
Transcript of Signal-Detection Analysis of Group Decision Making · PDF fileSignal-Detection Analysis of...

Psychological Review2001, Vol. 108, No. I, 183-203
Copyright 2001 by the American Psychological Association, Inc.0033-295X/01/S5.00 DOI: 30.1037//0033-295X. 108.1.183
Signal-Detection Analysis of Group Decision Making
Robert D. Sorkin, Christopher J. Hays, and Ryan WestUniversity of Florida
How effectively can groups of people make yes-or-no decisions? To answer this question, we usedsignal-detection theory to model the behavior of groups of human participants in a visual detection task.The detection model specifies how performance depends on the group's size, the competence of themembers, the correlation among members' judgments, the constraints on member interaction, and thegroup's decision rule. The model also allows specification of performance efficiency, which is a measureof how closely a group's performance matches the statistically optimal group. The performance of ourgroups was consistent with the theoretical predictions, but efficiency decreased as group size increased.This result was attributable to a decrease in the effort that members gave to their individual tasks ratherthan to an inefficiency in combining the information in the members' judgments.
How effectively can groups of people perform yes-or-no deci-sion tasks, and how does their performance depend on the abilitiesof the individual members and the way they interact? We at-tempted to answer these questions by using signal-detection theoryto model the behavior of groups of human participants in a visualdetection task. The signal-detection model specifies how the ac-curacy of a group's performance depends on the group's size, thedetection abilities of the individual members, the correlationamong member judgments, the constraints on member interaction,and the group's decision rule. The model also allows specificationof the efficiency of group performance; that is, it yields a measureof how closely the group's performance matches that of a hypo-thetical, statistically optimal group. This efficiency measure can befactored into separate components that describe how well theindividual members performed their tasks and how effectively thegroup combined the information from the members into a groupdecision. The results of our experiments provide support for thesignal-detection analysis and allow interesting conclusions to bemade about the sources of inefficiency in the decision-makingbehavior of human groups.
Statistical arguments about the effects of group size and membercompetence on group performance have existed for more than200 years, since Condorcet (1785) and, more recently, Einhorn,Hogarth, and Klempner (1977). According to the statistical argu-ment, group performance should increase with group size, with the
Robert D. Sorkin, Christopher J. Hays, and Ryan West, Department ofPsychology, University of Florida.
Christopher J. Hays is now with the U.S. Air Force.This work was partially supported by grants from the Air Force Office
of Scientific Research. Christopher J. Hays conducted Experiment 1 as partof the requirements for the master of science degree at the University ofFlorida. We thank Dr. John Tangney for his encouragement and support.Much of the article was written while Robert D. Sorkin was the NormanMunn Distinguished Scholar at The Flinders University of South Australia.
Correspondence concerning this article should be addressed to RobertD. Sorkin, Department of Psychology, University of Florida, P.O. Box112250, Gainesville, Florida 32611. Electronic mail may be sent [email protected].
most rapid increase occurring when the competence of the group'smembers is high and when independent information is available toeach member. These models assume that there is a statisticallyeffective way to combine the members' judgments. If the expertiseof the members varies within the group, each member's inputshould be weighted proportionally by the member's competence atthe task (Grofman, Feld, & Owen, 1984; Grofman, Owen, & Feld,1983; Nitzan & Paroush, 1982, 1984; Shapley & Grofman, 1984).
The empirical data on group performance indicate that humangroups are generally less effective than would be predicted bystatistical models that assume the optimal use of member infor-mation. In a fascinating sketch of 40 years of research on groupdecision making, Davis (1992) pointed out that most research hasfound group performance to be relatively inefficient. Group per-formance usually is superior to the average of individual perfor-mance but less than the statistical expectation (see also Hastie's,1986, review). Moreover, many studies found that group perfor-mance either is insensitive to group size or that the advantage ofsize declines more rapidly than would be predicted from thestatistical argument. All of these results can be attributed to inef-ficiencies in group function, such as might be caused by difficul-ties in member interaction or coordination, reduced member effortsuch as social loafing (Latane, Williams, & Harkins, 1979; Shep-perd, 1993), or problems in combining judgments from multiplesources (Myung, Ramamoorti, & Bailey, 1996; Wallsten, Budescu,Erev, & Diederich, 1997).
Attempts to model group performance have used signal-detection theory (Batchelder & Romney, 1986; Erev, Gopher,Itkin, & Greenshpan, 1995; Metz & Shen, 1992; Pete, Pattipati, &Kleinman, 1993a, 1993b; Sorkin & Dai, 1994; Sorkin, West, &Robinson, 1998). In the group signal-detection situation, a groupof observers is presented with an input that may have been eithersignal plus noise or noise alone. Each group member makes anobservation and the group must then decide which of the twopossible events gave rise to the input. Metz and Shen (1992)analyzed the gains in the detection accuracy of reading x-rayimages that resulted from replicated readings by the same ormultiple readers. Erev et al. (1995) examined the strategic inter-action between two observers in a signal-detection task (i.e., when
183

184 SORKIN, HAYS, AND WEST
each observer's payoff structure was contingent on the outcomeand the response of the other observer). Pete et al. (1993b) con-sidered the case of multiple team members working in an uncer-tain, binary choice detection situation. They generalized the signal-detection model to consider the individuals' as well as the group'sprior probability and payoff structure; that is, their model allowedjoint optimization of the group aggregation rule and the individualdecision rules of the group members.
Sorkin and Dai (1994) took a somewhat simpler approach togroup signal detection than did Erev et al. (1995) and Pete et al.(1993b). Sorkin and Dai assumed that each group member couldprovide an estimate of the signal's likelihood of having occurredon a trial, and that the expertise of the members was known a priorito the group. These assumptions allowed them to sidestep theproblem of how to aggregate binary responses from individualswho might have different biases toward the decision alternatives.Sorkin and Dai computed the performance accuracy that wouldresult from the optimal aggregation of the members' likelihoodestimates; this specified the performance of the ideal group. Later,we review the specific predictions of the ideal group analysis.
Because the performance level of the ideal group is the highestthat may be achieved by any group, the ideal analysis specifies anupper bound on the performance that may be obtained from anygroup of human participants. Because the ideal model prescribeshow the individual estimates of the group's members should becombined for a detection decision, the model also serves as anormative description of the behavior of human groups. For ex-ample, the ideal model assumes that each member of the groupmakes a continuous or graded estimate of the signal's likelihood,and that these estimates are then weighted by the member's de-tection ability. The weighted member estimates are then combinedin an appropriate and noiseless fashion. We might expect that thedecision-making process used by a group of human participantswould violate some of these assumptions. Therefore, it is useful toconsider the consequences of some specific (and perhaps drastic)violations of the ideal assumptions. For example, what are theperformance consequences of requiring discrete rather than gradedmember judgments or of limiting the exchange of informationamong the members? The performance of specific suboptimalgroups might define reasonable lower bounds on the performanceto be expected from a group of human participants.
Consider a suboptimal group that arrives at a decision withoutany interaction or communication among the members. Supposefurther that the group decision is determined by the aggregation ofthe members' unweighted binary (yes-no) votes; specifically, byapplication of a majority rule to the members' yes votes. We wouldexpect that if a group used such a curtailed decision process, itsperformance would be well below the ideal level. Sorkin et al.(1998) used signal-detection theory to analyze the performance ofsuch groups, known as Condorcet groups.1 Condorcet groups areof interest because they provide an interesting kind of degeneratecase of the optimal signal-detection group.
The inefficiency of a Condorcet group's performance is due toseveral factors. First, because there is no group interaction beforevoting, the group decision must be based on the unweightedcombination of the members' decisions. Thus, information will belost because the judgment of the least competent member counts asmuch as the judgment of the most competent member. Second,detailed information about the member estimates is lost because
the member estimates are binary votes rather than graded judg-ments of signal likelihood. Additional potential losses occur be-cause each member uses an independently determined criterion formaking a binary yes response. Because members cannot useknowledge about other members' criteria, they cannot adjust (orreadjust) their own response criterion for an optimal group setting.
Suboptimal models such as the Condorcet group may be usefulfor describing the behavior of some groups of human participants.This may be the case even when there are no externally imposedconstraints on participant interaction or voting. That is, humangroups may adopt aspects of the Condorcet decision mode eventhough more efficient modes of decision interaction are possible.Our initial hypothesis was that the upper bound on the perfor-mance of human groups would be given by the ideal group model,and that lower bounds on performance would be given by theCondorcet group model. (We assume that the members of thetheoretical group have detection competencies equivalent to theircounterparts in the human group.)
The psychophysical literature includes many studies that con-sider similar models, albeit in a different context (Green & Swets,1966; Swets, 1984). The goal in many of these studies was todescribe how a human observer aggregates stimulus informationthat arrives simultaneously or sequentially on multiple sources oron multiple channels. For an auditory task, these multiple sourcesmight be different frequency bands or different earphone channels.For a visual task, these sources might be different spatial frequen-cies or different spatial positions. Can an observer perform thistask with perfect efficiency? That is, can a person integrate all therelevant information that arrives on multiple channels (i.e., byperforming the optimal statistical processing of the inputs asspecified by an ideal signal-detection observer; see Green &Swets, 1966)? Alternatively, the observer's detection process maybe suboptimal in a particular way. Perhaps the observations ondifferent channels must be processed sequentially or first con-verted to separate binary (i.e., threshold) decisions, which are thencombined.
Many of the multichannel psychophysical models are formallyidentical to putative models of group signal detection. Consider thefollowing multichannel detection task. On a given trial, all of themultiple channels contain either noise alone or signal plus noise.The observer must observe all of the channels and make a singleyes or no response to the possible occurrence of the (multiple-channel) signal. That is, the set of channel observations must bemapped to a yes or no response. The observations on the channelsmay or may not be correlated. The reader will see the similarity ofthis situation to the group detection case in which an array ofmultiple observers must monitor a single channel for the possibleoccurrence of either a noise-alone or signal-plus-noise conditionon that channel. Each observer in the group makes an observation(possibly correlated) of the input, and the set of observations mustbe mapped to a single yes-no group decision.
Green and Swets (1966) and Swets (1984) discussed two ge-neric classes of these psychophysical models: the observation-integration (OI) model and the decision-combination (DC) model.In the Ol model, graded estimates of the signal's occurrence in
1 For a broader definition of Condorcet-like groups, see Austen-Smithand Banks (1996).
GROUP SIGNAL DETECTION 185
each channel are available to be weighted and summed to form afinal decision statistic. In the DC model, only binary responses areavailable from each channel, and these are combined for the finaldecision by applying a combination rule. To arrive at an overall yesdecision, the combination rule could require (a) a single yes votefrom any of the channels (the "union" rule), (b) yes votes from aspecific majority of the channels, or (c) yes votes from all of thechannels (the "intersection" rule). The channel signal-to-noiselevels and the individual decision criteria used by each channel areimportant interacting variables in the DC model, and widely dif-ferent performance can be obtained by changing the assumptionsabout their values.
It is clear that the different group models have counterparts inthe multichannel psychophysical models and that the class ofCondorcet models is equivalent to the DC models. When wediscuss the results of our experiments, we make some furthercomparisons between these two classes of model. Durlach, Braido,and Ito (1986) reported a very elegant development of the OI classof psychophysical model. They developed a detailed model of thesingle-observer, multiple-channel auditory signal-detection situa-tion, and their formulation provided the foundation for Sorkin andDai's (1994) analysis of ideal group signal detection.
In this article we first describe the general detection task that isused in all of our experiments with human participants. Second, weprovide a formal description of the group detection problem and ofthe ideal and Condorcet groups and briefly review their properties.Third, we report on experiments that assessed the detection per-formance of groups of human participants in different conditions.We compare the resulting performance to the predictions of theideal and Condorcet models and argue that these models canaccount for much of the variance observed in the performance ofthe human participants. Finally, we report on a refined version ofthe experimental task that enables us to quantify the sources ofinefficiency in group detection performance.
Signal-Detection Task
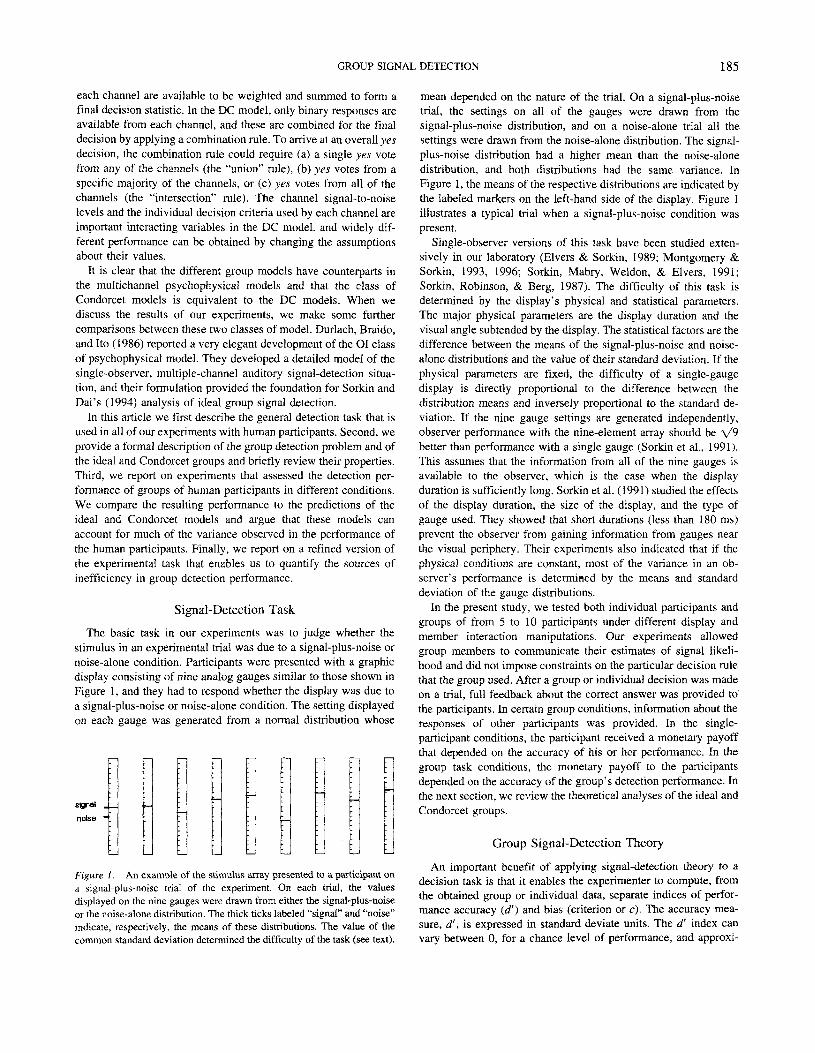
The basic task in our experiments was to judge whether thestimulus in an experimental trial was due to a signal-plus-noise ornoise-alone condition. Participants were presented with a graphicdisplay consisting of nine analog gauges similar to those shown inFigure 1, and they had to respond whether the display was due toa signal-plus-noise or noise-alone condition. The setting displayedon each gauge was generated from a normal distribution whose
noise ™
Figure 1. An example of the stimulus array presented to a participant ona signal-plus-noise trial of the experiment. On each trial, the valuesdisplayed on the nine gauges were drawn from either the signal-plus-noiseor the noise-alone distribution. The thick ticks labeled "signal" and "noise"indicate, respectively, the means of these distributions. The value of thecommon standard deviation determined the difficulty of the task (see text).
mean depended on the nature of the trial. On a signal-plus-noisetrial, the settings on all of the gauges were drawn from thesignal-plus-noise distribution, and on a noise-alone trial all thesettings were drawn from the noise-alone distribution. The signal-plus-noise distribution had a higher mean than the noise-alonedistribution, and both distributions had the same variance. InFigure 1, the means of the respective distributions are indicated bythe labeled markers on the left-hand side of the display. Figure 1illustrates a typical trial when a signal-plus-noise condition waspresent.
Single-observer versions of this task have been studied exten-sively in our laboratory (Elvers & Sorkin, 1989; Montgomery &Sorkin, 1993, 1996; Sorkin, Mabry, Weldon, & Elvers, 1991;Sorkin, Robinson, & Berg, 1987). The difficulty of this task isdetermined by the display's physical and statistical parameters.The major physical parameters are the display duration and thevisual angle subtended by the display. The statistical factors are thedifference between the means of the signal-plus-noise and noise-alone distributions and the value of their standard deviation. If thephysical parameters are fixed, the difficulty of a single-gaugedisplay is directly proportional to the difference between thedistribution means and inversely proportional to the standard de-viation. If the nine gauge settings are generated independently,observer performance with the nine-element array should be \/9better than performance with a single gauge (Sorkin et al, 1991).This assumes that the information from all of the nine gauges isavailable to the observer, which is the case when the displayduration is sufficiently long. Sorkin et al. (1991) studied the effectsof the display duration, the size of the display, and the type ofgauge used. They showed that short durations (less than 180 ms)prevent the observer from gaining information from gauges nearthe visual periphery. Their experiments also indicated that if thephysical conditions are constant, most of the variance in an ob-server's performance is determined by the means and standarddeviation of the gauge distributions.
In the present study, we tested both individual participants andgroups of from 5 to 10 participants under different display andmember interaction manipulations. Our experiments allowedgroup members to communicate their estimates of signal likeli-hood and did not impose constraints on the particular decision rulethat the group used. After a group or individual decision was madeon a trial, full feedback about the correct answer was provided tothe participants. In certain group conditions, information about theresponses of other participants was provided. In the single-participant conditions, the participant received a monetary payoffthat depended on the accuracy of his or her performance. In thegroup task conditions, the monetary payoff to the participantsdepended on the accuracy of the group's detection performance. Inthe next section, we review the theoretical analyses of the ideal andCondorcet groups.
Group Signal-Detection Theory
An important benefit of applying signal-detection theory to adecision task is that it enables the experimenter to compute, fromthe obtained group or individual data, separate indices of perfor-mance accuracy (d') and bias (criterion or c). The accuracy mea-sure, d', is expressed in standard deviate units. The d' index canvary between 0, for a chance level of performance, and approxi-

186 SORKIN, HAYS, AND WEST
mately 4, for errorless performance. The criterion measure, c, isexpressed in similar units. A value of c equal to 0 indicates thatthere is no preference toward a signal-plus-noise or noise-aloneresponse, and a positive value indicates that there is a preferencefor the noise-alone response (Macmillan & Creelman, 1991). Weused these measures to describe both individual and group perfor-mance in our experiments.
The general group signal-detection paradigm is shown in Fig-ure 2. There are m members of the group. On each trial, the arrayof m members is presented either with a signal-plus-noise event ornoise-alone event, and the group must decide which was presented.Each member has an individual index of detection accuracy, d\. Ona signal-plus-noise trial, each member receives an input equal to/u,,., and on a noise-alone trial each member receives an input equalto 0. The task is made difficult by the presence of two Gaussian,zero-mean noise sources to each member, o^om and erf. The firstnoise component, o^om, is the variance of a noise source that iscommon to all the members, and the second, erf, is the variance ofa noise source that is unique to each member. To arrive at a groupdecision, the members' judgments must be combined in somemanner. In a specific decision situation, the members might ex-press their judgments as binary responses (yes, no), continuous(graded) ratings of estimated signal likelihood or in other ways.The group decision process might include the exchange of infor-mation among the members about member likelihood estimates,confidence, and biases.
Ideal Group Model
An additional benefit of detection theory is that it enables one tospecify the behavior of the statistically optimal or ideal detectionsystem (Green & Swets, 1966; Tanner & Birdsall, 1958). By
definition, an ideal detection system uses an optimal decision rule(one based on a likelihood ratio statistic) and suffers from noadditional sources of noise or error. On average, an ideal detectionsystem will produce the most accurate detection performance. Theideal analysis informs us about important task variables and howthey may influence human performance.
Figure 3 shows how the general group signal-detection para-digm is modified to arrive at the ideal detection system of Sorkinand Dai (1994). They assumed that, although the unique noisesource to each member is independent of the noise to any othermember, the magnitude of the unique sources is constant across thearray of members and is equal to ofnd; that is, <J\ — of = • • • =ofnd. Then each member's estimate, Xt, will be normally distrib-uted with a mean of ju, or 0 (respectively, depending on whetherthe trial was a signal-plus-noise or noise-alone trial) and with avariance equal to the sum of the common and unique noisevariances. The index of detection sensitivity, d\, for an individualmember is the difference between the means of the input onsignal-plus-noise and noise-alone trials, divided by the square rootof the total noise variance:
d'^^(crlom + crid)1'2. (1)
By definition, the correlation p between any pair of members is
p = oiom/(c75om + o-L). (2)
Normalizing the total variance,
Then,
= P. ofnt = 1 - p. (4)
input {signal, no signal)
Group Decision Process
Figure 2. Diagram of a group signal-detection system composed of m members. Each member is subjected totwo sources of Gaussian noise: one unique (of) and one common (ofotnmon) to the other members. The memberoutputs are combined to form the group decision (see text).
GROUP SIGNAL DETECTION
input {signal, no signal}
187
{yes, no}
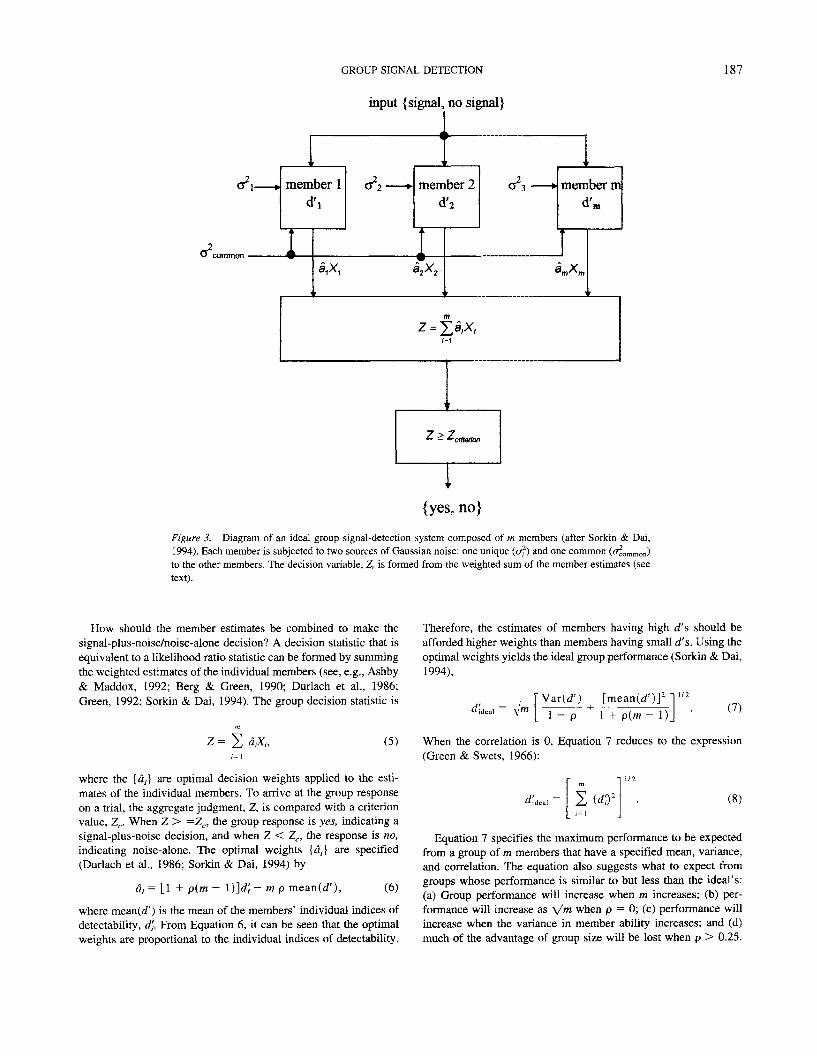
Figure 3. Diagram of an ideal group signal-detection system composed of m members (after Sorkin & Dai,1994). Each member is subjected to two sources of Gaussian noise: one unique (of) and one common (<^0mmon)to the other members. The decision variable, Z, is formed from the weighted sum of the member estimates (seetext).
How should the member estimates be combined to make thesignal-plus-noise/noise-alone decision? A decision statistic that isequivalent to a likelihood ratio statistic can be formed by summingthe weighted estimates of the individual members (see, e.g., Ashby& Maddox, 1992; Berg & Green, 1990; Durlach et al, 1986;Green, 1992; Sorkin & Dai, 1994). The group decision statistic is
where the {at} are optimal decisionmates of the individual members. Toon a trial, the aggregate judgment, Z,value, Zc. When Z > =ZC, the groupsignal-plus-noise decision, and whenindicating noise-alone. The optimal(Durlach et al., 1986; Sorkin & Dai,
r,, (5)
weights applied to the esti-arrive at the group responseis compared with a criterionresponse is yes, indicating aZ < Zc, the response is no,weights {dt} are specified1994) by
a,•• = [1 + p(m — l)]d'i — m p mean(rf'). (6)
where mean(rf') is the mean of the members' individual indices ofdetectability, d',. From Equation 6, it can be seen that the optimalweights are proportional to the individual indices of detectability.
Therefore, the estimates of members having high d's should beafforded higher weights than members having small d's. Using theoptimal weights yields the ideal group performance (Sorkin & Dai,1994),
TVar(d') [mean(J')]2
(7)
When the correlation is 0, Equation 7 reduces to the expression(Green & Swets, 1966):
(8)
Equation 7 specifies the maximum performance to be expectedfrom a group of m members that have a specified mean, variance,and correlation. The equation also suggests what to expect fromgroups whose performance is similar to but less than the ideal's:(a) Group performance will increase when m increases; (b) per-formance will increase as \/m when p = 0; (c) performance willincrease when the variance in member ability increases; and (d)much of the advantage of group size will be lost when p > 0.25.
188 SORKIN, HAYS, AND WEST
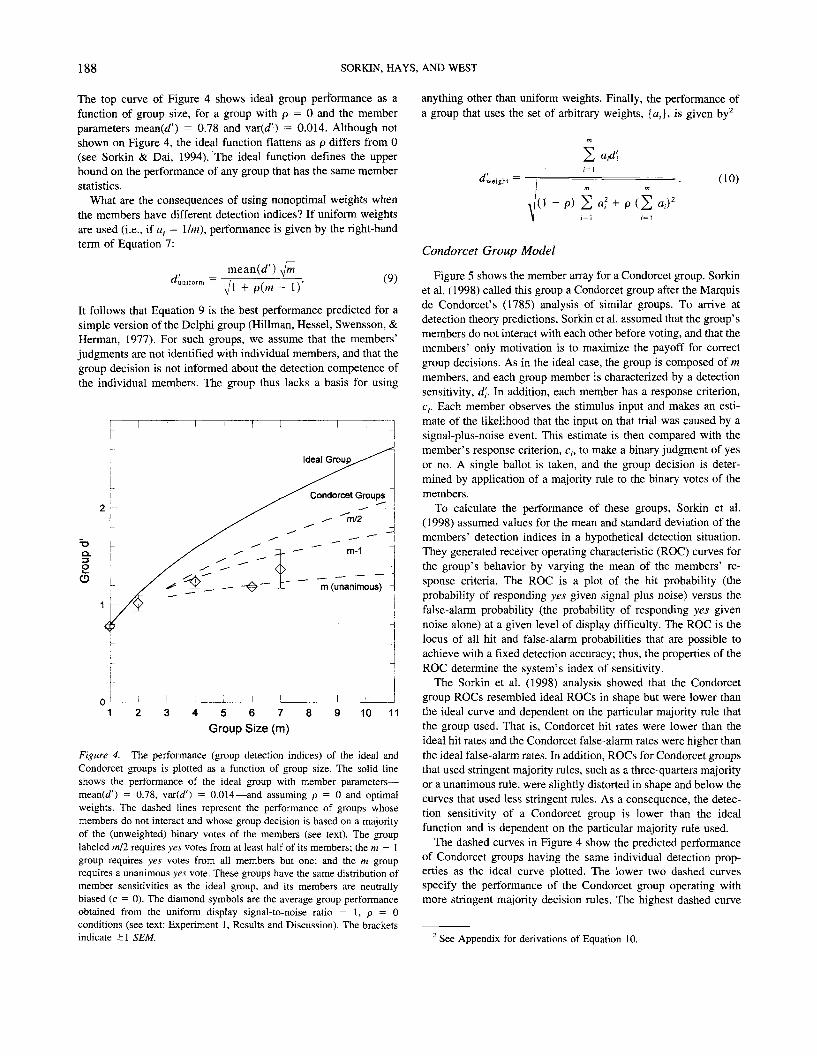
The top curve of Figure 4 shows ideal group performance as afunction of group size, for a group with p = 0 and the memberparameters mean(d') = 0.78 and var(rf') = 0.014. Although notshown on Figure 4, the ideal function flattens as p differs from 0(see Sorkin & Dai, 1994). The ideal function defines the upperbound on the performance of any group that has the same memberstatistics.
What are the consequences of using nonoptimal weights whenthe members have different detection indices? If uniform weightsare used (i.e., if a,- = Urn), performance is given by the right-handterm of Equation 7:
anything other than uniform weights. Finally, the performance ofa group that uses the set of arbitrary weights, {a,}, is given by2
^uniform
mean(rf') ^Jm
Vl +p(m- 1)'(9)
It follows that Equation 9 is the best performance predicted for asimple version of the Delphi group (Hillman, Hessel, Swensson, &Herman, 1977). For such groups, we assume that the members'judgments are not identified with individual members, and that thegroup decision is not informed about the detection competence ofthe individual members. The group thus lacks a basis for using
•oa.13
4 5 6 7 8Group Size (m)
10 11
Figure 4. The performance (group detection indices) of the ideal andCondorcet groups is plotted as a function of group size. The solid lineshows the performance of the ideal group with member parameters—mean(d') = 0.78, var(d') = 0.014—and assuming p = 0 and optimalweights. The dashed lines represent the performance of groups whosemembers do not interact and whose group decision is based on a majorityof the (unweighted) binary votes of the members (see text). The grouplabeled mil requires yes votes from at least half of its members; the m - 1group requires yes votes from all members but one; and the m grouprequires a unanimous yes vote. These groups have the same distribution ofmember sensitivities as the ideal group, and its members are neutrallybiased (c = 0). The diamond symbols are the average group performanceobtained from the uniform display signal-to-noise ratio = 1, p = 0conditions (see text: Experiment 1, Results and Discussion). The bracketsindicate ±1 SEM.
ight (10)
-p)
Condorcet Group Model
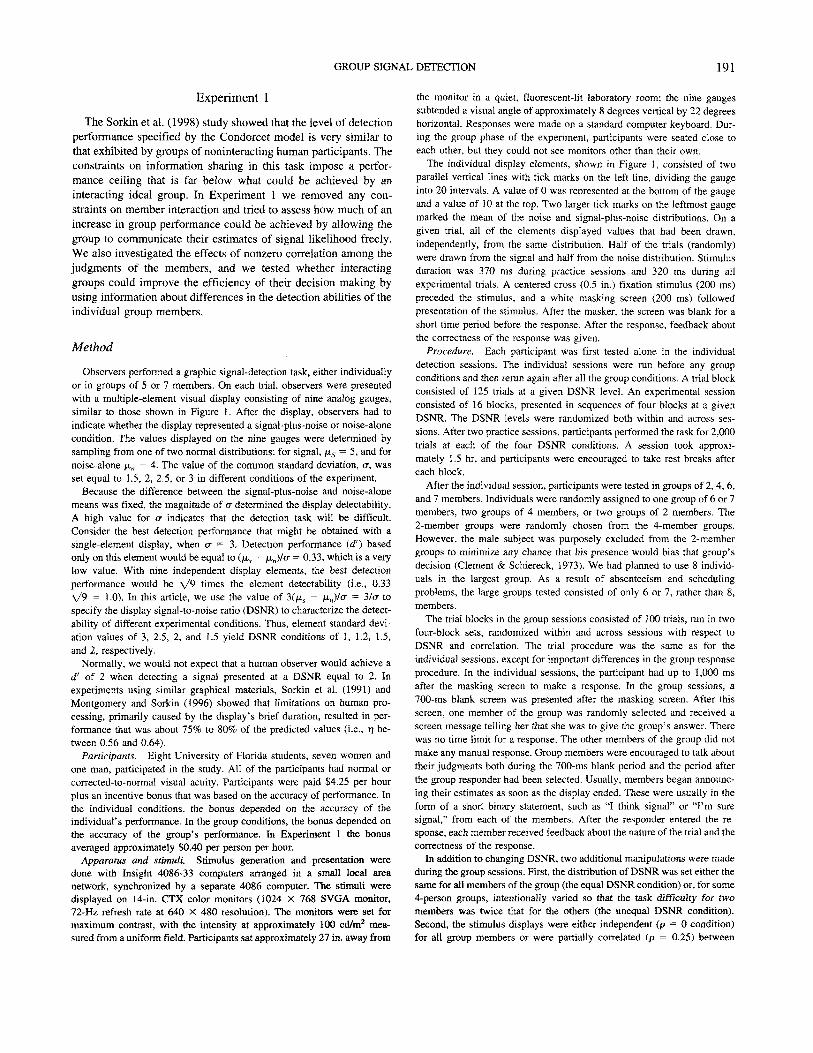
Figure 5 shows the member array for a Condorcet group. Sorkinet al. (1998) called this group a Condorcet group after the Marquisde Condorcet's (1785) analysis of similar groups. To arrive atdetection theory predictions, Sorkin et al. assumed that the group'smembers do not interact with each other before voting, and that themembers' only motivation is to maximize the payoff for correctgroup decisions. As in the ideal case, the group is composed of mmembers, and each group member is characterized by a detectionsensitivity, d\. In addition, each member has a response criterion,c,. Each member observes the stimulus input and makes an esti-mate of the likelihood that the input on that trial was caused by asignal-plus-noise event. This estimate is then compared with themember's response criterion, c,, to make a binary judgment of yesor no. A single ballot is taken, and the group decision is deter-mined by application of a majority rule to the binary votes of themembers.
To calculate the performance of these groups, Sorkin et al.(1998) assumed values for the mean and standard deviation of themembers' detection indices in a hypothetical detection situation.They generated receiver operating characteristic (ROC) curves forthe group's behavior by varying the mean of the members' re-sponse criteria. The ROC is a plot of the hit probability (theprobability of responding yes given signal plus noise) versus thefalse-alarm probability (the probability of responding yes givennoise alone) at a given level of display difficulty. The ROC is thelocus of all hit and false-alarm probabilities that are possible toachieve with a fixed detection accuracy; thus, the properties of theROC determine the system's index of sensitivity.
The Sorkin et al. (1998) analysis showed that the Condorcetgroup ROCs resembled ideal ROCs in shape but were lower thanthe ideal curve and dependent on the particular majority rule thatthe group used. That is, Condorcet hit rates were lower than theideal hit rates and the Condorcet false-alarm rates were higher thanthe ideal false-alarm rates. In addition, ROCs for Condorcet groupsthat used stringent majority rules, such as a three-quarters majorityor a unanimous rule, were slightly distorted in shape and below thecurves that used less stringent rules. As a consequence, the detec-tion sensitivity of a Condorcet group is lower than the idealfunction and is dependent on the particular majority rule used.
The dashed curves in Figure 4 show the predicted performanceof Condorcet groups having the same individual detection prop-erties as the ideal curve plotted. The lower two dashed curvesspecify the performance of the Condorcet group operating withmore stringent majority decision rules. The highest dashed curve
1 See Appendix for derivations of Equation 10.

GROUP SIGNAL DETECTION
input {signal, no signal}
189
{yes,no}
Number of YES votes > required majority?
T{yes, no}
Figure 5. Diagram of a Condorcet group signal-detection system composed of m members (after Sorkin, West,& Robinson, 1998). The {d-} are the member detection indices and the {cj are the member response criteria.The decision is based on the majority rule of the members' binary votes (see text).
specifies the performance of the group that uses a simple majorityrule (at least half of the members, m/2, must vote yes); the nextlower dashed curve is produced by the more stringent rule (all butone member must vote yes); and the lowest dashed curve isproduced by the unanimous rule (all members must vote yes).Nonzero levels of p produce qualitatively similar curves withsmaller absolute differences between the performance of the dif-ferent majority rules (not shown).
We have replotted the ideal and Condorcet curves on logarith-mic coordinates in Figure 6, along with those for a higher averagedetection index of 1.5. Plotting these curves on log-log coordinatesallows one to compare the growth rate of the functions with earlierpsychophysical models. In the ideal case, the group detectionsensitivity increases with group size with an exponent of 0.5, thesquare root. The OI model, of course, has a slope that is identicalto the ideal. The detection index increases at a lesser rate for theCondorcet model; the slopes in the simple majority, m - I , andunanimous cases are approximately 0.43, 0.31, and 0.16, respec-tively, and are approximately the same for the two different d'levels considered. Citing an analysis by T. Birdsall, Swets (1984)estimated that, at midlevel signals and midrange criterion values,the DC model produces slopes of about one third. These slopes arevery close to the Condorcet, m — 1 case.
In addition to their theoretical analysis of the Condorcet group,Sorkin et al. (1998) asked several questions about the performance
of groups of human observers under Condorcet-type task con-straints. First, would one obtain the predicted decreases in theperformance of the human groups as the majority rule was mademore stringent? Second, would a more stringent rule produce achange in the behavior of the individual participants? A morestringent rule should cause the group hit and false-alarm rates todecrease, resulting in more conservative overall performance. Thequestion was whether this would have an effect on the member'sindividual detection sensitivities or decision criteria. Specifically,would forcing the group decision to be more conservative causethe members to shift toward more liberal response criteria? Sorkinet al. (1998) ran groups of from 5 to 7 people in a visual signal-detection task in which the group members did not communicatewith each other and the group decision was automatically deter-mined by the majority rule of the binary votes of the members. Thegroups of human participants exhibited the same behavior as themodel. Performance was best for the simple majority rule andworst for the unanimous rule. Two-third and three-quarter majorityrules produced appropriately ordered intermediate levels of per-formance. Some participants adopted more liberal response criteriawhen the majority rule was more strict. Sorkin et al. (1998) notedthat group members can reduce the effect of a strict majority ruleon the group criterion by making their individual criteria moreliberal, but they cannot undo the deleterious effect of a strictermajority rule on the group's performance accuracy.

190 SORKIN, HAYS, AND WEST
=0 2.0 -Q.
Eo
3 4 5
Group Size6 7 8 910
Figure 6. The performance (group detection indices) of the ideal andCondorcet groups is plotted as a function of group size for two levels ofdisplay difficulty (log-log coordinates). In each case the upper solid lineshows the performance of the ideal group and the shorter lines show theCondorcet groups. The diamond symbols (and dashed line) show theaverage group performance from the uniform display signal-to-noise ra-tio = 1, p = 0 conditions (see text: Experiment 1, Results and Discussion).The brackets indicate ± 1 SEM.
Group Efficiency
It is useful to have a summary measure that describes how muchthe observed performance of a group of human observers differsfrom that of a hypothetical reference group such as the ideal groupor the Condorcet group. The degree to which the performance ofthe real group is less than a reference optimal level is given by theefficiency measure, t) (Tanner & Birdsall, 1958), where
17 ="observed I
did, (11)
Efficiency is defined as a ratio of squared rf's, because in manysensory situations (4'deai)2 is proportional to signal energy. Thus,an efficiency of 0.60 means that an optimal detector could matchthe human's performance with a signal that contained only 60% ofthe energy needed by the human.
Obtaining a measure of a human group's efficiency depends onhaving an appropriate definition of the "ideal" reference group tobe compared with the human group. The first piece of informationneeded to specify the reference group is the set of individualdetection indices of the human group's members. In some exper-iments, it may be difficult to determine these indices from themembers' or group's behavior. The second piece of information
needed is the extent to which the observations of the humanmembers are correlated, so that the appropriate correlation can bespecified for the members of the reference group. Again, it may bedifficult to determine the nature of this correlation without makingadditional assumptions or performing additional experiments. Thelast piece of information needed concerns the presence of anyexternal constraints on the interaction and decision making of thehuman members in the task. For example, if group members werenot allowed to interact and their decision was determined by abinary vote, it would be reasonable to define optimal performanceby using the Condorcet rather than the ideal group model as areference. Once the member indices, correlation among observa-tions, and interaction constraints have been specified for the ref-erence group, one can compare the performance of the human andreference groups and calculate a measure of the overall efficiencyof the human group's performance.
Given that one has obtained a measure of overall efficiency, itmay be possible to factor this measure into subordinate factors thatdescribe different aspects of the group's performance. For exam-ple, one may wish to specify how much of the loss in overalldetection efficiency is due to changes in the individual detectionefforts of the members or to inefficiencies in combining themembers' judgments into a group decision. Different membersmay make numerical judgments of signal likelihood in differentways, and this variability may lead to decreased accuracy in thegroup's decision. Perhaps the group gives inappropriate weight tothe estimates from some members. Rather than weight each mem-ber's judgment in proportion to that member's expertise, the groupmay weight all members' judgments equally or even pathologi-cally (e.g., by giving higher weights to the least competent orloudest members). Later, we develop a technique for quantifyingthese different sources of inefficiency.
In Experiment 1 of this study, we intentionally manipulated thecorrelation between member judgments by controlling the corre-lation between the stimuli presented to different members. Thisallowed us to examine the effects of member correlation on groupperformance. We also tested the possibility that the group's per-formance would be degraded by use of an inappropriate weightingstrategy. To assess that possibility, we calculated the weights givento the judgments of individual members of different groups. Inaddition, we varied the difficulty of the detection task (i.e., thedisplay signal-to-noise ratio) for each member of a group so thatthe detection performance of some of the group's members wouldbe approximately twice that of the others. The group was able tosense this discrepancy in member competence and use appropriateweights in its decisions.
The performance of the larger groups in Experiment 1 suggestedthat they might have been operating under some restrictions inbetween-member interaction, possibly because of the way theexperiment was conducted. Therefore, Experiment 2 was designedto optimize the effectiveness of between-member communication.We also measured detection efficiency much more accurately byassessing the detection effort of each member of the group whileperforming the group task. A major interest in Experiment 2 wasto observe the effect of group size on efficiency. We were able tocalculate a precise measure of overall efficiency and to separatelyquantify losses in efficiency caused by (a) changes in the individ-ual detection efforts of the members and (b) the inefficient aggre-gation of member judgments.
GROUP SIGNAL DETECTION 191
Experiment 1
The Sorkin et al. (1998) study showed that the level of detectionperformance specified by the Condorcet model is very similar tothat exhibited by groups of noninteracting human participants. Theconstraints on information sharing in this task impose a perfor-mance ceiling that is far below what could be achieved by aninteracting ideal group. In Experiment 1 we removed any con-straints on member interaction and tried to assess how much of anincrease in group performance could be achieved by allowing thegroup to communicate their estimates of signal likelihood freely.We also investigated the effects of nonzero correlation among thejudgments of the members, and we tested whether interactinggroups could improve the efficiency of their decision making byusing information about differences in the detection abilities of theindividual group members.
Method
Observers performed a graphic signal-detection task, either individuallyor in groups of 5 or 7 members. On each trial, observers were presentedwith a multiple-element visual display consisting of nine analog gauges,similar to those shown in Figure 1. After the display, observers had toindicate whether the display represented a signal-plus-noise or noise-alonecondition. The values displayed on the nine gauges were determined bysampling from one of two normal distributions: for signal, jx5 = 5, and fornoise-alone jxn = 4. The value of the common standard deviation, a, wasset equal to 1.5, 2, 2.5, or 3 in different conditions of the experiment.
Because the difference between the signal-plus-noise and noise-alonemeans was fixed, the magnitude of o- determined the display detectability.A high value for cr indicates that the detection task will be difficult.Consider the best detection performance that might be obtained with asingle-element display, when cr = 3. Detection performance (<f) basedonly on this element would be equal to (fis — t^n)/cr = 0.33, which is a verylow value. With nine independent display elements, the best detectionperformance would be \/9 times the element detectability (i.e., 0.33V9 = 1-0). In this article, we use the value of 3(/x, — №„)/& = 3/cr tospecify the display signal-to-noise ratio (DSNR) to characterize the detect-ability of different experimental conditions. Thus, element standard devi-ation values of 3, 2.5, 2, and 1.5 yield DSNR conditions of 1, 1.2, 1.5,and 2, respectively.
Normally, we would not expect that a human observer would achieve ad' of 2 when detecting a signal presented at a DSNR equal to 2. Inexperiments using similar graphical materials, Sorkin et al. (1991) andMontgomery and Sorkin (1996) showed that limitations on human pro-cessing, primarily caused by the display's brief duration, resulted in per-formance that was about 75% to 80% of the predicted values (i.e., TJ be-
tween 0.56 and 0.64).Participants. Eight University of Florida students, seven women and
one man, participated in the study. All of the participants had normal orcorrected-to-normal visual acuity. Participants were paid $4.25 per hourplus an incentive bonus that was based on the accuracy of performance. Inthe individual conditions, the bonus depended on the accuracy of theindividual's performance. In the group conditions, the bonus depended onthe accuracy of the group's performance. In Experiment 1 the bonusaveraged approximately $0.40 per person per hour.
Apparatus and stimuli. Stimulus generation and presentation weredone with Insight 4086-33 computers arranged in a small local areanetwork, synchronized by a separate 4086 computer. The stimuli weredisplayed on 14-in. CTX color monitors (1024 X 768 SVGA monitor,72-Hz refresh rate at 640 X 480 resolution). The monitors were set formaximum contrast, with the intensity at approximately 100 cd/m2 mea-sured from a uniform field. Participants sat approximately 27 in. away from
the monitor in a quiet, fluorescent-lit laboratory room; the nine gaugessubtended a visual angle of approximately 8 degrees vertical by 22 degreeshorizontal. Responses were made on a standard computer keyboard. Dur-ing the group phase of the experiment, participants were seated close toeach other, but they could not see monitors other than their own.
The individual display elements, shown in Figure 1, consisted of twoparallel vertical lines with tick marks on the left line, dividing the gauge
into 20 intervals. A value of 0 was represented at the bottom of the gaugeand a value of 10 at the top. Two larger tick marks on the leftmost gauge
marked the mean of the noise and signal-plus-noise distributions. On agiven trial, all of the elements displayed values that had been drawn,independently, from the same distribution. Half of the trials (randomly)were drawn from the signal and half from the noise distribution. Stimulusduration was 370 ms during practice sessions and 320 ms during allexperimental trials. A centered cross (0.5 in.) fixation stimulus (200 ms)preceded the stimulus, and a white masking screen (200 ms) followedpresentation of the stimulus. After the masker, the screen was blank for ashort time period before the response. After the response, feedback aboutthe correctness of the response was given.
Procedure. Each participant was first tested alone in the individualdetection sessions. The individual sessions were run before any groupconditions and then rerun again after all the group conditions. A trial blockconsisted of 125 trials at a given DSNR level. An experimental sessionconsisted of 16 blocks, presented in sequences of four blocks at a given
DSNR. The DSNR levels were randomized both within and across ses-sions. After two practice sessions, participants performed the task for 2,000
trials at each of the four DSNR conditions. A session took approxi-mately 1.5 hr, and participants were encouraged to take rest breaks aftereach block.
After the individual session, participants were tested in groups of 2, 4, 6,and 7 members. Individuals were randomly assigned to one group of 6 or 7members, two groups of 4 members, or two groups of 2 members. The2-member groups were randomly chosen from the 4-member groups.However, the male subject was purposely excluded from the 2-membergroups to minimize any chance that his presence would bias that group'sdecision (Clement & Schiereck, 1973). We had planned to use 8 individ-uals in the largest group. As a result of absenteeism and schedulingproblems, the large groups tested consisted of only 6 or 7, rather than 8,members.
The trial blocks in the group sessions consisted of 100 trials, run in twofour-block sets, randomized within and across sessions with respect toDSNR and correlation. The trial procedure was the same as for theindividual sessions, except for important differences in the group responseprocedure. In the individual sessions, the participant had up to 1,000 msafter the masking screen to make a response. In the group sessions, a700-ms blank screen was presented after the masking screen. After thisscreen, one member of the group was randomly selected and received ascreen message telling her that she was to give the group's answer. Therewas no time limit for a response. The other members of the group did notmake any manual response. Group members were encouraged to talk abouttheir judgments both during the 700-ms blank period and the period afterthe group responder had been selected. Usually, members began announc-ing their estimates as soon as the display ended. These were usually in the
form of a short binary statement, such as "I think signal" or "I'm suresignal," from each of the members. After the responder entered the re-sponse, each member received feedback about the nature of the trial and thecorrectness of the response.
In addition to changing DSNR, two additional manipulations were madeduring the group sessions. First, the distribution of DSNR was set either thesame for all members of the group (the equal DSNR condition) or, for some4-person groups, intentionally varied so that the task difficulty for twomembers was twice that for the others (the unequal DSNR condition).Second, the stimulus displays were either independent (p = 0 condition)for all group members or were partially correlated (p = 0.25) between
192 SORKIN, HAYS, AND WEST
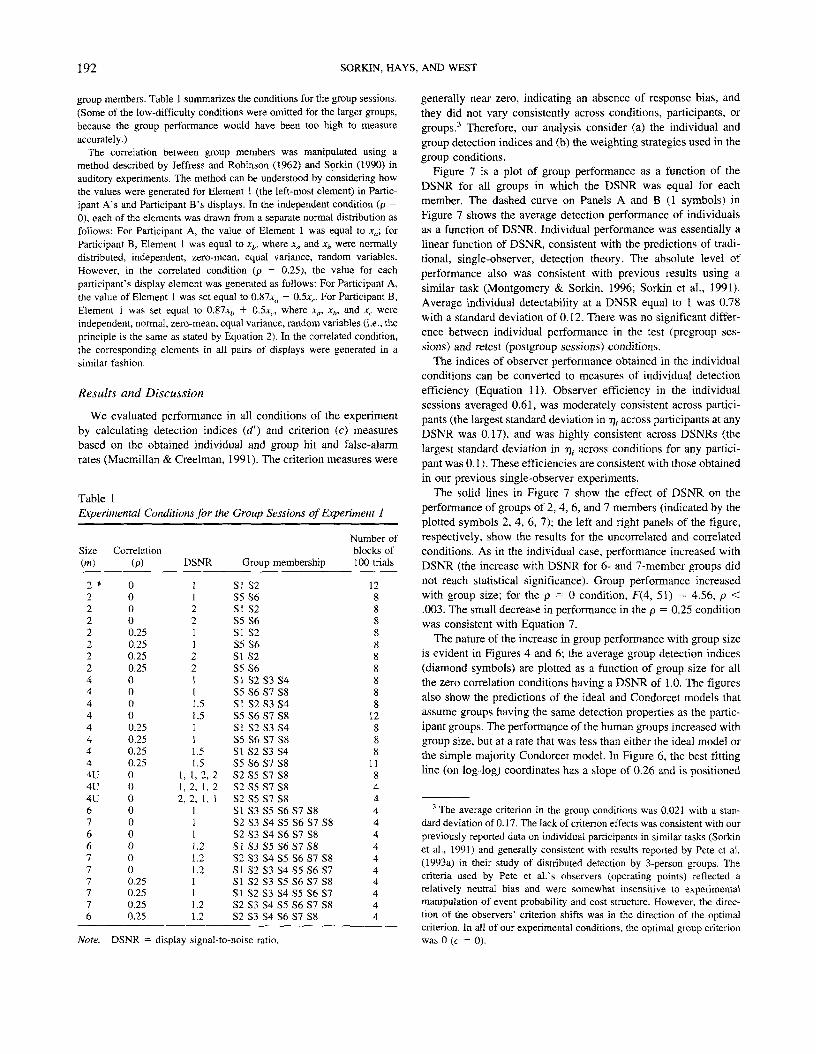
group members. Table 1 summarizes the conditions for the group sessions.(Some of the low-difficulty conditions were omitted for the larger groups,because the group performance would have been too high to measureaccurately.)
The correlation between group members was manipulated using amethod described by Jeffress and Robinson (1962) and Sorkin (1990) inauditory experiments. The method can be understood by considering howthe values were generated for Element 1 (the left-most element) in Partic-ipant A's and Participant B's displays. In the independent condition (p =0), each of the elements was drawn from a separate normal distribution asfollows: For Participant A, the value of Element 1 was equal to xa', forParticipant B, Element 1 was equal to xb, where xa and xh were normallydistributed, independent, zero-mean, equal variance, random variables.However, in the correlated condition (p = 0.25), the value for eachparticipant's display element was generated as follows: For Participant A,the value of Element 1 was set equal to Q.87xa + 0.5xc. For Participant B,Element 1 was set equal to Q.87xb + 0.5xl:, where xa, xh, and xc wereindependent, normal, zero-mean, equal variance, random variables (i.e., theprinciple is the same as stated by Equation 2). In the correlated condition,the corresponding elements in all pairs of displays were generated in asimilar fashion.
Results and Discussion
We evaluated performance in all conditions of the experimentby calculating detection indices (dr) and criterion (c) measuresbased on the obtained individual and group hit and false-alarmrates (Macmillan & Creelman, 1991). The criterion measures were
Table 1Experimental Conditions for the Group Sessions of Experiment 1
Size Correlation(m) (p)
2 »2222222444444444U4U4U6766777776
00000.250.250.250.2500000.250.250.250.250000000000.250.250.250.25
DSNR
11221122111.51.5111.51.5
1, 1 ,2 ,21,2, 1, 22, 2, 1, 1
1111.21.21.2111.21.2
Number ofblocks of
Group membership 100 trials
SI S2S5 S6SI S2S5S6SI S2S5S6SI S2S5 S6SI S2 S3 S4S5 S6 S7 S8SI S2 S3 S4S5 S6 S7 S8SI S2 S3 S4S5 S6 S7 S8SI S2 S3 S4S5 S6 S7 S8S2 S5 S7 S8S2 S5 S7 S8S2 S5 S7 S8SI S3 S5 S6 S7 S8S2 S3 S4 S5 S6 S7 S8S2 S3 S4 S6 S7 S8SI S3 S5 S6S7S8S2 S3 S4 S5 S6 S7 S8SI S2 S3 S4S5 S6S7SI S2 S3 S5 S6 S7 S8SI S2 S3 S4 S5 S6S7S2 S3 S4 S5 S6 S7 S8S2 S3 S4 S6 S7 S8
128888888888
12888
118444444444444
generally near zero, indicating an absence of response bias, andthey did not vary consistently across conditions, participants, orgroups.3 Therefore, our analysis consider (a) the individual andgroup detection indices and (b) the weighting strategies used in thegroup conditions.
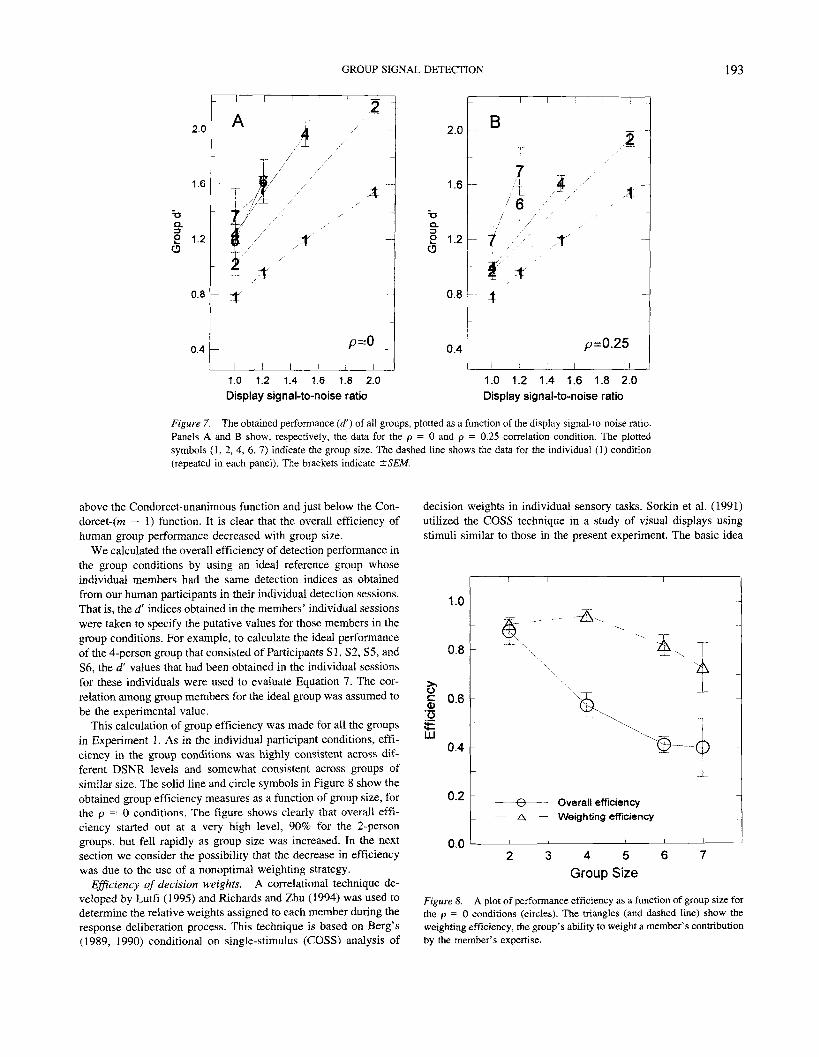
Figure 7 is a plot of group performance as a function of theDSNR for all groups in which the DSNR was equal for eachmember. The dashed curve on Panels A and B (1 symbols) inFigure 7 shows the average detection performance of individualsas a function of DSNR. Individual performance was essentially alinear function of DSNR, consistent with the predictions of tradi-tional, single-observer, detection theory. The absolute level ofperformance also was consistent with previous results using asimilar task (Montgomery & Sorkin, 1996; Sorkin et al., 1991).Average individual detectability at a DNSR equal to 1 was 0.78with a standard deviation of 0.12. There was no significant differ-ence between individual performance in the test (pregroup ses-sions) and retest (postgroup sessions) conditions.
The indices of observer performance obtained in the individualconditions can be converted to measures of individual detectionefficiency (Equation 11). Observer efficiency in the individualsessions averaged 0.61, was moderately consistent across partici-pants (the largest standard deviation in 77,. across participants at anyDSNR was 0.17), and was highly consistent across DSNRs (thelargest standard deviation in 17,. across conditions for any partici-pant was 0.1). These efficiencies are consistent with those obtainedin our previous single-observer experiments.
The solid lines in Figure 7 show the effect of DSNR on theperformance of groups of 2, 4, 6, and 7 members (indicated by theplotted symbols 2, 4, 6, 7); the left and right panels of the figure,respectively, show the results for the uncorrelated and correlatedconditions. As in the individual case, performance increased withDSNR (the increase with DSNR for 6- and 7-member groups didnot reach statistical significance). Group performance increasedwith group size; for the p = 0 condition, F(4, 51) = 4.56, p <.003. The small decrease in performance in the p = 0.25 conditionwas consistent with Equation 7.
The nature of the increase in group performance with group sizeis evident in Figures 4 and 6; the average group detection indices(diamond symbols) are plotted as a function of group size for allthe zero correlation conditions having a DSNR of 1.0. The figuresalso show the predictions of the ideal and Condorcet models thatassume groups having the same detection properties as the partic-ipant groups. The performance of the human groups increased withgroup size, but at a rate that was less than either the ideal model orthe simple majority Condorcet model. In Figure 6, the best fittingline (on log-log) coordinates has a slope of 0.26 and is positioned
Note. DSNR = display signal-to-noise ratio.
3 The average criterion in the group conditions was 0.021 with a stan-dard deviation of 0.17. The lack of criterion effects was consistent with ourpreviously reported data on individual participants in similar tasks (Sorkinet al., 1991) and generally consistent with results reported by Pete et al.(1993a) in their study of distributed detection by 3-person groups. Thecriteria used by Pete et al.'s observers (operating points) reflected arelatively neutral bias and were somewhat insensitive to experimentalmanipulation of event probability and cost structure. However, the direc-tion of the observers' criterion shifts was in the direction of the optimalcriterion. In all of our experimental conditions, the optimal group criterionwas 0 (c = 0).
GROUP SIGNAL DETECTION 193
2.0
1.6
0.
I 1.2CD
0.8
0.4 -
/
2.0
1.6
a.B 1.2
0.8
0.4
B
f /'
r
p=0.25
1.0 1.2 1.4 1.6 1.8 2.0
Display signal-to-noise ratio1.0 1.2 1.4 1.6 1.8 2.0Display signal-to-noise ratio
Figure 7. The obtained performance (</') of all groups, plotted as a function of the display signal-to-noise ratio.Panels A arid B show, respectively, the data for the p = 0 and p = 0.25 correlation condition. The plottedsymbols (1, 2, 4, 6, 7) indicate the group size. The dashed line shows the data for the individual (1) condition(repeated in each panel). The brackets indicate ±SEM.
above the Condorcet-unanimous function and just below the Con-dorcet-(m — 1) function. It is clear that the overall efficiency ofhuman group performance decreased with group size.
We calculated the overall efficiency of detection performance inthe group conditions by using an ideal reference group whoseindividual members had the same detection indices as obtainedfrom our human participants in their individual detection sessions.That is, the d' indices obtained in the members' individual sessionswere taken to specify the putative values for those members in thegroup conditions. For example, to calculate the ideal performanceof the 4-person group that consisted of Participants SI, S2, S5, andS6, the d' values that had been obtained in the individual sessionsfor these individuals were used to evaluate Equation 7. The cor-relation among group members for the ideal group was assumed tobe the experimental value.
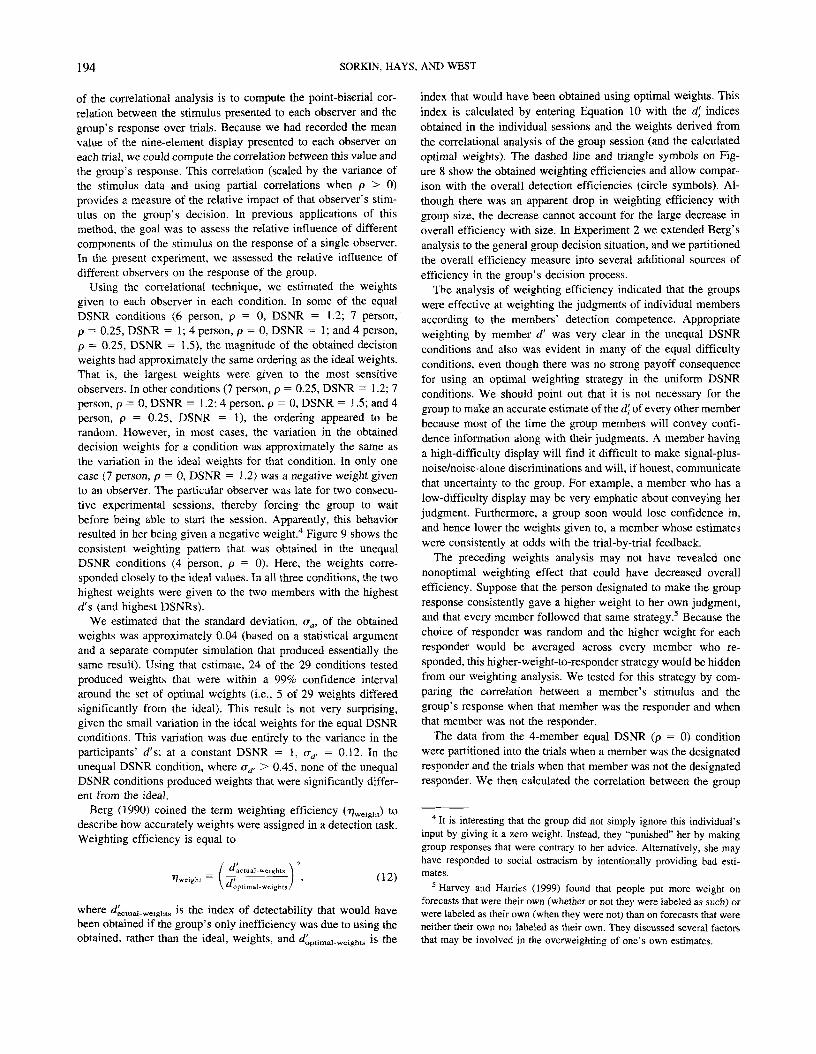
This calculation of group efficiency was made for all the groupsin Experiment 1. As in the individual participant conditions, effi-ciency in the group conditions was highly consistent across dif-ferent DSNR levels and somewhat consistent across groups ofsimilar size. The solid line and circle symbols in Figure 8 show theobtained group efficiency measures as a function of group size, forthe p = 0 conditions. The figure shows clearly that overall effi-ciency started out at a very high level, 90% for the 2-persongroups, but fell rapidly as group size was increased. In the nextsection we consider the possibility that the decrease in efficiencywas due to the use of a nonoptimal weighting strategy.
Efficiency of decision weights. A correlational technique de-veloped by Lutfi (1995) and Richards and Zhu (1994) was used todetermine the relative weights assigned to each member during theresponse deliberation process. This technique is based on Berg's(1989, 1990) conditional on single-stimulus (COSS) analysis of
decision weights in individual sensory tasks. Sorkin et al. (1991)utilized the COSS technique in a study of visual displays usingstimuli similar to those in the present experiment. The basic idea
1.0
0.8
g 0-8'ofcill
0.4
0.2
0.0
1̂
--O
— Overall efficiency— Weighting efficiency
2 3 4 5 6 7
Group Size
Figure 8. A plot of performance efficiency as a function of group size forthe p = 0 conditions (circles). The triangles (and dashed line) show theweighting efficiency, the group's ability to weight a member's contributionby the member's expertise.
194 SORKIN, HAYS, AND WEST
of the correlational analysis is to compute the point-biserial cor-relation between the stimulus presented to each observer and thegroup's response over trials. Because we had recorded the meanvalue of the nine-element display presented to each observer oneach trial, we could compute the correlation between this value andthe group's response. This correlation (scaled by the variance ofthe stimulus data and using partial correlations when p > 0)provides a measure of the relative impact of that observer's stim-ulus on the group's decision. In previous applications of thismethod, the goal was to assess the relative influence of differentcomponents of the stimulus on the response of a single observer.In the present experiment, we assessed the relative influence ofdifferent observers on the response of the group.
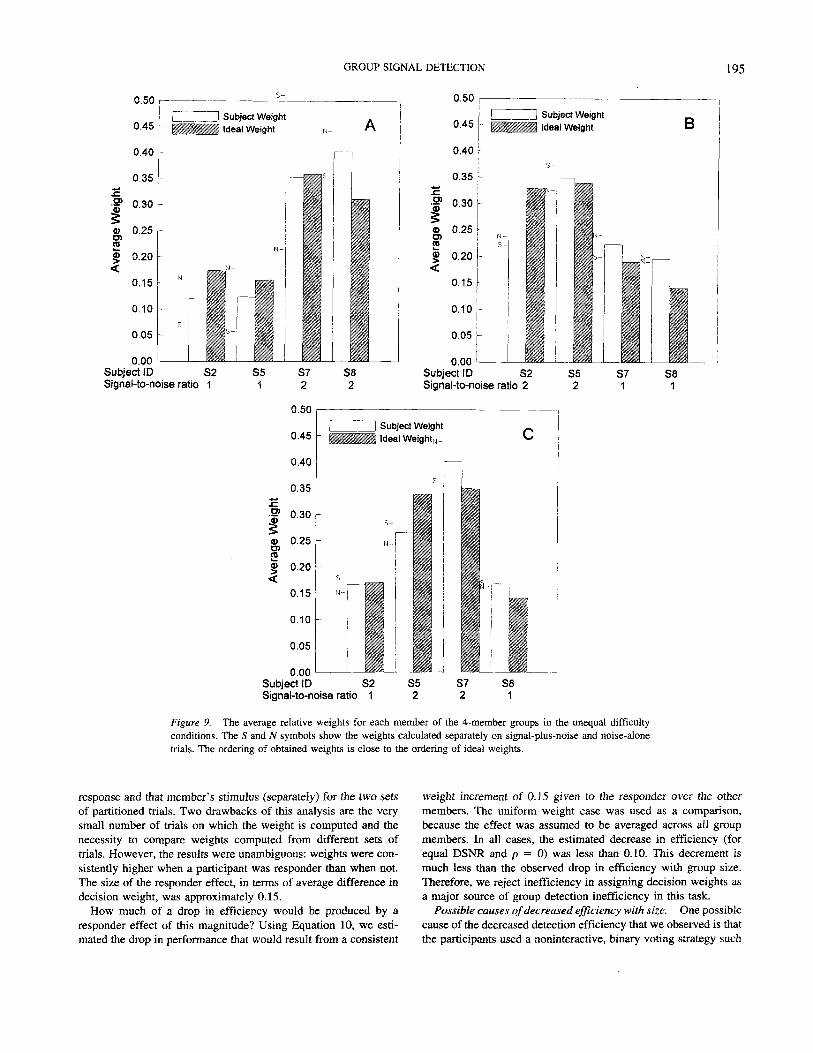
Using the correlational technique, we estimated the weightsgiven to each observer in each condition. In some of the equalDSNR conditions (6 person, p = 0, DSNR = 1.2; 7 person,p = 0.25, DSNR = 1; 4 person, p = 0, DSNR = 1; and 4 person,p = 0.25, DSNR = 1.5), the magnitude of the obtained decisionweights had approximately the same ordering as the ideal weights.That is, the largest weights were given to the most sensitiveobservers. In other conditions (7 person, p = 0.25, DSNR = 1.2; 7person, p = 0, DSNR = 1.2; 4 person, p = 0, DSNR = 1.5; and 4person, p = 0.25, DSNR = 1), the ordering appeared to berandom. However, in most cases, the variation in the obtaineddecision weights for a condition was approximately the same asthe variation in the ideal weights for that condition. In only onecase (7 person, p = 0, DSNR = 1.2) was a negative weight givento an observer. The particular observer was late for two consecu-tive experimental sessions, thereby forcing the group to waitbefore being able to start the session. Apparently, this behaviorresulted in her being given a negative weight.4 Figure 9 shows theconsistent weighting pattern that was obtained in the unequalDSNR conditions (4 person, p = 0). Here, the weights corre-sponded closely to the ideal values. In all three conditions, the twohighest weights were given to the two members with the highestd's (and highest DSNRs).
We estimated that the standard deviation, cra, of the obtainedweights was approximately 0.04 (based on a statistical argumentand a separate computer simulation that produced essentially thesame result). Using that estimate, 24 of the 29 conditions testedproduced weights that were within a 99% confidence intervalaround the set of optimal weights (i.e., 5 of 29 weights differedsignificantly from the ideal). This result is not very surprising,given the small variation in the ideal weights for the equal DSNRconditions. This variation was due entirely to the variance in theparticipants' d's; at a constant DSNR = 1, ad. = 0.12. In theunequal DSNR condition, where <jd. > 0.45, none of the unequalDSNR conditions produced weights that were significantly differ-ent from the ideal.
Berg (1990) coined the term weighting efficiency (T)weight) todescribe how accurately weights were assigned in a detection task.Weighting efficiency is equal to
^weight"actual-weights
at-weights(12)
index that would have been obtained using optimal weights. Thisindex is calculated by entering Equation 10 with the d\ indicesobtained in the individual sessions and the weights derived fromthe correlational analysis of the group session (and the calculatedoptimal weights). The dashed line and triangle symbols on Fig-ure 8 show the obtained weighting efficiencies and allow compar-ison with the overall detection efficiencies (circle symbols). Al-though there was an apparent drop in weighting efficiency withgroup size, the decrease cannot account for the large decrease inoverall efficiency with size. In Experiment 2 we extended Berg'sanalysis to the general group decision situation, and we partitionedthe overall efficiency measure into several additional sources ofefficiency in the group's decision process.
The analysis of weighting efficiency indicated that the groupswere effective at weighting the judgments of individual membersaccording to the members' detection competence. Appropriateweighting by member d' was very clear in the unequal DSNRconditions and also was evident in many of the equal difficultyconditions, even though there was no strong payoff consequencefor using an optimal weighting strategy in the uniform DSNRconditions. We should point out that it is not necessary for thegroup to make an accurate estimate of the d', of every other memberbecause most of the time the group members will convey confi-dence information along with their judgments. A member havinga high-difficulty display will find it difficult to make signal-plus-noise/noise-alone discriminations and will, if honest, communicatethat uncertainty to the group. For example, a member who has alow-difficulty display may be very emphatic about conveying herjudgment. Furthermore, a group soon would lose confidence in,and hence lower the weights given to, a member whose estimateswere consistently at odds with the trial-by-trial feedback.
The preceding weights analysis may not have revealed onenonoptimal weighting effect that could have decreased overallefficiency. Suppose that the person designated to make the groupresponse consistently gave a higher weight to her own judgment,and that every member followed that same strategy.5 Because thechoice of responder was random and the higher weight for eachresponder would be averaged across every member who re-sponded, this higher-weight-to-responder strategy would be hiddenfrom our weighting analysis. We tested for this strategy by com-paring the correlation between a member's stimulus and thegroup's response when that member was the responder and whenthat member was not the responder.
The data from the 4-member equal DSNR (p = 0) conditionwere partitioned into the trials when a member was the designatedresponder and the trials when that member was not the designatedresponder. We then calculated the correlation between the group
where ^actual-weights K me index of detectability that would havebeen obtained if the group's only inefficiency was due to using theobtained, rather than the ideal, weights, and <,ptimai-Weights is tne
4 It is interesting that the group did not simply ignore this individual'sinput by giving it a zero weight. Instead, they "punished" her by makinggroup responses that were contrary to her advice. Alternatively, she mayhave responded to social ostracism by intentionally providing bad esti-mates.
5 Harvey and Harries (1999) found that people put more weight onforecasts that were their own (whether or not they were labeled as such) orwere labeled as their own (when they were not) than on forecasts that wereneither their own nor labeled as their own. They discussed several factorsthat may be involved in the overweighting of one's own estimates.
GROUP SIGNAL DETECTION
i | Subject WeightIdeal Weight
0.00Subject ID S2Signal-to-noise ratio 1
0.00Subject IDSignal-to-noise ratio 1
Figure 9. The average relative weights for each member of the 4-member groups in the unequal difficultyconditions. The 5 and N symbols show the weights calculated separately on signal-plus-noise and noise-alonetrials. The ordering of obtained weights is close to the ordering of ideal weights.
response and that member's stimulus (separately) for the two setsof partitioned trials. Two drawbacks of this analysis are the verysmall number of trials on which the weight is computed and thenecessity to compare weights computed from different sets oftrials. However, the results were unambiguous: weights were con-sistently higher when a participant was responder than when not.The size of the responder effect, in terms of average difference indecision weight, was approximately 0.15.
How much of a drop in efficiency would be produced by aresponder effect of this magnitude? Using Equation 10, we esti-mated the drop in performance that would result from a consistent
weight increment of 0.15 given to the responder over the othermembers. The uniform weight case was used as a comparison,because the effect was assumed to be averaged across all groupmembers. In all cases, the estimated decrease in efficiency (forequal DSNR and p = 0) was less than 0.10. This decrement ismuch less than the observed drop in efficiency with group size.Therefore, we reject inefficiency in assigning decision weights asa major source of group detection inefficiency in this task.
Possible causes of decreased efficiency with size. One possiblecause of the decreased detection efficiency that we observed is thatthe participants used a noninteractive, binary voting strategy such
196 SORKIN, HAYS, AND WEST
as used by a Condorcet group. It is difficult to test this hypothesisdirectly. When plotted as a function of group size, the data doresemble the (m - 1) Condorcet function. We monitored theinteractions of our groups and noted that many groups took binaryballots during their deliberations. However, it was apparent thatmembers often communicated graded likelihood information whenthey conveyed their binary votes; that is, they varied the tone oftheir voices from tentative to emphatic and they included descrip-tive phrases such as "I think," "definitely a signal," and "not sure."Furthermore, the observed performance was well below that of theCondorcet simple majority rule, and there is no reason to expectthat the group would have used a more stringent majority rule.
We believe that there are two likely causes and one unlikelycause for the observed decrease in group efficiency with size. Thefirst likely cause is that as the group size was increased, the groupmembers were more rushed, less complete in their deliberations,and effectively more Condorcet like. This possibility is supportedby the fact that there was a small incentive for completing thedeliberations rapidly. We did not record the average deliberationtime in the experiment, but we know that it took much longer tocomplete a 100-trial block with the larger groups. If participantswere attempting to finish the same number of trial blocks persession—to maximize their per hour pay—they would haveworked more hurriedly in the larger groups. To remedy this short-coming in Experiment 2, we attempted to make the number oftrials per hour independent of group size.
The second possible explanation for the efficiency decrease issimply that individual members may have worked less hard anddecreased their detection effort as a function of the group size.Because of the statistical advantage of aggregating observations,even a very small decrement in the detection index for the indi-vidual members will produce a moderate to large decrement ingroup performance. Such small decrements would be very difficultto observe without running a large number of trials. Furthermore,we did not have a precise estimate of the detection index forindividual members during the group sessions. Recall that tocalculate group efficiency we used the individual detection indicesthat had been obtained in separate, individual detection sessionswith each participant. Thus, we had no way of knowing whetherthe individual detection indices varied in different group sizeconditions.
Finally, an unlikely explanation for the observed decrease ingroup efficiency is that the correlation between member observa-tions was actually not zero as set in the experiment. Perhaps thejudgments of members was correlated at some small but signifi-cant level. Experiment 2 was designed to answer all thesequestions.
Experiment 2
The decision task in Experiment 1 had at least two weaknesses.First, it placed a slight premium on making decisions rapidly, andthis may have led the group deliberations to decrease in effective-ness as the groups increased in size. Second, it did not require theindividual members to make a formal signal-noise response oneach trial. We did not require individual responses because wewanted to minimize the chance that members would have a strongcommitment to a particular yes or no decision before the group'sdeliberation on each trial. We thought that the absence of manda-
tory individual decisions would increase the likelihood that mem-bers would contribute graded estimates of signal likelihood to thegroup discussion. We also thought that members would be moreopen to the influence of other members' opinions if they had notcommitted themselves to a binary decision. This turned out to bea weakness in the experiment's design, because, without anyformal response from a member, we could not accurately calculatethe level of detection performance for members in different con-ditions. If a member's detection effort changed as a consequenceof some aspect of the group test situation, such as the group's size,we could not easily detect that result. As a consequence, we wereunable to attribute the observed loss in group efficiency with sizeto a particular cause. However, we were reasonably confident inruling out losses in efficiency resulting from inappropriate weight-ing strategies.
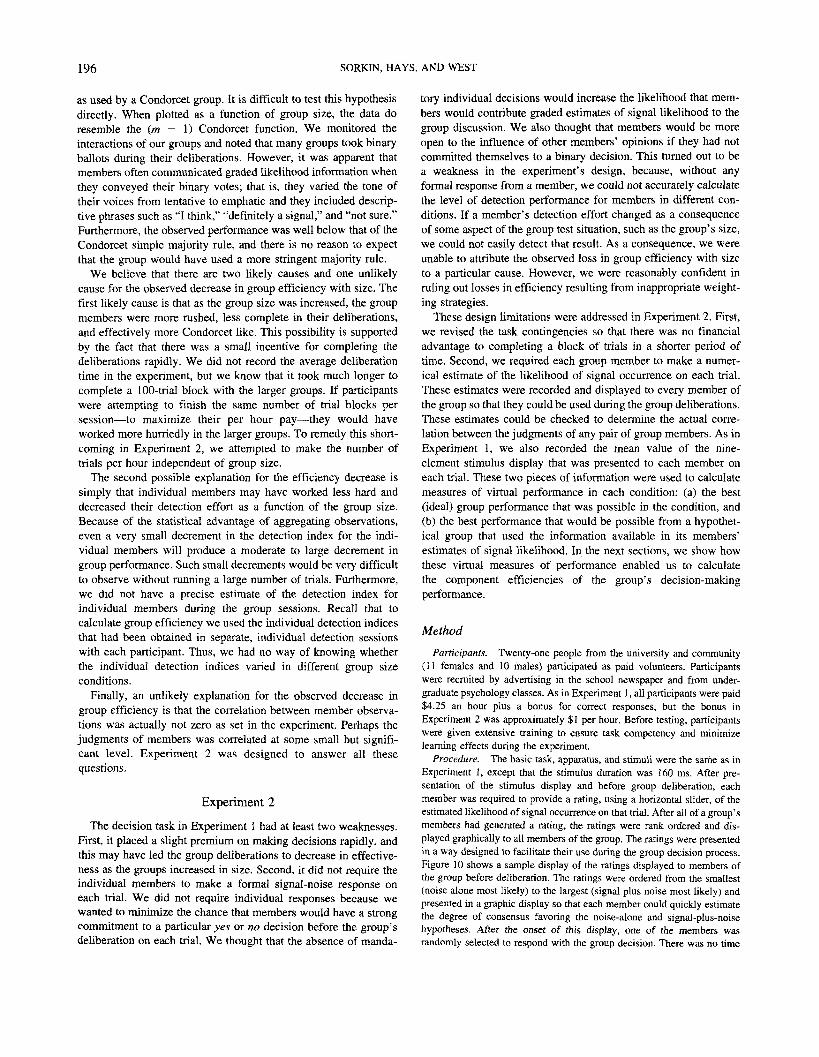
These design limitations were addressed in Experiment 2. First,we revised the task contingencies so that there was no financialadvantage to completing a block of trials in a shorter period oftime. Second, we required each group member to make a numer-ical estimate of the likelihood of signal occurrence on each trial.These estimates were recorded and displayed to every member ofthe group so that they could be used during the group deliberations.These estimates could be checked to determine the actual corre-lation between the judgments of any pair of group members. As inExperiment 1, we also recorded the mean value of the nine-element stimulus display that was presented to each member oneach trial. These two pieces of information were used to calculatemeasures of virtual performance in each condition: (a) the best(ideal) group performance that was possible in the condition, and(b) the best performance that would be possible from a hypothet-ical group that used the information available in its members'estimates of signal likelihood. In the next sections, we show howthese virtual measures of performance enabled us to calculatethe component efficiencies of the group's decision-makingperformance.
Method
Participants. Twenty-one people from the university and community(11 females and 10 males) participated as paid volunteers. Participantswere recruited by advertising in the school newspaper and from under-graduate psychology classes. As in Experiment 1, all participants were paid$4.25 an hour plus a bonus for correct responses, but the bonus inExperiment 2 was approximately $1 per hour. Before testing, participantswere given extensive training to ensure task competency and minimizelearning effects during the experiment.
Procedure. The basic task, apparatus, and stimuli were the same as inExperiment 1, except that the stimulus duration was 160 ms. After pre-sentation of the stimulus display and before group deliberation, eachmember was required to provide a rating, using a horizontal slider, of theestimated likelihood of signal occurrence on that trial. After all of a group'smembers had generated a rating, the ratings were rank ordered and dis-played graphically to all members of the group. The ratings were presentedin a way designed to facilitate their use during the group decision process.Figure 10 shows a sample display of the ratings displayed to members ofthe group before deliberation. The ratings were ordered from the smallest(noise alone most likely) to the largest (signal plus noise most likely) andpresented in a graphic display so that each member could quickly estimatethe degree of consensus favoring the noise-alone and signal-plus-noisehypotheses. After the onset of this display, one of the members wasrandomly selected to respond with the group decision. There was no time

GROUP SIGNAL DETECTION 197
noise (NO)member ratings
signal (YES)
Figure 10. An example of the display of member estimates of signallikelihood on a trial. The members' estimates were displayed from top tobottom in order of their favoring the likelihood of signal-plus-noise on thattrial.
limit to the deliberation process. The number of trial blocks run in eachgroup size condition and the number of trial blocks per experimentalsession were fixed. Participants knew that there was adequate time in thesession for completing the required number of trial blocks. As in Experi-ment 1, the incentive payoff to the individual members was determinedonly by the accuracy of the group's decision. Conversation among groupmembers was allowed and occasionally occurred after the likelihood esti-mates were displayed and until the presentation of the fixation stimulus onthe next trial.
A benefit of the rating display was that the group had an immediateindication whenever a respondent made a response that appeared to beinconsistent with the members' ratings. Such responses, although very rare,often were noted by verbal comment or complaint from group members.Because the graphic display ordered the responses in terms of ratingmagnitude, it may have been difficult for the group members to identifyratings with particular members. In most cases, however, the authorship ofan apparently deviant rating was often either volunteered or otherwiseevident by the end of the trial.
Table 2 summarizes the groups and conditions run. There were two8-person groups. All groups were run for a total of 200 trials and at adisplay correlation equal to 0 except for the 4-person group, which was runfor 300 trials. The DSNR was set at 1.33 except in the 10-membercondition and in one of the 8-member conditions, where it was set at 1 .This was done to avoid obtaining excessively high group detection indices(^group > 3) fr°m tne large groups.
Results and Discussion
Table 3 summarizes the obtained group performance averagedover each size group (3, 4, 5, 8, and 10 members). The first columnin the table shows the group size and the second shows the DSNRused. The third column shows the values of DSNR \/m for eachcondition. These values predict the detection index for a hypothet-ical ideal group of m members, based on Equation 8, the groupsize, and the DSNR parameters. As in Experiment 1, the obtainedgroup performance d'group was based on the yes-no responses of therandomly designated responder for the group. The resulting per-formance is shown in column 4. In general, the obtained groupperformance increased with group size and DSNR. An analysis ofthe ratings of signal likelihood provided no evidence of a corre-lation between any two members' ratings or of a nonuniform
Table 2Experimental Conditions and Group Membershipfor Experiment 2
Size Correlation(m) (p) DSNR
34588
10
00000
0
1.331.331.331.331
1
Number of100-trial
Group membership blocks
SI S2 S3S4 S5 S6 S7SI S2 S3 S8 S9S2S3 S4S5 S6S7 S10 SllS12S13 S14S15 S16 S17
S18 S19S12S13 S14S15 S16S17
S18 S19S20S21
232
2
2
Note. DSNR = display signal-to-noise ratio.
correlation between members' ratings and the group response.Thus, there was no evidence of a correlation between memberjudgments or for the use of nonuniform weights.
Although the DSNRV'w values provide an estimate of optimalgroup performance, an improved estimate can be obtained from theactual sequence of stimuli presented to the groups of participantsduring the experiment. We determined this optimal level of per-formance by assuming a virtual ideal group; this group bases itsdecisions on a statistic, Xj, that is the sum of the actual stimulipresented to the participants on each experimental trial:
Xj /, Xy, (13)m
where xtj is the mean of the nine-element display presented tomember i on trial j. Xj is formed by summing the Xy values over them members. Because the Xy values contain all of the relevantinformation in the members' displays, the Xj statistic summarizesall of the information available on a trial. Thus, the theoretical bestperformance obtainable from a group that used all of the informa-tion in its displays is given by the performance of this statistic.
To specify the performance of the virtual statistic Xj,- we calcu-lated the detection index d'x based on Xj. On each trial we summedthe recorded mean displays and compared the value of that statistic
Table 3Indices of Group Detection Performance in Experiment 2as a Function of Group Size and DisplaySignal-to-Noise Ratio (DSNR)
Size (m) DSNR DSNRVm ^group < d'R
34588
10
1.331.331.331.3311
2.302.662.973.762.833.16
1.471.991.672.551.061.42
2.002.942.324.122.332.79
1.692.191.592.501.281.55
1.592.611.992.501.581.62
Note. The dgroup index is based on the accuracy of the human group'sdecision on each trial. The d'x index would be expected from a statisticallyoptimal group that observed the same stimuli as the human group. The d'Rand d'AX, indices are component detection indices based on the members'ratings (see text).
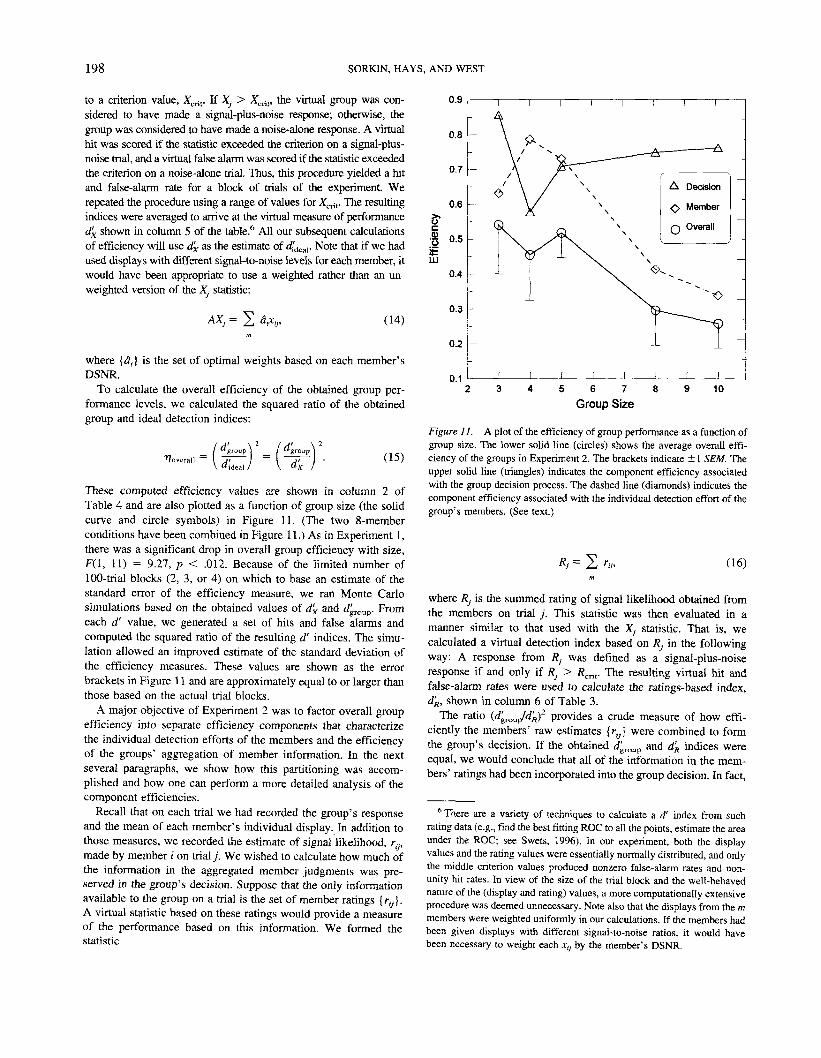
198 SORKIN, HAYS, AND WEST
to a criterion value, Xcrit. If X7 > Xcrit, the virtual group was con-sidered to have made a signal-plus-noise response; otherwise, thegroup was considered to have made a noise-alone response. A virtualhit was scored if the statistic exceeded the criterion on a signal-plus-noise trial, and a virtual false alarm was scored if the statistic exceededthe criterion on a noise-alone trial. Thus, this procedure yielded a hitand false-alarm rate for a block of trials of the experiment Werepeated the procedure using a range of values for Xcrit. The resultingindices were averaged to arrive at the virtual measure of performanced'x shown in column 5 of the table.6 All our subsequent calculationsof efficiency will use d'x as the estimate of d[deai. Note that if we hadused displays with different signal-to-noise levels for each member, itwould have been appropriate to use a weighted rather than an un-weighted version of the X, statistic:
(14)
where {a,} is the set of optimal weights based on each member'sDSNR.
To calculate the overall efficiency of the obtained group per-formance levels, we calculated the squared ratio of the obtainedgroup and ideal detection indices:
Coverall"group 1 "group
(15)
These computed efficiency values are shown in column 2 ofTable 4 and are also plotted as a function of group size (the solidcurve and circle symbols) in Figure 11. (The two 8-memberconditions have been combined in Figure 11.) As in Experiment 1,there was a significant drop in overall group efficiency with size,F(l, 11) = 9.27, p < .012. Because of the limited number of100-trial blocks (2, 3, or 4) on which to base an estimate of thestandard error of the efficiency measure, we ran Monte Carlosimulations based on the obtained values of d'x and dgroup. Fromeach d' value, we generated a set of hits and false alarms andcomputed the squared ratio of the resulting d' indices. The simu-lation allowed an improved estimate of the standard deviation ofthe efficiency measures. These values are shown as the errorbrackets in Figure 11 and are approximately equal to or larger thanthose based on the actual trial blocks.
A major objective of Experiment 2 was to factor overall groupefficiency into separate efficiency components that characterizethe individual detection efforts of the members and the efficiencyof the groups' aggregation of member information. In the nextseveral paragraphs, we show how this partitioning was accom-plished and how one can perform a more detailed analysis of thecomponent efficiencies.
Recall that on each trial we had recorded the group's responseand the mean of each member's individual display. In addition tothose measures, we recorded the estimate of signal likelihood, rif
made by member i on trial j. We wished to calculate how much ofthe information in the aggregated member judgments was pre-served in the group's decision. Suppose that the only informationavailable to the group on a trial is the set of member ratings {r^}.A virtual statistic based on these ratings would provide a measureof the performance based on this information. We formed thestatistic
itLLJ
0.9
0.8
0.71
0.6
0.5
0.4
0.3 h
0.2 -
0.15 6 7 8
Group Size10
Figure 11. A plot of the efficiency of group performance as a function ofgroup size. The lower solid line (circles) shows the average overall effi-ciency of the groups in Experiment 2. The brackets indicate ± 1 SEM. Theupper solid line (triangles) indicates the component efficiency associatedwith the group decision process. The dashed line (diamonds) indicates thecomponent efficiency associated with the individual detection effort of thegroup's members. (See text.)
(16)
where Rj is the summed rating of signal likelihood obtained fromthe members on trial j. This statistic was then evaluated in amanner similar to that used with the X, statistic. That is, wecalculated a virtual detection index based on Rj in the followingway: A response from R} was defined as a signal-plus-noiseresponse if and only if Rj > Rcrit. The resulting virtual hit andfalse-alarm rates were used to calculate the ratings-based index,d'R, shown in column 6 of Table 3.
The ratio (d'^TOUt/d'K)2 provides a crude measure of how effi-ciently the members' raw estimates {r^} were combined to formthe group's decision. If the obtained d'group and d'R indices wereequal, we would conclude that all of the information in the mem-bers' ratings had been incorporated into the group decision. In fact,
6 There are a variety of techniques to calculate a d' index from suchrating data (e.g., find the best fitting ROC to all the points, estimate the areaunder the ROC; see Swets, 1996). In our experiment, both the displayvalues and the rating values were essentially normally distributed, and onlythe middle criterion values produced nonzero false-alarm rates and non-unity hit rates. In view of the size of the trial block and the well-behavednature of the (display and rating) values, a more computationally extensiveprocedure was deemed unnecessary. Note also that the displays from the mmembers were weighted uniformly in our calculations. If the members hadbeen given displays with different signal-to-noise ratios, it would havebeen necessary to weight each xtj by the member's DSNR.
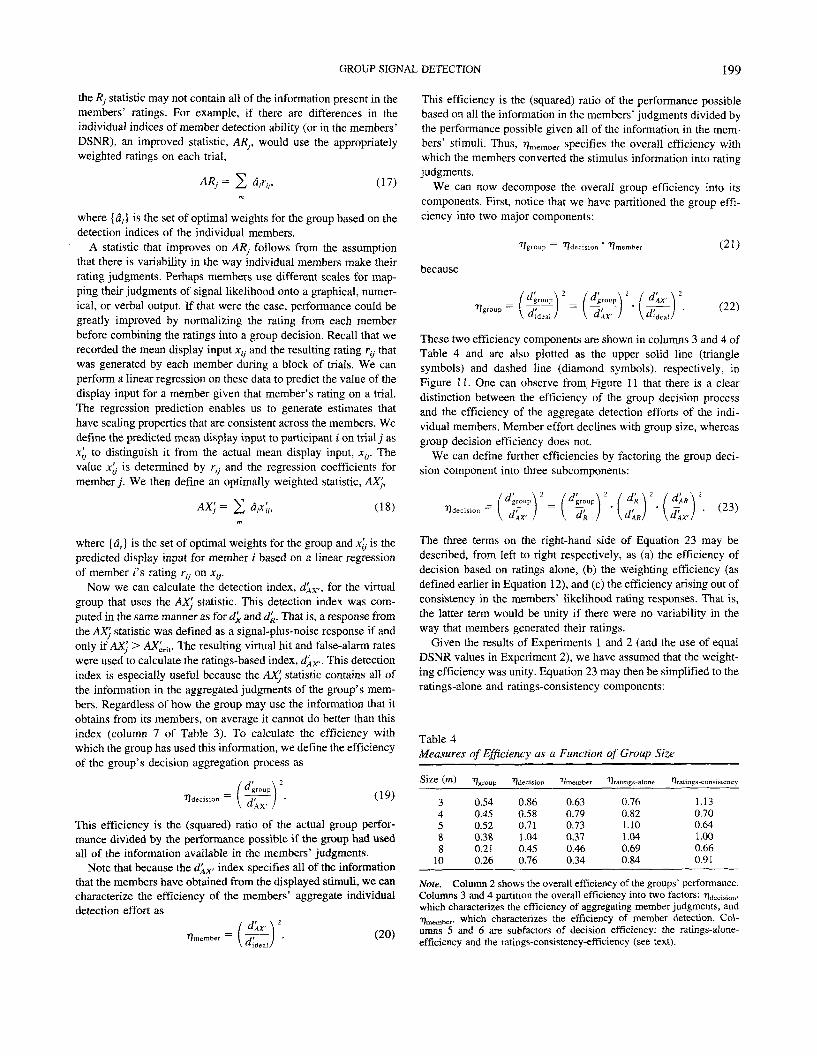
GROUP SIGNAL DETECTION 199
the Rj statistic may not contain all of the information present in themembers' ratings. For example, if there are differences in theindividual indices of member detection ability (or in the members'DSNR), an improved statistic, ARf would use the appropriatelyweighted ratings on each trial,
AR, = (17)
where {a,} is the set of optimal weights for the group based on thedetection indices of the individual members.
A statistic that improves on ARj follows from the assumptionthat there is variability in the way individual members make theirrating judgments. Perhaps members use different scales for map-ping their judgments of signal likelihood onto a graphical, numer-ical, or verbal output. If that were the case, performance could begreatly improved by normalizing the rating from each memberbefore combining the ratings into a group decision. Recall that werecorded the mean display input xtj and the resulting rating rtj thatwas generated by each member during a block of trials. We canperform a linear regression on these data to predict the value of thedisplay input for a member given that member's rating on a trial.The regression prediction enables us to generate estimates thathave scaling properties that are consistent across the members. Wedefine the predicted mean display input to participant i on trial j asXy to distinguish it from the actual mean display input, xtj. Thevalue Xy is determined by rti and the regression coefficients formember j. We then define an optimally weighted statistic, AX'},
AX (18)
where {a,} is the set of optimal weights for the group and Jty is thepredicted display input for member / based on a linear regressionof member f s rating rit on Xy.
Now we can calculate the detection index, d'AX', for the virtualgroup that uses the AXJ statistic. This detection index was com-puted in the same manner as for d'x and d'R. That is, a response fromthe AX'j statistic was defined as a signal-plus-noise response if andonly if AX'j > AX'CTit. The resulting virtual hit and false-alarm rateswere used to calculate the ratings-based index, d'AX.. This detectionindex is especially useful because the AX'j statistic contains all ofthe information in the aggregated judgments of the group's mem-bers. Regardless of how the group may use the information that itobtains from its members, on average it cannot do better than thisindex (column 7 of Table 3). To calculate the efficiency withwhich the group has used this information, we define the efficiencyof the group's decision aggregation process as
^decision"group
(19)
This efficiency is the (squared) ratio of the actual group perfor-mance divided by the performance possible if the group had usedall of the information available in the members' judgments.
Note that because the d'AX> index specifies all of the informationthat the members have obtained from the displayed stimuli, we cancharacterize the efficiency of the members' aggregate individualdetection effort as
(20)
This efficiency is the (squared) ratio of the performance possiblebased on all the information in the members' judgments divided bythe performance possible given all of the information in the mem-bers' stimuli. Thus, i7member specifies the overall efficiency withwhich the members converted the stimulus information into ratingjudgments.
We can now decompose the overall group efficiency into itscomponents. First, notice that we have partitioned the group effi-ciency into two major components:
because
^decision " ^member
"grou
(21)
(22)
These two efficiency components are shown in columns 3 and 4 ofTable 4 and are also plotted as the upper solid line (trianglesymbols) and dashed line (diamond symbols), respectively, inFigure 11. One can observe from. Figure 11 that there is a cleardistinction between the efficiency of the group decision processand the efficiency of the aggregate detection efforts of the indi-vidual members. Member effort declines with group size, whereasgroup decision efficiency does not.
We can define further efficiencies by factoring the group deci-sion component into three subcomponents:
d'
d'K d'A-^ • (23)
The three terms on the right-hand side of Equation 23 may bedescribed, from left to right respectively, as (a) the efficiency ofdecision based on ratings alone, (b) the weighting efficiency (asdefined earlier in Equation 12), and (c) the efficiency arising out ofconsistency in the members' likelihood rating responses. That is,the latter term would be unity if there were no variability in theway that members generated their ratings.
Given the results of Experiments 1 and 2 (and the use of equalDSNR values in Experiment 2), we have assumed that the weight-ing efficiency was unity. Equation 23 may then be simplified to theratings-alone and ratings-consistency components:
Table 4Measures of Efficiency as a Function of Group Size
Size (m) ''Idecisioi ^member ^ratings-aloi ings-consistency
34588
10
0.540.450.520.380.210.26
0.860.580.711.040.450.76
0.630.790.730.370.460.34
0.760.821.101.040.690.84
1.130.700.641.000.660.91
Note. Column 2 shows the overall efficiency of the groups' performance.Columns 3 and 4 partition the overall efficiency into two factors: t)decision,which characterizes the efficiency of aggregating member judgments, and^member, which characterizes the efficiency of member detection. Col-umns 5 and 6 are subfactors of decision efficiency: the ratings-alone-efficiency and the ratings-consistency-efficiency (see text).

200 SORKIN, HAYS, AND WEST
^decision
"PTnttn 1 / *^grOllp 1(24)
Columns 5 and 6, respectively, in Table 4 summarize these deci-sion subcomponents. Both subcomponents are relatively high andappear to be independent of group size.
General Discussion
A quantitative model of group decision making should be ableto specify how performance depends on the formal properties ofthe task and on the abilities of the group members. A signal-detection analysis of the group decision task promises to meetthese requirements. This analysis shows how the group decisionrule, the constraints on member interaction, and the level anddistribution of member expertise affect the accuracy of groupperformance. Furthermore, empirical tests of the theory lead nat-urally to hypotheses about the sources of inefficiency in thebehavior of human groups and to estimates of the magnitude ofthose inefficiencies.
According to the detection theory analysis, the accuracy of agroup's performance will be limited by the number and ability ofthe members and the correlation among member judgments. It isreasonable to expect that the performance of a human group willfall between two extremes: the performance of the statisticallyideal detection group at the top end and the Condorcet (zero-interaction, binary-voting) detection group at the bottom end. Weassume that there is a shared incentive for group members to worktoward accurate group performance, and that no individual incen-tives conflict with the group incentive. We also assume that thereare no constraints on member interaction that would cause thegroup to limit its mode of communication or deliberation. Finally,we assume that no members of the group exert an improperinfluence over the behavior of other members. Specifically, weassume that some members may have a greater influence on thegroup's decision than other members only if they are demonstrablymore competent at the task.
We applied the detection analysis to a visual task in whichgroups had to make binary, diagnostic decisions based on therelatively brief display of noisy, graphically presented information.On the surface, this appears to be a very simple task. However,even when the task is performed by an individual participant, itinvolves many judgmental factors, including estimation, criterionsetting, and the recall of information from memory. Perhaps in partbecause of its apparent simplicity, this task is a highly useful wayto study information processing in groups of participants and fallswell within the definition of group information processing asdefined by Hinsz, Tindale, and Vollrath (1997).
The present experiments were designed to give groups of indi-viduals the opportunity to reach their maximum level of performancein this decision task, by training, feedback, monetary payoff, andthe opportunity for full member interaction. The results of Exper-iment 1 were generally consistent with the detection theory anal-ysis in that (a) the level of group performance increased with groupsize, (b) the advantage of size decreased when member judgmentswere correlated, and (c) the group weighed the judgments ofindividual members approximately in accordance with the mem-bers' expertise. Libby, Trotman, and Zimmer (1987) showed thatthe variance in expertise within a group and the group's ability to
recognize the relative expertise of its members are crucial indetermining group performance when member interaction is al-lowed. Our results are consistent with their observations and withstudies that show that groups can recognize the relative expertiseof group members. For example, Henry (1993) demonstrated thatgroups can estimate the ability of members, even when no specificfeedback about the correctness of judgments is provided.
Experiment 1 indicated that the efficiency of group performancedecreased as the group size was increased or, equivalently, that theadvantage of size declined more rapidly than the statistical expec-tation. This is consistent with studies that have found decisionperformance to be less than the statistical optimum (see Davis,1992) and could be attributed to several possible causes, such as(a) nonzero correlations between member judgments, (b) ineffi-ciencies in how the member judgments were combined to form adecision, and (c) decreases in member detection efforts with in-creased group size. In Experiment 2, we attempted to either controlor assess the contribution of these different factors by requiringeach group member to make an overt estimate of the likelihoodthat a signal-plus-noise event had occurred on each trial and bydisplaying these estimates to the group during its deliberation. Experi-ment 2 also enabled us to measure how efficiently the group usedthe judgments received from its members and to quantify the aggre-gate information losses resulting from decreased member effort.
Implicit in our analysis is the assumption that each membermakes an observation of the stimulus, and that this observationleads to an internal, graded estimate of signal likelihood. Onemember's estimate could be correlated with another member'sestimate as a consequence of common genetics, background, orexperience or because the experimenter has intentionally manipu-lated the members' stimuli. This correlation between members isconfined by assumption to the individual's perceptual stage ofprocessing; that is, it is present earlier than the group decisionstage of the system shown in Figures 2 and 3. Conversely, theinfluence of one member on another is confined to the decisionstage of the system, specifically, the setting of decision weights oneach member's contribution to the group decision (e.g., Kriss,Kinchla, & Darley, 1977; Robinson & Sorkin, 1985).
In Experiment 1 we attempted to control the intermember cor-relation by manipulating the stimulus information that was pre-sented to each member. Our manipulation was designed to producemember judgments that were either independent or at a set corre-lation of 0.25. We observed a large drop in performance as aconsequence of experimentally increasing the correlation fromp = 0 to p = 0.25. If the member judgments had been correlatedto a significant degree before our manipulation, the predictedeffect of the increase in experimental correlation would have beenmuch smaller (i.e., the drop it produced by shifting from 0.2to 0.45 would have been very small). Therefore, we concluded thatthe effective correlation between members in the zero-correlationcondition must have been near zero. This conclusion was con-firmed by Experiment 2, in which we recorded the member judg-ments and could directly test the magnitude of the correlationbetween the member's estimates. We found that the average cor-relation between member estimates (considered within noise-aloneand signal-plus-noise trials) was essentially 0.
For the reasons of member background and experience citedpreviously, one should not normally expect that the intermembercorrelation will be 0, particularly when the stimuli are not random

GROUP SIGNAL DETECTION 201
graphical patterns, as in the present study. Hinsz (1990) reportedon a group recognition memory experiment using a signal-detection methodology. Hinsz's experiment involved 6 partici-pants having the member properties: mean(J') = 1.04 andvar(d') = 0.19. He obtained a group of d' of 2.11 in his experi-ment. This is much higher than the average member d' of 1.04 butless than the ideal value of 2.77. What accounts for the decreasedefficiency of his participants? The discrepancy between ideal andactual group performance is probably not attributable to inappro-priate weighting of the members' judgments, because a uniformweighting strategy would only have reduced the predicted valueto 2.55. It seems reasonable to attribute Hinsz's result to a corre-lation among the members' recall and interpretation of the video-presented material. For example, a correlation of 0.25 (and optimalweights) would have dropped the predicted performance to thelevel he observed. One would assume that even higher correla-tions—and hence even greater performance decreases—would re-sult from choosing jurors from a population having homogenousethnic and age characteristics.
Another reason for the low overall efficiencies obtained inExperiment 1 was that time pressure may have encouraged themembers to use a Condorcet mode of decision. In fact, the resultswere well below the level predicted by a simple majority Con-dorcet rule. We attempted to ameliorate this problem in Experi-ment 2 by removing time pressure as much as possible and byeliminating any financial incentive to rushing the deliberationprocess. A Condorcet rule is often used when the pressure of workprevents full deliberation and communication among a group'smembers. For example, consider a group that must select a personfor a position from a large number of job applicants. Because oftime pressure, the group first selects a "short" final list of candi-dates from the large applicant pool. This is done individually andwithout discussion. Each committee member examines the applicants'folders and makes a yes or no decision on whether to include thatapplicant on the short list. For a candidate to be on the list, thecandidate must receive a favorable vote from all of the committeemembers. Although the present study offers no solution to the timepressure problem, Sorkin et al.'s (1998) results suggest that thecommittee would arrive at a better list of candidates if it used asimple majority rule but asked each member to vote for fewer can-didates. Note that the American jury does not fit the Condorcet modeleven though it might use a unanimous rule. In the jury case, memberdeliberation and interaction are encouraged rather than prohibited.
In addition to handling the correlation and deliberation problemsinherent in Experiment 1, Experiment 2 allowed calculation of theseparate efficiencies that describe the group decision process andmember detection effort. Surprisingly, the efficiency of the groupdecision process did not decrease with group size. One wouldexpect that increased size would increase problems of coordinationand communication, opportunities for disagreements, and socialpressure from member subgroups. Apparently, at least in thecomputer-aided situation of the experimental task, size did notimpose significant difficulties. One could argue that the display ofmember ratings efficiently conveyed most of the informationneeded by the members to perform the decision task, and that thiswould probably not be the case for most "real" group decisiontasks. We tend to agree with that statement, but we also believethat the present result argues strongly for providing such efficientdecision aids in "real" group decision situations.
Why does member effort decrease with group size? We havementioned the difficulty in measuring a small drop in the detectioneffort of an individual participant in a group detection task. Onlywhen one aggregates the grouped effect of such drops does one seea clear effect. Individual drops in effort are difficult to observeeven when, as in the present experiment, much larger numbers oftrials per condition are run than in the typical group study. Becauseof this statistical aspect, it is relatively easy for an individual in agroup to decrease detection effort and remain anonymous. In fact,the group payoff is not affected very much by a decrease in onemember's effort, but it is very much affected by a decrease in allthe members' efforts.
Kerr (1983), Shepperd (1993), and others discussed why partic-ipants may reduce their individual efforts in a group situation andindulge in "social loafing." If some type of social loafing werepresent, we would conclude that the monetary payoff to eachparticipant was not sufficient to completely dominate incentives toreduce individual effort or participation. Perhaps participants will"loaf if they cannot see the statistical benefit of their contributionto the group's performance (i.e., to their own payoff) and if theycan do so anonymously. Harkins and Petty (1982) found thatparticipants who viewed their contributions as nonessential re-duced their individual efforts more than those who viewed theirefforts as significant. Following that reasoning, groups with highintermember correlation should show greater decreases in effi-ciency with size, because the benefit of each member's contribu-tion is very much reduced. We did not run a high correlationcondition in Experiment 2, so we cannot test that possibility.
The efficiency of member detection effort (and total groupefficiency) shown in Figure 11 appeared to reach an asymptoticlevel by group sizes of 12 or 14. This result is consistent withsocial impact theory, which predicts a decreasing rate of reducedeffort with increasing group size (Latane, 1991). One is tempted tospeculate on the implication and potential application of this result.Suppose that one assumes a single-member detection/decision taskhaving a signal-to-noise ratio of 0.5. A "real-life" version of sucha task might involve a predictive decision about the efficacy of amedical research program or the strategic intention of an industrialor military opponent. However, the low signal-to-noise ratio wouldmake this task unfeasible to be performed either by individual ob-servers or small groups of observers. That is, the resulting hit rateswould be uselessly low and the false-alarm rates intolerably high.However, if the group efficiency were asymptotic at 0.2 (see Figure11), one might be able to use the statistical advantage of a largenetworked group of decision makers to perform the task. For example,a group of 25 decision makers would produce a group d' of \A? 'V« • SNR = VO-2 • V25 • 0.5 = 1.12. Although not earth-shaking, the resulting performance could be useful in many situations.
Our analysis of group signal detection has emphasized perfor-mance accuracy and has avoided the question of individual andgroup response bias. To specify a system's detection ability com-pletely, it would be necessary to know the ROC, the locus ofpossible operating points in the hit and false-alarm probabilityspace for the system. This is because the ROC defines the systembehavior that will be produced at different levels of bias toward thesignal-plus-noise and noise-alone alternatives, including the pointof neutral bias. In the present study, our experimental materialsand conditions were designed to encourage individuals and groupsto operate only at the neutral bias point on the ROC. Our intent was

202 SORKIN, HAYS, AND WEST
to avoid the potentially complex problem of aggregating thechoices made by detectors having different response biases. Toensure that participants operated with a neutral bias, all detectionconditions were conducted with symmetric payoff structures andequal probability of signal plus noise and noise alone. In addition,our participants were knowledgeable about the signal probabilityand payoff structure, were highly experienced with the experimen-tal conditions, and did not have to record binary responses duringthe group deliberations. In our experiments they behaved withessentially neutral biases as individuals and as groups.
Minimizing (and controlling) the bias problem allows for agreatly simplified analysis of detection behavior (cf. Pete et al.,1993b; Sorkin & Dai, 1994) but reduces the ability to generalizethe results to real-life situations. Moreover, if one assumes thatgroup members are not efficient at finding the optimal aggregateoperating point, the neutral-bias condition probably overestimatesthe performance to be expected from a group that is solving areal-life problem. In other words, having to compensate for vari-ability in member bias provides an additional opportunity for agroup to operate in a nonideal manner. Thus, our approach fails toaddress whether performance is affected by group members beingrequired to form binary judgments before deliberation or how thegroup sets its criterion when the payoff structure or prior proba-bilities are not symmetric. We hope to address these questions infuture experiments.
References
Ashby, F. G., & Maddox, T. W. (1992). Complex decision rules incategorization: Contrasting novice and experienced performance. Jour-nal of Experimental Psychology: Human Perception and Perfor-mance, 18, 50-71.
Austen-Smith, D., & Banks, J. S. (1996). Information aggregation, ratio-nality, and the Condorcet jury theorem. American Political ScienceReview, 90, 34-46.
Batchelder, W. H., & Romney, A. K. (1986). The statistical analysis of ageneral Condorcet model for dichotomous choice situations. In B. Grof-man & G. Owen (Eds.), Decision research (Vol. 2, pp. 103-112).Greenwich, CT: JAI Press.
Berg, B. G. (1989). Analysis of weights in multiple observation tasks.Journal of the Acoustical Society of America, 86, 1743-1745.
Berg, B. G. (1990). Observer efficiency and weights in a multiple obser-vation task. Journal of the Acoustical Society of America, 88, 149-158.
Berg, B. G., & Green, D. M. (1990). Spectral weights in profile listening.Journal of the Acoustical Society of America, 88, 758-766.
Clement, D. E., & Schiereck, J. J. (1973). Sex composition and groupperformance in a visual signal detection task. Memory & Cognition, 1,251-255.
Condorcet, J. C. (1972). Essai sur 1'application de 1'analyse a la probabilitedes decisions rendues a la pluralite des voix [Essay on the application ofanalysis to Jhe probability of majority]. New York: Chelsea PublishingCompany. (Original work published 1785)
Davis, J. H. (1992). Some compelling intuitions about group consensusdecisions, theoretical and empirical research, and interpersonal aggre-gation phenomena: Selected examples, 1950-1990. Organizational Be-havior and Human Decision Processes, 52, 3-38.
Durlach, N. I., Braida, L. D., & Ito, Y. (1986). Towards a model fordiscrimination of broadband signals. Journal of the Acoustical Society ofAmerica, 80, 60-72.
Einhorn, H. J., Hogarth, R. M., & Klempner, E. (1977). Quality of groupjudgment. Psychological Bulletin, 84, 158-172.
Elvers, G. C., & Sorkin, R. D. (1989). Detection and recognition of
multiple visual signals in noise. Proceedings of the Human FactorsSociety, 2. 1383-1387.
Erev, 1., Gopher, D., Itkin, R., & Greenshpan, Y. (1995). Toward ageneralization of signal detection theory to n-person games: The exam-ple of two-person safety problem. Journal of Mathematical Psychol-ogy, 39, 360-375.
Green, D. M. (1992). The number of components in profile analysis tasks.Journal of the Acoustical Society of America, 91, 1616-1623.
Green, D. M., & Swets, J. A. (1966). Signal detection theory and psycho-physics. New York: Wiley.
Grofman, B., Held, S. L., & Owen, G. (1984). Group size and the perfor-mance of a composite group majority: Statistical truths and empiricalresults. Organizational Behavior and Human Performance, 33, 350-359.
Grofman, B., Owen, G., & Feld, S. (1983). Thirteen theorems in search ofthe truth. Theory and Decision, 15, 261-278.
Harkins, S. G., & Petty, R. E. (1982). Effects of task difficulty and taskuniqueness on social loafing. Journal of Personality and Social Psychol-ogy, 43, 1214-1229.
Harvey, N., & Harries, C. (1999, August). Long-term contextual interfer-ence in aggregation of opinions: Why does judges' own forecastingimpair their use of advice? Paper presented at the Biennial Conferenceon Subjective Probability, Utility and Decision Making, Mannheim,Germany.
Hastie, R. (1986). Experimental evidence on group accuracy. In B. Grof-man & G. Owen (Eds.), Decision research (Vol. 2, pp. 129-157).Greenwich, CT: JAI Press.
Henry, R. A. (1993). Group judgment accuracy: Reliability and validity ofpostdiscussion confidence judgments. Organizational Behavior and Hu-man Decision Processes, 56, 11-27.
Hillman, B. J., Hessel, S. J., Swensson, R. G., & Herman, P. G. (1977).Improving diagnostic accuracy: A comparison of interactive and Delphiconsultations. Investigative Radiology, 12, 112-115.
Hinsz, V. B. (1990). Cognitive and consensus processes in group recog-nition memory performance. Journal of Personality and Social Psychol-ogy, 59, 705-718.
Hinsz, V. B., Tindale, R. S., & Vollrath, D. A. (1997). The emergingconceptualization of groups as information processors. PsychologicalBulletin, 121, 43-64.
Jeffress, L. A., & Robinson, D. E. (1962). Formulas for the coefficient ofinteraural correlation for noise. Journal of the Acoustical Society ofAmerica, 34, 1658-1659.
Kerr, N. L. (1983). Motivation losses in small groups: A social dilemmaanalysis. Journal of Personality and Social Psychology, 45, 819-828.
Kriss, M., Kinchla, R. A., & Darley, I. M. (1977). A mathematical modelfor social influences on perceptual judgments. Journal of ExperimentalSocial Psychology, 13, 403-420.
Latane, B. (1991). The psychology of social impact. American Psycholo-gist, 36, 343-356.
Latane, B., Williams, K., & Harkins, S. (1979). Many hands make light thework: The causes and consequences of social loafing. Journal of Per-sonality and Social Psychology, 37, 822-832.
Libby, R., Trotman, K. T., & Zimmer, I. (1987). Member variation,recognition of expertise, and group performance. Journal of AppliedPsychology, 72, 81-87.
Lutfi, R. A. (1995). Correlation coefficients and correlation ratios asestimates of observer weights in multiple-observation tasks. Journal ofthe Acoustical Society of America, 97, 1333-1334.
Macmillan, N. A., & Creelman, C. D. (1991). Detection theory: A user'sguide. Cambridge, England: Cambridge University Press.
Metz, C. E., & Shen, J. (1992). Gains in accuracy from replicated readingsof diagnostic images: Prediction and assessment in terms of ROCanalysis. Medical Decision Making, 12, 60-75.
Montgomery, D. A., & Sorkin, R. D. (1993). The effects of display codeand its relation to the optimal decision statistic in visual signal detection.
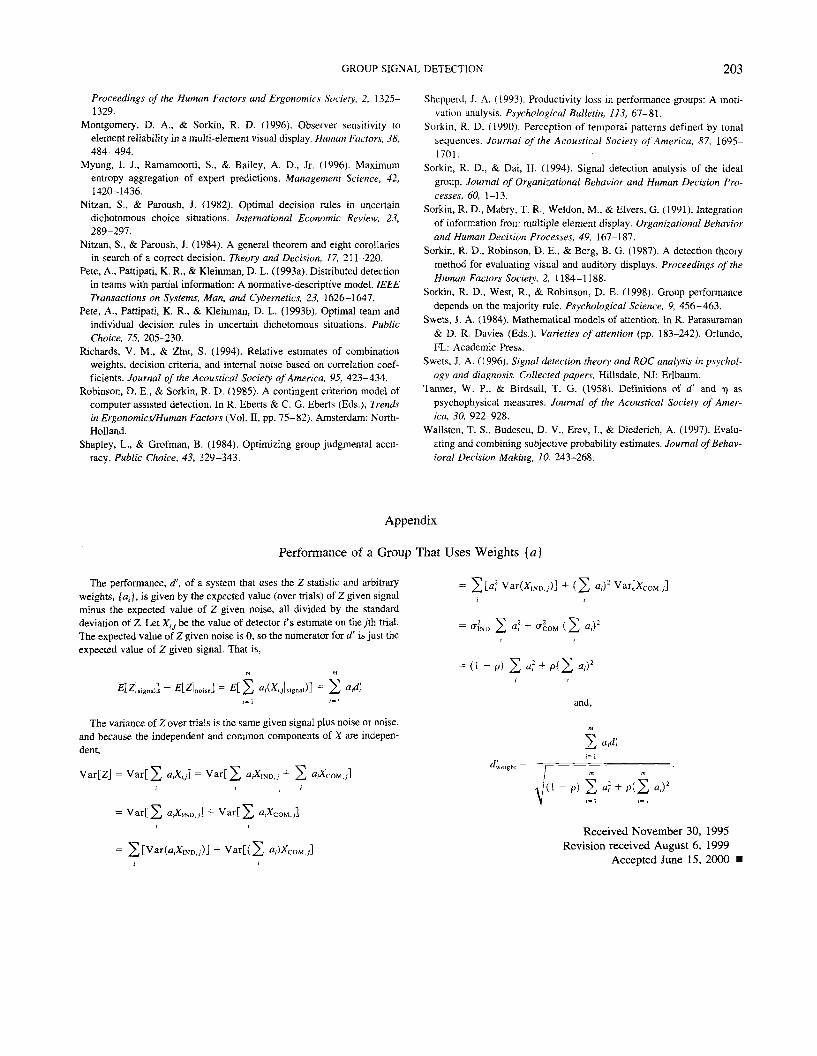
GROUP SIGNAL DETECTION 203
Proceedings of the Human Factors and Ergonomics Society, 2, 1325-1329.
Montgomery, D. A., & Sorkin, R. D. (1996). Observer sensitivity toelement reliability in a multi-element visual display. Human Factors, 38,484-494.
Myung, I. J., Ramamoorti, S., & Bailey, A. D., Jr. (1996). Maximumentropy aggregation of expert predictions. Management Science, 42,1420-1436.
Nitzan, S., & Paroush, J. (1982). Optimal decision rules in uncertaindichotomous choice situations. International Economic Review, 23,289-297.
Nitzan, S., & Paroush, J. (1984). A general theorem and eight corollariesin search of a correct decision. Theory and Decision, 17, 211-220.
Pete, A., Pattipati, K. R., & Kleinman, D. L. (1993a). Distributed detectionin teams with partial information: A normative-descriptive model. IEEETransactions on Systems, Man, and Cybernetics, 23, 1626-1647.
Pete, A., Pattipati, K. R., & Kleinman, D. L. (1993b). Optimal team andindividual decision rules in uncertain dichotomous situations. PublicChoice, 75, 205-230.
Richards, V. M., & Zhu, S. (1994). Relative estimates of combinationweights, decision criteria, and internal noise based on correlation coef-ficients. Journal of the Acoustical Society of America, 95, 423-434.
Robinson, D. E., & Sorkin, R. D. (1985). A contingent criterion model ofcomputer assisted detection. In R. Eberts & C. G. Eberts (Eds.), Trendsin Ergonomics/Human Factors (Vol. II, pp. 75-82). Amsterdam: North-Holland.
Shapley, L., & Grofman, B. (1984). Optimizing group judgmental accu-racy. Public Choice, 43, 329-343.
Sheppeid, J. A. (1993). Productivity loss in performance groups: A moti-vation analysis. Psychological Bulletin, 113, 67-81.
Sorkin, R. D. (1990). Perception of temporal patterns defined by tonalsequences. Journal of the Acoustical Society of America, 87, 1695-1701.
Sorkin, R. D., & Dai, H. (1994). Signal detection analysis of the idealgroup. Journal of Organizational Behavior and Human Decision Pro-cesses, 60, 1-13.
Sorkin, R. D., Mabry, T. R., Weldon, M., & Elvers, G. (1991). Integrationof information from multiple element display. Organizational Behaviorand Human Decision Processes, 49, 167-187.
Sorkin, R. D., Robinson, D. E., & Berg, B. G. (1987). A detection theorymethod for evaluating visual and auditory displays. Proceedings of theHuman Factors Society, 2, 1184-1188.
Sorkin, R. D., West, R., & Robinson, D. E. (1998). Group performancedepends on the majority rule. Psychological Science, 9, 456-463.
Swets, J. A. (1984). Mathematical models of attention. In R. Parasuraman& D. R. Davies (Eds.), Varieties of attention (pp. 183-242). Orlando,FL: Academic Press.
Swets, J. A. (1996). Signal detection theory and ROC analysis in psychol-ogy and diagnosis. Collected papers. Hillsdale, NJ: Erlbaum.
Tanner, W. P., & Birdsall, T. G. (1958). Definitions of d' and 15 aspsychophysical measures. Journal of the Acoustical Society of Amer-ica, 30, 922-928.
Wallsten, T. S., Budescu, D. V., Erev, I., & Diederich, A. (1997). Evalu-ating and combining subjective probability estimates. Journal of Behav-ioral Decision Making, 10, 243-268.
Appendix
Performance of a Group That Uses Weights {a}
The performance, d', of a system that uses the Z statistic and arbitraryweights, {aj, is given by the expected value (over trials) of Z given signalminus the expected value of Z given noise, all divided by the standarddeviation of Z. Let Xti be the value of detector i's estimate on they'th trial.The expected value of Z given noise is 0, so the numerator for d' is just theexpected value of Z given signal. That is,
l>? Var(XINDJ)]
= o N D + "'C
a,)2 Var[XCOMJ
The variance of Z over trials is the same given signal plus noise or noise,and because the independent and common components of X are indepen-dent,
Var[Z] = a,XCOMj]
and,
<*;«.„, =
Received November 30, 1995Revision received August 6, 1999
Accepted June 15, 2000