Signal contributions to heavily diffusion-weighted functional magnetic resonance imaging...
8
UNCORRECTED PROOF 1 Signal contributions to heavily diffusion-weighted functional magnetic 2 resonance imaging investigated with multi-SE-EPI acquisitions Daigo Q1 Kuroiwa a , Takayuki Obata a,b, ⁎, Hiroshi Kawaguchi b , Joonas Autio b , Masaya Hirano c , Ichio Aoki b , 4 Iwao Kanno b , Jeff Kershaw b 5 a Research Center for Charged Particle Therapy, National Institute of Radiological Sciences, Anagawa4-9-1, Inage-ku, Chiba 263-8555, Japan 6 b Molecular Imaging Center, National Institute of Radiological Sciences, Anagawa4-9-1, Inage-ku, Chiba 263-8555, Japan 7 c MR Engineering, GE Healthcare, Asahigaoka 4-7-127, Hino, Tokyo 191-8503, Japan abstract 8 article info 9 Article history: 10 Accepted 18 April 2014 11 Available online xxxx 12 Keywords: 13 Brain 14 Diffusion-weighted functional MRI 15 Hypercapnia 16 Visual stimulation 17 Diffusion-weighted (DW) functional magnetic resonance imaging (fMRI) signal changes have been noted as a 18 promising marker of neural activity. Although there is no agreement on the signal origin, the blood oxygen 19 level dependent (BOLD) effect has figured as one of the most likely sources. In order to investigate possible 20 BOLD and non-BOLD contributions to the signal, DW fMRI was performed on normal volunteers using a sequence 21 with two echo-planar acquisitions after pulsed-gradient spin-echo. Along with the changes to the signal 22 amplitude (ΔS/S) measured at both echo-times, this sequence allowed changes to the transverse relaxation 23 rate (ΔR 2 ) to be estimated for multiple b-values during hypercapnia (HC) and visual stimulation (VS). ΔS/S 24 and ΔR 2 observed during HC were relatively insensitive to increasing b-value. On the other hand, ΔS/S demon- 25 strated a clear dependence on b-value at both echo-times for VS. In addition, ΔR 2 during the latter half of VS 26 was significantly more negative at b = 1400 s/mm 2 than for the time-courses at lower b-value, but ΔR 2 during 27 the post-stimulus undershoot was independent of b-value. The results have been discussed in terms of two 28 models: the standard intravascular-extravascular model for fMRI and a three-compartment model (one intra- 29 and two extravascular compartments). Within these interpretations the results suggest that the majority of 30 the response is linked to changes in transverse relaxation, but possible contributions from other sources may 31 not be ruled out. 32 © 2014 Published by Elsevier Inc. 33 34 35 36 37 Introduction 38 MRI with blood oxygen level dependent (BOLD) contrast has been 39 widely used as a functional imaging tool, and it is now one of the most 40 important methods in the neuroscience field (Ogawa et al., 1992, 41 1993). The BOLD signal reflects deoxyhaemoglobin concentration 42 changes in the bloodstream in response to changes to the cerebral met- 43 abolic rate of oxygen (CMRO2), cerebral blood flow and cerebral blood 44 volume (CBV). Therefore, BOLD reveals changes in neural activity only 45 indirectly (Buxton, 2012; Obata et al., 2004). For this reason many re- 46 searchers have attempted to develop diffusion-weighted functional 47 MRI (DW fMRI) methods that provide more direct information about 48 neural activation (Aso et al., 2009; Darquie et al., 2001; Harshbarger 49 and Song, 2004; Jin and Kim, 2008; Jin et al., 2006; Kershaw et al., 50 2009; Kohno et al., 2009; Le Bihan et al., 2006; Miller et al., 2007; 51 Yacoub et al., 2008). An example of this is the two-phase functional dif- 52 fusion model that Le Bihan et al. introduced as a means to interpret 53 heavily DW fMRI (Le Bihan et al., 2006). Within this model, tissue 54 water molecules are said to undergo slow exchange between a slow- 55 diffusion phase (SDP) and a fast-diffusion phase (FDP), and the fMRI sig- 56 nal change is understood as an expansion (contraction) of the SDP 57 (FDP) during the application of a stimulus. Hence, it was hypothesised 58 that measuring changes to the SDP expansion coefficient might provide 59 an MRI-based method for directly observing cell swelling during neuro- 60 nal activity. If that hypothesis holds true, DW-fMRI would become a 61 functional imaging method with the potential to directly detect neural 62 activity. 63 Motivated by this possibility, Miller et al. (2007) performed a DW- 64 fMRI study using a protocol similar to that of Le Bihan et al. They 65 observed similar signal changes not only during visual stimulation 66 (VS), but also under hypercapnia (HC), which suggests that the DW- 67 fMRI signal changes are largely due to the haemodynamic response NeuroImage xxx (2014) xxx–xxx Abbreviations: BOLD, blood oxygen level dependent; CBV, cerebral blood volume; CMRO2, cerebral metabolic rate of oxygen; CSF, cerebrospinal fluid; DW, diffusion- weighted; EPI, echo planar imaging; EV, extravascular; FDP, fast-diffusion phase; FIV, fast intravascular phase; fMRI, functional magnetic resonance imaging; HC, hypercapnia; IV, intravascular; MPG, motion-probing gradient; PGSE, pulsed-gradient spin echo; PSCR, positive stimulus-correlated response; PSU, post-stimulus undershoot; SDP, slow- diffusion phase; VS, visual stimulation. ⁎ Corresponding author at: Research Center for Charged Particle Therapy, National Institute of Radiological Sciences, Anagawa4-9-1, Inage-ku, Chiba 263-8555, Japan. E-mail address: [email protected] (T. Obata). YNIMG-11306; No. of pages: 8; 4C: 3, 4, 5, 6, 7 http://dx.doi.org/10.1016/j.neuroimage.2014.04.050 1053-8119/© 2014 Published by Elsevier Inc. Contents lists available at ScienceDirect NeuroImage journal homepage: www.elsevier.com/locate/ynimg Please cite this article as: Kuroiwa, D., et al., Signal contributions to heavily diffusion-weighted functional magnetic resonance imaging investigated with multi-SE-EPI acquisitions, NeuroImage (2014), http://dx.doi.org/10.1016/j.neuroimage.2014.04.050
Transcript of Signal contributions to heavily diffusion-weighted functional magnetic resonance imaging...

1
2
3Q1
4
567
8
91011
1213141516
31
32
3334
35
36
37
38
39
40
41
42
43
44
45
46
NeuroImage xxx (2014) xxx–xxx
YNIMG-11306; No. of pages: 8; 4C: 3, 4, 5, 6, 7
Contents lists available at ScienceDirect
NeuroImage
j ourna l homepage: www.e lsev ie r .com/ locate /yn img
Signal contributions to heavily diffusion-weighted functional magneticresonance imaging investigated with multi-SE-EPI acquisitions
OFDaigo Kuroiwa a, Takayuki Obata a,b,⁎, Hiroshi Kawaguchi b, Joonas Autio b, Masaya Hirano c, Ichio Aoki b,
Iwao Kanno b, Jeff Kershaw b
a Research Center for Charged Particle Therapy, National Institute of Radiological Sciences, Anagawa4-9-1, Inage-ku, Chiba 263-8555, Japanb Molecular Imaging Center, National Institute of Radiological Sciences, Anagawa4-9-1, Inage-ku, Chiba 263-8555, Japanc MR Engineering, GE Healthcare, Asahigaoka 4-7-127, Hino, Tokyo 191-8503, Japan
U
O
Abbreviations: BOLD, blood oxygen level dependentCMRO2, cerebral metabolic rate of oxygen; CSF, cerebweighted; EPI, echo planar imaging; EV, extravascular;fast intravascular phase; fMRI, functional magnetic resonaIV, intravascular; MPG, motion-probing gradient; PGSPSCR, positive stimulus-correlated response; PSU, post-stdiffusion phase; VS, visual stimulation.⁎ Corresponding author at: Research Center for Char
Institute of Radiological Sciences, Anagawa4-9-1, Inage-kuE-mail address: [email protected] (T. Obata).
http://dx.doi.org/10.1016/j.neuroimage.2014.04.0501053-8119/© 2014 Published by Elsevier Inc.
Please cite this article as: Kuroiwa, D., etinvestigated with multi-SE-EPI acquisitions,
Ra b s t r a c t
a r t i c l e i n f o17
18
19
20
21
22
23
24
Article history:Accepted 18 April 2014Available online xxxx
Keywords:BrainDiffusion-weighted functional MRIHypercapniaVisual stimulation
25
26
27
28
29
30
ECTED P
Diffusion-weighted (DW) functional magnetic resonance imaging (fMRI) signal changes have been noted as apromising marker of neural activity. Although there is no agreement on the signal origin, the blood oxygenlevel dependent (BOLD) effect has figured as one of the most likely sources. In order to investigate possibleBOLDand non-BOLD contributions to the signal, DW fMRIwas performed onnormal volunteers using a sequencewith two echo-planar acquisitions after pulsed-gradient spin-echo. Along with the changes to the signalamplitude (ΔS/S) measured at both echo-times, this sequence allowed changes to the transverse relaxationrate (ΔR2) to be estimated for multiple b-values during hypercapnia (HC) and visual stimulation (VS). ΔS/Sand ΔR2 observed during HC were relatively insensitive to increasing b-value. On the other hand, ΔS/S demon-strated a clear dependence on b-value at both echo-times for VS. In addition, ΔR2 during the latter half of VSwas significantly more negative at b = 1400 s/mm2 than for the time-courses at lower b-value, but ΔR2 duringthe post-stimulus undershoot was independent of b-value. The results have been discussed in terms of twomodels: the standard intravascular-extravascular model for fMRI and a three-compartment model (one intra-and two extravascular compartments). Within these interpretations the results suggest that the majority ofthe response is linked to changes in transverse relaxation, but possible contributions from other sources maynot be ruled out.
© 2014 Published by Elsevier Inc.
47
48
49
50
51
52
53
54
55
56
57
NCO
RR
Introduction
MRI with blood oxygen level dependent (BOLD) contrast has beenwidely used as a functional imaging tool, and it is now one of the mostimportant methods in the neuroscience field (Ogawa et al., 1992,1993). The BOLD signal reflects deoxyhaemoglobin concentrationchanges in the bloodstream in response to changes to the cerebral met-abolic rate of oxygen (CMRO2), cerebral blood flow and cerebral bloodvolume (CBV). Therefore, BOLD reveals changes in neural activity onlyindirectly (Buxton, 2012; Obata et al., 2004). For this reason many re-searchers have attempted to develop diffusion-weighted functional
58
59
60
61
62
63
64
65
66
67
; CBV, cerebral blood volume;rospinal fluid; DW, diffusion-FDP, fast-diffusion phase; FIV,nce imaging; HC, hypercapnia;E, pulsed-gradient spin echo;imulus undershoot; SDP, slow-
ged Particle Therapy, National, Chiba 263-8555, Japan.
al., Signal contributions to hNeuroImage (2014), http://dx
MRI (DW fMRI) methods that provide more direct information aboutneural activation (Aso et al., 2009; Darquie et al., 2001; Harshbargerand Song, 2004; Jin and Kim, 2008; Jin et al., 2006; Kershaw et al.,2009; Kohno et al., 2009; Le Bihan et al., 2006; Miller et al., 2007;Yacoub et al., 2008). An example of this is the two-phase functional dif-fusion model that Le Bihan et al. introduced as a means to interpretheavily DW fMRI (Le Bihan et al., 2006). Within this model, tissuewater molecules are said to undergo slow exchange between a slow-diffusion phase (SDP) and a fast-diffusion phase (FDP), and the fMRI sig-nal change is understood as an expansion (contraction) of the SDP(FDP) during the application of a stimulus. Hence, it was hypothesisedthat measuring changes to the SDP expansion coefficient might provideanMRI-basedmethod for directly observing cell swelling during neuro-nal activity. If that hypothesis holds true, DW-fMRI would become afunctional imaging method with the potential to directly detect neuralactivity.
Motivated by this possibility, Miller et al. (2007) performed a DW-fMRI study using a protocol similar to that of Le Bihan et al. Theyobserved similar signal changes not only during visual stimulation(VS), but also under hypercapnia (HC), which suggests that the DW-fMRI signal changes are largely due to the haemodynamic response
eavily diffusion-weighted functional magnetic resonance imaging.doi.org/10.1016/j.neuroimage.2014.04.050

T
68
69
70
71
72
73
74
75
76
77
78
79
80
81
82
83
84
85
86
87
88
89
90
91
92
93
94
95
96
97
98
99
100
101
102
103
104
105
106
107
108
109
110
111
112
113
114
115
116
117
118
119
120
121
122
123
124
125
126
127
128
129
130
131
132
133
134
135
136
137
138
139
140
141
142
143
144
145
146
147
148
149
150
151
152
153
154
155
156
157
158
2 D. Kuroiwa et al. / NeuroImage xxx (2014) xxx–xxx
CO
RREC
rather than neuronal cell-swelling. On the other hand, other groupshave found the response to hypercapnia at high b-value to be signifi-cantly smaller than that during visual stimulation (Kuroiwa et al.,2008; Urayama et al., 2008). Overall, no conclusive agreement on theorigin of the DW-fMRI signal has been arrived at, but the BOLD effecthas figured as one of the most prominent suggested sources(Rudrapatna et al., 2012).
As originally proposed, the BOLD signal model for fMRI consists of in-travascular (IV) and extravascular (EV) contributions so that the fraction-al signal changeΔS/S=(ΔSi+ΔSe) / S (Buxton et al., 1998). The EVBOLDmodel predicts that ΔSe increases with TE, so it is often convenient tocharacterise the EV contribution as a change in the transverse relaxationrate of a single-exponential decay Se = S0e exp(−TE R2e). However, toalso account for a possible non-BOLD contribution (ΔS0e/S0e), the changecan be written as ΔSe ≈ [ΔS0e/S0e − TE ΔR2e] S0e exp(−TE R2e). TheIV contribution ΔSi is thought to be substantially attenuated forb N 200 s/mm2 (Le Bihan et al., 1988), so that in the limit of large bit is expected that ΔS/S ≈ ΔSe/Se = ΔS0e/S0e − TE ΔR2e. Note thatif ΔS0e is zero then the total signal change is due to ΔR2e alone.Now, if the IV–EV model is an adequate description for DW-fMRI, ameasurement of−ΔR2,which representsminus the change to the over-all apparent transverse relaxation rate R2, should approach−ΔR2e andhave a time-course with shape similar to that of ΔS/S at high b-value. Itfollows that simultaneous measurements of ΔS/S and−ΔR2 may pro-vide useful information to investigate the contribution of BOLD andother effects to DW-fMRI signal changes.
In this work, a second 180-degree RF pulse was added to a standardpulsed-gradient SE (PGSE) echo-planar imaging (EPI) sequence so thatthe transversemagnetisation refocuses again at TE2 (Fig. 1). Alongwiththe usual b-value dependent changes to the signal amplitude obtainedfrom DW-fMRI experiments, the EPI acquisitions at TE1 and TE2allowed the transverse relaxation rate (R2 = 1/T2) at different diffusionweightings to be estimated during the performance of a task. Experi-ments were performed for both hypercapnia and visual stimulus tasks.
Materials and methods
This studywas approved by the Institutional Ethics Committee of theNational Institute of Radiological Sciences, Chiba, Japan and signedinformed consent was obtained from each participant.
Data acquisition
DW fMRI experiments during HC and VS were conducted on awhole-body 3 T MRI system (Signa HDx, GE Healthcare, Milwaukee,WI, USA). Acquisitions were performed using a multiple SE EPIsequence with PGSE diffusion-weighting (Fig. 1). The diffusion-weighting gradients were placed on either side of the first refocusingRF-pulse and directed along the readout axis. The repetition time (TR)was 2000 ms for the VS, and 1000 ms for the HC experiments. The
UN 159
160
161
162
163
164
165
166
167
168
169
170
171
172
173
Fig. 1. Pulsed-gradient spin-echo (PGSE) with double EPI acquisition. After standard PGSEdiffusion-weighting, MR signals at two echo-times (TE1= 71.3 ms and TE2= 129.2 ms)were obtained so as to estimate R2 at each b-value.
Please cite this article as: Kuroiwa, D., et al., Signal contributions to hinvestigated with multi-SE-EPI acquisitions, NeuroImage (2014), http://d
ED P
RO
OF
following imaging parameters were common to both the VS and HC ex-periments: TE1 = 71.3 ms, TE2 = 129.2 ms, 64 × 64 matrix,3.75 × 3.75 × 5 mm3 pixel size, and 4 slices. The amplitude of thepulsed gradient was altered while the timing was fixed to obtainb-values of 1, 200 or 1400 s/mm2. Pairs of b-valueswere selected (eitherb = 1400 and 1, or 1400 and 200 s/mm2), and the higher and lowerdiffusion weightings were alternated every TR to minimize the effectsof motion. Since the highest b-value images have lower SNR, a b-valueof 1400 s/mm2 was included in both pairs of diffusion weightings toincrease the number of data points. The order of the b-value pairs wasalternated to avoid possible systematic bias.
Hypercapnia
Eight healthy volunteers participated in the HC experiments. To in-duce temporary hypercapnia, 5% CO2 gas (together with 21% O2 and74% N2) was administered for 60 s followed by 120 s of normal airwith end-tidal CO2 monitored. The paradigm consisted of 2 cycles of60 s administration and 120 s rest repeated once for each b-value pairon each volunteer. Imaging slices were set to cover the same parts ofthe visual cortex as for the VS experiments.
Visual stimulation
Twelve healthy volunteers participated in the VS experiments. Visu-al stimulation was provided by a black-and-white checkerboard alter-nating at 8 Hz. A small horizontal arrow was placed in the center ofthe checkerboard, and it randomly changed direction from right to leftor from left to right during activation. To avoid sleepiness and monitorvigilance, the subjects had to push amouse button if the arrow changeddirection. Prior to the DW fMRI experiments, a T2*-BOLD fMRI experi-ment with slices covering the whole brain was performed to searchfor the most activated slice in the visual cortex. The VS protocol forthis preliminary experiment was 3 cycles of 30 s activation and 30 srest. The four slices used for DW fMRI were selected from a functionalmap created by the BrainWave software (GE Healthcare). After slice se-lection, DW fMRI duringVSwas performedwith a stimulation paradigmof 4 cycles of 40 s activation and 80 s rest. The paradigm was repeatedtwice for each b-value pair on each volunteer.
Data processing
After smoothing all images (3 × 3 spatial + 7-point (HC) or 3-point(VS) temporal box filters) and averaging over all stimulus cycles, acti-vated pixels in the first-echo (TE1) image sets were identified for bothHC and VS with a pixel-by-pixel t-test analysis between stimulationand baseline time points. The intervals for the HC data set were 15time points during CO2 administration (31–60 s after onset) and 16points (149–180 s after onset) to define the baseline. The intervalsselected for the t-test applied to the VS data set were 5 central timepoints during VS (16–34 s after stimulus onset) and 9 points(88–120 s after onset) to define the baseline. All voxels in the b =200 and 1400 s/mm2 data sets with t-value of more than 4 at TE1(p b 10−4, uncorrected for multiple comparisons) were defined asactivated, and the same voxels were used to perform the analysis ofall b-value and TE data from a particular subject. The regions of interest(ROIs) were manually selected from the whole cortex (except the fron-tal cortex) for HC and from the activated pixels in the visual cortex forVS. The frontal cortex was ignored for HC because of the susceptibilityartefact in the vicinity of the frontal sinus. The DW fMRI time-serieswere averaged over the ROI selected for each subject before the frac-tional signal change was calculated. Note that the two repetitions ofthe acquisition paradigm performed for the VS experiments wereanalysed separately and the resultant time-series were averaged. Thetime-series were then averaged over all subjects for both the first andsecond echoes.
eavily diffusion-weighted functional magnetic resonance imagingx.doi.org/10.1016/j.neuroimage.2014.04.050
T
174
175
176
177
178
179
180
181
182
183
184
185
186
187
188
189
190
191
192
193
194
195
196
197
198
199
200
201
202
203
204
205
206
207
208
209
210
211
212
213
214
215
216
217
218
219
220
221
222
223
224
225
226
227
228
229
230
231
232
233
234
235
236
3D. Kuroiwa et al. / NeuroImage xxx (2014) xxx–xxx
C
Results
The data from one VS subject was excluded because of insufficientvigilance during imaging, while the data from all HC subjects was in-cluded in the analysis. The SNR in the grey matter of the visual cortexwas estimated to be 16 ± 3 and 22 ± 4 for the HC and VS acquisitions,respectively, with the lowest SNRs (TE = 129.2 ms, b = 1400 s/mm2).The ROIs selected for the HC and VS experiments contained 828 ±219 and 109 ± 52 (mean ± SD across subjects) voxels, respectively.
Hypercapnia
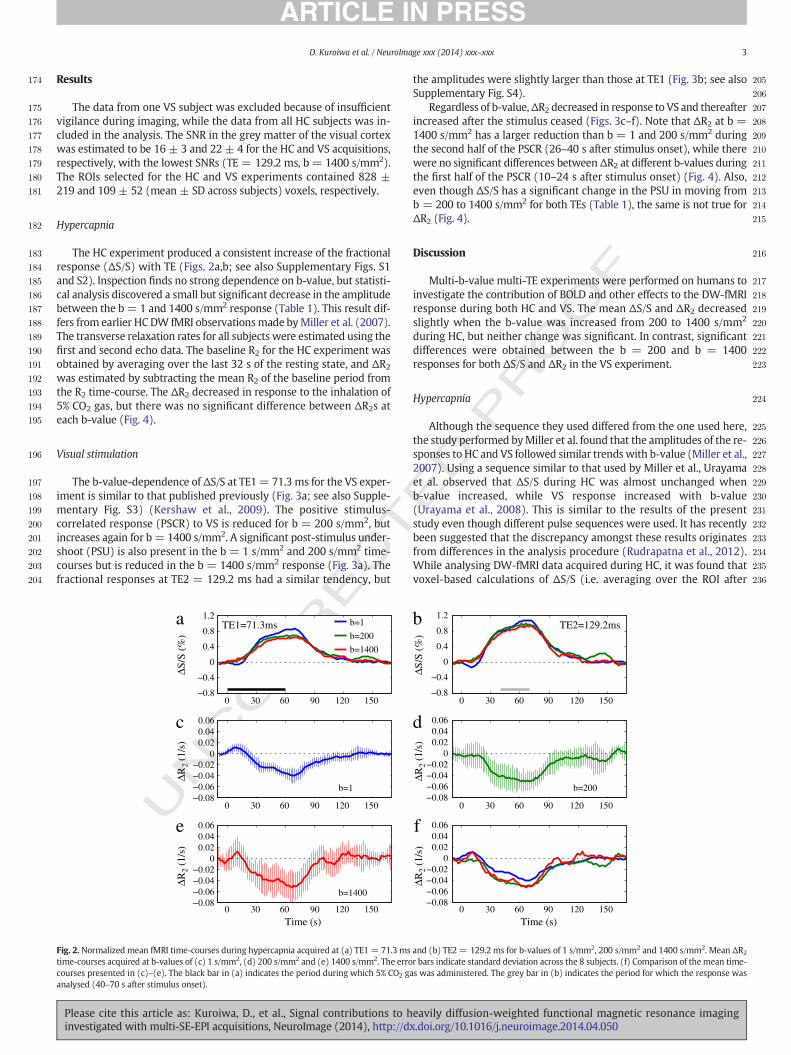
The HC experiment produced a consistent increase of the fractionalresponse (ΔS/S) with TE (Figs. 2a,b; see also Supplementary Figs. S1and S2). Inspection finds no strong dependence on b-value, but statisti-cal analysis discovered a small but significant decrease in the amplitudebetween the b = 1 and 1400 s/mm2 response (Table 1). This result dif-fers from earlier HC DW fMRI observationsmade byMiller et al. (2007).The transverse relaxation rates for all subjects were estimated using thefirst and second echo data. The baseline R2 for the HC experiment wasobtained by averaging over the last 32 s of the resting state, and ΔR2
was estimated by subtracting the mean R2 of the baseline period fromthe R2 time-course. The ΔR2 decreased in response to the inhalation of5% CO2 gas, but there was no significant difference between ΔR2s ateach b-value (Fig. 4).
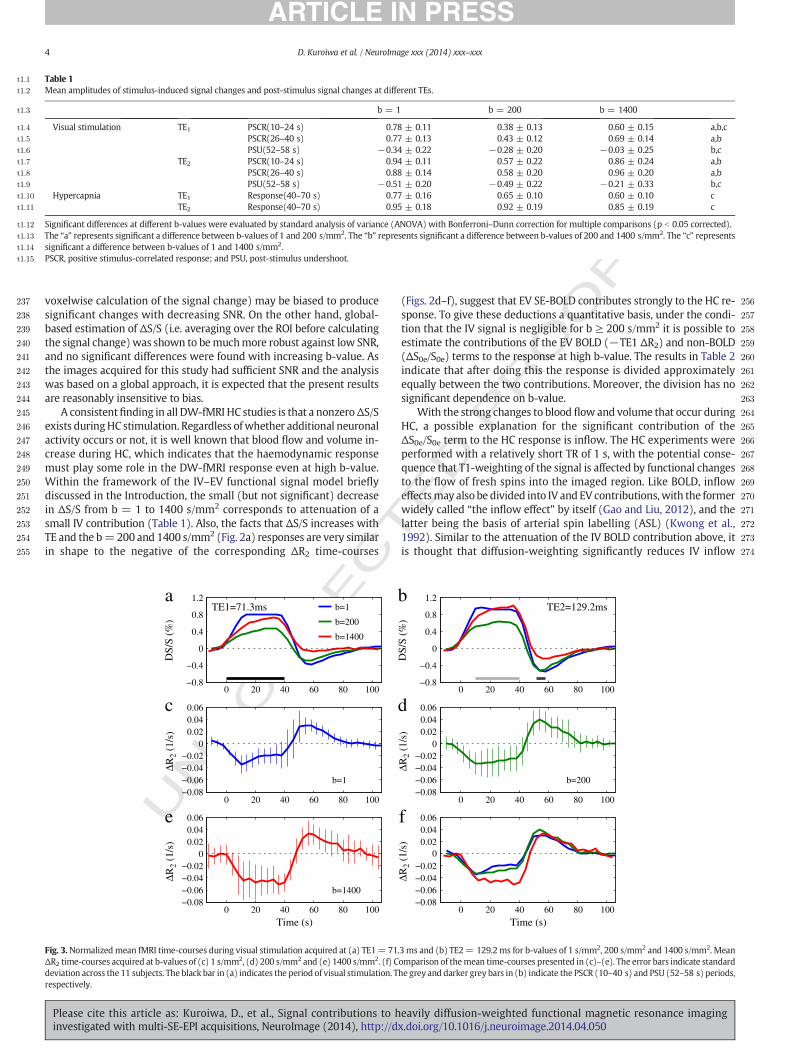
Visual stimulation
The b-value-dependence of ΔS/S at TE1= 71.3 ms for the VS exper-iment is similar to that published previously (Fig. 3a; see also Supple-mentary Fig. S3) (Kershaw et al., 2009). The positive stimulus-correlated response (PSCR) to VS is reduced for b = 200 s/mm2, butincreases again for b = 1400 s/mm2. A significant post-stimulus under-shoot (PSU) is also present in the b = 1 s/mm2 and 200 s/mm2 time-courses but is reduced in the b = 1400 s/mm2 response (Fig. 3a). Thefractional responses at TE2 = 129.2 ms had a similar tendency, but
UNCO
RRE
0 30 60 120 150−0.8
−0.4
0
0.4
0.8
1.2
ΔS/S
(%
)
b=1
b=200
b=1400
0 30 60 120 15090
90
900 30 60 120 150
−0.08−0.06−0.04−0.02
00.020.040.06
b=1
−0.08−0.06−0.04−0.02
00.020.040.06
Time (s)
b=1400
ΔR2
(1/s
) ΔR
2 (1
/s)
TE1=71.3msa
c
e
Fig. 2.Normalized mean fMRI time-courses during hypercapnia acquired at (a) TE1 = 71.3 mstime-courses acquired at b-values of (c) 1 s/mm2, (d) 200 s/mm2 and (e) 1400 s/mm2. The errocourses presented in (c)–(e). The black bar in (a) indicates the period during which 5% CO2 gaanalysed (40–70 s after stimulus onset).
Please cite this article as: Kuroiwa, D., et al., Signal contributions to hinvestigated with multi-SE-EPI acquisitions, NeuroImage (2014), http://dx
ED P
RO
OF
the amplitudes were slightly larger than those at TE1 (Fig. 3b; see alsoSupplementary Fig. S4).
Regardless of b-value,ΔR2 decreased in response to VS and thereafterincreased after the stimulus ceased (Figs. 3c–f). Note that ΔR2 at b =1400 s/mm2 has a larger reduction than b = 1 and 200 s/mm2 duringthe second half of the PSCR (26–40 s after stimulus onset), while therewere no significant differences betweenΔR2 at different b-values duringthe first half of the PSCR (10–24 s after stimulus onset) (Fig. 4). Also,even though ΔS/S has a significant change in the PSU in moving fromb = 200 to 1400 s/mm2 for both TEs (Table 1), the same is not true forΔR2 (Fig. 4).
Discussion
Multi-b-value multi-TE experiments were performed on humans toinvestigate the contribution of BOLD and other effects to the DW-fMRIresponse during both HC and VS. The mean ΔS/S and ΔR2 decreasedslightly when the b-value was increased from 200 to 1400 s/mm2
during HC, but neither change was significant. In contrast, significantdifferences were obtained between the b = 200 and b = 1400responses for both ΔS/S and ΔR2 in the VS experiment.
Hypercapnia
Although the sequence they used differed from the one used here,the study performed byMiller et al. found that the amplitudes of the re-sponses to HC and VS followed similar trends with b-value (Miller et al.,2007). Using a sequence similar to that used by Miller et al., Urayamaet al. observed that ΔS/S during HC was almost unchanged whenb-value increased, while VS response increased with b-value(Urayama et al., 2008). This is similar to the results of the presentstudy even though different pulse sequences were used. It has recentlybeen suggested that the discrepancy amongst these results originatesfrom differences in the analysis procedure (Rudrapatna et al., 2012).While analysing DW-fMRI data acquired during HC, it was found thatvoxel-based calculations of ΔS/S (i.e. averaging over the ROI after
0 30 60 90 120 150
0 30 60 90 120 150
0 30 60 90 120 150
−0.8
−0.4
0
0.4
0.8
1.2
−0.08−0.06−0.04−0.02
00.020.040.06
b=200
−0.08−0.06−0.04−0.02
00.020.040.06
Time (s)
TE2=129.2ms
ΔS/S
(%
)ΔR
2 (1
/s)
ΔR2
(1/s
)
b
d
f
and (b) TE2 = 129.2 ms for b-values of 1 s/mm2, 200 s/mm2 and 1400 s/mm2. Mean ΔR2
r bars indicate standard deviation across the 8 subjects. (f) Comparison of themean time-s was administered. The grey bar in (b) indicates the period for which the response was
eavily diffusion-weighted functional magnetic resonance imaging.doi.org/10.1016/j.neuroimage.2014.04.050
T
237
238
239
240
241
242
243
244
245
246
247
248
249
250
251
252
253
254
255
256
257
258
259
260
261
262
263
264
265
266
267
268
269
270
271
272
273
274
t1:1 Table 1t1:2 Mean amplitudes of stimulus-induced signal changes and post-stimulus signal changes at different TEs.
b = 1 b = 200 b = 1400t1:3
Visual stimulation TE1 PSCR(10–24 s) 0.78 ± 0.11 0.38 ± 0.13 0.60 ± 0.15 a,b,ct1:4
PSCR(26–40 s) 0.77 ± 0.13 0.43 ± 0.12 0.69 ± 0.14 a,bt1:5
PSU(52–58 s) −0.34 ± 0.22 −0.28 ± 0.20 −0.03 ± 0.25 b,ct1:6
TE2 PSCR(10–24 s) 0.94 ± 0.11 0.57 ± 0.22 0.86 ± 0.24 a,bt1:7
PSCR(26–40 s) 0.88 ± 0.14 0.58 ± 0.20 0.96 ± 0.20 a,bt1:8
PSU(52–58 s) −0.51 ± 0.20 −0.49 ± 0.22 −0.21 ± 0.33 b,ct1:9
Hypercapnia TE1 Response(40–70 s) 0.77 ± 0.16 0.65 ± 0.10 0.60 ± 0.10 ct1:10
TE2 Response(40–70 s) 0.95 ± 0.18 0.92 ± 0.19 0.85 ± 0.19 ct1:11
t1:12 Significant differences at different b-values were evaluated by standard analysis of variance (ANOVA) with Bonferroni–Dunn correction for multiple comparisons (p b 0.05 corrected).t1:13 The “a” represents significant a difference between b-values of 1 and 200 s/mm2. The “b” represents significant a difference between b-values of 200 and 1400 s/mm2. The “c” representst1:14 significant a difference between b-values of 1 and 1400 s/mm2.t1:15 PSCR, positive stimulus-correlated response; and PSU, post-stimulus undershoot.
4 D. Kuroiwa et al. / NeuroImage xxx (2014) xxx–xxx
voxelwise calculation of the signal change) may be biased to producesignificant changes with decreasing SNR. On the other hand, global-based estimation of ΔS/S (i.e. averaging over the ROI before calculatingthe signal change)was shown to bemuchmore robust against low SNR,and no significant differences were found with increasing b-value. Asthe images acquired for this study had sufficient SNR and the analysiswas based on a global approach, it is expected that the present resultsare reasonably insensitive to bias.
A consistentfinding in all DW-fMRI HC studies is that a nonzeroΔS/Sexists duringHC stimulation. Regardless ofwhether additional neuronalactivity occurs or not, it is well known that blood flow and volume in-crease during HC, which indicates that the haemodynamic responsemust play some role in the DW-fMRI response even at high b-value.Within the framework of the IV–EV functional signal model brieflydiscussed in the Introduction, the small (but not significant) decreasein ΔS/S from b = 1 to 1400 s/mm2 corresponds to attenuation of asmall IV contribution (Table 1). Also, the facts that ΔS/S increases withTE and the b=200 and 1400 s/mm2 (Fig. 2a) responses are very similarin shape to the negative of the corresponding ΔR2 time-courses
UNCO
RREC
−0.8
−0.4
0
0.4
0.8
1.2TE1=71.3ms
DS/
S (%
)
b=1
b=200
b=1400
−0.08−0.06−0.04−0.02
00.020.040.06
ΔR2
(1/s
)
b=1
0 20 40 60 80 100−0.08−0.06−0.04−0.02
00.020.040.06
Time (s)
ΔR2
(1/s
)
b=1400
0 20 40 60 80 100
0 20 40 60 80 100
a
c
e
Fig. 3.Normalized mean fMRI time-courses during visual stimulation acquired at (a) TE1= 71.ΔR2 time-courses acquired at b-values of (c) 1 s/mm2, (d) 200 s/mm2 and (e) 1400 s/mm2. (f) Cdeviation across the 11 subjects. The black bar in (a) indicates the period of visual stimulation. Trespectively.
Please cite this article as: Kuroiwa, D., et al., Signal contributions to hinvestigated with multi-SE-EPI acquisitions, NeuroImage (2014), http://d
ED P
RO
OF
(Figs. 2d–f), suggest that EV SE-BOLD contributes strongly to the HC re-sponse. To give these deductions a quantitative basis, under the condi-tion that the IV signal is negligible for b ≥ 200 s/mm2 it is possible toestimate the contributions of the EV BOLD (−TE1 ΔR2) and non-BOLD(ΔS0e/S0e) terms to the response at high b-value. The results in Table 2indicate that after doing this the response is divided approximatelyequally between the two contributions. Moreover, the division has nosignificant dependence on b-value.
With the strong changes to blood flow and volume that occur duringHC, a possible explanation for the significant contribution of theΔS0e/S0e term to the HC response is inflow. The HC experiments wereperformed with a relatively short TR of 1 s, with the potential conse-quence that T1-weighting of the signal is affected by functional changesto the flow of fresh spins into the imaged region. Like BOLD, infloweffectsmay also be divided into IV and EV contributions,with the formerwidely called “the inflow effect” by itself (Gao and Liu, 2012), and thelatter being the basis of arterial spin labelling (ASL) (Kwong et al.,1992). Similar to the attenuation of the IV BOLD contribution above, itis thought that diffusion-weighting significantly reduces IV inflow
0
0
0
TE2=129.2ms
b=200
−0.8
−0.4
0.4
0.8
1.2
DS/
S (%
)
−0.08−0.06−0.04−0.02
0.020.040.06
ΔR2
(1/s
)
−0.08−0.06−0.04−0.02
0.020.040.06
ΔR2
(1/s
)
0 20 40 60 80 100
0 20 40 60 80 100
0 20 40 60 80 100
Time (s)
b
d
f
3ms and (b) TE2= 129.2ms for b-values of 1 s/mm2, 200 s/mm2 and 1400 s/mm2. Meanomparison of themean time-courses presented in (c)–(e). The error bars indicate standardhe grey and darker grey bars in (b) indicate the PSCR (10–40 s) and PSU (52–58 s) periods,
eavily diffusion-weighted functional magnetic resonance imagingx.doi.org/10.1016/j.neuroimage.2014.04.050

T275
276
277
278
279
280
281
282
283
284
285
286
287
288
289
290
291
292
293
294
295
296
297
298
299
300
301
302
303
304
305
306
307
308
309
310
311
312
313
314
315
316
317
318
319
320
321
322
323
324
325
326
327
328
329
330
331
332
333
334
335
336
337
338
339
340
341
HC 1st Half of VS 2nd Half of VS PSU−0.08
−0.06
−0.04
−0.02
0
0.02
0.04
0.06ΔR
2 (1
/s)
b=1b=200b=1400
Fig. 4. ΔR2 changes during hypercapnia, the first (10–24 s after stimulus onset) andsecond (26–40 s) halves of VS, and the post-stimulus interval at each b-value. *The onlysignificant differences occurred between b = 1400 s/mm2 and the other two b-valuesduring the second half of VS.
t2:1
t2:2
t2:3
t2:4
t2:5
t2:6
t2:7
t2:8
t2:9
t2:10
t2:11
t2:12
t2:13
t2:14
t2:15
5D. Kuroiwa et al. / NeuroImage xxx (2014) xxx–xxx
RREC
signal between b= 1 and 200 s/mm2. On the other hand, it is expectedthat EV inflow effects are independent of diffusion-weighting (Kwonget al., 1992), and could therefore be the origin of a non-BOLD functionalresponse. The observation that the BOLD and non-BOLD componentsare similar for b = 200 and 1400 s/mm2 supports this. Future workcould test this hypothesis by performing DW-fMRI HC experiments atlonger TRs when inflow effects are expected to be much weaker.
Consistentwith previous HC studies (eg. (Davis et al., 1998; Leontievand Buxton, 2007)), ΔS/S had no PSU. The origin of the PSU remainscontroversial even though a number of possible sources have beendiscussed in the literature (Buxton, 2012). Suggested mechanisms canbe placed into two categories. The first concerns changes in neuralactivity; that is, there is either an undershoot in the neural activity ora relatively slow return of CMRO2 to baseline. Changes to neural activityduring HC are thought to be negligible, which means that CMRO2changes are also minor. The second category is related to perturbationsof the haemodynamic response in terms of either a CBF undershoot orrelatively slow return of CBV to baseline. It is unlikely that either ofthose conditions occurred during the HC experiments because PCO2changes occur only gradually. It therefore follows that these potentialmechanisms are all compatible with the observed data because noneis expected to produce a PSU during HC.
342
343
344
345
346
347
COVisual stimulation
ΔS/S is larger at b= 1400 than at b= 200 during VS, but not duringHC. If it is true that additional neuronal activity is only induced during
UN 348
349
350
351
352
353
355355
356
357
358
Table 2Signal contribution of BOLD (−TE1 × ΔR2) and non BOLD (ΔS0e/S0e) to ΔS/S.
b = 200 b = 1400
TE1 × ΔR2 Visualstimulation
PSCR(10–24 s) 0.23 ± 0.15 0.31 ± 0.20PSCR(26–40 s) 0.18 ± 0.13 0.33 ± 0.13 *PSU(52–58 s) −0.27 ± 0.11 −0.22 ± 0.13
Hypercapnia Response(40–70 s) 0.33 ± 0.12 0.31 ± 0.16ΔS0e/S0e Visual
stimulationPSCR(10–24 s) 0.15 ± 0.14 0.28 ± 0.24PSCR(26–40 s) 0.25 ± 0.13 0.35 ± 0.16PSU(52–58 s) −0.01 ± 0.21 0.18 ± 0.17
Hypercapnia Response(40–70 s) 0.32 ± 0.08 0.29 ± 0.15
Significant differences at different b-values were evaluated by standard analysis of vari-ance (ANOVA) with Bonferroni–Dunn correction for multiple comparisons (p b 0.05corrected). The “*” represents a significant difference between b-values of 200 and1400 s/mm2.
Please cite this article as: Kuroiwa, D., et al., Signal contributions to hinvestigated with multi-SE-EPI acquisitions, NeuroImage (2014), http://dx
ED P
RO
OF
VS, these results suggest that the information provided by heavily DWfMRI more closely reflects neural activity than standard fMRI.
Similar to the situation previously discussed for HC, within the IV–EV model the decrease in the PSCR when b is increased from 1 to200 s/mm2 is presumably due to a significant decrease in the IV contri-bution (Le Bihan et al., 1988). However, attenuation of the IV signal doesnot affect the PSU or ΔR2. From b= 200 to 1400 s/mm2, the increase inPSCR is coordinated with a decrease in ΔR2 during the same period, butthere is no change in ΔR2 for the PSU. It follows that the time-courses ofΔS/S and−ΔR2 at high b-value have dissimilar shapes because ΔS/S atTE1 has no PSU but −ΔR2 does. The EV BOLD/non-BOLD contributionsto this behaviourwerequantified in Table 2 using the sameassumptionsas for HC above. Notice that the significant signal increase during thesecond-half of the PSCR at b = 1400 s/mm2 is due to changes in bothEV transverse relaxation and ΔS0e/S0e, but it is only the change in R2
that is significantly different from its value at b = 200 s/mm2. Also, atb = 200 s/mm2 the PSU is almost completely due to the EV BOLDterm, but at b = 1400 s/mm2 the non-BOLD term has increased toalmost cancel the PSU. Clearly, under the IV–EV model the changes tothe PSCR and PSU at high b-value must originate from independenttime-varying EV BOLD and non-BOLD contributions.
Another consequence of an IV–EV interpretation is that, as thephysiology is unaffected by the imaging procedure, the significantchange to ΔR2 at high b-value suggests that the EV SE-BOLD signalmodel is modified by the application of the motion-probing gradients(MPGs). That is, interaction between the applied MPGs and thesusceptibility-induced gradients around the vessels perturbs the EV sig-nal at large b-values (Jin and Kim, 2008; Kershaw et al., 2009; Pampelet al., 2010; Yacoub et al., 2008). However, there is at present scant ex-perimental evidence to indicate that the EV signal is strongly affected bythe MPGs. This is supported by the fact that the ΔR2 during the PSU isunaffected when increasing b from 200 to 1400 s/mm2. It thereforeseems unlikely that the simple IV–EV model provides a satisfactory ex-planation for the high b-value DW-fMRI responses observed in thiswork.
Three-compartment interpretation for the VS data
The time-courses in Fig. 3a are similar to those published in a previ-ous DW-fMRI paper (Kershaw et al., 2009). In that work the differenttrends of the PSU and PSCR as a function of b-value were taken to sug-gest that they originate from distinct sources. A three-compartmentmodel where the b-value alters the weighting of each compartment inthe overall signal was proposed. The model was used to decomposethe signal into SDP, FDP and fast intravascular (FIV) time-courses, andit was suggested that signal changes originating from the SDP wouldbe more sensitive to SE-BOLD in capillary-sized vessels and those fromthe FDPwould reflect SE-BOLD in larger vessels. In the presentwork, ad-ditional information has been obtained in the form of the responses atthe second echo. As the behaviour of the second echodata is qualitative-ly similar to that at the first echo, it is natural to also consider the three-compartment model as a possible interpretation for the data. However,it is first necessary to modify the model to include the dependence onTE.
In general, the baseline signal for an N-compartment system in slowexchange can be written as (Autio et al., 2011)
S ¼XNj¼1
S0 je−bD j e−TER2 j ; ð1Þ
where R2j and Dj are the apparent transverse relaxation rate and appar-ent diffusion coefficient of compartment j, respectively, while S0j is anaggregate of quantities like the compartmental volume fraction, protondensity and T1-weighting, but is essentially the compartmental signalintensity when b and TE are zero. Assuming that the diffusion
eavily diffusion-weighted functional magnetic resonance imaging.doi.org/10.1016/j.neuroimage.2014.04.050

T
359
360
362362
363
364
365
366
367
368
369
370
371
372
373
374
375
376
377
379379
380
381
383383
384
385
386
387
388
389
390
391
392
393
394
395
396
397
398
399
400
401
402
403
404
405
406
407
408
409
410
6 D. Kuroiwa et al. / NeuroImage xxx (2014) xxx–xxx
coefficients are not altered by physiological changes during stimulation,it follows that the fractional signal change is
ΔSS
≈
XNj¼1
ΔS0 jS0 j
−TEΔR2 j
!S0 je
−bD j e−TER2 j
XNj¼1
S0 je−bD j e−TER2 j
: ð2Þ
Eq. (2) shows that when the signal consists of contributions frommultiple compartments, the TE dependence is just as important to therelative weighting of the signal contributions as the b-value is.
With N = 3, Eqs. (1) and (2) are a suitable generalisation of thethree-compartment model for a TE-dependent response. In applying itto the present data, the b-dependence of the signal was first used to de-compose into SDP, FDP and FIV contributions for each TE (i.e. TE1 andTE2) as described in Kershaw et al. (2009). Note that the commentsmade in Kershaw et al. (2009) about the analysis also apply here.Prior to decomposition the raw time-courses were linearly interpolatedto compensate for the 2 s offset between images acquired with b =1400 s/mm2 and those acquired with b = 1 or 200 s/mm2. Also, thediffusion coefficients of the SDP and FDP were presumed to be 0.16 ×10⁻³ mm2/s and 1.21 × 10⁻³ mm2/s, respectively. Subsequently, esti-mates of the compartmental transverse relaxation rates were obtainedwith
R2 j tð Þ ¼ln STE2 j=STE1 j� �TE2−TE1
; ð3Þ
where t denotes the time during the functional experiment. It followsthat the observed change is obtained as ΔR2j(t) = R2j(t) − R2j(tb),
UNCO
RREC
0 20 40 60 80 100−0.8
−0.4
0
0.4
0.8
1.2
DS/
S (%
)
b=1
SDP
FDP
FIV
0 20 40 60 80 100−0.15
−0.1
−0.05
0
0.05
0.1
0.15
ΔR2
(1/s
)
Time (s)
SDP
FDP
TE1=71.3msa
c
Fig. 5. The (a) TE1 = 71.3 ms and (b) TE2 = 129.2 ms VS time-courses after b-value decompobaseline for b= 1 s/mm2. Time-courses of themean (c)ΔR2 and (d)ΔS0e estimated for the SDPThe error bars indicate standard deviation across the 11 subjects and are only shown every 4intervals as defined in Fig. 3.
Please cite this article as: Kuroiwa, D., et al., Signal contributions to hinvestigated with multi-SE-EPI acquisitions, NeuroImage (2014), http://d
ED P
RO
OF
with R2j(tb) being the mean observed R2j during the baseline interval.The compartmental S0j can then be estimated with the equation
S0 j tð Þ ¼ STE1 j tð ÞeTE1 jR2 j tð Þ: ð4Þ
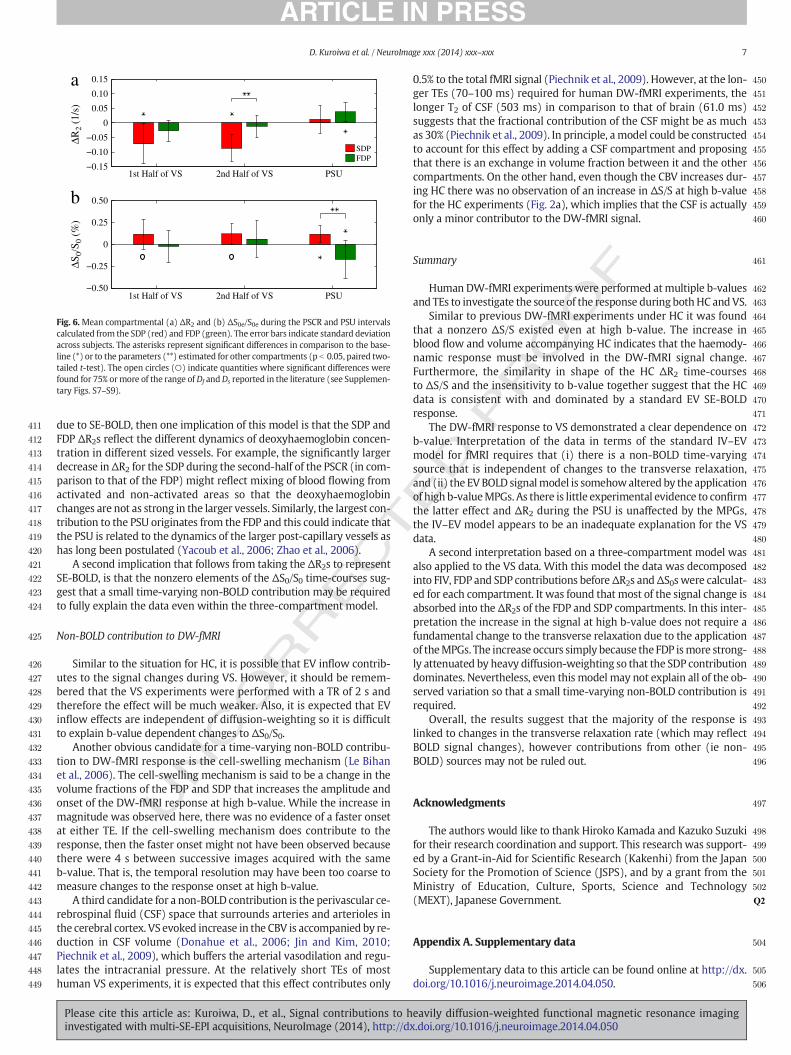
The VS time-courses after b-value decomposition are presented inFigs. 5a,b (see also Supplementary Figs. S5 & S6, as well as Supplemen-tary Table 1). For each TE, all three of the decomposed time-courseshave PSCRs, while only the FDP time-course shows a distinct PSU. TheSDP time-course is highly correlated with the stimulus without anyPSU. Similar PSCR and PSU patterns were found for TE1 and TE2,although the amplitudes at TE1 were slightly smaller than those atTE2. These results are consistent with those presented in previous stud-ies (Kershaw et al., 2009). The ensuing estimates of the ΔR2 and ΔS0 foreach compartment are shown in Figs. 5c,d. The ΔR2s estimated for theSDP during both halves of the PSCR period are significantly differentfrom zero (Fig. 6a). Note also the significant difference between theΔR2s during the second half of the PSCR. Only the ΔR2 of the FDP is sig-nificantly different from zero during the PSU period. Fig. 6b shows thatΔS0/S0 increased for the SDP and decreased for the FDP after the stimu-lus ceased. There was also a significant difference between the ΔS0/S0sfor the PSU. It is also noted in Fig. 6b that ΔS0/S0 for the SDP increasedduring both stimulus intervals (open circles), but those changes weresensitive to the choice of diffusion coefficients used in the three-compartment model analysis. Supplementary Figs. S7–S9 containmore detailed notes on this issue.
As noted above, the original interpretation proposed for the SDP andFDP time-courses is that they represent the SE-BOLD responses of capil-lary and larger sized vessels, respectively (Kershaw et al., 2009). Theextra information provided by the second echo data has allowed thesetime-courses to be further decomposed into changes in the compart-mental transverse relaxation rate (ΔR2) and other sources (ΔS0/S0). If,as in the IV–EV model, the ΔR2s are taken to represent signal changes
0 20 40 60 80 100−0.8
−0.4
0
0.4
0.8
1.2
0 20 40 60 80 100−0.5
−0.25
0
0.25
0.5
ΔS0/
S 0 (
%)
Time (s)
TE2=129.2ms
ΔS/S
(%
)
b
d
sition into SDP, FDP, and FIV contributions. The decomposed signal was normalized by theand FDP. ΔS0es were normalized by the baseline of the sum of S0 for the SDP, FDP and FIV.s to prevent overlapping. The black and grey bars in (a) and (b) correspond to the same
eavily diffusion-weighted functional magnetic resonance imagingx.doi.org/10.1016/j.neuroimage.2014.04.050
T411
412
413
414
415
416
417
418
419
420
421
422
423
424
425
426
427
428
429
430
431
432
433
434
435
436
437
438
439
440
441
442
443
444
445
446
447
448
449
450
451
452
453
454
455
456
457
458
459
460
461
462
463
464
465
466
467
468
469
470
471
472
473
474
475
476
477
478
479
480
481
482
483
484
485
486
487
488
489
490
491
492
493
494
495
496
497
498
499
500
501
502
503Q2
504
505
506
−0.15
−0.10
−0.05
0
0.05
0.10
0.15
SDPFDP
−0.25
0
0.25
1st Half of VS 2nd Half of VS PSU
1st Half of VS 2nd Half of VS PSU
0.50
−0.50
ΔR2
(1/s
) ΔS
0/S 0
(%
)a
b
Fig. 6.Mean compartmental (a) ΔR2 and (b) ΔS0e/S0e during the PSCR and PSU intervalscalculated from the SDP (red) and FDP (green). The error bars indicate standard deviationacross subjects. The asterisks represent significant differences in comparison to the base-line (*) or to the parameters (**) estimated for other compartments (p b 0.05, paired two-tailed t-test). The open circles (○) indicate quantities where significant differences werefound for 75% ormore of the range of Df andDs reported in the literature (see Supplemen-tary Figs. S7–S9).
7D. Kuroiwa et al. / NeuroImage xxx (2014) xxx–xxx
UNCO
RREC
due to SE-BOLD, then one implication of this model is that the SDP andFDP ΔR2s reflect the different dynamics of deoxyhaemoglobin concen-tration in different sized vessels. For example, the significantly largerdecrease inΔR2 for the SDP during the second-half of the PSCR (in com-parison to that of the FDP) might reflect mixing of blood flowing fromactivated and non-activated areas so that the deoxyhaemoglobinchanges are not as strong in the larger vessels. Similarly, the largest con-tribution to the PSU originates from the FDP and this could indicate thatthe PSU is related to the dynamics of the larger post-capillary vessels ashas long been postulated (Yacoub et al., 2006; Zhao et al., 2006).
A second implication that follows from taking the ΔR2s to representSE-BOLD, is that the nonzero elements of the ΔS0/S0 time-courses sug-gest that a small time-varying non-BOLD contribution may be requiredto fully explain the data even within the three-compartment model.
Non-BOLD contribution to DW-fMRI
Similar to the situation for HC, it is possible that EV inflow contrib-utes to the signal changes during VS. However, it should be remem-bered that the VS experiments were performed with a TR of 2 s andtherefore the effect will be much weaker. Also, it is expected that EVinflow effects are independent of diffusion-weighting so it is difficultto explain b-value dependent changes to ΔS0/S0.
Another obvious candidate for a time-varying non-BOLD contribu-tion to DW-fMRI response is the cell-swelling mechanism (Le Bihanet al., 2006). The cell-swelling mechanism is said to be a change in thevolume fractions of the FDP and SDP that increases the amplitude andonset of the DW-fMRI response at high b-value. While the increase inmagnitude was observed here, there was no evidence of a faster onsetat either TE. If the cell-swelling mechanism does contribute to theresponse, then the faster onset might not have been observed becausethere were 4 s between successive images acquired with the sameb-value. That is, the temporal resolution may have been too coarse tomeasure changes to the response onset at high b-value.
A third candidate for a non-BOLD contribution is the perivascular ce-rebrospinal fluid (CSF) space that surrounds arteries and arterioles inthe cerebral cortex. VS evoked increase in the CBV is accompanied by re-duction in CSF volume (Donahue et al., 2006; Jin and Kim, 2010;Piechnik et al., 2009), which buffers the arterial vasodilation and regu-lates the intracranial pressure. At the relatively short TEs of mosthuman VS experiments, it is expected that this effect contributes only
Please cite this article as: Kuroiwa, D., et al., Signal contributions to hinvestigated with multi-SE-EPI acquisitions, NeuroImage (2014), http://dx
0.5% to the total fMRI signal (Piechnik et al., 2009). However, at the lon-ger TEs (70–100 ms) required for human DW-fMRI experiments, thelonger T2 of CSF (503 ms) in comparison to that of brain (61.0 ms)suggests that the fractional contribution of the CSF might be as muchas 30% (Piechnik et al., 2009). In principle, amodel could be constructedto account for this effect by adding a CSF compartment and proposingthat there is an exchange in volume fraction between it and the othercompartments. On the other hand, even though the CBV increases dur-ing HC there was no observation of an increase in ΔS/S at high b-valuefor the HC experiments (Fig. 2a), which implies that the CSF is actuallyonly a minor contributor to the DW-fMRI signal.
ED P
RO
OF
Summary
Human DW-fMRI experiments were performed atmultiple b-valuesand TEs to investigate the source of the response during bothHC andVS.
Similar to previous DW-fMRI experiments under HC it was foundthat a nonzero ΔS/S existed even at high b-value. The increase inblood flow and volume accompanying HC indicates that the haemody-namic response must be involved in the DW-fMRI signal change.Furthermore, the similarity in shape of the HC ΔR2 time-coursesto ΔS/S and the insensitivity to b-value together suggest that the HCdata is consistent with and dominated by a standard EV SE-BOLDresponse.
The DW-fMRI response to VS demonstrated a clear dependence onb-value. Interpretation of the data in terms of the standard IV–EVmodel for fMRI requires that (i) there is a non-BOLD time-varyingsource that is independent of changes to the transverse relaxation,and (ii) the EVBOLD signalmodel is somehowaltered by the applicationof high b-valueMPGs. As there is little experimental evidence to confirmthe latter effect and ΔR2 during the PSU is unaffected by the MPGs,the IV–EV model appears to be an inadequate explanation for the VSdata.
A second interpretation based on a three-compartment model wasalso applied to the VS data. With this model the data was decomposedinto FIV, FDP and SDP contributions beforeΔR2s andΔS0swere calculat-ed for each compartment. It was found that most of the signal change isabsorbed into the ΔR2s of the FDP and SDP compartments. In this inter-pretation the increase in the signal at high b-value does not require afundamental change to the transverse relaxation due to the applicationof theMPGs. The increase occurs simply because the FDP ismore strong-ly attenuated by heavy diffusion-weighting so that the SDP contributiondominates. Nevertheless, even this model may not explain all of the ob-served variation so that a small time-varying non-BOLD contribution isrequired.
Overall, the results suggest that the majority of the response islinked to changes in the transverse relaxation rate (which may reflectBOLD signal changes), however contributions from other (ie non-BOLD) sources may not be ruled out.
Acknowledgments
The authors would like to thank Hiroko Kamada and Kazuko Suzukifor their research coordination and support. This research was support-ed by a Grant-in-Aid for Scientific Research (Kakenhi) from the JapanSociety for the Promotion of Science (JSPS), and by a grant from theMinistry of Education, Culture, Sports, Science and Technology(MEXT), Japanese Government.
Appendix A. Supplementary data
Supplementary data to this article can be found online at http://dx.doi.org/10.1016/j.neuroimage.2014.04.050.
eavily diffusion-weighted functional magnetic resonance imaging.doi.org/10.1016/j.neuroimage.2014.04.050
T
507
508509510511512513514515516517518519520521522523524525526527528529530531532533534535536537538539540541542543544545546547548549550
551552553554555556557558559560561562563564565566567568569570571572573574575576577578579580581582583584585586587588589590
8 D. Kuroiwa et al. / NeuroImage xxx (2014) xxx–xxx
References
Aso, T., Urayama, S., Poupon, C., Sawamoto, N., Fukuyama, H., Le Bihan, D., 2009. An intrin-sic diffusion response function for analyzing diffusion functional MRI time series.Neuroimage 47, 1487–1495.
Autio, J.A., Kershaw, J., Shibata, S., Obata, T., Kanno, I., Aoki, I., 2011. High b-value diffusion-weighted fMRI in a rat forepaw electrostimulation model at 7 T. Neuroimage 57,140–148.
Buxton, R.B., 2012. Dynamic models of BOLD contrast. Neuroimage 62, 953–961.Buxton, R.B., Wong, E.C., Frank, L.R., 1998. Dynamics of blood flow and oxygenation
changes during brain activation: the balloon model. Magn. Reson. Med. 39, 855–864.Darquie, A., Poline, J.B., Poupon, C., Saint-Jalmes, H., Le Bihan, D., 2001. Transient decrease
in water diffusion observed in human occipital cortex during visual stimulation. Proc.Natl. Acad. Sci. U. S. A. 98, 9391–9395.
Davis, T.L., Kwong, K.K., Weisskoff, R.M., Rosen, B.R., 1998. Calibrated functional MRI:mapping the dynamics of oxidative metabolism. Proc. Natl. Acad. Sci. U. S. A. 95,1834–1839.
Donahue, M.J., Lu, H., Jones, C.K., Edden, R.A.E., Pekar, J.J., van Zijl, P.C.M., 2006. Theoreticaland experimental investigation of the VASO contrast mechanism. Magn. Reson. Med.56, 1261–1273.
Gao, J.H., Liu, H.L., 2012. Inflow effects on functional MRI. Neuroimage 62, 1035–1039.Harshbarger, T.B., Song, A.W., 2004. B factor dependence of the temporal characteristics of
brain activation using dynamic apparent diffusion coefficient contrast. Magn. Reson.Med. 52, 1432–1437.
Jin, T., Kim, S.G., 2008. Functional changes of apparent diffusion coefficient during visualstimulation investigated by diffusion-weighted gradient-echo fMRI. Neuroimage 41,801–812.
Jin, T., Kim, S.-G., 2010. Change of the cerebrospinal fluid volume during brain activationinvestigated by T(1rho)-weighted fMRI. Neuroimage 51, 1378–1383.
Jin, T., Zhao, F., Kim, S.G., 2006. Sources of functional apparent diffusion coefficient chang-es investigated by diffusion-weighted spin-echo fMRI. Magn. Reson. Med. 56,1283–1292.
Kershaw, J., Tomiyasu, M., Kashikura, K., Hirano, Y., Nonaka, H., Hirano, M., Ikehira, H.,Kanno, I., Obata, T., 2009. A multi-compartmental SE-BOLD interpretation forstimulus-related signal changes in diffusion-weighted functional MRI. NMR Biomed.22, 770–778.
Kohno, S., Sawamoto, N., Urayama, S., Aso, T., Aso, K., Seiyama, A., Fukuyama, H., Le Bihan,D., 2009. Water-diffusion slowdown in the human visual cortex on visual stimulationprecedes vascular responses. J. Cereb. Blood Flow Metab. 29, 1197–1207.
Kuroiwa, D., Kershaw, J., Hirano, Y., Kamada, H., Nonaka, H., Hirano, M., Ikehira, H., Kanno,I., Obata, T., 2008. Behaviour of compartmentalized diffusion-weighted fMRI signalfrom human brain during hypercapnia. Proceedings of the 16th Annual Meeting ofISMRM, Toronto, p. 238.
Kwong, K.K., Belliveau, J.W., Chesler, D.A., Goldberg, I.E., Weisskoff, R.M., Poncelet, B.P.,Kennedy, D.N., Hoppel, B.E., Cohen, M.S., Turner, R., et al., 1992. Dynamic magnetic
UNCO
RRE
Please cite this article as: Kuroiwa, D., et al., Signal contributions to hinvestigated with multi-SE-EPI acquisitions, NeuroImage (2014), http://d
ED P
RO
OF
resonance imaging of human brain activity during primary sensory stimulation.Proc. Natl. Acad. Sci. U. S. A. 89, 5675–5679.
Le Bihan, D., Breton, E., Lallemand, D., Aubin, M.L., Vignaud, J., Laval-Jeantet, M., 1988.Separation of diffusion and perfusion in intravoxel incoherent motion MR imaging.Radiology 168, 497–505.
Le Bihan, D., Urayama, S., Aso, T., Hanakawa, T., Fukuyama, H., 2006. Direct and fast detec-tion of neuronal activation in the human brain with diffusion MRI. Proc. Natl. Acad.Sci. U. S. A. 103, 8263–8268.
Leontiev, O., Buxton, R.B., 2007. Reproducibility of BOLD, perfusion, and CMRO(2)measurements with calibrated-BOLD fMRI. Neuroimage 35, 175–184.
Miller, K.L., Bulte, D.P., Devlin, H., Robson, M.D., Wise, R.G., Woolrich, M.W., Jezzard, P.,Behrens, T.E.J., 2007. Evidence for a vascular contribution to diffusion FMRI at highb value. Proc. Natl. Acad. Sci. U. S. A. 104, 20967–20972.
Obata, T., Liu, T.T., Miller, K.L., Luh, W.M., Wong, E.C., Frank, L.R., Buxton, R.B., 2004.Discrepancies between BOLD and flow dynamics in primary and supplementarymotor areas: application of the balloon model to the interpretation of BOLD tran-sients. Neuroimage 21, 144–153.
Ogawa, S., Tank, D.W., Menon, R., Ellermann, J.M., Kim, S.G., Merkle, H., Ugurbil, K., 1992.Intrinsic signal changes accompanying sensory stimulation: functional brainmapping with magnetic resonance imaging. Proc. Natl. Acad. Sci. U. S. A. 89,5951–5955.
Ogawa, S., Menon, R.S., Tank, D.W., Kim, S.G., Merkle, H., Ellermann, J.M., Ugurbil, K., 1993.Functional brain mapping by blood oxygenation level-dependent contrast magneticresonance imaging. A comparison of signal characteristics with a biophysical model.Biophys. J. 64, 803–812.
Pampel, A., Jochimsen, T.H., Moller, H.E., 2010. BOLD background gradient contributionsin diffusion-weighted fMRI—comparison of spin-echo and twice-refocused spin-echo sequences. NMR Biomed. 23, 610–618.
Piechnik, S.K., Evans, J., Bary, L.H., Wise, R.G., Jezzard, P., 2009. Functional changes in CSFvolume estimated using measurement of water T2 relaxation. Magn. Reson. Med. 61,579–586.
Rudrapatna, U.S., van der Toorn, A., van Meer, M.P.A., Dijkhuizen, R.M., 2012. Impact ofhemodynamic effects on diffusion-weighted fMRI signals. Neuroimage 61, 106–114.
Urayama, S., Aso, K., Aso, T., Kohno, S., Sawamoto, N., Fukuyama, H., Le Bihan, D., 2008.Estimation of vascular contribution to DfMRI (Diffusion weighted fMRI) signal.Proceedings of the 16th Annual Meeting of ISMRM, Toronto, p. 403.
Yacoub, E., Ugurbil, K., Harel, N., 2006. The spatial dependence of the poststimulus under-shoot as revealed by high-resolution BOLD- and CBV-weighted fMRI. J. Cereb. BloodFlow Metab. 26, 634–644.
Yacoub, E., Uludag, K., Ugurbil, K., Harel, N., 2008. Decreases in ADC observed in tissueareas during activation in the cat visual cortex at 9.4 T using high diffusion sensitiza-tion. Magn. Reson. Imaging 26, 889–896.
Zhao, F., Wang, P., Hendrich, K., Ugurbil, K., Kim, S.G., 2006. Cortical layer-dependentBOLD and CBV responses measured by spin-echo and gradient-echo fMRI: insightsinto hemodynamic regulation. Neuroimage 30, 1149–1160.
C
eavily diffusion-weighted functional magnetic resonance imagingx.doi.org/10.1016/j.neuroimage.2014.04.050