5965 5406 2013 - conference prmia - smart beta - final_presentation
Upload
duongkhanhCategory
view
217download
0
A P P L I C A T I O N N O T E
Signal Analysis Measurement Fundamentals Optimize Noise Floor, Resolution Bandwidth, and More

Page 2Find us at www.keysight.com
For an RF engineer, a spectrum analyzer or signal analyzer is an essential and fundamental measurement tool, used in all phases of the product life cycle. Key characteristics such as performance, accuracy and speed help R&D engineers enhance their designs and help man-ufacturing engineers improve test efficiency and product quality. This note offers a variety of techniques that will help you master signal analysis in your application. Our focus is on helping you optimize attributes such as measurement noise floor, resolution bandwidth, dynamic range, sensitivity, and more, while maintaining speed and productivity.
We generally use the term “signal analyzer” to indicate an instrument that has a spectrum analyzer architecture and an all-digital intermediate frequency (IF) section that processes signals as complex vector quantities, enabling multi-domain operations such as digital modula-tion analysis and time capture. A broader discussion of spectrum and signal analyzers and their operation is available in Keysight Application Note 150, Spectrum Analysis Basics.
Improve Measurement Accuracy in Each Test Setup
To optimize measurement accuracy, it’s important to understand the signal analyzer’s inherent accuracy and identify the sources of error in the connection of the device under test (DUT). A combination of good measurement practices and useful analyzer features will mitigate errors and may shorten test time.
Digital IF technologies yield a high level of basic accuracy, especially when enhanced with internal calibrations and alignments. For example, self-generated corrections and highly repeatable digital filters give you the freedom to change settings during a measurement with little impact on repeatability. Typical examples include resolution bandwidth, range, reference level, center frequency, and span.
Once the DUT is connected to a calibrated analyzer, the signal-delivery network (Figure 1) may degrade or alter the signal of interest. Correcting or compensating for these effects will ensure the best accuracy. You can do this—conveniently and effectively—using the analyzer’s built-in amplitude correction function in conjunction with a signal source and a power meter.
DUT
- Cables- Adapters- Noise
Shift reference plane
Signal-delivery network
Spectrum analyzer
Figure 1. The quality of the DUT/analyzer connection can have a significant effect on measurement accuracy and repeatability. This effect grows as frequencies increase.
Introduction

Page 3Find us at www.keysight.com
Figure 3. Applying the analyzer’s amplitude-correction feature flattens the frequency response, improving amplitude accuracy.
Figure 2 depicts the measured frequency response of a signal-delivery network that attenuates the DUT’s signal. Removing the unwanted effects starts with measuring the frequency response of the signal-delivery network over the desired frequency span. In the analyzer, the amplitude correction feature uses a list of frequency/ amplitude pairs and linearly connects them to produce correction factors corresponding to the measured display points. It then adjusts the displayed magnitude according to those corrections. In Figure 3, the unwanted attenuation and gain of the signal-delivery network have been eliminated from the measurement, providing the fully specified accuracy of the signal analyzer.
Figure 2. This trace shows the measured frequency response of the DUT/analyzer connection.
Page 4Find us at www.keysight.com
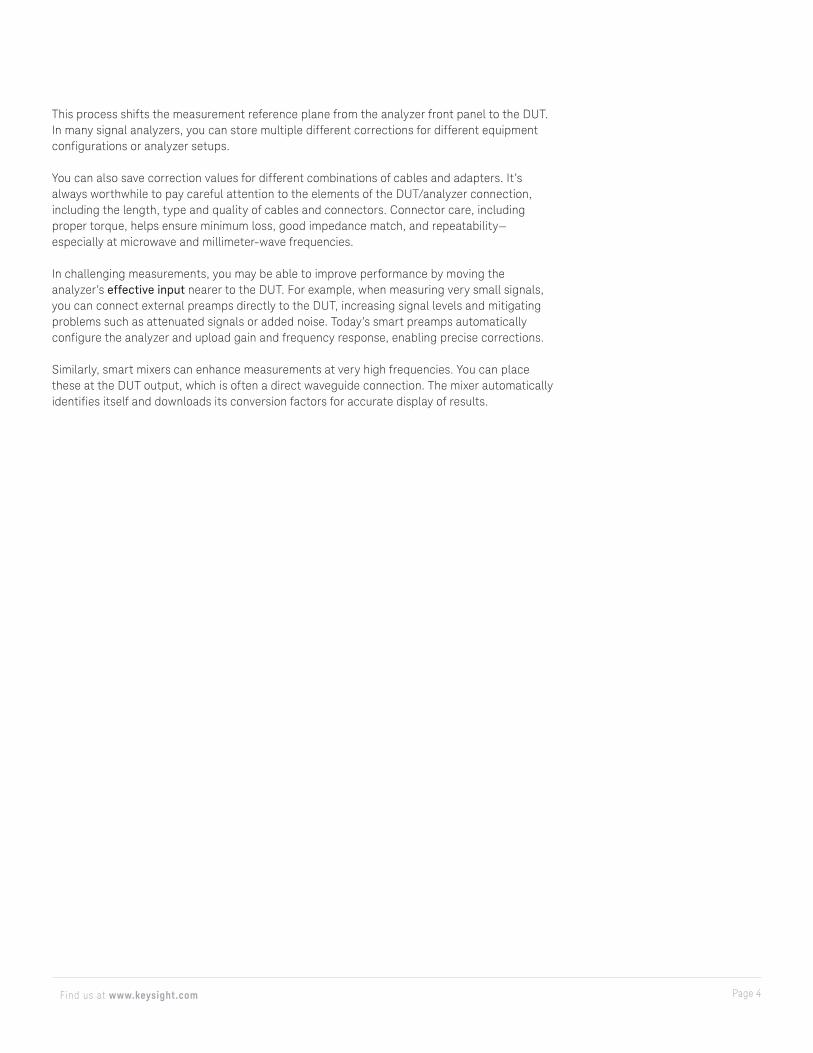
This process shifts the measurement reference plane from the analyzer front panel to the DUT. In many signal analyzers, you can store multiple different corrections for different equipment configurations or analyzer setups.
You can also save correction values for different combinations of cables and adapters. It’s always worthwhile to pay careful attention to the elements of the DUT/analyzer connection, including the length, type and quality of cables and connectors. Connector care, including proper torque, helps ensure minimum loss, good impedance match, and repeatability—especially at microwave and millimeter-wave frequencies.
In challenging measurements, you may be able to improve performance by moving the analyzer’s effective input nearer to the DUT. For example, when measuring very small signals, you can connect external preamps directly to the DUT, increasing signal levels and mitigating problems such as attenuated signals or added noise. Today’s smart preamps automatically configure the analyzer and upload gain and frequency response, enabling precise corrections.
Similarly, smart mixers can enhance measurements at very high frequencies. You can place these at the DUT output, which is often a direct waveguide connection. The mixer automatically identifies itself and downloads its conversion factors for accurate display of results.

Page 5Find us at www.keysight.com
Balance the Tradeoffs when Setting Resolution Bandwidth
The resolution bandwidth setting is a fundamental analysis parameter. It’s especially important when the goal is to separate crucial spectral components and set the noise floor such that you can more easily distinguish signals of interest from noise contributed by the analyzer or DUT.
When performing demanding measurements, spectrum analyzers must be accurate and have an adequate combination of measurement speed and high dynamic range. In most cases, emphasis on one adversely affects the other. One key tradeoff is the use of a narrow or wide resolution bandwidth.
A narrow setting is advantageous when measuring low-level signals: it lowers the displayed average noise level (DANL) of the spectrum analyzer, increasing the dynamic range and improving measurement sensitivity. In Figure 4, an apparent –103 dBm signal is more properly measured by changing the resolution bandwidth from 100 kHz to 10 kHz: the 10x reduction in resolution bandwidth improves DANL by 10 dB.
Of course, a narrow setting is not always ideal. For modulated signals, it is important to set the resolution bandwidth wide enough to include the sidebands. Doing otherwise will produce inaccurate power measurements unless an integrated band power measurement is made (e.g., combining multiple measurement points to cover the entire signal bandwidth). Such a measurement—integrating power from many points measured with a narrow resolution bandwidth—is often the most practical technique for wideband digitally modulated signals that are closely spaced.
Figure 4. Reducing resolution bandwidth from 100 kHz to 10 kHz improves DANL and makes it easier to see the signal of interest.
Page 6Find us at www.keysight.com
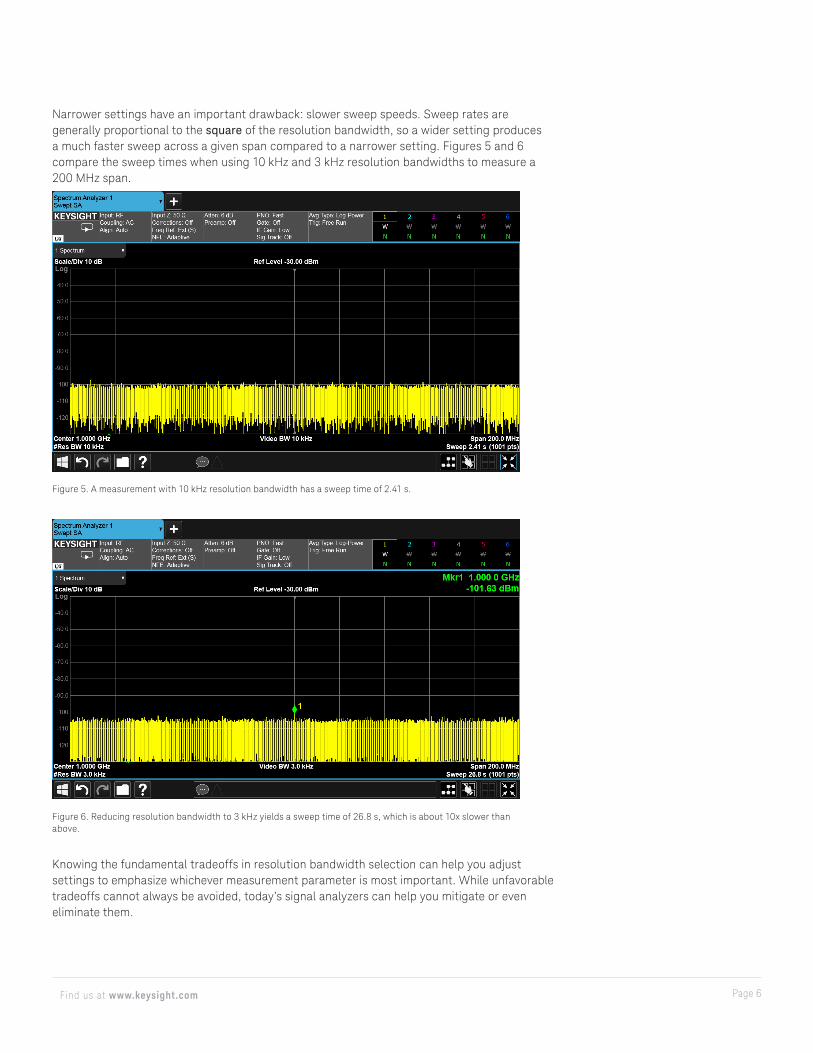
Narrower settings have an important drawback: slower sweep speeds. Sweep rates are generally proportional to the square of the resolution bandwidth, so a wider setting produces a much faster sweep across a given span compared to a narrower setting. Figures 5 and 6 compare the sweep times when using 10 kHz and 3 kHz resolution bandwidths to measure a 200 MHz span.
Knowing the fundamental tradeoffs in resolution bandwidth selection can help you adjust settings to emphasize whichever measurement parameter is most important. While unfavorable tradeoffs cannot always be avoided, today’s signal analyzers can help you mitigate or even eliminate them.
Figure 5. A measurement with 10 kHz resolution bandwidth has a sweep time of 2.41 s.
Figure 6. Reducing resolution bandwidth to 3 kHz yields a sweep time of 26.8 s, which is about 10x slower than above.

Page 7Find us at www.keysight.com
Today’s analyzers ensure accurate measurements—even when using narrow resolution bandwidths—by utilizing digital signal processing such as fast Fourier transforms (FFTs) and digital resolution bandwidth filtering with correction for sweep speed effects. “Fast sweep” features, for example, can increase sweep rates by as much as 50x for narrow settings. Signal analyzers can automatically implement these improvements as part of their center/span/RBW autocoupling, and you can further refine the setup by manually optimizing for specific priorities such as speed and accuracy.
Increase Sensitivity When Measuring Low-Level Signals
An analyzer’s self-generated noise limits its ability to measure low-level signals, and a variety of settings affect the level of that noise. For example, Figure 7 shows how the analyzer’s noise floor obscures a 50 MHz signal.
To measure this low-level signal, you can improve the analyzer’s sensitivity by combining the following: minimizing input attenuation, narrowing the resolution bandwidth (RBW) filter, and using a preamplifier. Similar to the earlier technique, these techniques lower DANL, separate small signals from noise, and enable accurate measurements.
Reducing input attenuation increases the level of the incoming signal at the analyzer’s input mixer. Because the analyzer’s own noise is generated after the attenuator, the attenuation setting affects the signal-to-noise ratio (SNR) of the measurement. If gain in the analyzer is coupled to the input attenuator to compensate for changes, real signals remain stationary on the display. However, DANL changes with IF gain, reflecting the change in SNR that results from any change in the attenuator setting. Therefore, minimizing input attenuation is essential to improving DANL.
After passing through the mixer and any internal amplification, the re-amplified signal then enters the IF section that contains the resolution bandwidth filter. By narrowing the filter width, less noise energy reaches the analyzer’s envelope detector and this lowers the DANL of the measurement.
Figure 7. In the shown configuration, the analyzer’s noise obscures a small signal.

Page 8Find us at www.keysight.com
Figure 8 shows successive reductions in DANL (note the reduction in reference level). The top trace shows the CW signal above the noise floor after minimizing resolution bandwidth. The middle trace shows the improvement after minimizing attenuation. The lower trace employs logarithmic power averaging (using log-scaled dB readings), re-ducing the noise floor another 2.5 dB without affecting the measurement of CW signals. When combined with peak detection (the display detector setting), this is a useful way to measure spurious signals near the noise floor (a common signal analysis task).
Achieving maximum sensitivity requires use of a preamplifier with low noise and high
gain. If the amplifier gain is sufficiently high (e.g., displayed noise increases by at least 10 dB), then the noise figure of the amplifier dominates the combined noise floor of preamplifier plus analyzer.
Subtracting the analyzer’s noise-power contribution from a specific measurement is an effective way to reduce noise in spectrum measurements. While you could do this by measuring the noise floor for each measurement, some Keysight X-Series signal analyzers offer a more practical method called noise floor extension (NFE). With NFE, the analyzer accurately models and characterizes noise power at each measurement point, and it automatically subtracts these from the measurement. This can reduce the effective noise floor by10 dB or more without changing sweep times. This technique can be used in addition to the steps described above.
As mentioned earlier, the combination of log power averaging and peak detection provides a 2.5 dB SNR benefit when measuring spurious signals near noise. Alternatively, if the priority is maximum reduction of measurement variance in the noise floor (e.g., a smoother trace) then power averaging using the “average” display detector may be the best choice. The combination of the average detector and a slower sweep time is the most efficient way to reduce variance due to noise (e.g., smooth the noise floor).
Figure 8. In these signal measurements, DANL becomes progressively lower after reducing resolution bandwidth (yellow), reducing input attenuation (blue), and switching to log power averaging (purple).

Page 9Find us at www.keysight.com
A technique called synchronous or time averaging is worth considering for the special case of time-varying signals that repeat consistently. This feature is available in vector signal analyzers and involves averaging samples of the input signal in the time domain before calculating a frequency spectrum. A trigger is used to synchronize the time-domain samples to the repeating signal. The net effect is a substantial reduction in the effective noise floor for measurements in the time, frequency, and modulation domains.
Optimize Dynamic Range when Measuring Distortion
A fundamental factor in spectrum analysis is the ability of an instrument to distinguish a signal’s large fundamental tone from its smaller distortion products. This is the analyzer’s dynamic range, specified as the maximum difference between signal and distortion, signal and noise, or signal and phase noise.
When measuring the combination of a signal and distortion, the level at the input mixer dictates the dynamic range. The mixer level used to optimize dynamic range can be determined from three specifications: second-harmonic distortion (SHD), third-order intermodulation (TOI) distortion, and DANL. Incorporating all three of these in a single graph creates a plot of mixer level versus internally generated distortion and noise.
Figure 9 plots the –75 dBc SHD point at a mixer level of –40 dBm, the –85 dBc TOI point at a mixer level of –30 dBm, and a noise floor of –110 dBm corresponding to a 10 kHz resolution bandwidth. The SHD line is drawn with a slope of 1 because SHD increases by 2 dB for each 1 dB increase in the level of the fundamental at the mixer. However, because distortion is determined by the difference between fundamental and distortion product, the change is only 1 dB. Similarly, TOI is drawn with a slope of 2: for every 1 dB change in mixer level, third-order products change 3 dB, or 2 dB in a relative sense. The maximum second- and third-order dynamic range can be achieved by setting the attenuator so that the signal level at the mixer corresponds to the point where the second- and third-order distortions are equal to the noise floor (annotation in the graph identifies these mixer levels). Note that the minimum point is on a small curve resulting from the addition of distortion and noise on the log (dB) scale.
–60 –50 –40 –30 –20 –10 +100
–90
–80
–70
–60
–50
–40
–30
–20
–10
0
seco
nd-order
Noise (10 kHz BW)
third
-ord
er
Mixer level (dBm)
(dBc
)
Maximum second-orderdynamic range
Maximum third-orderdynamic range
Optimummixer levels
–100
TOI SHI
Figure 9. Second- and third-order dynamic range are shown as determined by minimum distortion regions at the intersection of DANL and the corresponding distortion curves.

Page 10Find us at www.keysight.com
To increase dynamic range, a narrower resolution bandwidth must be used. As shown in Figure 10, dynamic range increases when the RBW setting is decreased from 10 kHz to 1 kHz. Note that the increase is 5 dB for second-order and more than 6 dB for third-order distortion.
As a final point, the analyzer’s phase noise can also affect dynamic range for intermodu-lation distortion (IMD). Reason: the frequency spacing between the various spectral components (e.g., test tones and distortion products) is equal to the spacing between the intermodulation test tones. For example, test tones separated by 10 kHz and measured using a 1 kHz resolution bandwidth will result in the noise curve shown in Figure 11. If the analyzer phase noise at a 10 kHz offset is only –80 dBc, then 80 dB will be the maximum dynamic range for this measurement, not the 88 dB suggested by the intersection of DANL and third-order distortion.
–60 –50 –40 –30 –20 –10 +100
–90
–80
–70
–60
–50
–40
–30
seco
nd-o
rder
Noise (10 kHz BW)
Noise (1 kHz BW)
third
-ord
er
Mixer level (dBm)
(dB
c)
second-order dynamic range improvement
third-order dynamic range improvement
–60 –50 –40 –30 –20 –10 +100
–100
–110
–90
–80
–70
–60
Mixer level (dBm)
(dB
c)
Dynamic rangereduction dueto phase noise
Phase noise(10 kHz offset)
Figure 10. Reducing RBW lowers the analyzer’s DANL (lines starting at lower left) and improves the operating point for both second- and third-order dynamic range.
Figure 11. For closely spaced signals such as intermodulation test tones, phase noise may limit the measurement dynamic range to a value less than that the chart would suggest.
Page 11Find us at www.keysight.com
Accurately Isolate and Measure Bursts and Transients
It’s difficult to accurately measurement bursted or pulsed signals, especially those that carry modulation, when using a swept spectrum analyzer. The analyzer will display a combination of the information carried by the pulse plus the frequency content of the shape of the pulse (e.g., pulse envelope). Sharp rise and fall times will produce unwanted frequency components in the spectrum. These unwanted artifacts can obscure the signal of interest and reduce measurement accuracy.
Two measurement techniques address these problems: time-gated spectrum analysis and triggered FFT analysis with a vector signal analyzer (VSA). Both are available in signal analyzers such as the Keysight X-Series.
In swept analysis, the most flexible (and frequently used) technique is gated sweep or gated LO. In this method, the analyzer is configured to sweep and take data only during the desired portion of the input signal. An external trigger may be used to synchronize measurements; however, some analyzers can generate triggers from the pulses them-selves. It’s important to note that this type of time-selective spectrum analysis requires a signal that repeats consistently. By accumulating successive measurements, the analyzer builds up a complete spectrum result that provides stable and accurate results.
Generally, the intended effect is to measure the spectrum of the signal during the pulse or burst itself and reject the spectral effects of the pulse switching on or off. This allows the use of gating with automated power-measurement functions such as channel power or adjacent-channel power (ACP) and spectrum emissions mask (SEM).
The other technique involves FFT processing of the signal and is sometimes called gated FFT. This method does not require a repeating signal; however, if the signal does repeat, SNR may benefit from time averaging (as described previously).
Gated FFT analysis is most powerful and flexible when performed with a signal analyzer and VSA software. The software performs triggering functions such as precisely adjusting trigger timing plus gate or FFT time-record length to match the bursts of the signal under test.
The VSA software also allows wide adjustment of the number of FFT points and selection of the applied window shape (i.e., weighting). Window shapes carry inherent tradeoffs between amplitude accuracy, frequency resolution and dynamic range in the resulting measurements. Optimizing these tradeoffs helps you extract the maximum amount of information from brief signal bursts.
One especially effective approach for time-selective signal analysis applies to signals that are self-windowing—that is, those that are periodic in a specific time interval. Examples include the orthogonal frequency-division multiplexing (OFDM) signals commonly used in wireless systems. For these, the time-record length or gate length can be set to match a single OFDM symbol or an integer number of symbols, and a uniform window is then selected. This window is flat in the time domain, and it relies on the match between the periodicity of the signal under test and the window or FFT time record.

Page 12Find us at www.keysight.com
Figure 12 compares the flat-top window, designed for amplitude accuracy (i.e., flat in the frequency domain), to the uniform window when measuring two symbols of an OFDM training sequence. In this situation, the uniform window provides high accuracy and optimum frequency resolution.
Enhance Speed, Accuracy, Reliability with Measurement Applications
The increasing complexity of signals in wireless and aerospace/defense applications has made it more difficult—and sometimes impractical—to manually configure some spectrum and modulation-quality measurements. Fortunately, the processing capabilities in today’s signal analyzer make it easier to set up not only complex measurements but also traditional measurements such as spurious, harmonics, and phase noise.
The most convenient way to combine processing power with measurement intelligence is through measurement application software (“measurement applications”) installed and resident in the signal analyzer. These applications can be divided into two broad categories: general-purpose and standard-specific.
General-purpose applications are focused on traditional analysis tasks, extending into areas where instrument-hosted automation can handle a range of common requirements. These applications are helpful in the development and manufacturing of RF and microwave transceivers and their components. In the Keysight X-Series signal analyzers, PowerSuite is a standard feature. This comprehensive set of measurements includes channel power, ACP, occupied bandwidth, complementary cumulative distribution function (CCDF), harmonic distortion, spurious emissions, TOI, and SEM.
Figure 12. Both traces show an off-air capture of an OFDM WLAN waveform in the 5 GHz band. In each measurement, the gate is aligned with a portion of the self-windowing training sequence. In the lower trace, the uniform window provides sufficient resolution to reveal individual OFDM subcarriers.

Page 13Find us at www.keysight.com
Other general-purpose applications address phase noise, noise figure, electromagnetic compatibility (EMC), and comprehensive pulse analysis (Figures 13 and 14, respectively). In all cases, the measurement applications dramatically ease measurement set-up (reducing tedium and errors) and provide customized displays that summarize large numbers of measurement results to simplify interpretation or provide pass/fail indications (Figures 13 and 14).
Figure 13. The N6141C EMC application configures measurements is compliant with CISPR 16-1-1 or MIL-STD requirements when performing pre-compliance measurements of conducted and radiated emissions.
Figure 14. The N9067C pulse measurement application gathers information from large numbers of pulses and calculates parameters such as period, width, pulse repetition interval (PRI), rise/fall time, overshoot, average power, and peak power.

Page 14Find us at www.keysight.com
Identify Internal Distortion Products
When high-level signals reach the spectrum analyzer input, they may cause distortion products that mask the real distortion on the input signal. Using dual traces and the analyzer’s RF atten-uator, you can determine whether or not distortion generated within the analyzer is affecting the measurement.
This is a useful measurement, as it allows you to optimize the critical attenuation setting for your specific setup—signal, analyzer, and connection. This individualized optimization is often better than what you might calculate from guaranteed instrument specifications.
To start, set the analyzer’s input attenuator so that the input signal level minus the attenuator setting is about 0 dBm. To identify these products, tune to the second harmonic of the input signal and set the input attenuator to 0 dBm. Next, save the screen data in Trace B, select Trace A as the active trace, and activate Marker ∆. The spectrum analyzer now shows the stored data in Trace B and the measured data in Trace A, while Marker ∆ shows the amplitude and frequency difference between the two traces. Finally, increase the RF attenuation by ~15 dB and compare the response in Trace A to the response in Trace B.

Page 15Find us at www.keysight.com
Dozens of standard-specific applications are available for signal analyzers, mainly for established and emerging wireless standards such as LTE/LTE-Advanced, GSM, W-CDMA, WLAN, Bluetooth, and digital video. These transform a basic RF tool—the signal analyzer—into a standards-based transmitter tester, providing RF conformance tests and informative displays for evaluation and troubleshooting. In some cases an application is the only practical way to configure the analysis of complex, highly-specific wireless standards.
Figures 15 and 16 show LTE-based examples of typical measurements from the N9080/9082C measurement application. These displays include both graphical and tabular measurement data, and can be configured for pass/fail testing.
Channel power measurements of advanced digital-modulation schemes can be complex to manually configure and tedious to interpret. For example, the LTE-Advanced standard includes a cumulative ACLR (CACLR) measurement for signals configured for non-contiguous carrier aggregation.
Figure 15. This display of an LTE downlink demodulation result includes the constellations of different signal layers (top) and detected resource allocations (bottom right).

Page 16Find us at www.keysight.com
If the responses in Trace A and Trace B differ, as in Figure 16, then the analyzer’s mixer is generating internal distortion products due to the high level of the input signal. In this case, more attenuation is required, leading to the result in Figure 17. In some analyzers you can experiment with attenuation values in steps as small as 1 dB.
Figure 16. Because the signal analyzer accounts for input attenuation and reference level, a difference in the apparent second-harmonic amplitude is due to distortion from the analyzer.
Figure 17. The second-harmonic measurements appear at the same amplitude, indicating that the analyzer’s own distortion is not causing an error in the result.

Page 17Find us at www.keysight.com
Find and Measure Elusive Signals using Real-Time Analysis
Whether you work in wireless or aerospace/defense, many signals are pulsed or bursted, or they otherwise exhibit complex transient behavior that must be characterized. In some cases, undesirable signals or behaviors are obscured and therefore difficult to detect or isolate. Understanding these signals or behaviors may be essential to troubleshooting or optimizing a system.
The digitizing architecture and high-speed DSP used in many signal analyzers addresses these needs in two ways: real-time spectrum analyzers and signal recording/playback in vector signal analyzers. Previously, both of these capabilities were implemented as separate, dedicated products. Today, both available as optional capabilities for mainstream signal analyzers such as the Keysight X-Series.
Real-time spectrum analyzers (RTSAs) use specialized processing in the IF section to calculate spectrum results from the continuous stream of sampled data representing the IF input. They perform these spectrum calculations with sufficient speed that all signal samples are processed, producing gap-free spectrum results. No signals or behaviors are missed.
Because RTSA can generate spectra at very high rate—many thousands per second—the human eye cannot see or interpret individual spectra. Instead, spectra are presented in displays that typically use color to indicate how often specific amplitude/frequency combinations occur in the results. The color and shading of these spectral density displays can be adjusted to show or highlight very frequent—or, more often, very infrequent—events (Figure 18).
Figure 18. These off-air spectrum density measurements of the 2.4 GHz ISM band include brief Bluetooth hops and longer WLAN transmissions. Amplitude and frequency values that occur more often are shown in red and yellow, while less-frequent values are shown in blue (e.g., Bluetooth hops).

Page 18Find us at www.keysight.com
The real-time spectral-density displays are useful when chasing intermittent signals or behaviors, and the measurements behind them can be used to generate triggers for isolating specific signals or behaviors. A frequency mask can be manually or auto-matically generated, and signals that violate a mask result in a trigger event (Figure 19).
When pursuing elusive signals or behaviors, the most powerful analysis technique is the combination of frequency mask triggering and the signal capture/playback capability of VSAs. While the RTSA measurements resulting from the frequency mask trigger are power spectrum only, the VSA signal capture or time capture records the complete time record of the signal, a vector quantity. By post-processing this complete recording, the VSA can perform multiple types of analysis, including spectrum, time domain, and demodulation (Figure 20).
Figure 19. In the RTSA option, the frequency mask trigger is shown by the dark green shading above the spectrum, and level/frequency combinations are defined by the circles. Signal hops that occur outside the mask generate a trigger.
Figure 20. This vector signal analyzer display shows a frequency mask trigger initiating the capture and subsequent demodulation of a single frequency hop.

This information is subject to change without notice. © Keysight Technologies, 2016-2017, 2019, Published in USA, March 7, 2019, 5965-7009E
Page 19Find us at www.keysight.com
Learn more at: www.keysight.comFor more information on Keysight Technologies’ products, applications or services,
please contact your local Keysight office. The complete list is available at:
www.keysight.com/find/contactus
To reveal more information about signal behavior, captures initiated by a frequency mask trigger can be adjusted to begin after or before the trigger event. This flexible timing can be very useful in troubleshooting when looking for a cause that precedes a specific signal behavior, or when cause and behavior are separated in time.
Conclusion
Engineering is all about connecting ideas and solving problems. This experience drives the X-Series signal analyzers. They’re the benchmark for accessible performance that puts you closer to the answer by easily linking cause and effect. Across the full spectrum—from CXA to UXA—you’ll find the tools you need to design, test and deliver your next breakthrough. Reach for the X-Series and make an inspired connection.
To learn more, read Spectrum Analysis Basics or visit www.keysight.com/find/X-Series