Siemens Industry Creating Value through Technological ......Residential building market :End market...
30
Copyright © Siemens AG 2008. All rights reserved Siemens Industry − Creating Value through Technological Leadership Dr. Heinrich Hiesinger, CEO Industry Capital Market Days 'Industry' Munich, December 18, 2008
Transcript of Siemens Industry Creating Value through Technological ......Residential building market :End market...
Copyright © Siemens AG 2008. All rights reserved
Siemens Industry −Creating Value through Technological LeadershipDr. Heinrich Hiesinger, CEO Industry
Capital Market Days 'Industry'Munich, December 18, 2008
Copyright © Siemens AG 2008. All rights reservedPage 2 December 2008 Capital Market Days 'Industry'
Safe Harbour Statement
This document contains forward-looking statements and information – that is, statements related to future, not past, events. These statements may be identified by words such as “expects,” “looks forward to,” “anticipates,” “intends,” “plans,” “believes,” “seeks,” “estimates,” “will,” “project” or words of similar meaning. Such statements are based on our current expectations and certain assumptions, and are, therefore, subject to certain risks and uncertainties. A variety of factors, many of which are beyond Siemens’ control, affect our operations, performance, business strategy and results and could cause the actual results, performance or achievements of Siemens to be materially different from any future results, performance or achievements that may be expressed or implied by such forward-looking statements. For us, particular uncertainties arise, among others, from changes in general economic and business conditions (including margin developments in major business areas); the behavior of financial markets, including fluctuations in interest and exchange rates, commodity and equity prices, debt prices (credit spreads) and financial assets generally; continued volatility and further deterioration of the capital markets; the commercial credit environment and, in particular, additional uncertainties arising out of the subprime, financial market and liquidity crises; future financial performance of major industries that we serve, including, without limitation, the Sectors Industry, Energy and Healthcare; the challenges of integrating major acquisitions and implementing joint ventures and other significant portfolio measures; introduction of competing products or technologies by other companies; lack of acceptance of new products or services by customers targeted by Siemens; changes in business strategy; the outcome of pending investigations and legal proceedings, especially the corruption investigations we are currently subject to in Germany, the United States and elsewhere and actions resulting from the findings of these investigations; the potential impact of such investigations and proceedings on our ongoing business including our relationships with governments and other customers; the potential impact of such matters on our financial statements; as well as various other factors. More detailed information about certain of these factors is contained throughout this report and in our other filings with the SEC, which are available on the Siemens website, www.siemens.com, and on the SEC’s website, www.sec.gov. Should one or more of these risks or uncertainties materialize, or should underlying assumptions prove incorrect, actual results may vary materially from those described in the relevant forward-looking statement as expected, anticipated, intended, planned, believed, sought, estimated or projected. Siemens does not intend or assume any obligation to update or revise these forward-looking statements in light of developments which differ from those anticipated.
Earnings before interest and taxes, or EBIT (adjusted); Earnings before interest, taxes, depreciation and amortization, or EBITDA (adjusted); Return on capital employed (ROCE); Return on equity (ROE); Free cash flow; and Cash conversion rate are non-GAAP financial measures. These non-GAAP financial measures should not be viewed in isolation as alternatives to measures of our financial condition, results of operations or cash flows as presented in accordance with IFRS in our Consolidated Financial Statements. Information for a reconciliation of these amounts to the most directly comparable IFRS financial measures is available on our Investor Relations website under www.siemens.com/ir → Financial Publications. “Profit Total Sectors” is reconciled to “Income from continuing operations before income taxes” in the table “Segment Information.”
Copyright © Siemens AG 2008. All rights reservedPage 3 December 2008 Capital Market Days 'Industry'
Industry Automation
Drive Technologies
Industry Solutions Osram Building
Technologies Mobility
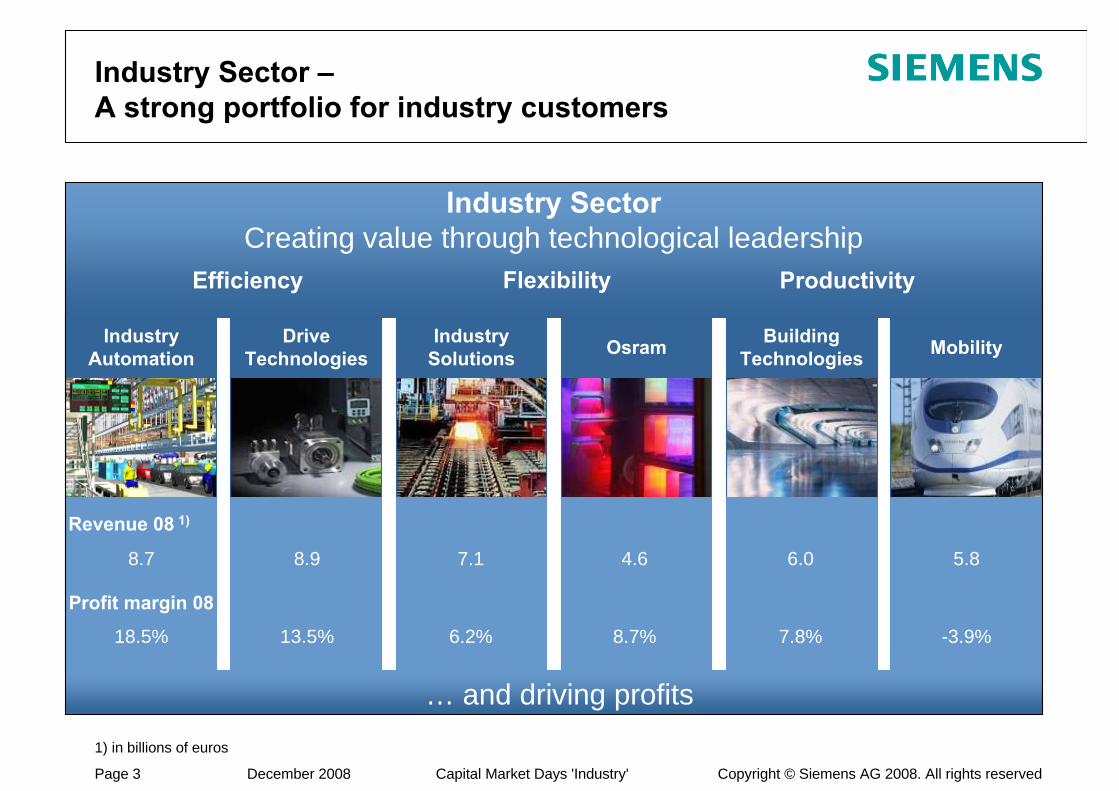
Industry Sector –A strong portfolio for industry customers
Flexibility ProductivityEfficiency
Industry Sector Creating value through technological leadership
1) in billions of euros
… and driving profits
Profit margin 08
Revenue 08 1)
18.5% 13.5% 6.2% 8.7% 7.8% -3.9%
8.7 8.9 7.1 4.6 6.0 5.8
Copyright © Siemens AG 2008. All rights reservedPage 4 December 2008 Capital Market Days 'Industry'
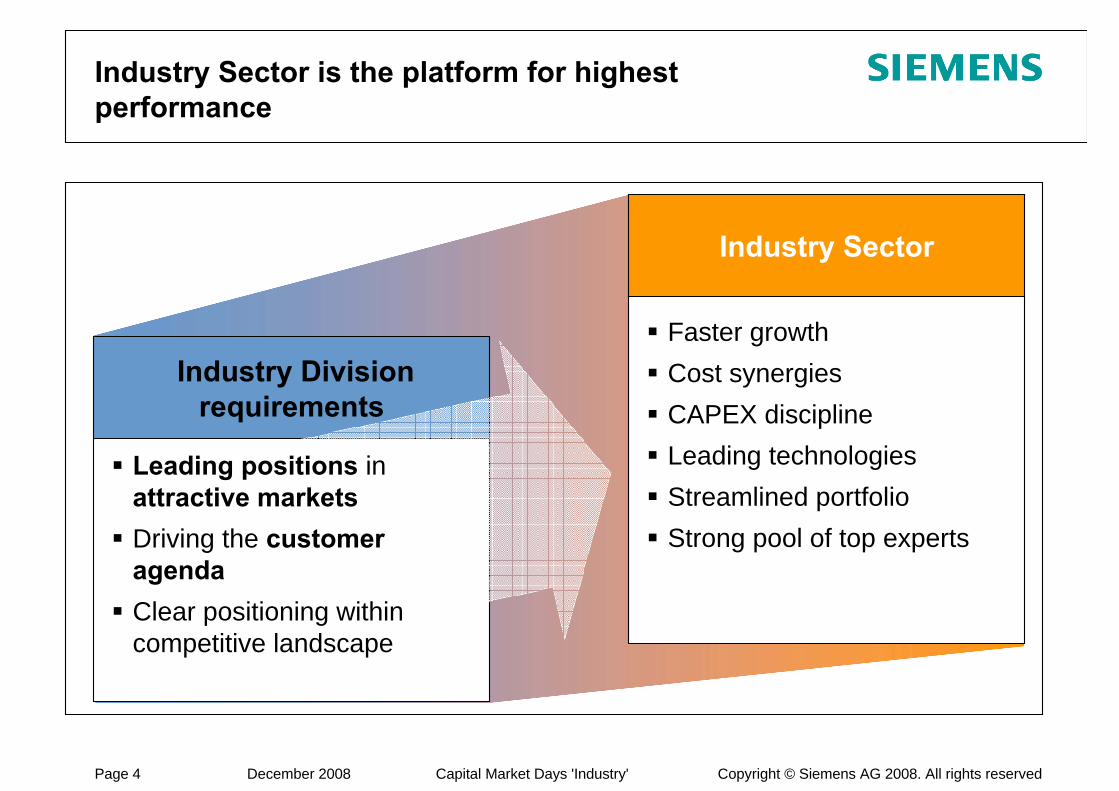
Industry Sector is the platform for highest performance
Industry Sector
Faster growthCost synergiesCAPEX disciplineLeading technologiesStreamlined portfolioStrong pool of top experts
Industry Division requirements
Leading positions in attractive marketsDriving the customer agendaClear positioning within competitive landscape
Copyright © Siemens AG 2008. All rights reservedPage 5 December 2008 Capital Market Days 'Industry'
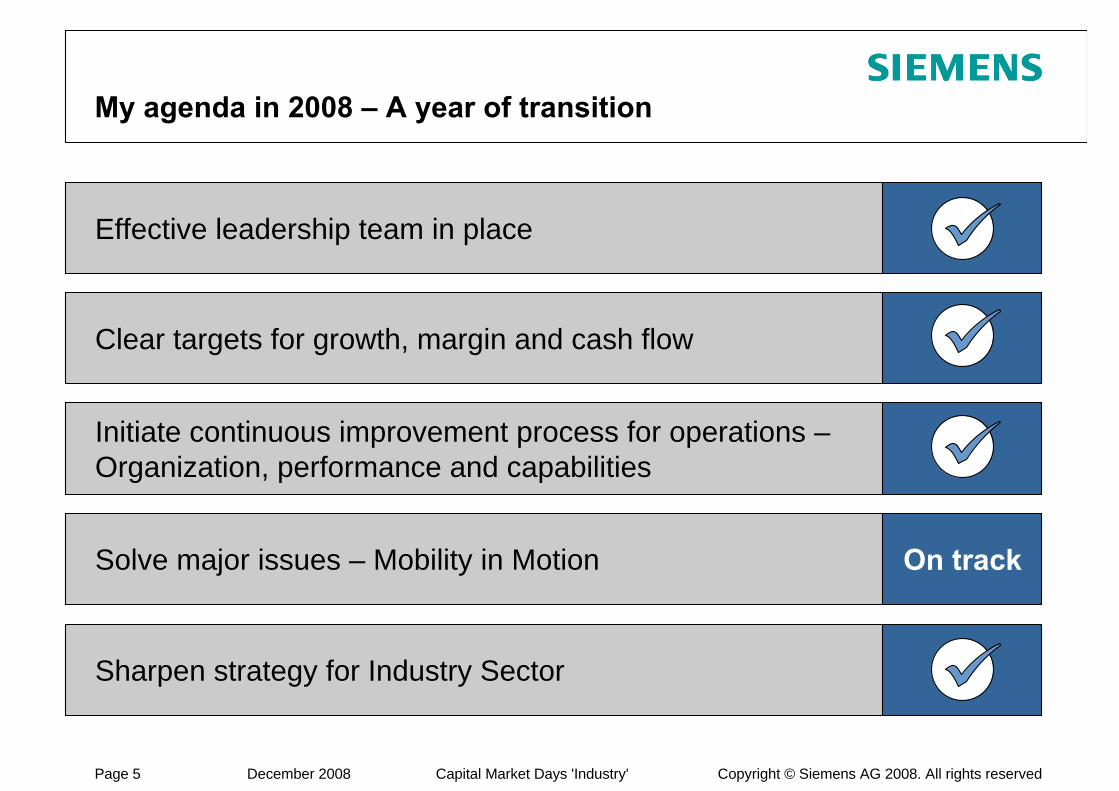
My agenda in 2008 – A year of transition
Effective leadership team in place
Clear targets for growth, margin and cash flow
Initiate continuous improvement process for operations –Organization, performance and capabilities
Solve major issues – Mobility in Motion
Sharpen strategy for Industry Sector
On track
Copyright © Siemens AG 2008. All rights reservedPage 6 December 2008 Capital Market Days 'Industry'
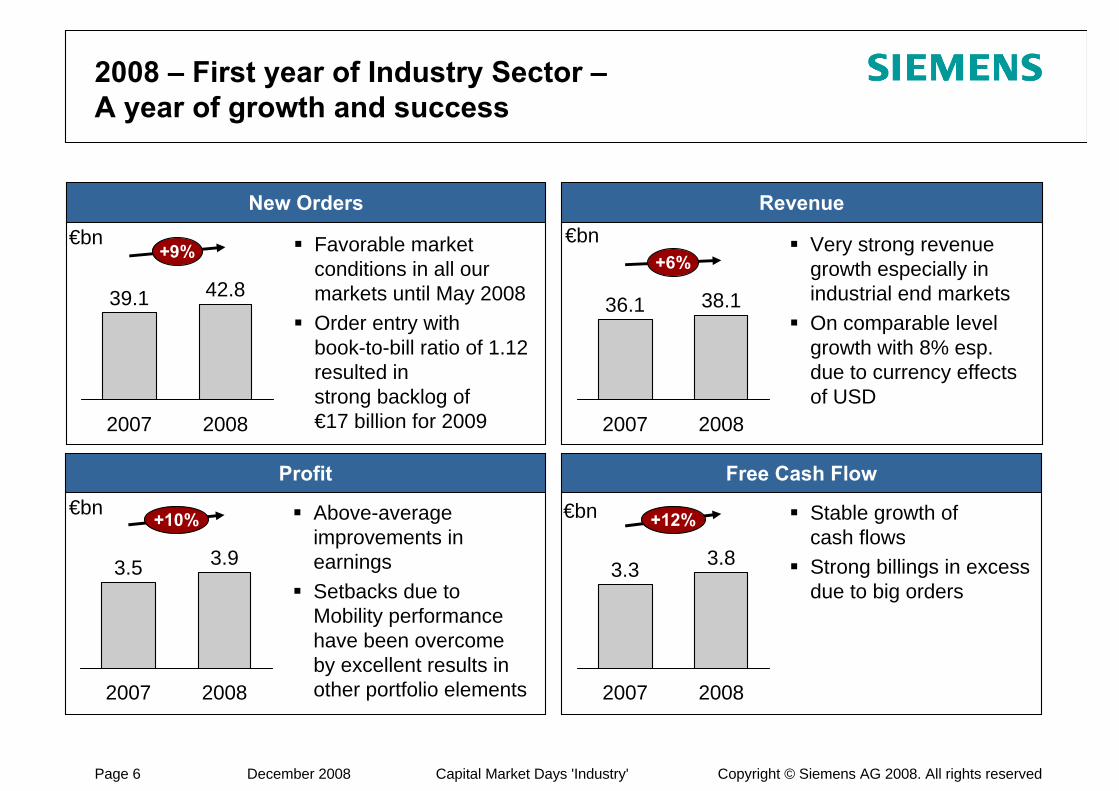
Revenue
Very strong revenue growth especially in industrial end marketsOn comparable level growth with 8% esp. due to currency effects of USD
36.1
2007
38.1
2008
+6%
2008 – First year of Industry Sector –A year of growth and success
New Orders
Profit Free Cash Flow
Above-average improvements in earningsSetbacks due to Mobility performance have been overcome by excellent results in other portfolio elements
Stable growth of cash flowsStrong billings in excess due to big orders
Favorable market conditions in all our markets until May 2008Order entry with book-to-bill ratio of 1.12 resulted in strong backlog of €17 billion for 2009
39.1
2007
42.8
2008
+9%
3.5
2007
3.9
2008
+10%
3.3
2007
3.8
2008
+12%
€bn
€bn
€bn
€bn
Copyright © Siemens AG 2008. All rights reservedPage 7 December 2008 Capital Market Days 'Industry'
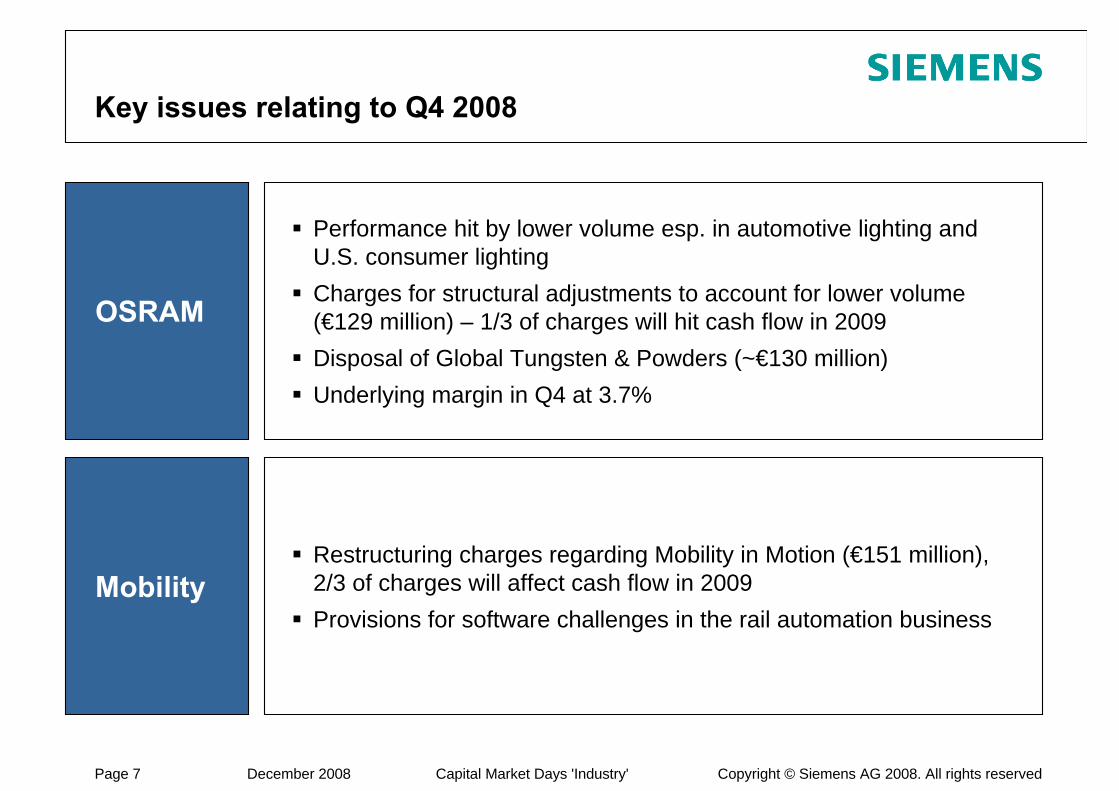
OSRAM
Mobility
Key issues relating to Q4 2008
Performance hit by lower volume esp. in automotive lighting and U.S. consumer lightingCharges for structural adjustments to account for lower volume (€129 million) – 1/3 of charges will hit cash flow in 2009Disposal of Global Tungsten & Powders (~€130 million)Underlying margin in Q4 at 3.7%
Restructuring charges regarding Mobility in Motion (€151 million), 2/3 of charges will affect cash flow in 2009Provisions for software challenges in the rail automation business
Copyright © Siemens AG 2008. All rights reservedPage 8 December 2008 Capital Market Days 'Industry'
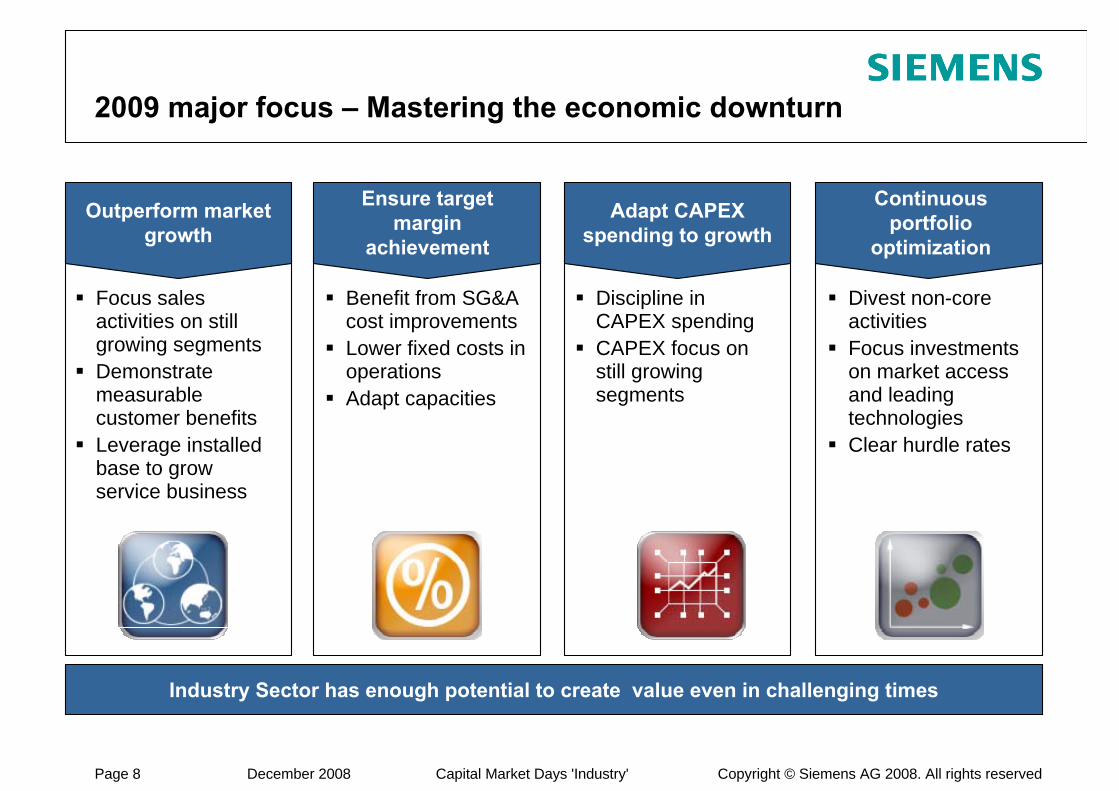
2009 major focus – Mastering the economic downturn
Industry Sector has enough potential to create value even in challenging times
Outperform market growth
Continuous portfolio
optimization
Focus sales activities on still growing segmentsDemonstrate measurable customer benefitsLeverage installed base to grow service business
Adapt CAPEXspending to growth
Discipline in CAPEX spendingCAPEX focus on still growing segments
Divest non-core activitiesFocus investments on market access and leading technologiesClear hurdle rates
Ensure target margin
achievement
Benefit from SG&A cost improvementsLower fixed costs in operationsAdapt capacities
Copyright © Siemens AG 2008. All rights reservedPage 9 December 2008 Capital Market Days 'Industry'
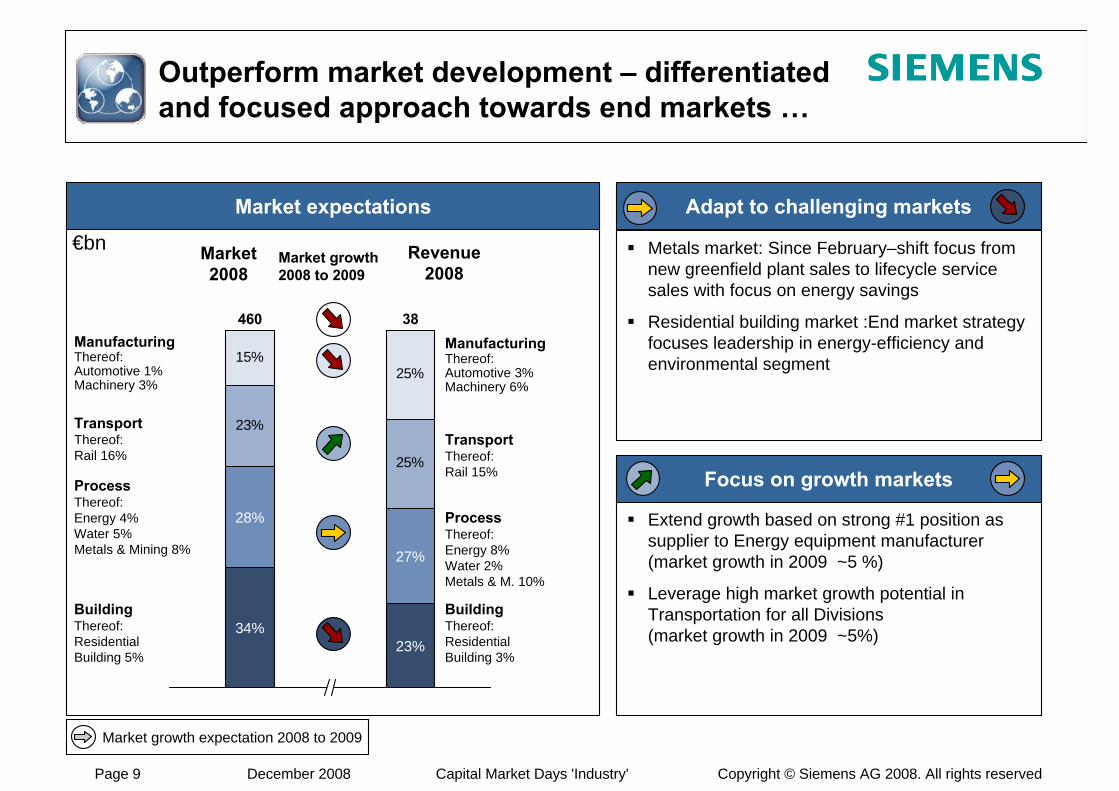
Market expectations
Outperform market development – differentiated and focused approach towards end markets …
Adapt to challenging markets
Focus on growth markets
Metals market: Since February–shift focus from new greenfield plant sales to lifecycle service sales with focus on energy savings
Residential building market :End market strategy focuses leadership in energy-efficiency and environmental segment
Extend growth based on strong #1 position as supplier to Energy equipment manufacturer (market growth in 2009 ~5 %)
Leverage high market growth potential in Transportation for all Divisions (market growth in 2009 ~5%)
Market growth expectation 2008 to 2009
23%
25%
15%25%
28%
34%
460
27%
23%
38
Market2008
Revenue2008
Market growth2008 to 2009
ManufacturingThereof:Automotive 1%Machinery 3%
ProcessThereof:Energy 4%Water 5%Metals & Mining 8%
BuildingThereof:ResidentialBuilding 5%
TransportThereof:Rail 16%
ManufacturingThereof: Automotive 3%Machinery 6%
ProcessThereof: Energy 8%Water 2%Metals & M. 10%
BuildingThereof:ResidentialBuilding 3%
TransportThereof: Rail 15%
€bn
Copyright © Siemens AG 2008. All rights reservedPage 10 December 2008 Capital Market Days 'Industry'
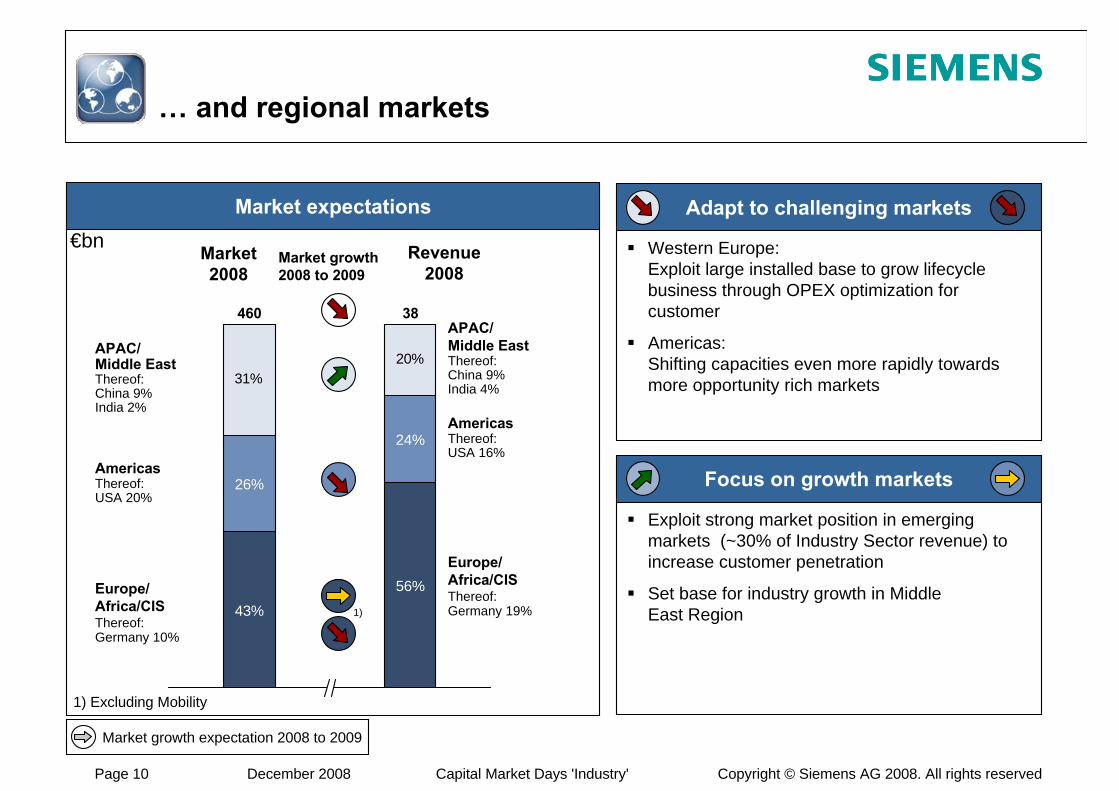
… and regional markets
1) Excluding Mobility
Adapt to challenging markets
Focus on growth markets
Western Europe: Exploit large installed base to grow lifecycle business through OPEX optimization for customer
Americas: Shifting capacities even more rapidly towards more opportunity rich markets
Exploit strong market position in emerging markets (~30% of Industry Sector revenue) to increase customer penetration
Set base for industry growth in Middle East Region
31%20%
26%
43%
56%
460
24%
38
1)
APAC/Middle EastThereof:China 9%India 2%
AmericasThereof:USA 20%
Europe/Africa/CISThereof:Germany 10%
APAC/Middle EastThereof: China 9%India 4%
Europe/ Africa/CISThereof: Germany 19%
AmericasThereof:USA 16%
Market expectations
Market2008
Revenue2008
Market growth2008 to 2009
Market growth expectation 2008 to 2009
€bn
Copyright © Siemens AG 2008. All rights reservedPage 11 December 2008 Capital Market Days 'Industry'
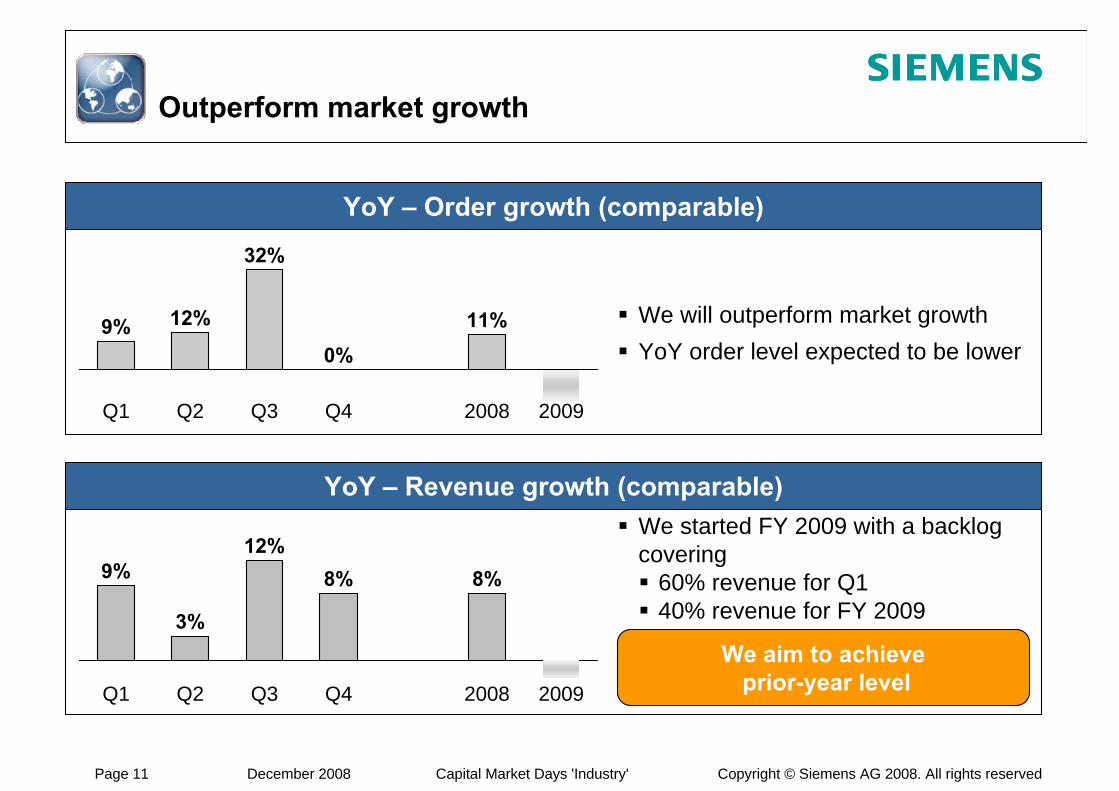
9%
Q1
3%
Q2
12%
Q3
8%
Q4
8%
2008 2009
Outperform market growth
We will outperform market growthYoY order level expected to be lower
We started FY 2009 with a backlog covering
60% revenue for Q140% revenue for FY 2009
YoY – Order growth (comparable)
YoY – Revenue growth (comparable)
2009
9%
Q1
12%
Q2
32%
Q3
0%
Q4
11%
2008
We aim to achieveprior-year level
Copyright © Siemens AG 2008. All rights reservedPage 12 December 2008 Capital Market Days 'Industry'
2007 2008 2009
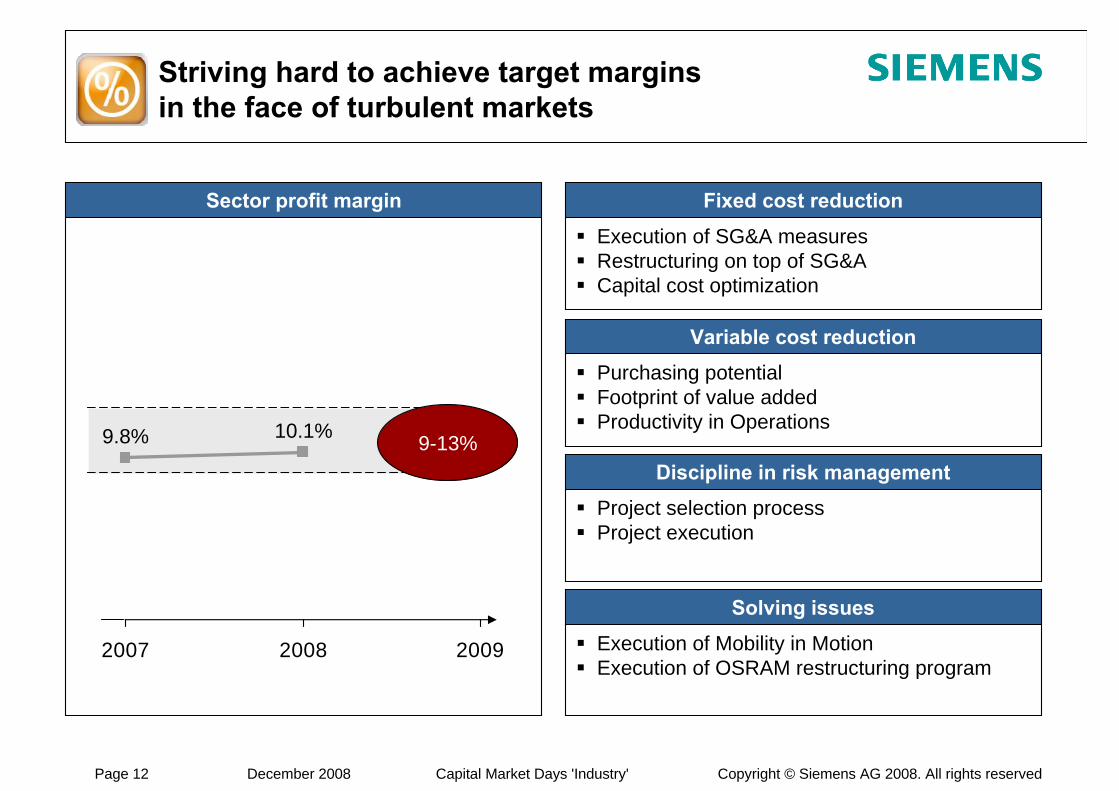
9.8% 10.1%
Striving hard to achieve target marginsin the face of turbulent markets
9-13%
Fixed cost reduction
Variable cost reduction
Discipline in risk management
Solving issues
Execution of SG&A measuresRestructuring on top of SG&ACapital cost optimization
Purchasing potentialFootprint of value addedProductivity in Operations
Project selection processProject execution
Execution of Mobility in MotionExecution of OSRAM restructuring program
Sector profit margin
Copyright © Siemens AG 2008. All rights reservedPage 13 December 2008 Capital Market Days 'Industry'
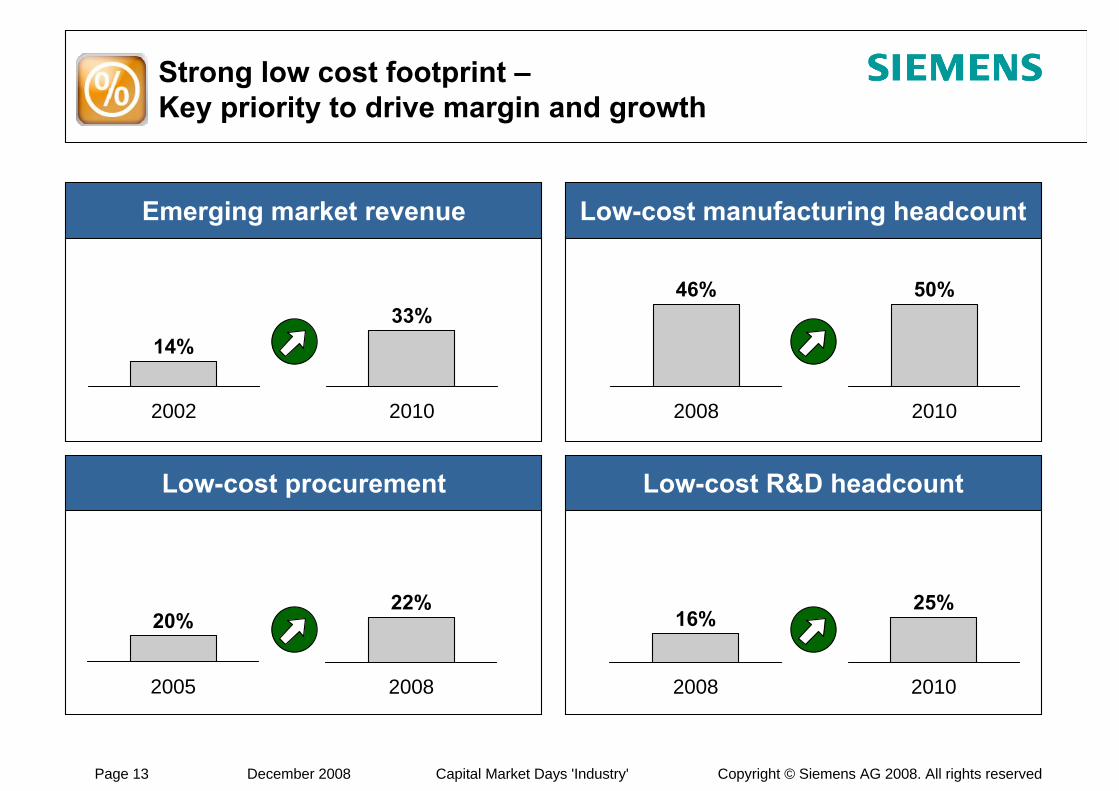
Strong low cost footprint –Key priority to drive margin and growth
Low-cost R&D headcount
46%
2008
2008
16%
50%
2010
25%
2010
Low-cost procurement
14%
2002
20%
2005
33%
2010
22%
2008
Emerging market revenue Low-cost manufacturing headcount
Copyright © Siemens AG 2008. All rights reservedPage 14 December 2008 Capital Market Days 'Industry'
2008
2009
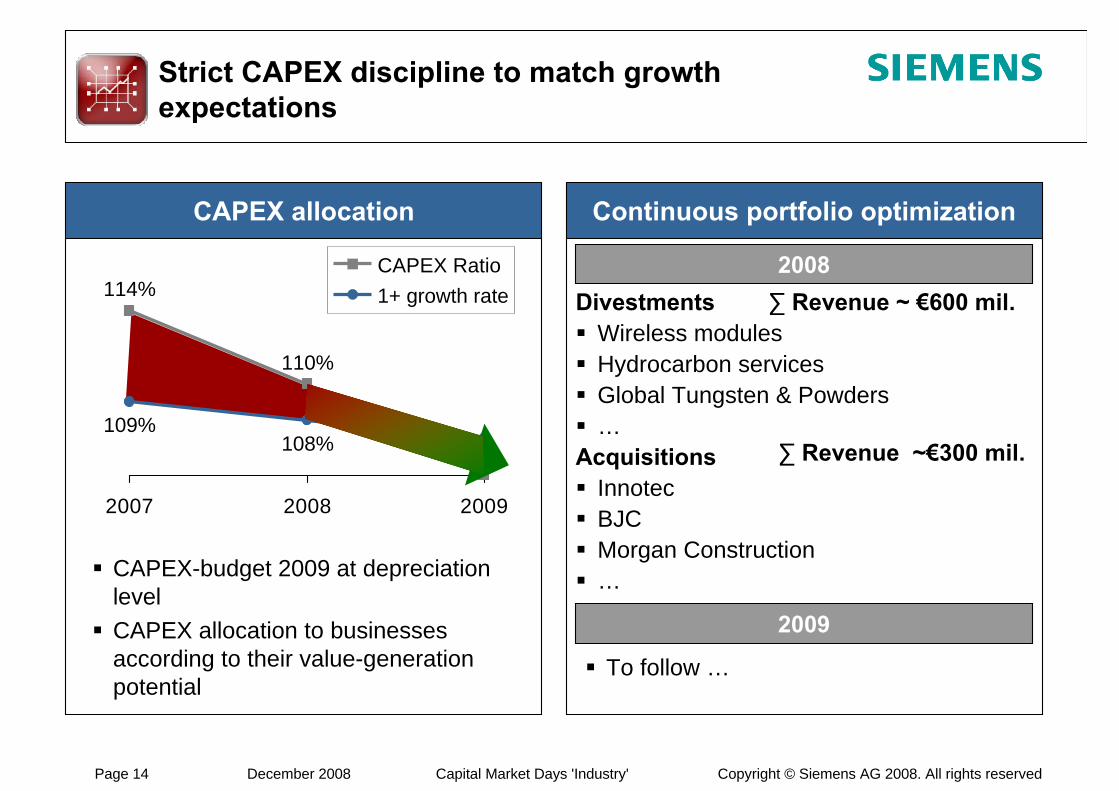
Strict CAPEX discipline to match growth expectations
CAPEX-budget 2009 at depreciation levelCAPEX allocation to businesses according to their value-generation potential
To follow …
DivestmentsWireless modulesHydrocarbon servicesGlobal Tungsten & Powders…
AcquisitionsInnotecBJCMorgan Construction…
∑ Revenue ~ €600 mil.
CAPEX allocation Continuous portfolio optimization
2007 2008 2009
114%
109%
110%
108%
CAPEX Ratio1+ growth rate
∑ Revenue ~€300 mil.
Copyright © Siemens AG 2008. All rights reservedPage 15 December 2008 Capital Market Days 'Industry'
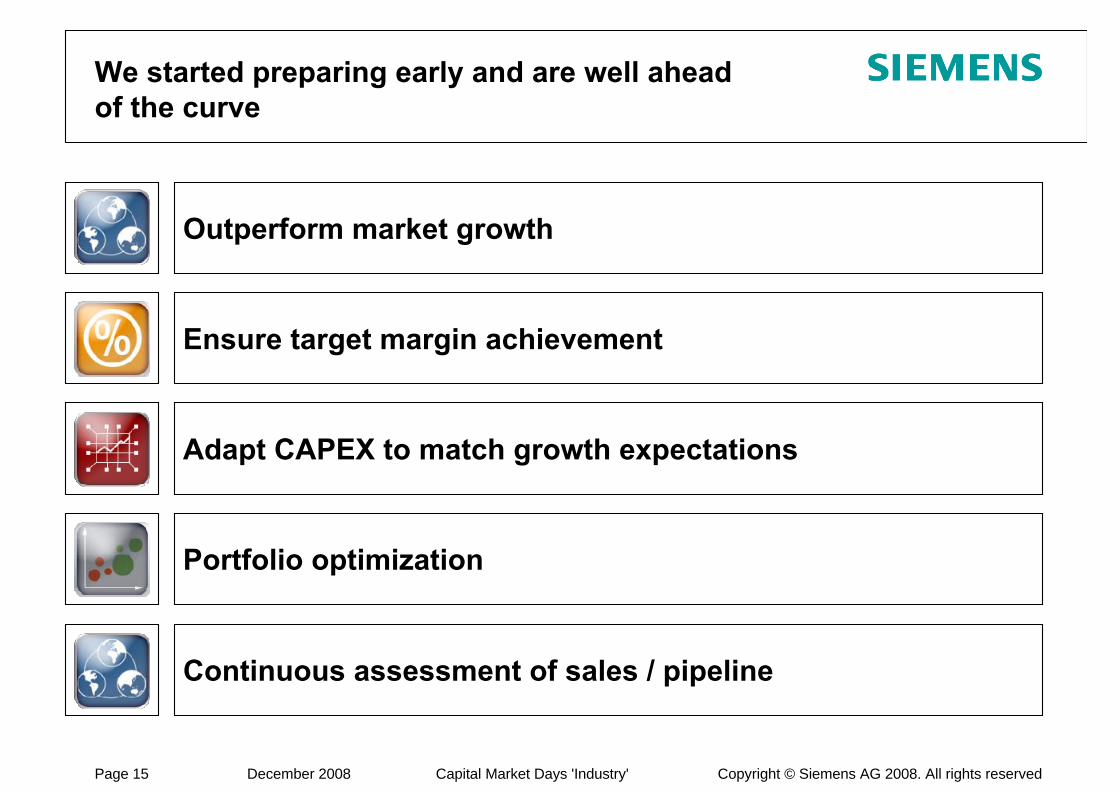
We started preparing early and are well ahead of the curve
Outperform market growth
Ensure target margin achievement
Adapt CAPEX to match growth expectations
Portfolio optimization
Continuous assessment of sales / pipeline
Copyright © Siemens AG 2008. All rights reservedPage 16 December 2008 Capital Market Days 'Industry'
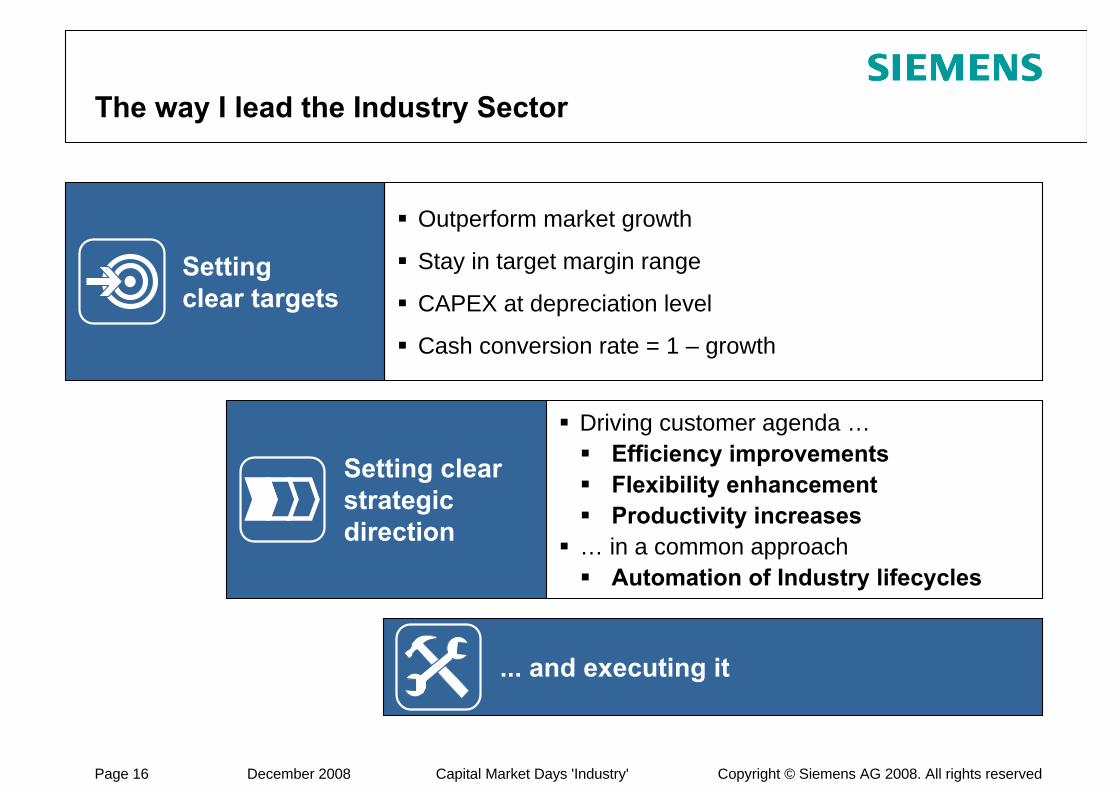
Outperform market growth
Stay in target margin range
CAPEX at depreciation level
Cash conversion rate = 1 – growth
The way I lead the Industry Sector
... and executing it
Setting clear targets
Driving customer agenda …Efficiency improvementsFlexibility enhancementProductivity increases
… in a common approachAutomation of Industry lifecycles
Setting clear strategic direction
Copyright © Siemens AG 2008. All rights reservedPage 17 December 2008 Capital Market Days 'Industry'
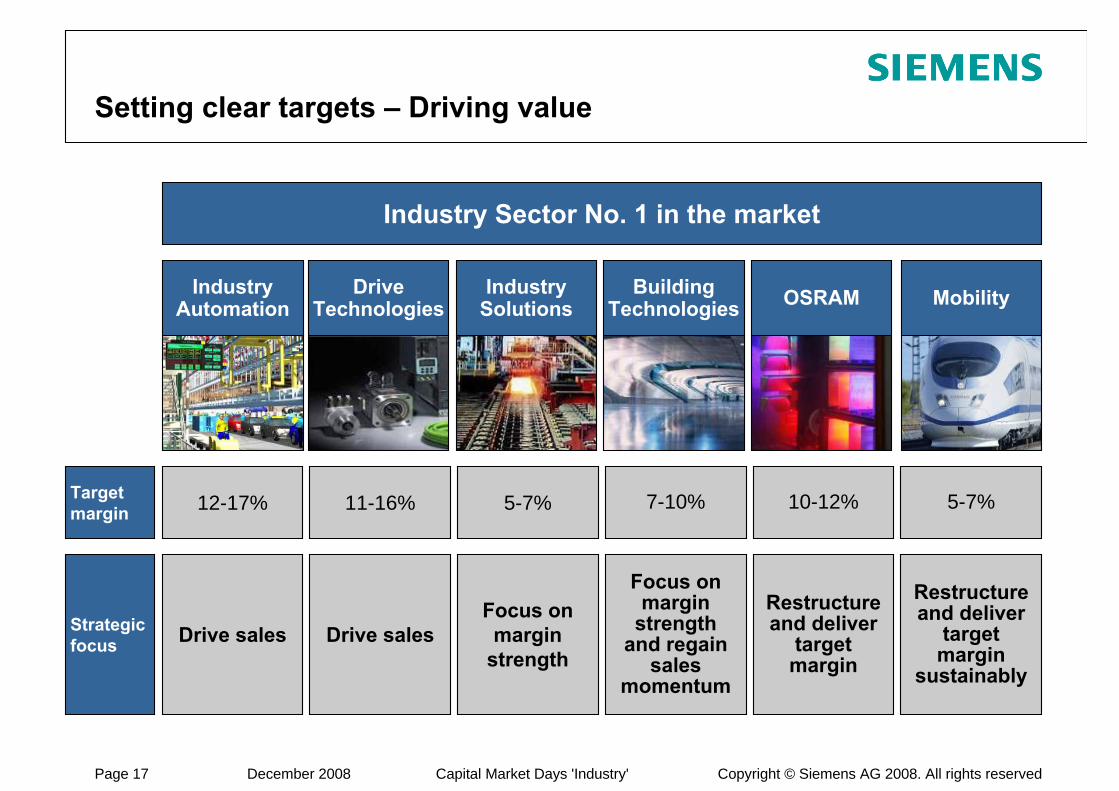
Setting clear targets – Driving value
Industry Sector No. 1 in the market
DriveTechnologies
IndustrySolutions
BuildingTechnologies OSRAM MobilityIndustry
Automation
Drive sales Drive salesFocus on margin
strength
Focus on margin
strength and regain
sales momentum
Restructure and deliver
target margin
Restructure and deliver
target margin
sustainably
12-17% 11-16% 5-7% 7-10% 10-12% 5-7%
Strategicfocus
Target margin
Copyright © Siemens AG 2008. All rights reservedPage 18 December 2008 Capital Market Days 'Industry'
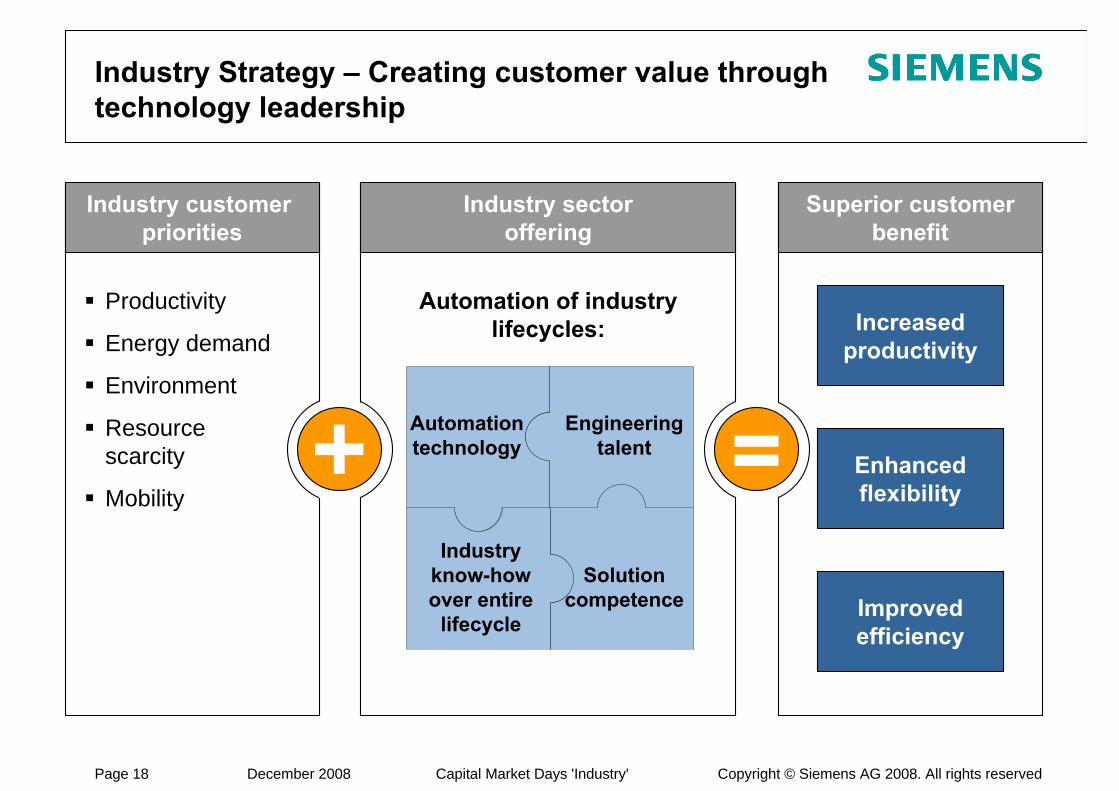
Industry Strategy – Creating customer value through technology leadership
Productivity
Energy demand
Environment
Resource scarcity
Mobility=
Automation of industry lifecycles:
Industry customer priorities
Industry sectoroffering
Superior customerbenefit
Increasedproductivity
Improvedefficiency
Enhancedflexibility
Solution competence
Industry know-how over entire
lifecycle
Engineering talent
Automation technology
Copyright © Siemens AG 2008. All rights reservedPage 19 December 2008 Capital Market Days 'Industry'
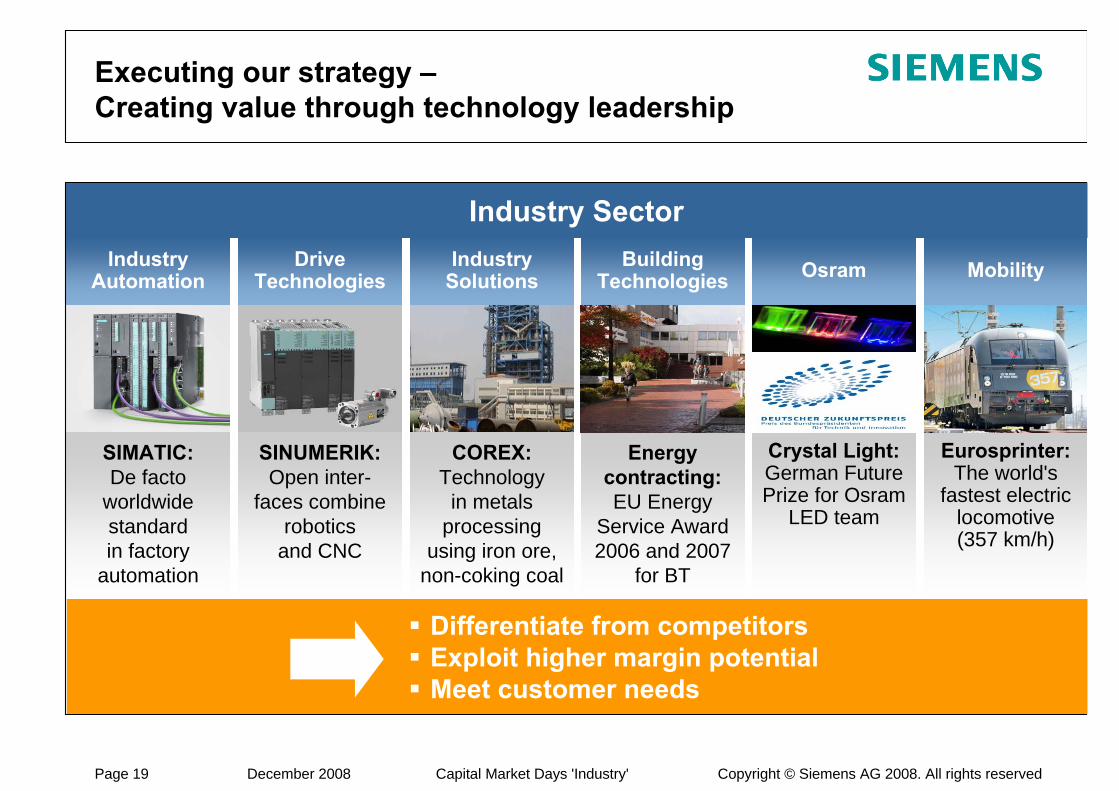
SINUMERIK:Open inter-
faces combine robotics
and CNC
COREX:Technology
in metals processing
using iron ore, non-coking coal
Energy contracting:EU Energy
Service Award 2006 and 2007
for BT
Crystal Light:German Future Prize for Osram
LED team
Eurosprinter:The world's
fastest electriclocomotive(357 km/h)
SIMATIC:De facto
worldwide standardin factory
automation
Executing our strategy –Creating value through technology leadership
DriveTechnologies
IndustrySolutions
BuildingTechnologies Osram MobilityIndustry
Automation
Differentiate from competitorsExploit higher margin potentialMeet customer needs
Industry Sector
Copyright © Siemens AG 2008. All rights reservedPage 20 December 2008 Capital Market Days 'Industry'
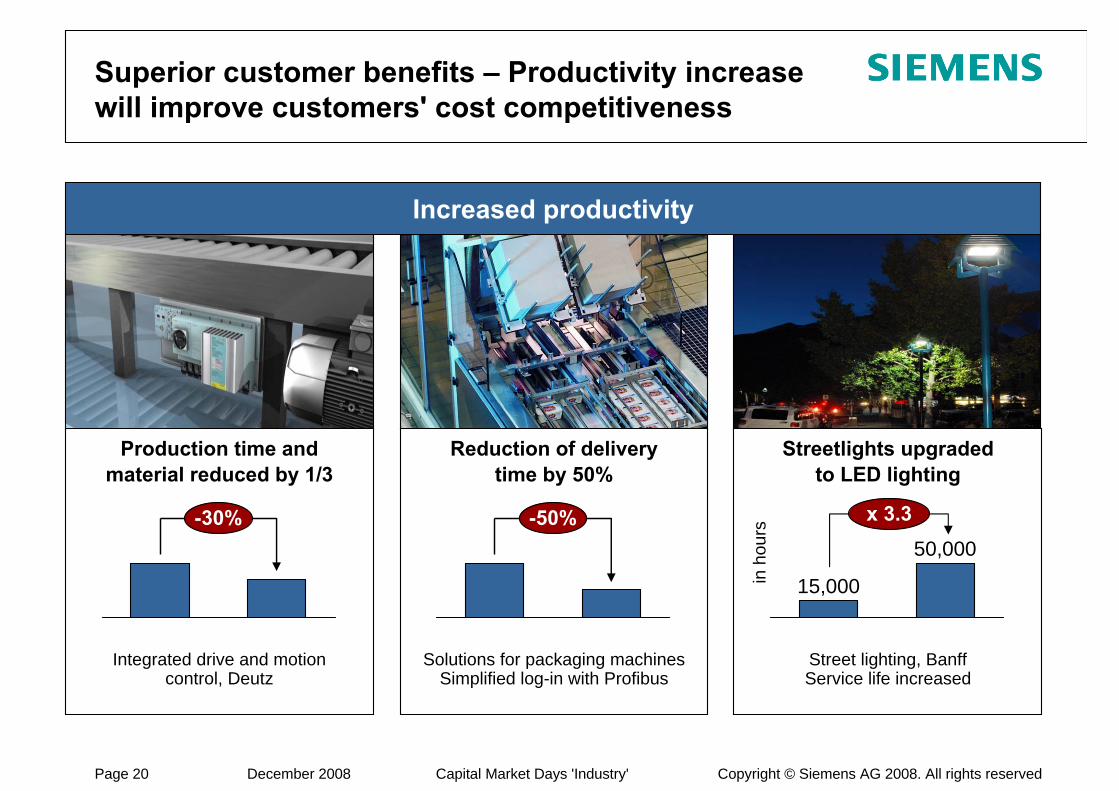
Superior customer benefits – Productivity increase will improve customers' cost competitiveness
Increased productivity
Production time and material reduced by 1/3
Integrated drive and motioncontrol, Deutz
-30%
Reduction of deliverytime by 50%
Solutions for packaging machinesSimplified log-in with Profibus
-50%
Streetlights upgraded to LED lighting
Street lighting, BanffService life increased
15,000
50,000
in h
ours
x 3.3
Copyright © Siemens AG 2008. All rights reservedPage 21 December 2008 Capital Market Days 'Industry'
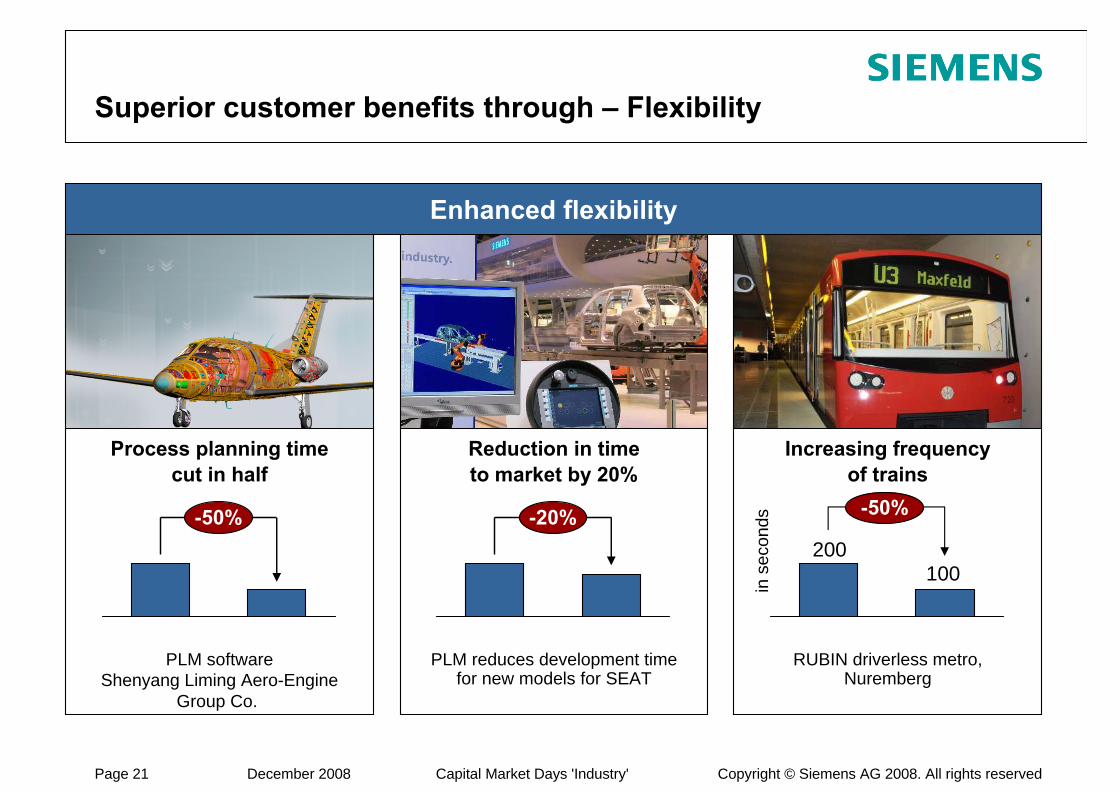
Superior customer benefits through – Flexibility
Reduction in time to market by 20%
PLM reduces development time for new models for SEAT
-20%
Increasing frequencyof trains
RUBIN driverless metro,Nuremberg
in s
econ
ds
200100
-50%
Enhanced flexibility
Process planning timecut in half
PLM softwareShenyang Liming Aero-Engine
Group Co.
-50%
Copyright © Siemens AG 2008. All rights reservedPage 22 December 2008 Capital Market Days 'Industry'
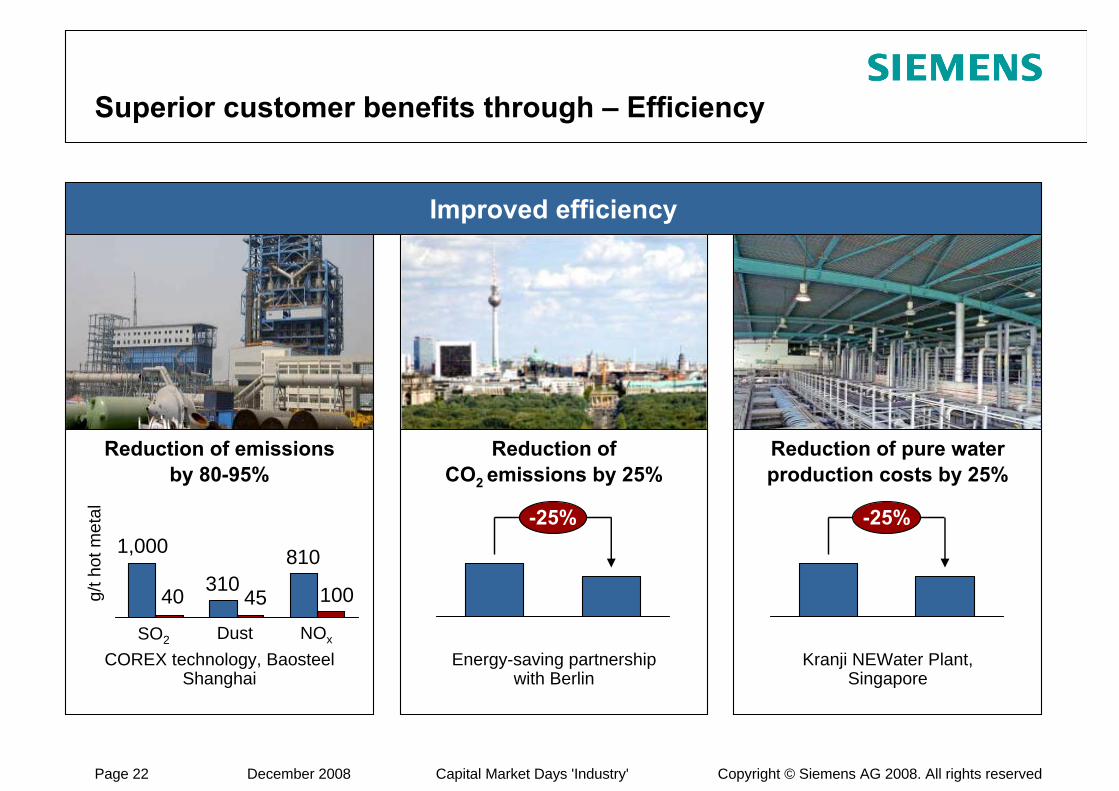
Superior customer benefits through – Efficiency
Reduction of emissionsby 80-95%
COREX technology, BaosteelShanghai
g/th
ot m
etal
40 31045
810
100
1,000
Reduction of CO2 emissions by 25%
Energy-saving partnershipwith Berlin
-25%
Reduction of pure water production costs by 25%
Kranji NEWater Plant, Singapore
-25%
SO2 Dust NOx
Improved efficiency
Copyright © Siemens AG 2008. All rights reservedPage 23 December 2008 Capital Market Days 'Industry'
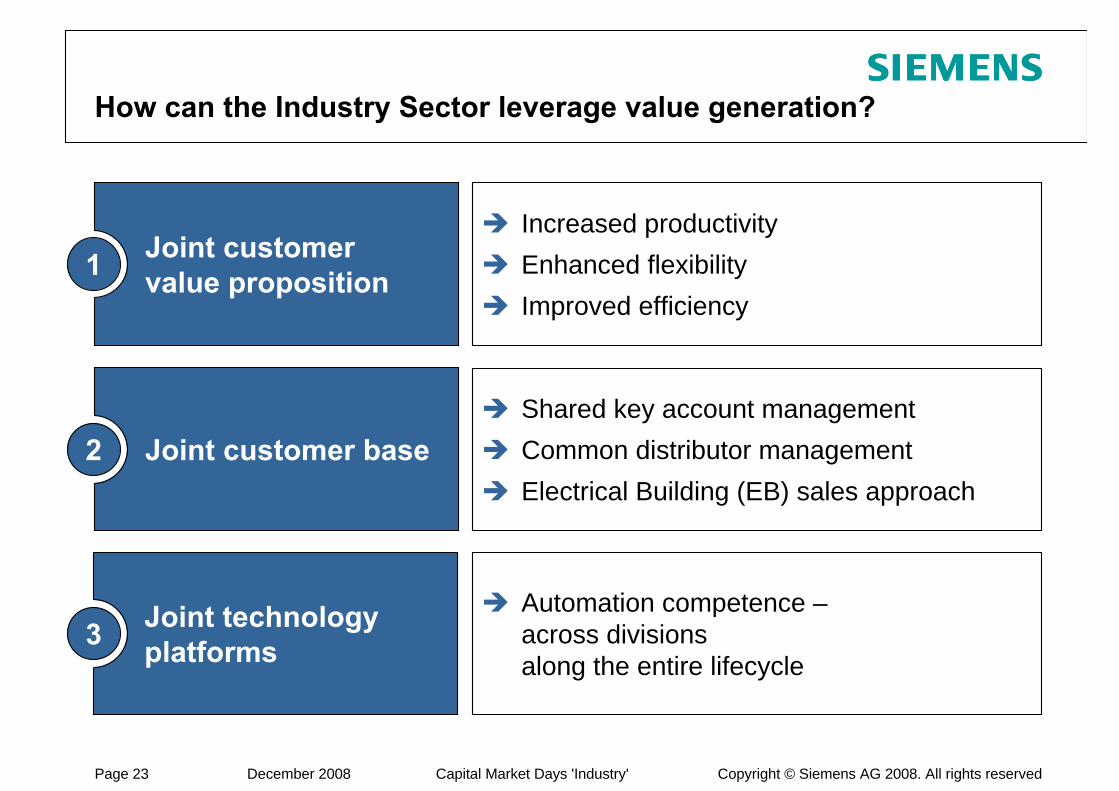
Joint customer value proposition
How can the Industry Sector leverage value generation?
Joint customer base
Joint technology platforms
Automation competence –across divisionsalong the entire lifecycle
1
2
3
Increased productivityEnhanced flexibilityImproved efficiency
Shared key account managementCommon distributor managementElectrical Building (EB) sales approach
Copyright © Siemens AG 2008. All rights reservedPage 24 December 2008 Capital Market Days 'Industry'
RoomControl
Automation
Drives
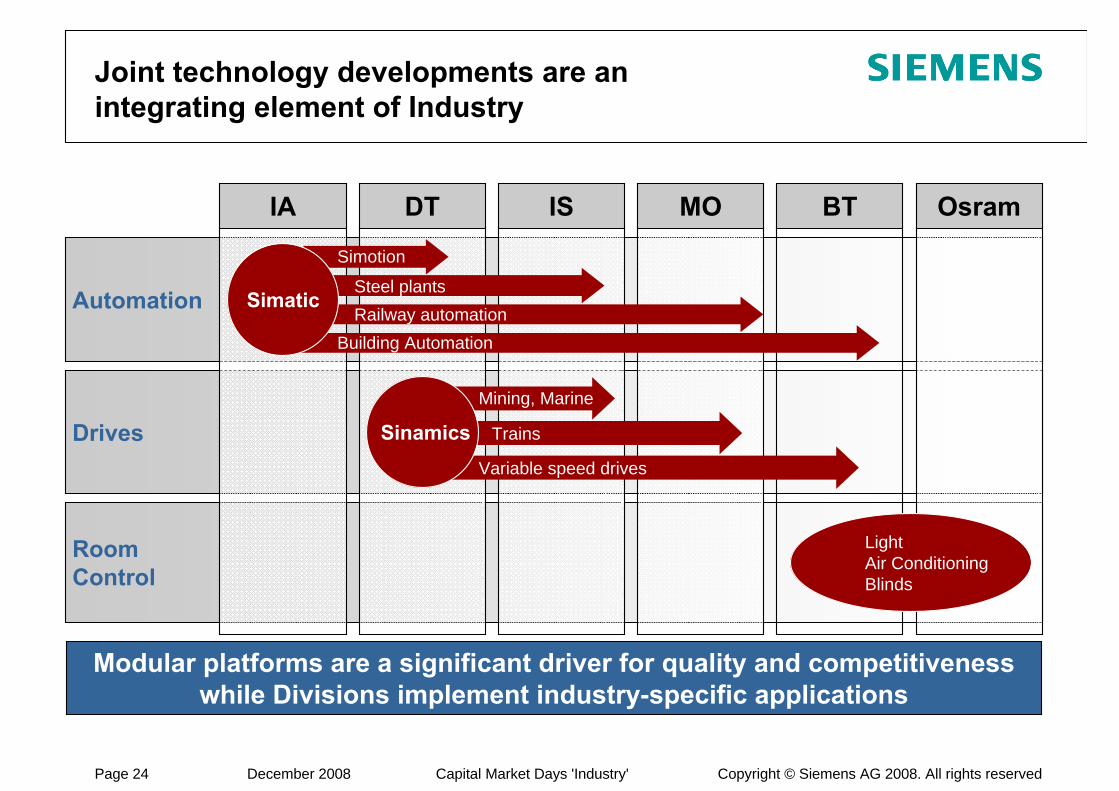
Joint technology developments are anintegrating element of Industry
Modular platforms are a significant driver for quality and competitiveness while Divisions implement industry-specific applications
IA IS MO BT OsramDT
SimaticSteel plantsRailway automation
Building Automation
Simotion
Trains
Variable speed drives
Mining, Marine
Sinamics
LightAir ConditioningBlinds
Copyright © Siemens AG 2008. All rights reservedPage 25 December 2008 Capital Market Days 'Industry'
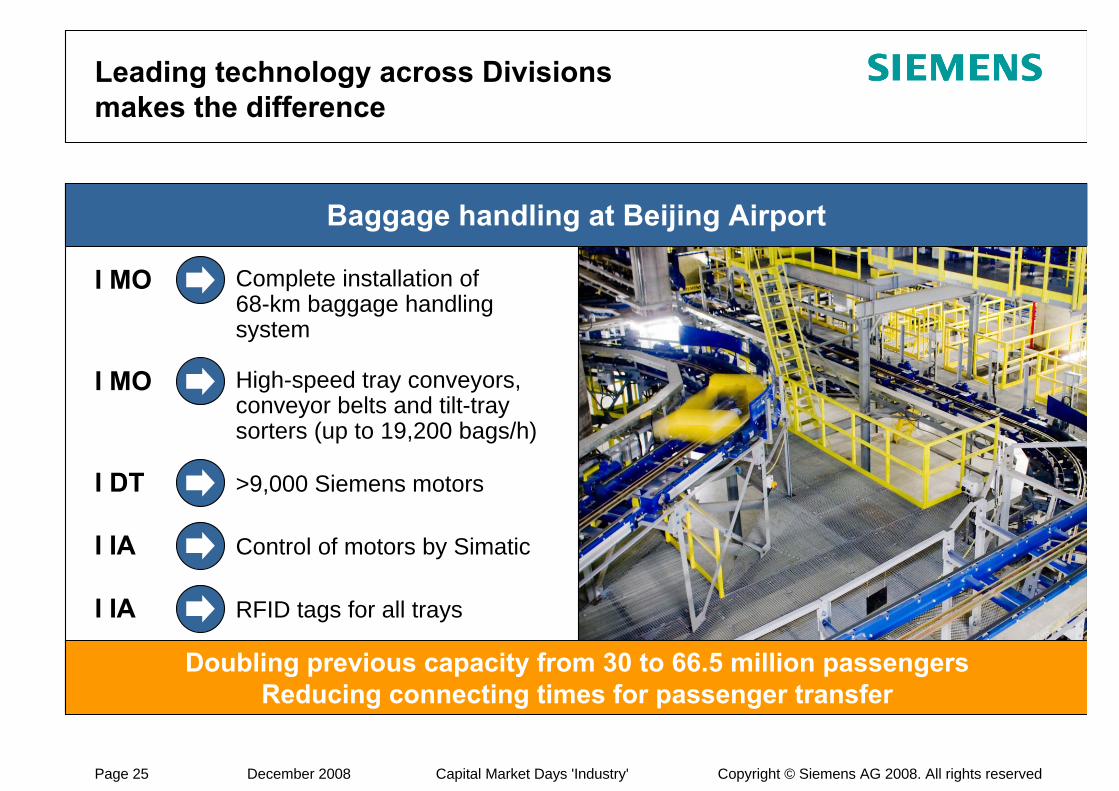
Leading technology across Divisions makes the difference
Doubling previous capacity from 30 to 66.5 million passengers Reducing connecting times for passenger transfer
Baggage handling at Beijing Airport
Complete installation of 68-km baggage handling system
I MO
High-speed tray conveyors, conveyor belts and tilt-tray sorters (up to 19,200 bags/h)
I MO
>9,000 Siemens motorsI DT
Control of motors by SimaticI IA
RFID tags for all traysI IA
Copyright © Siemens AG 2008. All rights reservedPage 26 December 2008 Capital Market Days 'Industry'
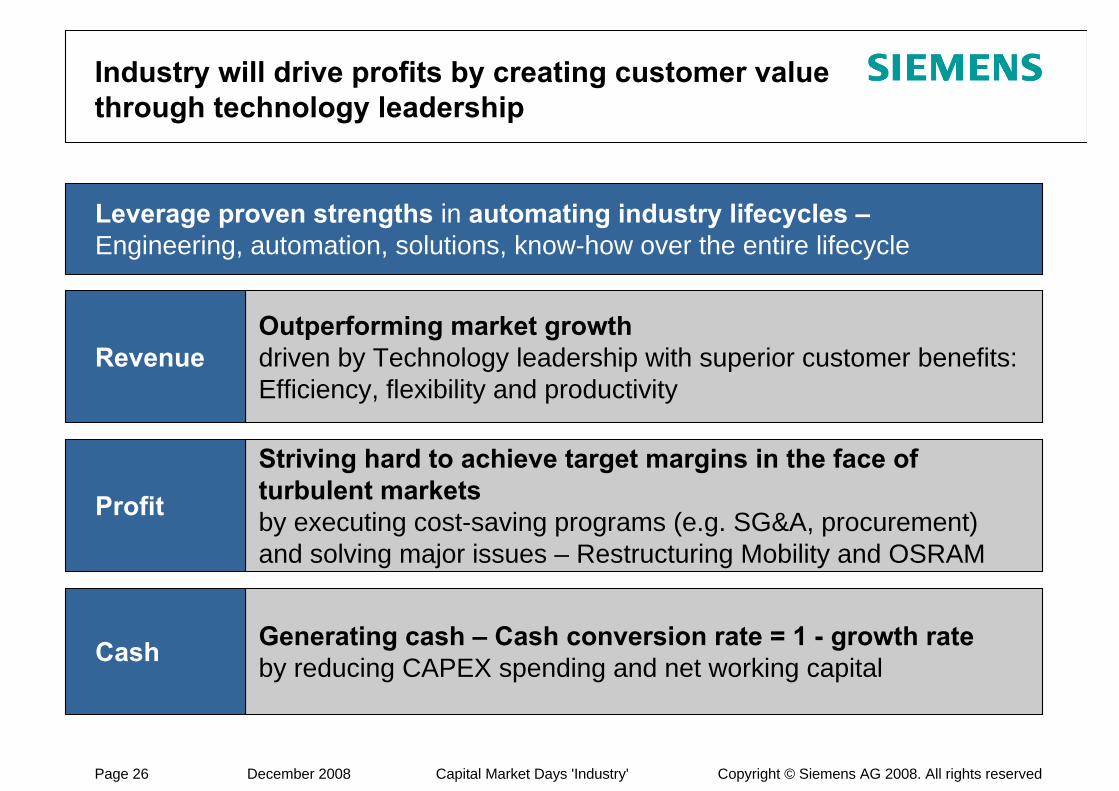
Industry will drive profits by creating customer value through technology leadership
Generating cash – Cash conversion rate = 1 - growth rateby reducing CAPEX spending and net working capital
Leverage proven strengths in automating industry lifecycles –Engineering, automation, solutions, know-how over the entire lifecycle
Outperforming market growthdriven by Technology leadership with superior customer benefits:Efficiency, flexibility and productivity
Revenue
Striving hard to achieve target margins in the face of turbulent marketsby executing cost-saving programs (e.g. SG&A, procurement) and solving major issues – Restructuring Mobility and OSRAM
Profit
Cash
Copyright © Siemens AG 2008. All rights reservedPage 27 December 2008 Capital Market Days 'Industry'
Reconciliation and Definitions forNon-GAAP Measures (I)
Profit Total Sectors is reconciled to “Income from continuing operations before income taxes” under “Reconciliation to consolidated financial statements” in the table “Segment Information.” See our Financial Publications at our Investor Relations website under www.siemens.com/ir.
Earnings before interest and taxes, or EBIT (adjusted) is Income from continuing operations before income taxes less Financial income (expense), net and Income (loss) from investments accounted for using the equity method, net.
Earnings before interest, taxes, depreciation and amortization, or EBITDA (adjusted) is EBIT before Depreciation and Amortization, defined as depreciation and impairments of property, plant and equipment and amortization and impairments of intangible assets other than goodwill.
Profit is reconciled to EBIT and EBITDA on the table Segment Information Analysis (II). See our Financial Publications at our Investor Relations website under www.siemens.com/ir.
Return on Capital Employed (ROCE) is a measure of how capital invested in the Company or the Sectors yields competitive returns.
For the Company, ROCE is calculated as Net income (before interest) divided by average Capital employed (CE). Net income (before interest) is defined as Net income excluding Other interest income (expense), net and excluding taxes on Other interest income (expense), net. Taxes on Other interest income (expense), net are calculated in simplified form by applying the current tax rate which can be derived from the Consolidated Statements of Income, to Other interest income (expense), net. CE is defined as Total equity plus Long-term debt plus Short-term debt and current maturities of long-term debt minus Cash and cash equivalents.
Because Siemens reports discontinued operations, Siemens also calculates ROCE on a continuing operations basis, using Income from continuing operations rather than Net income. For purposes of this calculation, CE is adjusted by the net figure for Assets classified as held for disposal included in discontinued operations less Liabilities associated with assets classified as held for disposal included in discontinued operations.
For the Sectors, ROCE is calculated as Profit divided by average Assets. Profit for the Sectors is principally defined as earnings before financing interest, certain pension costs and income taxes, whereas certain other items not considered performance indicative by Management may be excluded. Assets for the Sectors is defined as total assets primarily less intragroup financing receivables and investments, less income tax assets, less non-interest bearing liabilities/provisions other than tax liabilities.
Copyright © Siemens AG 2008. All rights reservedPage 28 December 2008 Capital Market Days 'Industry'
Reconciliation and Definitions forNon-GAAP Measures (II)
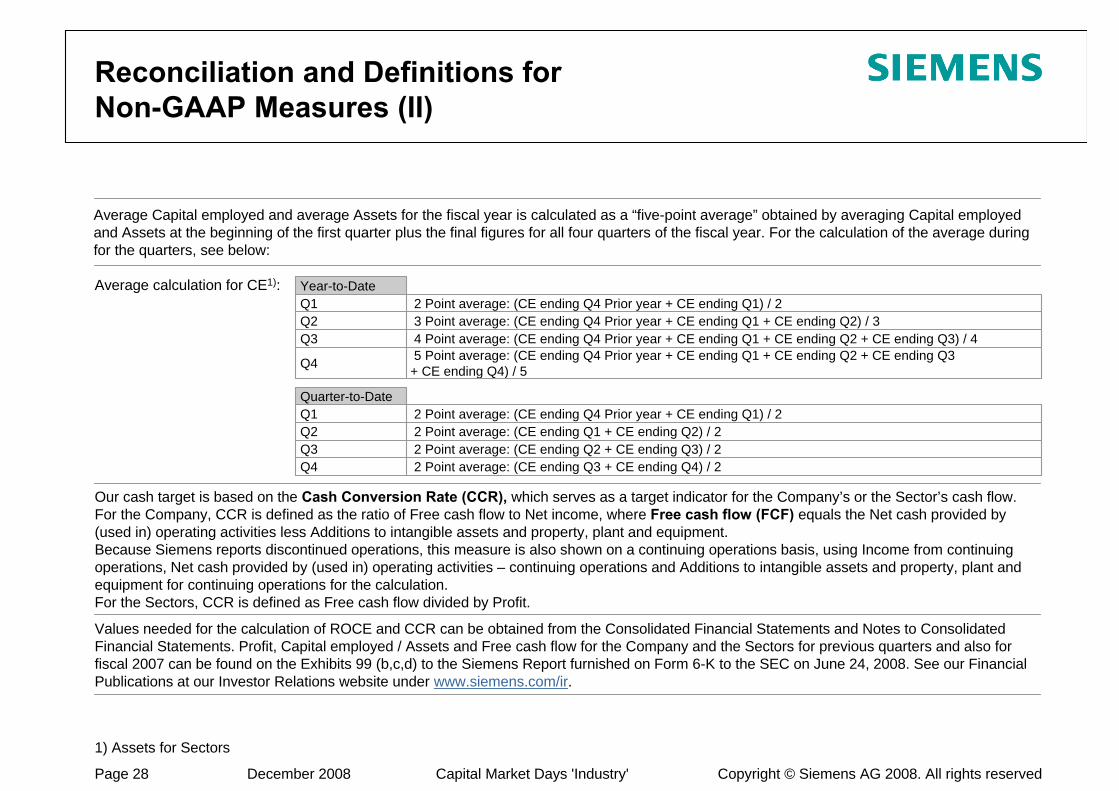
Our cash target is based on the Cash Conversion Rate (CCR), which serves as a target indicator for the Company’s or the Sector’s cash flow. For the Company, CCR is defined as the ratio of Free cash flow to Net income, where Free cash flow (FCF) equals the Net cash provided by (used in) operating activities less Additions to intangible assets and property, plant and equipment. Because Siemens reports discontinued operations, this measure is also shown on a continuing operations basis, using Income from continuing operations, Net cash provided by (used in) operating activities – continuing operations and Additions to intangible assets and property, plant and equipment for continuing operations for the calculation. For the Sectors, CCR is defined as Free cash flow divided by Profit.
Values needed for the calculation of ROCE and CCR can be obtained from the Consolidated Financial Statements and Notes to Consolidated Financial Statements. Profit, Capital employed / Assets and Free cash flow for the Company and the Sectors for previous quarters and also for fiscal 2007 can be found on the Exhibits 99 (b,c,d) to the Siemens Report furnished on Form 6-K to the SEC on June 24, 2008. See our Financial Publications at our Investor Relations website under www.siemens.com/ir.
Average calculation for CE1): Year-to-DateQ1 2 Point average: (CE ending Q4 Prior year + CE ending Q1) / 2Q2 3 Point average: (CE ending Q4 Prior year + CE ending Q1 + CE ending Q2) / 3Q3 4 Point average: (CE ending Q4 Prior year + CE ending Q1 + CE ending Q2 + CE ending Q3) / 4
Q4 5 Point average: (CE ending Q4 Prior year + CE ending Q1 + CE ending Q2 + CE ending Q3 + CE ending Q4) / 5
Quarter-to-DateQ1 2 Point average: (CE ending Q4 Prior year + CE ending Q1) / 2Q2 2 Point average: (CE ending Q1 + CE ending Q2) / 2Q3 2 Point average: (CE ending Q2 + CE ending Q3) / 2Q4 2 Point average: (CE ending Q3 + CE ending Q4) / 2
1) Assets for Sectors
Average Capital employed and average Assets for the fiscal year is calculated as a “five-point average” obtained by averaging Capital employed and Assets at the beginning of the first quarter plus the final figures for all four quarters of the fiscal year. For the calculation of the average during for the quarters, see below:
Copyright © Siemens AG 2008. All rights reservedPage 29 December 2008 Capital Market Days 'Industry'
Reconciliation and Definitions forNon-GAAP Measures (III)
Our capital structure target is based on an Adjusted industrial net debt divided by EBITDA (adjusted). For the calculation of Adjusted industrial net debt, we subtract from Net debt (defined as Long-term debt plus Short-term debt and current maturities of long-term debt less Cash and cash equivalents less Available-for-sale financial assets (current)) (1) SFS debt excluding SFS internally purchased receivables and (2) 50% of the nominal amount of our hybrid bond; and add/subtract (3) Funded status of Pension benefits, (4) Funded status of Other post-employment benefits; and add (5) Credit guarantees. The components of Net debt are available on our Consolidated Balance Sheets, SFS debt less internally purchased receivables is available in our Management Discussion & Analysis under Segment information analysis – Siemens Financial Services (SFS). The Funded status of our principle pension plans and Other post-employment benefits, the amount of credit guarantees and the nominal amount of our Hybrid bond is available in the Notes to our Consolidated Financial Statements.
To measure Siemens’ achievement of the goal to grow at twice the rate of global GDP, we use GDP on real basis (i.e. excluding inflation and currency translation effects) with data provided by Global Insight Inc. and compare those growth rates with growth rates of our revenue (adjusted for portfolio and currency translation effects). In accordance with IFRS, revenue numbers are not adjusted by inflation and currency translation effects.
Return on equity (ROE) margin for SFS was calculated as SFS’ Income before income taxes of fiscal 2008 divided by average allocated equity for SFS. Average allocated equity for fiscal year 2008 is €911 million.The allocated equity for SFS is determined and influenced by the size and quality of its portfolio of commercial finance assets (primarily leases) and equity investments. This allocation is designed to cover the risks of the underlying business and is in line with common credit risk management standards in banking. The actual risk profile of the SFS portfolio is evaluated and controlled monthly and is reflected in the quarterly (commercial finance) and annual (equity investments) adjustment of allocated equity.
Profit Total Sectors, EBIT (adjusted), EBITDA (adjusted), ROCE, ROE, CCR and Adjusted industrial net debt are or may be Non-GAAP financial measures as defined in relevant rules of the U.S. Securities and Exchange Commission. Our management takes these measures, among others, into account in its management of our business, and for this reason we believe that investors may find it useful to consider these measures in their evaluation of our performance. None of Profit Total Sectors, EBIT (adjusted), EBITDA (adjusted), ROCE and ROE should be viewed in isolation as an alternative to figures reported in our IFRS statement of income for purposes of evaluating our results of operations; CCR should not be viewed in isolation as an alternative to measures reported in our IFRS cash flow statement for purposes of evaluating our cash flows; and Adjusted industrial net debt should not be viewed in isolation as an alternative to liabilities reported in our IFRS balance sheet for purposes of evaluating our financial condition.
Copyright © Siemens AG 2008. All rights reservedPage 30 December 2008 Capital Market Days 'Industry'
Siemens investor relations contact data
Michael Sen +49-89-636-33780
Munich Office +49-89-636-32474
US Office +1-408-464-2004
Internet: http://www.siemens.com/investorrelations
Email: [email protected]
Fax: +49-89-636-32830