Siemens Annual Report 2014, Combined Management Report€¦ · 201 In our Combined Management...
76
170 In our Combined Management Report, we analyze our business activities in the reporting year as well as the current state of Siemens worldwide and Siemens AG. Starting from a description of our business, economic environment and strategy, we present our financial target system and a detailed explanation of our results of operations as well as our financial and net assets position. We also report on various aspects of sustainability at Siemens and on expected develop- ments and their material opportunities and risks. WWW.SIEMENS.COM/AR/COMBINED-MANAGEMENT-REPORT Additional Sustainability indicators are available at: WWW.SIEMENS.COM/AR/SUSTAINABILITY-FIGURES
Transcript of Siemens Annual Report 2014, Combined Management Report€¦ · 201 In our Combined Management...

170
In our Combined Management Report, we analyze our business activities in the reporting year as well as the current state of Siemens worldwide and Siemens AG. Starting from a description of our business, economic environment and strategy, we present our financial target system and a detailed explanation of our results of operations as well as our financial and net assets position. We also report on various aspects of sustainability at Siemens and on expected develop-ments and their material opportunities and risks.
WWW.SIEMENS.COM/AR/COMBINED- MANAGEMENT-REPORT
Additional Sustainability indicators are available at: WWW.SIEMENS.COM/AR/SUSTAINABILITY-FIGURES

171
C. Combined Management Report
172 C.1 Business and economic environment
172 C.1.1 The Siemens Group
179 C.1.2 Economic environment
183 C.1.3 Strategy
187 C.2 Financial performance system187 C.2.1 Overview
187 C.2.2 Revenue growth
187 C.2.3 Profitability and capital efficiency
189 C.2.4 Capital structure
189 C.2.5 Dividend and share buybacks
190 C.2.6 Additional information for financial performance measures
193 C.3 Results of operations193 C.3.1 Orders and revenue by region
194 C.3.2 Segment information analysis
201 C.3.3 Income
202 C.3.4 Reconciliation to adjusted EBITDA
204 C.3.5 Selected information based on new organizational structure
205 C.4 Financial position205 C.4.1 Principles and objectives
of financial management
205 C.4.2 Capital structure
206 C.4.3 Investing activities
207 C.4.4 Cash flows
208 C.4.5 Capital resources and requirements
210 C.5 Net assets position
213 C.6 Overall assessment of the economic position
214 C.7 Subsequent events
215 C.8 Sustainability and citizenship215 C.8.1 Sustainability at Siemens
216 C.8.2 Employees
218 C.8.3 Research and development
220 C.8.4 Supply chain management
221 C.8.5 Distribution and customer relations
221 C.8.6 Environmental Portfolio
222 C.8.7 Environmental protection
224 C.8.8 Corporate citizenship
225 C.9 Report on expected developments and associated material opportunities and risks
225 C.9.1 Report on expected developments
229 C.9.2 Risk management
230 C.9.3 Risks
238 C.9.4 Opportunities
240 C.9.5 Significant characteristics of the accounting-related internal control and risk management system
242 C.10 Compensation Report and legal disclosures
242 C.11 Siemens AG (Discussion on basis of German Commercial Code)
242 C.11.1 Business and economic environment
242 C.11.2 Results of operations
244 C.11.3 Net assets and financial position
245 C.11.4 Employees
245 C.11.5 Subsequent events
245 C.11.6 Risks and opportunities
245 C.11.7 Outlook
C.
Co
mb
ine
d M
anag
em
en
t R
ep
ort

108 A. To our Shareholders 131 B. Corporate Governance 171 C. Combined Management Report
172 C.1 Business and economic environment 187 C.2 Financial performance system 193 C.3 Results of operations 205 C.4 Financial position 210 C.5 Net assets position
172
C.1.1 The Siemens Group
C.1.1.1 ORGANIZATION AND BASIS OF PRESENTATIONWe are a globally operating technology company with core ac-tivities in the fields of electrification, automation and digital-ization, and we occupy leading market positions worldwide in the majority of our businesses. We can look back on a success-ful history spanning 167 years, with groundbreaking and revo-lutionary innovations such as the invention of the dynamo, the first electric streetcar, the construction of the first public power plant, and the first images of the inside of the human body. On a continuing basis, we have around 343,000 employees as of September 30, 2014 and business activities in nearly all countries of the world and reported consolidated revenue of € 71.920 billion in fiscal 2014. We operate 289 major produc-tion and manufacturing plants worldwide. In addition, we have office buildings, warehouses, research and development facili-ties or sales offices in almost every country in the world.
Siemens comprises Siemens AG, a stock corporation under the Federal laws of Germany, as the parent company and a total of about 800 legal entities, including minority investments.
Our Company is incorporated in Germany, with our corporate headquarters situated in Munich. Siemens operates under the leader ship of its Managing Board. The Siemens Managing Board is the sole management body and has overall business responsibility in accordance with the German Stock Corporation Act (Aktiengesetz, AktG). At all other organizational levels within our Company, management responsibility is assigned to individuals who make decisions and assume personal responsi-bility (CEO principle). This principle establishes clear and direct responsibilities and fosters efficient decision-making.
Below the Managing Board, Siemens was structured organiza-tionally into four Sectors (Energy, Healthcare, Industry and Infrastructure & Cities), Financial Services (SFS), Cross-Sector Services, Corporate Units and Countries in fiscal 2014. The Sectors were principally broken down into Divisions and these in turn into Business Units.
In fiscal 2014, the Sectors formed four of our reportable seg-ments. In addition to our four Sectors, we had two additional reportable segments: Equity Investments and SFS. The following figure shows our reportable segments as of September 30, 2014.
C.1 Business and economic environment
Reportable segments as of September 30, 2014
Total Sectors
Energy Sector
therein:> Power Generation> Wind Power> Power Transmission
Healthcare Sector
therein:> Diagnostics
Industry Sector
therein:
> Industry Automation> Drive Technologies
Infrastructure & Cities Sector
therein:> Transportation &
Logistics> Power Grid
Solutions & Products> Building
Technologies
Equity Investments
Financial Services
During fiscal 2014, we initiated a change in the organizational structure of Siemens, which became effective as of October 1, 2014. Beginning with fiscal 2015, we eliminated the Sectors and bundled the businesses of the former Energy, Industry and Infrastructure & Cities Sectors into seven reportable segments,
which consist of the following Divisions: Power and Gas; Wind Power and Renewables; Energy Management; Build-ing Technologies; Mobility; Digital Factory; and Process Industries and Drives.
247 D. Consolidated Financial Statements 337 E. Additional Information
213 C.6 Overall assessment of the economic position 214 C.7 Subsequent events 215 C.8 Sustainability and citizenship 225 C.9 Report on expected developments and
associated material opportunities and risks
242 C.10 Compensation Report and legal disclosures 242 C.11 Siemens AG (Discussion on basis
of German Commercial Code)
173
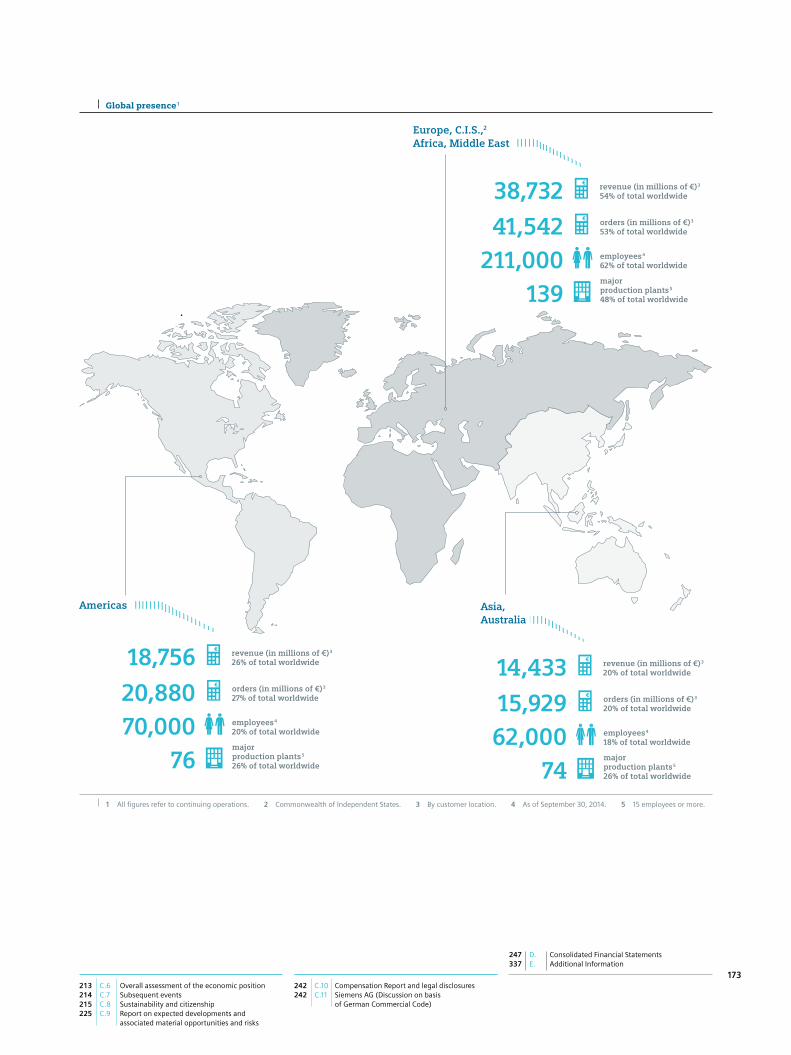
Global presence 1
1 All figures refer to continuing operations. 2 Commonwealth of Independent States. 3 By customer location. 4 As of September 30, 2014. 5 15 employees or more.
Asia, Australia
Americas
139major production plants 5
48% of total worldwide
41,542 orders (in millions of €) 3
53% of total worldwide
211,000 employees 4
62% of total worldwide
38,732 revenue (in millions of €) 3
54% of total worldwide
Europe, C.I.S.,2 Africa, Middle East
74major production plants 5
26% of total worldwide
15,929 orders (in millions of €) 3
20% of total worldwide
62,000 employees 4
18% of total worldwide
14,433 revenue (in millions of €) 3
20% of total worldwide
76major production plants 5
26% of total worldwide
20,880 orders (in millions of €) 3
27% of total worldwide
70,000 employees 4
20% of total worldwide
18,756 revenue (in millions of €) 3
26% of total worldwide
108 A. To our Shareholders 131 B. Corporate Governance 171 C. Combined Management Report
172 C.1 Business and economic environment 187 C.2 Financial performance system 193 C.3 Results of operations 205 C.4 Financial position 210 C.5 Net assets position
174
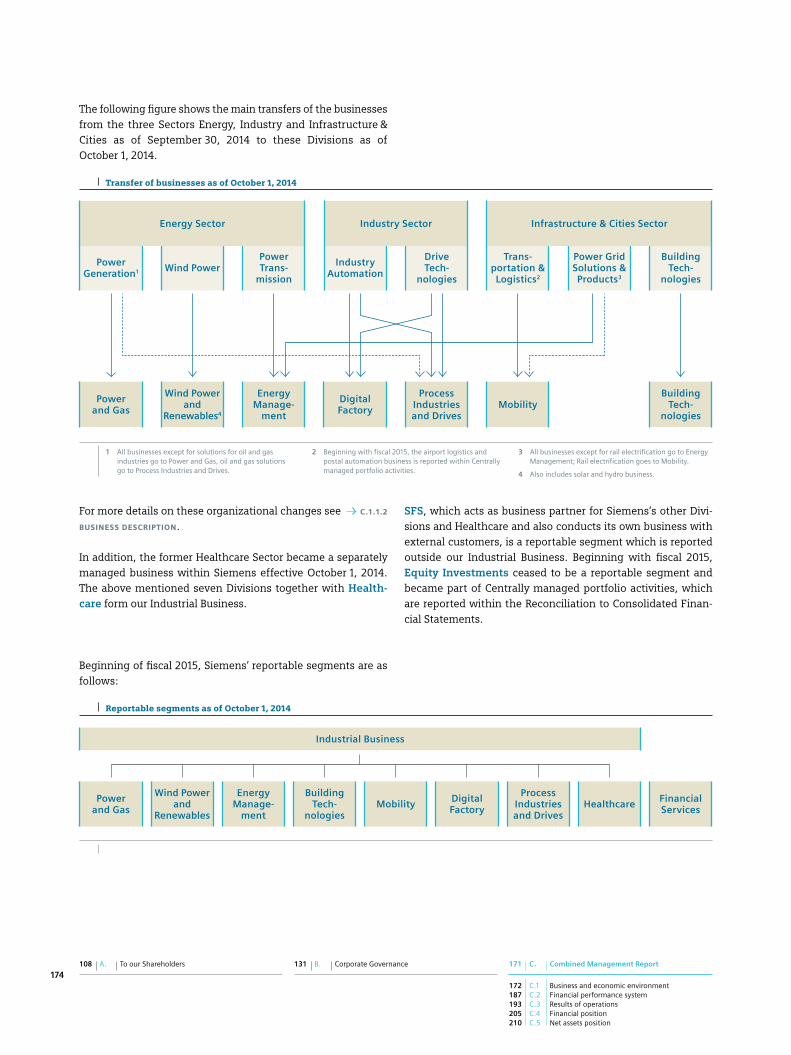
The following figure shows the main transfers of the businesses from the three Sectors Energy, Industry and Infrastructure & Cities as of September 30, 2014 to these Divisions as of October 1, 2014.
Transfer of businesses as of October 1, 2014
Power Generation 1
Power and Gas
Wind Power
Wind Power and
Renewables4
Power Trans
mission
Energy Manage
ment
Industry Automation
Digital Factory
Drive Tech
nologies
Process Industries and Drives
Transportation & Logistics 2
Mobility
Power Grid Solutions & Products 3
Building Tech
nologies
Building Tech
nologies
Energy Sector Industry Sector Infrastructure & Cities Sector
1 All businesses except for solutions for oil and gas industries go to Power and Gas, oil and gas solutions go to Process Industries and Drives.
2 Beginning with fiscal 2015, the airport logistics and postal automation business is reported within Centrally managed portfolio activities.
3 All businesses except for rail electrification go to Energy Management; Rail electrification goes to Mobility.
4 Also includes solar and hydro business.
For more details on these organizational changes see C.1.1.2
BUSINESS DESCRIPTION.
In addition, the former Healthcare Sector became a separately managed business within Siemens effective October 1, 2014. The above mentioned seven Divisions together with Health-care form our Industrial Business.
SFS, which acts as business partner for Siemens’s other Divi-sions and Healthcare and also conducts its own business with external customers, is a reportable segment which is reported outside our Industrial Business. Beginning with fiscal 2015, Equity Investments ceased to be a reportable segment and became part of Centrally managed portfolio activities, which are reported within the Reconciliation to Consolidated Finan-cial Statements.
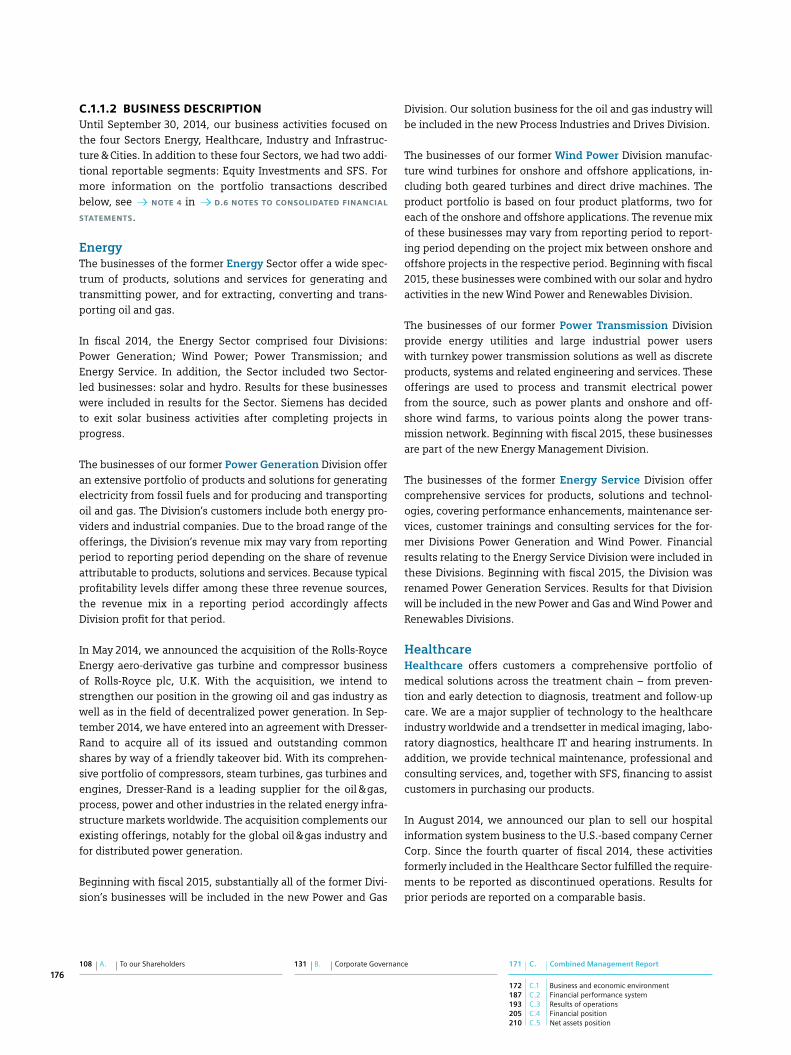
Beginning of fiscal 2015, Siemens’ reportable segments are as follows:
Reportable segments as of October 1, 2014
Power and Gas
Wind Power and
Renewables
Energy Manage
ment
Building Tech
nologiesMobility Digital
Factory
Process Industries and Drives
Healthcare Financial Services
Industrial Business

247 D. Consolidated Financial Statements 337 E. Additional Information
213 C.6 Overall assessment of the economic position 214 C.7 Subsequent events 215 C.8 Sustainability and citizenship 225 C.9 Report on expected developments and
associated material opportunities and risks
242 C.10 Compensation Report and legal disclosures 242 C.11 Siemens AG (Discussion on basis
of German Commercial Code)
175
Our Divisions are responsible for developing and implementing their strategy; for developing and producing their portfolio of products and services; and for managing their sales channels. As “global entrepreneurs” they have end-to-end business re-sponsibility worldwide, including with regard to their operating results. They therefore have “right of way” over the regional units in business matters.
As of October 1, 2014, Healthcare became a separately managed unit, which includes among others, the set-up of customized structures (e.g. sales structures, R & D), systems (especially IT) and functions (e.g. human resources, procurement).
Beginning with fiscal 2015, our businesses are supported by our Corporate Core, which comprises the units Corporate Develop-ment; Governance & Markets; Communications and Govern-ment Affairs; Legal and Compliance, Human Resources; Corpo-rate Technology; and Controlling and Finance and by our Corporate Services, which consist of the units Information Technology; Supply Chain Management; Export Control and Customs; Business Process Services; and Siemens Real Estate. The Corporate Core issues binding company-wide guidelines in coordination with the Managing Board and oversee their imple-mentation. In addition, the Heads of selected corporate func-tions (Governance & Markets, Communications and Govern-ment Affairs, Legal and Compliance, Human Resources, Controlling and Finance) have an unrestricted right to issue instructions in relation to their function across all parts of the company in accordance with the Bylaws for the Managing Board of Siemens AG and to the extent legally permissible.
During the first quarter of fiscal 2014, we disbanded our Regional Cluster organization. Following this organizational change, we have designated 30 Lead Countries which are indi-vidually responsible for managing a number of other Coun-tries regarding market penetration. The Lead Countries and their assigned Countries are responsible for the local customer relationship management and for implementing the business strategies of the Divisions. Each Lead Country reports directly to the Managing Board.
Except otherwise stated, financial measures presented in this Combined Management Report are based on our organizational structure as of September 30, 2014. Based on this organiza-tional structure, we provide financial measures for our four Sectors and for two Businesses, each combining two Divisions within a Sector as well as for eight Divisions of our Sectors. These financial measures include: orders, revenue, profit and profit margin. Divisions within a Sector may do business with each other, leading to corresponding orders and revenue. Such orders and revenues are eliminated on a Sector level. Further-more, our reportable segments may do business with each other, leading to corresponding orders and revenue. Such orders and revenue are eliminated on the Siemens level within Eliminations, Corporate Treasury and other reconciling items and are not included in orders and revenue with external cus-tomers (external orders and external revenue, respectively) reported in this document. For Equity Investments we report profit, and for SFS we report profit and total assets. Free cash flow and further financial measures are reported for each reportable segment in the Notes to Consolidated Financial Statements. For information related to the definition of these financial measures and to the reconciliation of segment finan-cial measures to the Consolidated Financial Statements, see
NOTE 35 in D.6 NOTES TO CONSOLIDATED FINANCIAL STATEMENTS.
108 A. To our Shareholders 131 B. Corporate Governance 171 C. Combined Management Report
172 C.1 Business and economic environment 187 C.2 Financial performance system 193 C.3 Results of operations 205 C.4 Financial position 210 C.5 Net assets position
176
C.1.1.2 BUSINESS DESCRIPTIONUntil September 30, 2014, our business activities focused on the four Sectors Energy, Healthcare, Industry and Infrastruc-ture & Cities. In addition to these four Sectors, we had two addi-tional reportable segments: Equity Investments and SFS. For more information on the portfolio transactions described below, see NOTE 4 in D.6 NOTES TO CONSOLIDATED FINANCIAL
STATEMENTS.
EnergyThe businesses of the former Energy Sector offer a wide spec-trum of products, solutions and services for generating and transmitting power, and for extracting, converting and trans-porting oil and gas.
In fiscal 2014, the Energy Sector comprised four Divisions: Power Generation; Wind Power; Power Transmission; and Energy Service. In addition, the Sector included two Sector- led businesses: solar and hydro. Results for these businesses were included in results for the Sector. Siemens has decided to exit solar business activities after completing projects in progress.
The businesses of our former Power Generation Division offer an extensive portfolio of products and solutions for generating electricity from fossil fuels and for producing and transporting oil and gas. The Division’s customers include both energy pro-viders and industrial companies. Due to the broad range of the offerings, the Division’s revenue mix may vary from reporting period to reporting period depending on the share of revenue attributable to products, solutions and services. Because typical profitability levels differ among these three revenue sources, the revenue mix in a reporting period accordingly affects Division profit for that period.
In May 2014, we announced the acquisition of the Rolls-Royce Energy aero-derivative gas turbine and compressor business of Rolls-Royce plc, U.K. With the acquisition, we intend to strengthen our position in the growing oil and gas industry as well as in the field of decentralized power generation. In Sep-tember 2014, we have entered into an agreement with Dresser- Rand to acquire all of its issued and outstanding common shares by way of a friendly takeover bid. With its comprehen-sive portfolio of compressors, steam turbines, gas turbines and engines, Dresser-Rand is a leading supplier for the oil & gas, process, power and other industries in the related energy infra-structure markets worldwide. The acquisition complements our existing offerings, notably for the global oil & gas industry and for distributed power generation.
Beginning with fiscal 2015, substantially all of the former Divi-sion’s businesses will be included in the new Power and Gas
Division. Our solution business for the oil and gas industry will be included in the new Process Industries and Drives Division.
The businesses of our former Wind Power Division manufac-ture wind turbines for onshore and offshore applications, in-cluding both geared turbines and direct drive machines. The product portfolio is based on four product platforms, two for each of the onshore and offshore applications. The revenue mix of these businesses may vary from reporting period to report-ing period depending on the project mix between onshore and offshore projects in the respective period. Beginning with fiscal 2015, these businesses were combined with our solar and hydro activities in the new Wind Power and Renewables Division.
The businesses of our former Power Transmission Division provide energy utilities and large industrial power users with turnkey power transmission solutions as well as discrete products, systems and related engineering and services. These offerings are used to process and transmit electrical power from the source, such as power plants and onshore and off-shore wind farms, to various points along the power trans-mission network. Beginning with fiscal 2015, these businesses are part of the new Energy Management Division.
The businesses of the former Energy Service Division offer comprehensive services for products, solutions and technol-ogies, covering performance enhancements, maintenance ser-vices, customer trainings and consulting services for the for-mer Divisions Power Generation and Wind Power. Financial results relating to the Energy Service Division were included in these Divisions. Beginning with fiscal 2015, the Division was renamed Power Generation Services. Results for that Division will be included in the new Power and Gas and Wind Power and Renewables Divisions.
HealthcareHealthcare offers customers a comprehensive portfolio of medical solutions across the treatment chain – from preven-tion and early detection to diagnosis, treatment and follow-up care. We are a major supplier of technology to the healthcare industry worldwide and a trendsetter in medical imaging, labo-ratory diagnostics, healthcare IT and hearing instruments. In addition, we provide technical maintenance, professional and consulting services, and, together with SFS, financing to assist customers in purchasing our products.
In August 2014, we announced our plan to sell our hospital information system business to the U.S.-based company Cerner Corp. Since the fourth quarter of fiscal 2014, these activities formerly included in the Healthcare Sector fulfilled the require-ments to be reported as discontinued operations. Results for prior periods are reported on a comparable basis.
247 D. Consolidated Financial Statements 337 E. Additional Information
213 C.6 Overall assessment of the economic position 214 C.7 Subsequent events 215 C.8 Sustainability and citizenship 225 C.9 Report on expected developments and
associated material opportunities and risks
242 C.10 Compensation Report and legal disclosures 242 C.11 Siemens AG (Discussion on basis
of German Commercial Code)
177
Because a large part of our revenue stems from recurring busi-ness, our business activities are to a certain extent resilient to short-term economic trends but are dependent on regulatory and policy developments around the world. We are currently operating in a low growth environment, impacted by healthcare reforms, budgetary constraints and consolidation of healthcare service providers, predominantly in the U.S. and Europe.
In fiscal 2014, the Healthcare Sector included four Divisions: Imaging & Therapy Systems, Clinical Products, Diagnostics and Customer Solutions. The Sector also included Audiology Solutions, a Sector-led business. In addition to our Sector-level financial results, we also reported financial results for our Diagnostics Division.
Beginning with fiscal 2015, Siemens Healthcare will be man-aged separately under the Siemens umbrella. This will enable Healthcare to adjust to markets flexibly and in a more focused way. It means in essence, a sales organization optimized to meet the needs of Healthcare and a Healthcare specific set up of support and central functions. In addition, Siemens an-nounced in November 2014 the sale of its hearing aid business Audiology Solutions to the investment company EQT and the German entre preneurial family Strüngmann as co-investors.
IndustryWith the businesses included in the former Industry Sector, we are one of the world’s leading suppliers of innovative and envi-ronmentally friendly products and solutions for industrial com-panies, particularly those in the process and manufacturing industries. Our end-to-end automation solutions, drive technol-ogies, industrial IT and industry software, in-depth industry expertise and technology-based services help our customers use resources and energy more efficiently, improve productiv-ity, and increase flexibility.
In fiscal year 2014, the Sector consisted of three Divisions: Industry Automation, Drive Technologies and Customer Ser-vices. Financial results relating to the Customer Services Divi-sion were included in the results for Industry Automation and Drive Technologies. During the third quarter of fiscal 2014, nearly all activities of the Metals Technologies business for-merly included in the Industry Sector fulfilled the requirements to be reported as discontinued operations. These activities are to become part of a joint venture with Mitsubishi-Hitachi Metals Machinery Inc., in which Siemens will hold a 49 % stake. Results for prior periods are reported on a comparable basis.
The businesses of the former Industry Automation Division offer a unique combination of automation technologies, indus-trial controls and industry software that supports customers in optimizing the complete product development and production
processes – from product design to production to sales and ser-vice. In line with “Industrie 4.0” – a German high-tech indus-trial strategy – we are working on the convergence between the real and the virtual worlds of production, sometimes called “Digital Enterprise.” Our portfolio is geared largely to the man-ufacturing industry and its major markets such as automotive, aerospace and production equipment as well as food and bev-erage, pharmaceutical and chemical. Therefore our business activities can be strongly affected by economic cycles because these markets tend to react quickly to changes in the overall economic environment.
With the businesses of the former Drive Technologies Divi-sion we are one of the world’s leading suppliers of integrated drive systems. With our products and systems for innovative applications and industry-specific solutions as well as end-to-end services, we are increasing the productivity, energy effi-ciency and reliability of machinery and installations in indus-tries such as shipbuilding, cement, mining, and pulp and paper. Advanced industry software facilitates our offerings’ optimal integration. Our reliable gears, couplings, and drive solutions are partly also in high demand in other Divisions of the Siemens Group, mainly for rail transport and wind turbines. With our e-Car business, we develop motors and inverters for electric cars and thereby address an additional future growth market. The industries served by our businesses, particularly the process industries, the energy industry and the infrastruc-ture sector, generally show a delayed response to changes in the overall economic environment. In contrast, our business activities that serve customers in the manufacturing industries can be strongly affected by economic cycles.
With a comprehensive portfolio of services and a global net-work of experts, our businesses of the former Customer Services Division support our industrial customers with tech-nology-based industry services across entire lifecycles of their plants and machinery – from planning and engineering to operation and modernization.
Beginning with fiscal 2015, we serve the industrial market with two new Divisions that tailor their strategies to specific customer industries. The Digital Factory Division primarily addresses the manufacturing industry and its major markets: automotive, aerospace, and machine tool and production equip-ment over the complete product lifecycle of our customers. The Process Industries and Drives Division focuses largely on the process industries like pharmaceutical, food & beverage, chemical and related industries as well as drive solutions for infrastructure topics. The related business activities within the former Industry Automation and Drive Technologies Divisions were accordingly realigned into the two new Divisions. In order to streamline the process automation activities in the oil & gas

108 A. To our Shareholders 131 B. Corporate Governance 171 C. Combined Management Report
172 C.1 Business and economic environment 187 C.2 Financial performance system 193 C.3 Results of operations 205 C.4 Financial position 210 C.5 Net assets position
178
industries, the former Energy Power Generation Division’s oil & gas solutions business is part of the new Process Indus-tries and Drives Division. The former Customer Services Division is managed within the new Digital Factory Division.
Infrastructure & CitiesThe businesses of the former Infrastructure & Cities Sector of-fer a wide range of technologies that increase the functionality and sustainability of metropolitan centers and urban infra-structures worldwide, such as integrated mobility solutions, building and security systems, power distribution equipment, grid automation and control products and solutions, smart grid applications and low and medium-voltage products. We apply our IT and automation expertise to optimize infrastructures – making better use of existing systems and reducing operating costs while increasing energy efficiency and improving safety and security.
In fiscal 2014, the Sector consisted of five Divisions: Rail Sys-tems; Mobility and Logistics; Low and Medium Voltage; Smart Grid; and Building Technologies. Financial results of the Rail Systems and the Mobility and Logistics Divisions were com-bined and reported together as the results of the Sector’s Trans-portation & Logistics Business. Financial results of the Divisions Low and Medium Voltage and Smart Grid were combined and reported together as the Sector’s Power Grid Solutions & Prod-ucts Business.
The offerings of the former Rail Systems Division comprise Siemens’ rail vehicle business – including high-speed trains, commuter trains, passenger coaches, metros, people movers, light rail vehicles, locomotives, bogies, traction systems and rail-related services. We combine our expertise in the fields of mass transit, regional and long-distance transportation, driver-less systems, traction systems, bogies and onboard power supplies in order to offer comprehensive know-how for reliable and efficient rail vehicles.
The business activities of the former Mobility and Logistics Division hold leading positions as global providers of the inte-grated technologies that enable people and goods to be trans-ported safely, efficiently and in an environmentally friendly manner. Our offerings encompass rail automation and intelli-gent traffic and transportation systems. The products, services and IT-based solutions in our portfolio combine innovation with comprehensive industry know-how. In fiscal 2014, our of-ferings also comprised our airport logistics business for cargo tracking and baggage handling and our postal automation business for letter and parcel sorting. In the third quarter of fiscal 2014, Siemens announced that it no longer intends to sell this business. The activities are to be carved out and operated as a separate business under the Siemens umbrella so that this
business can operate better and more flexible in its medium- sized competitive environment. Beginning with fiscal 2015, the airport logistics and postal automation business is reported within Centrally managed portfolio activities, which are part of the Reconciliation to Consolidated Financial Statements.
The principal customers of the businesses included in our for-mer Rail Systems and Mobility and Logistics Divisions are pub-lic and state-owned companies in the transportation and logis-tics sectors. Markets served by these businesses are driven primarily by public spending. Customers of these businesses usually have multi-year planning and implementation hori-zons, and their contract tenders therefore tend to be indepen-dent of short-term economic trends.
Beginning with fiscal 2015, the business activities of the former Rail Systems and Mobility and Logistics Divisions are combined to form the Mobility Division. The Mobility Division also includes the rail electrification business of the former Smart Grid Division.
The business activities of the former Low and Medium Volt-age Division supply public energy providers, industrial compa-nies and municipal utilities with a complete range of products, systems and solutions for power distribution infrastructures. Our portfolio includes highly reliable power supply solutions for conventional power plants and renewable energy systems as well as intelligent, compact substations for urban and rural distribution networks. We also offer energy-efficient solutions for heavy industry, the oil & gas industry and the process industry. Energy-efficient solutions and energy storage systems for the integration of renewable energies into power grids round off our portfolio. Business activities included in our Low and Medium Voltage Division generally tend to react quickly to changes in the overall economic environment.
Beginning with fiscal 2015, the business activities of the former Low and Medium Voltage Division are included in the new Energy Management Division.
The business activities of the former Smart Grid Division offer power providers, network operators, industrial enterprises and cities an end-to-end portfolio of products and solutions for developing intelligent grid infrastructures. Smart grids enable a bidirectional flow of energy and information. They are re-quired for the integration of more renewable energy sources into conventional power transmission and distribution net-works. In addition, power providers can run their plants more efficiently with data gained from smart grids. Software solu-tions that analyze data from smart grids will continuously gain importance. Our offerings include both in-house technology development and systems from software partners. The principal customers are power producers, grid operators, multi utilities,

247 D. Consolidated Financial Statements 337 E. Additional Information
213 C.6 Overall assessment of the economic position 214 C.7 Subsequent events 215 C.8 Sustainability and citizenship 225 C.9 Report on expected developments and
associated material opportunities and risks
242 C.10 Compensation Report and legal disclosures 242 C.11 Siemens AG (Discussion on basis
of German Commercial Code)
179
cities and rail operators. Changes in the overall economic envi-ronment generally have a delayed effect on our business activ-ities. Furthermore, parts of our businesses are driven by public spending. Customers in the public sector usually have multi-year planning and implementation horizons, and their contract tenders therefore tend to be independent of short-term eco-nomic trends.
Beginning with fiscal 2015, all businesses of the former Smart Grid Division except for the rail electrification business are in-cluded in the new Energy Management Division. As described above, the rail electrification business is included in the new Mobility Division as of fiscal 2015.
The Building Technologies Division is a leading provider of automation technologies and services for safe, secure and effi-cient buildings and infrastructures throughout the lifecycle of buildings. The Division offers products, solutions and services for fire safety, security, building automation, heating, venti-lation, air conditioning and energy management. The large customer base is widely-dispersed. It includes public and com-mercial building owners, operators and tenants, building con-struction general contractors and system houses. Changes in the overall economic environment generally have a delayed effect on our business activities.
At the beginning of fiscal 2015, the Building Technologies Divi-sion includes the same business activities as it did at the end of fiscal 2014.
Equity InvestmentsIn fiscal 2014, Equity Investments in general comprised equity stakes held by Siemens that are accounted for by the equity method or as available-for-sale financial assets and that for strategic reasons are not allocated to a Sector or a Division, re-spectively, SFS, Centrally managed portfolio activities, Siemens Real Estate (SRE), Corporate items or Corporate Treasury. Our main investments within Equity Investments were our 50 % stake in BSH Bosch und Siemens Hausgeräte GmbH (BSH), our 17 % stake in OSRAM Licht AG (OSRAM), our 12 % stake in Atos SE (AtoS) and our 49 % stake in Enterprise Networks Holdings B.V. (EN), which in the fourth quarter of fiscal 2014, was re-named Unify Holdings B.V. (Unify). In the fourth quarter of fiscal 2014, Siemens signed an agreement to sell its stake in BSH to Robert Bosch GmbH. The transaction is expected to be com-pleted in the first half of calendar 2015. Equity Investments ceased to be a reportable segment beginning with fiscal 2015. As of October 1, 2014, equity stakes formerly included in Equity Investments are reported within Centrally managed portfolio activities, which are part of the Reconciliation to Consolidated Financial Statements.
Financial ServicesFinancial Services (SFS) provides business-to-business finan-cial solutions. With its specialist financing and technology expertise in the areas of Siemens businesses, SFS supports cus-tomer investments with leasing solutions and equipment, project and structured financing. SFS provides capital for Siemens customers as well as other companies and manages financial risks of Siemens.
SFS operates the Corporate Treasury of the Siemens Group, which includes managing liquidity, cash and interest risks as well as certain foreign exchange, credit and commodities risks. Business activities and tasks of Corporate Treasury are reported in the segment information within Reconciliation to Consoli-dated Financial Statements. For further information on Corpo-rate Treasury activities see C.4.1 PRINCIPLES AND OBJECTIVES OF
FINANCIAL MANAGEMENT.
C.1.2 Economic environment
C.1.2.1 WORLDWIDE ECONOMIC ENVIRONMENTFiscal year 2014 started with a divergent global economic development. While emerging countries showed a mixed pic-ture with growth slowing down in the BRIC countries (Brasil, Russia, India, China), early economic indicators in many indus-trial economies (U.S., U.K., Japan, countries of the Euro zone) signaled improvements. In the Euro zone, years of economic stagnation and recession seemed set to come to an end. Given the importance of these “heavy weights” for the world econ-omy, expectations for fiscal 2014 were quite positive. Indeed, with growth of 2.8 % year-over-year, global gross domestic product (GDP) growth had accelerated in the second half of cal-endar 2013 compared to the first half, when GDP grew by 2.1 % year-over-year. However, these promising prospects did not materialize in 2014 for several unforeseeable reasons. The un-usually strong winter of 2013 / 2014 disrupted large parts of the U.S. economy and led to negative GDP growth in the U.S. in the first quarter of calendar 2014. With the start of calendar 2014, the first of a series of geopolitical conflicts escalated: the con-flict in Ukraine brought about substantial uncertainty for the whole year. In the Middle East, several military conflicts got worse: Israel and Palestinians again went to war; Libya fell back into political chaos; the militant group “Islamic State” made sig-nificant military advances in Syria and Iraq and triggered an American-led intervention. All these shocks to the global eco n-omy led to increased uncertainty and weighed on global econ-omic activity. Accordingly, global GDP grew only by 2.7 % and not by 3.2 % as expected in October 2013. The slowdown of fixed investment growth and value added manufacturing growth – both impor tant indicators for Siemens as a producer of capital goods – was even stronger: Fixed investments grew by only

108 A. To our Shareholders 131 B. Corporate Governance 171 C. Combined Management Report
172 C.1 Business and economic environment 187 C.2 Financial performance system 193 C.3 Results of operations 205 C.4 Financial position 210 C.5 Net assets position
180
3.6 % in 2014 and not by 5.2 % as expected in October 2013, global value added in manufacturing grew by only 3.5 % and not by the expected 4.0 %, hurting Siemens’ industrial and energy- related businesses in particular.
From a geographical perspective, the region Europe, C.I.S., Africa, Middle East was the only of our three reporting regions delivering faster GDP growth in 2014 than in 2013. However, with 1.6 % the level of growth is still lower than in the other re-porting regions. In addition, last year’s expectation was 0.5 per-centage points higher. The main reasons for the disappointing performance are the still very sluggish development in Europe, in particular the Euro zone, and recessions in both Russia and Ukraine. In Germany, the fiscal year started promisingly with sentiment indicators continuously improving, followed by a strong first quarter of calendar 2014 (which was partly due to mild winter weather). However, in the course of year 2014 the uncertainties caused by the geopolitical conflicts increasingly weighed on economic activity and slowed down GDP growth for the full year.
In the Americas region, growth slowed down slightly to 2.0 %. A year earlier, the expectation was for growth of 2.7 %. The harsh winter mentioned above, which reduced consumption and factory output in some areas of the U. S. and Canada, was one reason for the slowdown. In addition, the economies of most Latin American countries grew substantially slower than estimated last year. For example GDP growth for Brazil was marked down from 3.1 % to a negative 0.1 % from October 2013 to October 2014. The pattern was similar for Argentina, Chile, Venezuela and Peru. One important driver for this weak perfor-mance was globally weaker commodity markets.
In Asia, Australia, GDP growth for calendar 2014 is estimated at 4.8 %, virtually the same level as in previous years. Compared to last year’s expectation this is 0.3 percentage points lower,
reflecting slower growth in China (7.3 % against 8 % expected last year), which is largely explained by continued downturns in real estate and manufacturing investment. India suffered from investment shifts before the general election that took place from April to May 2014.
Real GDP growth per region (change in % compared to prior year) 1
World Europe, C.I.S.,3 Africa,
Middle East
Americas Asia, Australia
5
4
3
2
1
2014 2 2013
1 Source: Siemens AG, based on an IHS Global Insight as of October 15, 2014. Growth rates provided by calendar year.
2 Estimate for calendar year 2014.
3 Commonwealth of Independent States.
The partly estimated figures presented here for GDP, fixed invest ments and manufacturing value added are calculated by Siemens based on an IHS Global Insight report dated Octo-ber 15, 2014.
Our businesses are dependent on the development of raw material prices. Key materials to which we have significant cost exposure include copper, various grades and formats of steel, and aluminum. In addition, within stainless steel we have exposure related to nickel and ferro-alloy materials.
The average monthly price of copper (denominated in € per metric ton) for September 2014 was 1 % lower than the average monthly price in September 2013. Prices on a fiscal-year average
2.7
1.62.0
4.8
2.6
1.1
2.3
4.9
World real GDP growth (in % compared to previous period) 1
2010 2011 2012 2013 2014
7
6
5
4
3
2
1
Quarterly GDP growth (seasonally adjusted annual rate) Annual GDP growth
Quarterly GDP growth forecast (seasonally adjusted annual rate) Annual GDP growth forecast
1 Siemens AG, based on an IHS Global Insight report as of October 15, 2014.
5.14.8
3.7 3.52.9
1.82.4
1.5
2.53.3
3.73.2
1.4
2.73.1 3.2
2.4 2.5
3.6
2.4
4.4
3.22.6 2.6 2.7

247 D. Consolidated Financial Statements 337 E. Additional Information
213 C.6 Overall assessment of the economic position 214 C.7 Subsequent events 215 C.8 Sustainability and citizenship 225 C.9 Report on expected developments and
associated material opportunities and risks
242 C.10 Compensation Report and legal disclosures 242 C.11 Siemens AG (Discussion on basis
of German Commercial Code)
181
were still 10 % lower in fiscal 2014 than the average for fiscal 2013, reflecting modest demand during fiscal 2014.
Average monthly prices of aluminum traded on the London Metal Exchange recently rebounded and were 17 % higher in September 2014 compared to September 2013. Prices on a fiscal- year average were nevertheless 8 % lower in fiscal 2014 than the average of fiscal 2013. Significantly rising premiums for physically delivered aluminum have added to the prices of the London Metal Exchange contracts. The aluminum industry is in a situation of a global oversupply due to rapid expansion of capacities, while regional markets in the western world face a tighter supply.
The average monthly steel prices for September 2014 declined by 8 % compared to the average monthly prices in Septem-ber 2013. Prices on a fiscal-year average were 7 % lower in fiscal 2014 than the average for fiscal 2013.
Our main exposure to the prices of copper, aluminum and related products is in the new Divisions Energy Management and Process Industries and Drives. Our main price exposure related to carbon steel and stainless steel is in our new Divi-sions Power and Gas and Wind Power and Renewables. In addi-tion, Siemens is generally exposed to energy and fuel prices, both directly (electricity, gas, oil) and indirectly (energy used in the manufacturing processes of suppliers, fuels included in logistics costs).
Siemens employs various strategies to reduce the price risk in its project and product businesses, such as long-term contract-ing with suppliers, physical and financial hedging and price escalation clauses with customers.
C.1.2.2 MARKET DEVELOPMENTIn fiscal 2014, the addressed market of our Energy Sector devel-oped stable year-over-year. Wind power markets showed the strongest growth (both onshore and offshore). Markets for power transmission grew slightly while market volume for large gas turbines declined year-over-year.
Markets of the Power Generation Division declined in fiscal 2014 compared to fiscal 2013. In particular the advanced gas turbine market remained difficult with a market size in fiscal 2014 clearly below fiscal 2013. In addition, production over-capacities have been resulting in increased price pressure. During the fiscal year, the overall market environment for fossil power generation faced project shifts in various regions lead-ing to tough competition. While key countries such as the U.S. or China have been facing market delays, countries of the Middle East, especially Saudi-Arabia showed higher invest-ments in gas-fired power plants year-over-year. Demand for industrial gas and steam turbines developed roughly flat.
Markets served by our Wind Power Division grew clearly in fis-cal 2014 fueled by strong demand in Europe, which is the most mature geographic market in the world for onshore and off-shore wind power. In particular, Europe is home to almost all offshore installations currently active worldwide. Within the Americas, growth in the U.S. was driven by onshore wind proj-ects, following the extension of an existing production tax credit (PTC) for renewable energy into the first quarter of fiscal 2014. Market development in the Asia, Australia region was characterized by intense local competition, particularly in China. While China has the largest wind market in the world, market access for foreign companies remains to be very diffi-cult and limited. The competitive situation in the wind power
Development of raw material prices (Index: Beginning of fiscal 2010 = 100)
FY 2010 FY 2011 FY 2012 FY 2013 FY 2014
170
160
150
140
130
120
110
100
90
80
Copper Aluminium (HG) Steel HRC
Source: London Metal Exchange (LME) for copper and aluminium, CRU HRC Germany for steel; cash prices in € per ton.
108 A. To our Shareholders 131 B. Corporate Governance 171 C. Combined Management Report
172 C.1 Business and economic environment 187 C.2 Financial performance system 193 C.3 Results of operations 205 C.4 Financial position 210 C.5 Net assets position
182
markets differs between the market segments. In the market for onshore wind farms, competition is widely dispersed with-out any one company holding a dominant share of the market. In contrast, there are only a few major players in the market for offshore wind farms, which are technologically more complex. Several competitors have managed to return to profitability through cost reduction measures and restructuring. Previously existing overcapacities have been adjusted to better match demand. Consolidation is moving forward in both on- and off-shore wind power through the market exit of smaller players, and especially in offshore through joint ventures between established players and new market entrants. The key drivers for consolidation are technology and market access challenges, which increase development costs and the importance of risk sharing in offshore wind power.
Markets addressed by our Power Transmission Division grew slightly in fiscal 2014 compared to fiscal 2013, due mainly to strong demand from parts of Europe and the Middle East, including Germany, the U.K. and Saudi Arabia, where large transmission projects were awarded. In contrast, investments in Russian electrical infrastructure went down significantly in fiscal 2014. Markets in Asia remained stable year-over-year. While growth in China slowed down somewhat, India awarded a new contract for a large high-voltage direct current (HVDC) project. On a currency-adjusted basis, market volume in the Americas increased slightly year-over-year. Including currency translation effects, markets in the Americas declined slightly year-over-year.
In fiscal 2014, markets served by our Healthcare Sector grew slightly year-over-year. Growth was again driven by emerging markets, which continued to build up their healthcare infra-structures and expand access to modern medical technology for a broader population. Market development in industrialized countries remained weak, impacted by healthcare reforms and budgetary constraints. On a regional basis, markets in the Americas grew moderately. Market conditions in our large U.S. market remained challenging as service providers faced ongo-ing pressure on utilization and reimbursement rates associated with medical devices. The U.S. market for Healthcare IT contin-ues to grow, but at a slower pace than in previous years. Healthcare markets in the Europe, C.I.S., Africa, Middle East region declined slightly. During fiscal 2014, European health-care markets saw some stabilization. The market situation in Germany was challenging. Demand stagnated and price pres-sure was strong. Decreasing public grants to the country ’s health insurance system is burdening the financial situation of hospitals and thus their willingness to invest. Growth in China slowed down compared to the previous fiscal year. Markets in
China are experiencing a shift in demand, from an emphasis on large clinics to increased investment in small and midsize regional clinics. Along with this change, competitive and price pressure rose, due mainly to increasing numbers of local ven-dors. Overall, the trend toward consolidation in the healthcare industry continues. Competition among the leading companies is strong, including with respect to price.
In fiscal 2014, markets served by our Industry Sector, consist-ing of our Industry Automation and Drive Technologies Divi-sions, grew slightly year-over-year. At the beginning of the fiscal year, growth came mainly from stronger demand in long-cycle industries and restocking by customers in China. Towards the end of the fiscal year, demand also began to pick up in short-cycle industries. Within the main industries served by our Divisions, demand in the automotive industry was par-ticularly strong, with many countries reporting significant in-creases in production, especially in Europe. The machine build-ing industry developed less favorable in the beginning of the fiscal year due to weaker growth in many emerging economies, which are important markets for export-oriented industrialized countries. In the last months of fiscal 2014, demand in the machine building industries picked up somewhat. On a regional basis, our markets in Europe experienced a slight recovery in fiscal 2014, due to a more positive overall economic environ-ment year-over-year, particularly including Spain, Poland and the Netherlands. While markets in Germany grew year-over-year, growth was held back by stagnation in original equip-ment manufacturing (OEM) industries, which were impacted by lower demand from emerging markets. Overall, demand in Europe for industrial investment goods was held back as pro-duction capacities of our customers still did not reach full utili-zation. In the Americas, except the U.S., growth in end-cus-tomer markets slowed down in fiscal 2014 compared to fiscal 2013. This was particularly evident in Brazil. Within the U.S., demand in the oil and gas industries grew strongly. In contrast markets for electrical investment goods expanded modestly. Within the Asia, Australia region, growth slowed down year-over-year in several countries, particularly including Australia, India, Indonesia and Thailand. Growth in China was solid year-over-year. While growth in China benefited from restocking ef-fects, it was supported also by strong demand from the coun-try ’s automotive and infrastructure industries, and, to a lesser extent, by demand in parts of the construction machinery mar-kets and food machinery, elevators and rubber machines mar-kets. Competition of Industry ’s business activities can be grouped into two categories: multinational companies that of-fer a relatively broad portfolio and companies that are active only in certain geographic or product markets. Consolidation is taking place mostly in particular market segments and not

247 D. Consolidated Financial Statements 337 E. Additional Information
213 C.6 Overall assessment of the economic position 214 C.7 Subsequent events 215 C.8 Sustainability and citizenship 225 C.9 Report on expected developments and
associated material opportunities and risks
242 C.10 Compensation Report and legal disclosures 242 C.11 Siemens AG (Discussion on basis
of German Commercial Code)
183
across the broad base of our portfolio, with the exception of the acquisition of Invensys by Schneider Electric. Consolidation in solution-driven markets is going in the direction of in-depth niche market expertise, whereas consolidation of the product- driven market follows the line of convergence. Most major competitors have established global bases for their businesses. In addition, competition has become increasingly focused on technological improvements and cost position.
In fiscal 2014, the broad overall market for the offerings of the Infrastructure & Cities Sector grew slightly. The market for rail systems showed growth, non-residential construction markets were recovering, and the market for power grid solutions and products remained challenging.
Markets served by the Transportation & Logistics Business grew moderately in fiscal 2014, fueled e.g. by large contract awards in the U.K. and in Saudi Arabia within the Europe, C.I.S., Africa, Middle East region. Europe remained the largest market for the Business. Growth in the Americas region benefited from demand for passenger locomotives and urban transport prod-ucts in the U.S. The Asia, Australia region showed the highest growth rates of all regions. This growth was fueled, amongst others, by a recovery in China, which began to increase its investments in high-speed trains.
In fiscal 2014, markets for our Power Grid Solutions & Prod-ucts Business declined slightly year-over-year including weaker demand from some emerging markets countries. Overall, the decline is caused by weak demand in the Europe, C.I.S., Africa, Middle East region. The market situation in southern Europe remained particularly challenging. In Germany, which is under-taking a massive shift to renewable energy (“Energie wende”), utilities continued to delay major grid investments due to un-certainty in the regulatory environment. The Americas re-ported modest growth in real terms, particularly in the U.S., where the economy is gaining momentum in construction and oil and gas markets. The overall market development was more positive in the Asia, Australia region, particularly including demand in the utility business within emerging economies. Furthermore, markets in the oil and gas business and in the non-residential construction business grew year-over-year, par-ticularly in China.
In fiscal 2014, markets addressed by our Building Technol-ogies Division grew slightly in aggregate year-over-year. Within our non-residential construction markets, some segments developed more favorably than the market overall. Among them were data centers and the pharmaceutical industry, which showed clear growth in construction activities compared
to fiscal 2013. Within Europe, non-residential construction markets saw some stabilization in fiscal 2014, but remained weak due to the economic situation and austerity programs in some southern and western European countries. In contrast, markets in the Middle East, in Asia and Australia grew consid-erably year-over-year. In the Americas, growth in non-residen-tial construction markets began to accelerate during the fiscal year. There is usually a time lag of three to four quarters be-fore Building Technologies businesses begin to participate in such growth.
Infrastructure & Cities principal competitors are multinational companies. The Sector also faces competition from niche com-petitors and from new entrants, such as utility companies and consulting firms, exploiting the fragmented energy efficiency market. The Sector’s solution businesses also compete with en-gineering, procurement and construction providers, and com-petitors in the service field often include small local players.
C.1.3 Strategy
C.1.3.1 VISION 2020In May 2014, we presented our entrepreneurial concept “ Vision 2020.”
Shaped by our history, culture and values, our mission defines how we understand ourselves. As an expression of a strong brand, it formulates our aspiration: We make real what matters, by setting the benchmark in the way we electrify, automate and digitalize the world around us. Ingenuity drives us and what we create is yours. Together we deliver.
There are three stages in which we will lead our Company into the future:
> In the short term, we want to “drive performance.” To achieve this aim, we are retailoring our structures and re-sponsibilities. We are also focusing on business excellence. In addition, we want to get those businesses back on track that have not reached their full potential and make them competitive again.
> “Strengthen core” is our aim in the medium term. We in-tend to strengthen our successful businesses along the value chain of electrification by, among other things, allocating resources in a more rigorous way in order to expand in strategic growth fields.
> In the long term, we want to “scale up.” We will intensify our efforts to seize further growth opportunities and tap new fields.

108 A. To our Shareholders 131 B. Corporate Governance 171 C. Combined Management Report
172 C.1 Business and economic environment 187 C.2 Financial performance system 193 C.3 Results of operations 205 C.4 Financial position 210 C.5 Net assets position
184
We have linked the success of Vision 2020 to the attainment of seven overarching goals:
> Implement stringent corporate governance: We want to simplify and accelerate our processes, while reducing com-plexity in our Company and strengthening our corporate governance functions. We expect that these measures en-able us to reduce our costs by roughly € 1 billion. The savings are expected to be mainly effective in fiscal 2016.
> Create value sustainably: We are tapping attractive growth fields and getting those businesses that have not yet reached their full potential back on track.
> Execute financial target system: We are rigorously imple-menting our financial target system.
> Expand global management: To reflect our global orienta-tion more strongly in the future, we want more than 30 % of our Division and Business Unit managers to be based outside Germany.
> Be partner of choice for our customers: We want to be our customers’ partner of choice. To measure customer satisfac-tion, we use the Net Promoter Score (NPS) – a comprehensive customer satisfaction survey that we conduct every year. Our goal is to improve our score by at least 20 %.
> Be an employer of choice: Highly committed and satisfied employees are the basis of our success. We are – and want to remain – an attractive employer. That is why we conduct a global engagement survey to measure employee satisfaction. In the categories Leadership and Diversity, we aim to achieve an approval rating of over 75 % on a sustainable basis.
> Foster an ownership culture: In the future, our employees will have an even greater stake in their company’s success. We want to increase the current number of employee share-holders by at least 50 %.
C.1.3.2 STRATEGIC FRAMEWORKWe have defined a comprehensive strategic framework that integrates the key fields of company management. These key fields are:
> Ownership culture; > Customer and business focus; > Governance; and > our management model “One Siemens.”
a) Ownership cultureOne engine of sustainable business is our ownership culture, in which every employee takes personal responsibility for our Company’s success. “Always act as if it were your own Company” – this maxim applies to everyone at Siemens, from Managing Board member to trainee.
b) Customer and business focusWe expect that the megatrends digital transformation, global-ization, urbanization, demographic change and climate change will provide growth opportunities. We are focusing on our posi-tioning along the value chain of electrification. This is where our core business lies. From power generation to power trans-mission, power distribution and smart grid to the efficient application of electrical energy – in every one of these inter-related fields, electrification, automation and digitalization are the key business drivers.
> Power generation: The field of efficient power generation – encompassing conventional and renewable energy sources as well as comprehensive services – is addressed by our Divisions Power and Gas, Wind Power and Renewables, and Power Generation Services.
> Power transmission, power distribution and smart grid: Solutions for power transmission and distribution as well as technologies for smart grids are all bundled at our Energy Management Division.
> Energy application: Our Divisions Building Technologies, Mobility, Digital Factory and Process Industries and Drives are delivering technologies for the efficient application of energy in building technology, transportation and industry.
> Imaging and in-vitro diagnostics: Healthcare is responsible for our medical imaging and in-vitro diagnostics businesses.
In all areas related to project financing, Financial Services is a reliable partner to our customers.
We want to set clear priorities for resource allocation and address promising growth fields, for example:
> Flexible and small gas turbines; > Offshore wind power; > Distribution grid automation and software; > Urban and interurban mobility; > Digital-twin software; > Key sectors in process industries; > Image-guided therapy and molecular diagnostics; and > Business analytics and data-driven services, software and IT solutions.
Flexible and small gas turbines: In the area of power genera-tion, the trend is increasingly toward decentralized energy supply. Customers worldwide are relying more and more on individualized energy supplies and demanding tailor-made solutions. As a result, we see major growth potential in the field of flexible and small gas turbines.

247 D. Consolidated Financial Statements 337 E. Additional Information
213 C.6 Overall assessment of the economic position 214 C.7 Subsequent events 215 C.8 Sustainability and citizenship 225 C.9 Report on expected developments and
associated material opportunities and risks
242 C.10 Compensation Report and legal disclosures 242 C.11 Siemens AG (Discussion on basis
of German Commercial Code)
185
Offshore wind power: Among renewable sources of energy, wind power will play a key role over the long term. Offshore wind turbines deliver high yields and are subject to less fluctu-ation than other renewables. We want to continue building on the leading position in offshore wind power that we have cap-tured in recent years. We consider double-digit market growth realistic in this field in the medium term.
Distribution grid automation and software: Energy manage-ment is becoming increasingly vital – for distribution grids as well as industrial and private energy producers and consumers. Energy management systems make it possible to integrate in-creasingly decentralized power supplies into the energy cycle, while mitigating the negative impact of the fluctuations that occur when power is generated from renewable sources – thus improving the utilization of existing power grids. Our intelli-gent, integrated automation solutions offer customers decisive added value.
Urban and interurban mobility: In strong demand, intelligent mobility solutions are providing major impulses for growth – particularly in the areas of urban transportation and automated traffic-control solutions. We see stronger growth potential in this area as well.
Digital-twin software: The virtual and real worlds are merging more and more. Already today, our software solutions are help-ing customers develop products much faster, more flexibly and more efficiently. Not only products but also the plants in which they are produced have digital twins that can be used to co-ordinate and integrate product design and production plan-ning. The digital models are always up-to-date – as planned, as built, as maintained – while allowing improvements through-out entire lifecycles.
Key sectors in process industries: Some industry sectors – oil & gas and food & beverage, for example – are growing at above-average rates. We want to participate in this growth. That is why we are bundling our expertise in process industries and drive technologies and continuing to expand our related portfolio of products and software solutions.
Image-guided therapy and molecular diagnostics: The in-creasing use of molecular biological methods and progress in the life sciences are accelerating technological change in health-care. To improve quality and efficiency, societies worldwide are also demanding new solutions for next-generation healthcare.
Business analytics and data-driven services, software and IT solutions: We have a comprehensive understanding of our
customers’ business processes. In the future, we want to lever-age this knowledge even better by analyzing the data gener-ated in these processes, providing recommendations for im-provement and action, and thus creating value. The resulting competitive advantages for our customers are increasingly derived from cloud-based solutions and services powered by data-analytics software.
c) GovernanceWe want to lead Siemens in such a way that we focus on our customers at all times and further expand our market penetra-tion while maintaining lean and flexible structures. That is why we have selected a market-integrative setup that combines a common regional organization with a coordinated vertical approach. Against this backdrop, we have retailored the struc-tures and responsibilities of our businesses, our Regions and our corporate governance functions:
> We have removed layers from our Company, thus bringing our businesses closer to customers and key markets. We re-placed our 14 Regional Clusters with 30 Lead Countries. The CEOs of these countries now report directly to our Managing Board.
> We have also eliminated the Sector level and consolidated our business activities into nine Divisions and one separately managed unit, Healthcare. This change is increasing our customer proximity and accelerating our decision-making.
> In addition, we have made governance even more stringent across all levels of our organization. Our Managing Board leads the Company and maintains the balance between our businesses and regions. It is supported by strong, efficient governance functions, our Corporate Core. This Corporate Core ensures fast, unbureaucratic decision-making across key company functions.
d) Management model “One Siemens”To enable us to manage our Company more effectively, we have expanded “One Siemens” into an integrated management model that combines under one roof the overarching targets and priorities with which we are implementing our strategy throughout the Company. It encompasses a financial frame-work, an operating system and Corporate Memory as well as sustainability and citizenship.
Financial frameworkTo measure and compare our development against the market and in our competitive environment, we used a system of defined key indicators. We have now refined and expanded this financial target system, which is explained in more detail in C.2 FINANCIAL PERFORMANCE SYSTEM.
108 A. To our Shareholders 131 B. Corporate Governance 171 C. Combined Management Report
172 C.1 Business and economic environment 187 C.2 Financial performance system 193 C.3 Results of operations 205 C.4 Financial position 210 C.5 Net assets position
186
Operating system and Corporate MemoryWe manage our Company in accordance with specific, clearly defined priorities. Our One Siemens operating system sets the following four priorities: Customer proximity, innovation, busi-ness excellence, as well as people excellence and care. In addi-tion, the Corporate Memory – our knowledge management – ensures that we learn from mistakes and keep our work focused on success.
Customer proximity: Profitable growth is based on proximity to our customers and on an understanding of their individual requirements. To meet and exceed our customers’ expecta-tions, we invest in local sales presence and support for spe-cific groups of market partners. Our key account management approach is just one successful example of this. We are repre-sented in virtually every country in the world by Regional Com-panies that operate as local partners to our customers. We also exploit our in-depth knowledge of customer processes and continually develop our offerings for key verticals in a targeted manner – across organizational boundaries. To regularly gauge the satisfaction of our customers around the world, we use a uniform measure, the Net Promoter Score.
Innovation: Innovation is essential for ensuring long-term competitiveness. This applies to our entire portfolio of prod-ucts, solutions and services. Added value for our customers is based increasingly on software and IT solutions. As a result, we have made this field a particular focus of our attention – for example, through research and development activities in soft-ware architecture and platforms. Tools such as partner net-works are enabling us to manage highly effective innovation processes and an open innovation culture. We are concentrat-ing on new technology-driven growth areas as well as innova-tive business models.
Business excellence: We want to do an excellent job of man-aging our businesses while pursuing our aim of continuous improvement. For this, we have developed outstanding tools that we intend to apply with even greater rigor in the future.
These tools enable us, for instance, to benchmark our per-formance against the best and to increase our productivity. Tightening our risk management approach is helping us iden-tify project risks while still in the bidding phase and thus avoid costly project delays. Last but not least, we are fostering our service business across organizational boundaries – for example, by developing service platforms.
People excellence and care: Excellent employees are the heart and soul of Siemens. That is how it has always been. And we want it to be even more so in the future. Therefore we are anchoring an ownership culture at our Company. For us, this is not an abstract idea but a concrete goal that we are pursuing with measures we can track. After all, the behavior, motivation and values of the people who work for Siemens mold our cul-ture. In an attractive working environment, we promote lifelong learning and personal development. Integrity – supported by a well-established compliance system – remains the prin ciple that guides our conduct. Our share programs are enabling us to increase employee participation in our Company’s success, while bringing us closer every day to a lived ownership culture.
Sustainability and citizenshipWe contribute to sustainable development by maintaining a responsible balance at company level between profit, planet and people.
> Profit: by having a range of products, solutions and services that makes a difference worldwide, because it provides cus-tomers with decisive competitive advantages.
> Planet: by utilizing our planet’s limited resources responsibly and by enabling our customers to improve their own environ-mental performance.
> People: by living a culture that strengthens our employees’ sense of responsibility worldwide, fosters their development and places integrity at the center of our Company’s activities. As good corporate citizens, we are also contributing to the sustainable development of society through our portfolio, our local presence worldwide and our role as a thought leader.

247 D. Consolidated Financial Statements 337 E. Additional Information
213 C.6 Overall assessment of the economic position 214 C.7 Subsequent events 215 C.8 Sustainability and citizenship 225 C.9 Report on expected developments and
associated material opportunities and risks
242 C.10 Compensation Report and legal disclosures 242 C.11 Siemens AG (Discussion on basis
of German Commercial Code)
187
C.2.1 Overview
Within One Siemens, we have established a financial frame-work – for revenue growth, for profitability and capital effi-ciency, for our capital structure, and for our dividend policy.
C.2.2 Revenue growth
Within the framework of One Siemens, we aim to grow our rev-enue faster than the average weighted revenue growth of our most relevant competitors. In fiscal 2014, we calculated our rev-enue growth for this comparison using actual revenue as pre-sented in the Consolidated Financial Statements. Our primary measure for managing and controlling our revenue growth is comparable growth, which excludes currency translation and portfolio effects. We provide figures for both comparable and actual revenue growth in this Annual Report, within C.3.1
ORDERS AND REVENUE BY REGION.
Revenue growth
Revenue current period – 1 × 100 %
Revenue prioryear period
Actual
FY 2014 (2)%
FY 2013 (2)%
Comparable 1
FY 2014 1%
FY 2013 (1)%
1 Excluding currency translation and portfolio effects.
C.2.3 Profitability and capital efficiency
Within the framework of One Siemens, we aim to achieve mar-gins through the entire business cycle that are comparable to those of our relevant competitors. For purposes of this compar-ison in fiscal 2014, we used defined adjusted EBITDA margin ranges, which are based on the results of the respective rele-vant competitors of our four Sectors. Information regarding the calculation of adjusted EBITDA is presented in C.3.4
RECONCILIATION TO ADJUSTED EBITDA.
Adjusted EBITDA margins 1
Margin Target range
Energy
FY 2014 8.1%10 – 15%
FY 2013 9.9%
Healthcare
FY 2014 20.5%15 – 20%
FY 2013 20.7%
Industry
FY 2014 16.4%11 – 17%
FY 2013 13.1%
Infrastructure & Cities
FY 2014 9.4%8 – 12%
FY 2013 3.7%
1 Adjusted EBITDA margins of respective markets through business cycle.
Target range
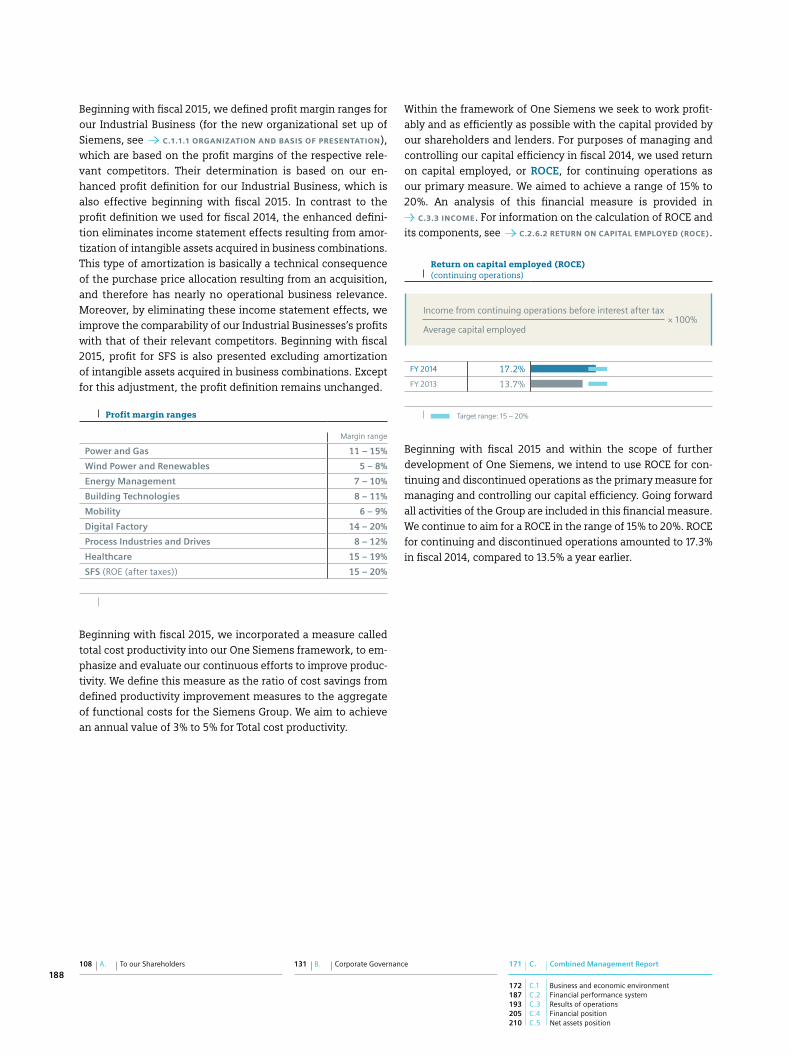
In line with common practice in the financial services busi-ness, our financial indicator for measuring capital efficiency at Financial Services (SFS) is return on equity after tax, or ROE (after tax). For information on the calculation of ROE (after tax) and its components, see C.2.6.1 RETURN ON EQUITY (ROE)
( AFTER TAX).
Return on equity (ROE) (after tax)
SFS’ profit after tax × 100%
SFS’ average allocated equity
FY 2014 18.1%
FY 2013 17.1%
Target range: 15 – 20%
For purposes of managing and controlling profitability at the Group level, we use net income as our primary measure. This measure is the main driver of basic earnings per share (EPS) from net income, which we use for communicating with the capital markets. For an analysis of this measure, refer to
C.3.3 INCOME.
C.2 Financial performance system
108 A. To our Shareholders 131 B. Corporate Governance 171 C. Combined Management Report
172 C.1 Business and economic environment 187 C.2 Financial performance system 193 C.3 Results of operations 205 C.4 Financial position 210 C.5 Net assets position
188
Beginning with fiscal 2015, we defined profit margin ranges for our Industrial Business (for the new organizational set up of Siemens, see C.1.1.1 ORGANIZATION AND BASIS OF PRESENTATION), which are based on the profit margins of the respective rele-vant competitors. Their determination is based on our en-hanced profit definition for our Industrial Business, which is also effective beginning with fiscal 2015. In contrast to the profit definition we used for fiscal 2014, the enhanced defini-tion eliminates income statement effects resulting from amor-tization of intangible assets acquired in business combinations. This type of amortization is basically a technical consequence of the purchase price allocation resulting from an acquisition, and therefore has nearly no operational business relevance. Moreover, by eliminating these income statement effects, we improve the comparability of our Industrial Businesses’s profits with that of their relevant competitors. Beginning with fiscal 2015, profit for SFS is also presented excluding amortization of intangible assets acquired in business combinations. Except for this adjustment, the profit definition remains unchanged.
Profit margin ranges
Margin range
Power and Gas 11 – 15%
Wind Power and Renewables 5 – 8%
Energy Management 7 – 10%
Building Technologies 8 – 11%
Mobility 6 – 9%
Digital Factory 14 – 20%
Process Industries and Drives 8 – 12%
Healthcare 15 – 19%
SFS (ROE (after taxes)) 15 – 20%
Beginning with fiscal 2015, we incorporated a measure called total cost productivity into our One Siemens framework, to em-phasize and evaluate our continuous efforts to improve produc-tivity. We define this measure as the ratio of cost savings from defined productivity improvement measures to the aggregate of functional costs for the Siemens Group. We aim to achieve an annual value of 3 % to 5 % for Total cost productivity.
Within the framework of One Siemens we seek to work profit-ably and as efficiently as possible with the capital provided by our shareholders and lenders. For purposes of managing and controlling our capital efficiency in fiscal 2014, we used return on capital employed, or ROCE, for continuing operations as our primary measure. We aimed to achieve a range of 15 % to 20 %. An analysis of this financial measure is provided in
C.3.3 INCOME. For information on the calculation of ROCE and its components, see C.2.6.2 RETURN ON CAPITAL EMPLOYED (ROCE).
Return on capital employed (ROCE) (continuing operations)
Income from continuing operations before interest after tax × 100%
Average capital employed
FY 2014 17.2%
FY 2013 13.7%
Target range: 15 – 20%
Beginning with fiscal 2015 and within the scope of further develop ment of One Siemens, we intend to use ROCE for con-tinuing and discontinued operations as the primary measure for managing and controlling our capital efficiency. Going forward all activities of the Group are included in this financial measure. We continue to aim for a ROCE in the range of 15 % to 20 %. ROCE for continuing and discontinued operations amounted to 17.3 % in fiscal 2014, compared to 13.5 % a year earlier.

247 D. Consolidated Financial Statements 337 E. Additional Information
213 C.6 Overall assessment of the economic position 214 C.7 Subsequent events 215 C.8 Sustainability and citizenship 225 C.9 Report on expected developments and
associated material opportunities and risks
242 C.10 Compensation Report and legal disclosures 242 C.11 Siemens AG (Discussion on basis
of German Commercial Code)
189
C.2.4 Capital structure
Sustainable revenue and profit development is supported by a healthy capital structure. A key consideration within the frame-work of One Siemens is to maintain ready access to the capital markets through various debt products and preserve our ability to repay and service our debt obligations over time. Our pri-mary measure for managing and controlling our capital struc-ture is the ratio of industrial net debt to adjusted EBITDA. This financial measure indicates the approximate amount of time in years that would be needed to cover industrial net debt through income from continuing operations, without taking into account interest, taxes, depreciation and amortization. In fiscal 2014, we aimed to achieve a ratio in the range of 0.5 to 1.0. For more information regarding adjusted EBITDA and for an analysis of our capital structure ratio, see C.3.4 RECONCILIA-
TION TO ADJUSTED EBITDA and C.4.2 CAPITAL STRUCTURE.
Capital structure (continuing operations)
Industrial net debt
Adjusted EBITDA
FY 2014 0.15
FY 2013 0.35
Target range: 0.5 – 1.0
Beginning with fiscal 2015, we intend to achieve a ratio of up to 1.0, and thereby maintain our healthy capital structure.
C.2.5 Dividend and share buybacks
We intend to continue providing an attractive return to share-holders. In fiscal 2014, we intended to propose a dividend pay-out which, combined with outlays during the fiscal year for publicly announced share buybacks, results in a sum represent-ing 40 % to 60 % of net income, which for this purpose we may adjust to exclude selected exceptional non-cash effects.
At the Annual Shareholders’ Meeting, the Managing Board, in agreement with the Supervisory Board, will submit the follow-ing proposal to allocate the unappropriated net income of Siemens AG for the fiscal year ended September 30, 2014: to distribute a dividend of € 3.30 on each share of no-par value entitled to the dividend for fiscal year 2014 existing at the date of the Annual Shareholders’ Meeting, with the remaining amount to be carried forward. Payment of the proposed divi-dend is contingent upon approval by Siemens shareholders at the Annual Shareholders’ Meeting on January 27, 2015. The prior- year dividend was € 3.00 per share.
The proposed dividend of € 3.30 per share for fiscal 2014 rep-resents a total payout of € 2.706 billion based on the estimated number of shares entitled to dividend at the date of the Annual Shareholders’ Meeting. Based on net income of € 5.507 billion for fiscal 2014, the dividend payout percentage is 49 %. The per-centage for fiscal 2013 was 57 %, based on a total dividend pay-out of € 2.533 billion and a net income of € 4.409 billion.
Dividend payout percentage
Total dividend payout × 100%
Net income
FY 2014 49%
FY 2013 57%
In November 2013, we announced a share buyback of up to € 4 billion ending latest on October 31, 2015. In May 2014, we started to repurchase shares. Through the end of fiscal 2014, outlays for our publicly announced share buybacks (excluding incidental transaction charges) totaled € 1.079 billion and repre-sent 20 % of net income.
The percentage for fiscal 2013 was 26 % with outlays for share buybacks in the amount of € 1.152 billion.
Beginning with fiscal 2015, we intend to realize a dividend pay-out range, without the effect of share buybacks, of 40 % to 60 % of net income, which for this purpose we may adjust to exclude selected exceptional non-cash effects. As in the past, we intend to fund the dividend payout from Free cash flow.

108 A. To our Shareholders 131 B. Corporate Governance 171 C. Combined Management Report
172 C.1 Business and economic environment 187 C.2 Financial performance system 193 C.3 Results of operations 205 C.4 Financial position 210 C.5 Net assets position
190
C.2.6 Additional information for financial performance measures
C.2.6.1 RETURN ON EQUITY (ROE) (AFTER TAX)The following table reports the calculation of ROE (after tax) of SFS as defined under One Siemens.
Year ended September 30,
(in millions of €) 2014 2013
Calculation of income taxes of SFS
Profit of SFS (Income before income taxes, IBIT) 465 409
Less: Income of SFS from investments accounted for using the equity method, net 1 (66) (85)
Less: Taxfree income components and others 2 (41) (26)
Tax basis 358 298
Tax rate (flat) 30% 30%
Calculated income taxes of SFS 107 89
Profit after tax of SFS
Profit of SFS (IBIT) 465 409
Less: Calculated income taxes of SFS (107) (89)
Profit after tax of SFS 357 320
ROE (after tax) of SFS
(I) Profit after tax of SFS 357 320
(II) Average allocated equity of SFS 3 1,976 1,874
(I) / (II) ROE (after tax) of SFS 18.1% 17.1%
1 For information on Income (loss) of SFS from investments accounted for using the equity method net, see C.3.4 RECONCILIATION TO ADJUSTED EBITDA.
2 Taxfree income components include forms of financing which are generally exempted from income taxes. Others comprise result components related to the (partial) sale / divestment of equity investments, which
are classified from at equity to availableforsale financial assets and are therefore not included in the (Income) loss of SFS from investments accounted for using the equity method, net. Such results are already taxed or generally tax free. Others may also comprise an adjustment for material taxable Income (loss) of SFS from investments accounted for using the equity method, net.
3 Average allocated equity of SFS for a fiscal year is determined as a fivepoint average in allocated equity of SFS of the respective quarters starting with the allocated equity of SFS as of September 30 of the previous fiscal year.

247 D. Consolidated Financial Statements 337 E. Additional Information
213 C.6 Overall assessment of the economic position 214 C.7 Subsequent events 215 C.8 Sustainability and citizenship 225 C.9 Report on expected developments and
associated material opportunities and risks
242 C.10 Compensation Report and legal disclosures 242 C.11 Siemens AG (Discussion on basis
of German Commercial Code)
191
C.2.6.2 RETURN ON CAPITAL EMPLOYED (ROCE)As part of One Siemens, we managed and controlled our capital efficiency in fiscal 2014 using the financial measure ROCE for continuing operations. The following tables report this financial measure as defined under One Siemens and also provide a rec-onciliation to ROCE for continuing and discontinued operations.
(in millions of €) 09/30/2014 06/30/2014 03/31/2014 12/31/2013 09/30/2013
Capital employed Fiscal 2014
Total equity 31,514 28,633 28,336 30,372 28,625
Plus: Longterm debt 19,326 18,364 18,587 18,377 18,509
Plus: Shortterm debt and current maturities of longterm debt 1,620 4,092 3,757 2,883 1,944
Less: Cash and cash equivalents (8,013) (8,210) (8,585) (8,885) (9,190)
Less: Current availableforsale financial assets (925) (907) (799) (666) (601)
Plus: Postemployment benefits 9,324 10,473 9,614 8,771 9,265
Less: SFS Debt (18,663) (17,017) (16,428) (16,022) (15,600)
Less: Fair value hedge accounting adjustment 1 (1,121) (1,114) (1,134) (1,166) (1,247)
Capital employed (continuing and discontinued operations) 33,063 34,313 33,348 33,665 31,706
Less: Assets classified as held for disposal presented as discontinued operations (2,325) (1,689) (14) (758) (768)
Plus: Liabilities associated with assets classified as held for disposal presented as discontinued operations 1,559 1,275 20 232 258
Capital employed (continuing operations) 32,297 33,898 33,354 33,138 31,195
(in millions of €) 09/30/2013 06/30/2013 03/31/2013 12/31/2012 09/30/2012
Capital employed Fiscal 2013
Total equity 28,625 27,909 26,620 30,551 31,424
Plus: Longterm debt 18,509 19,140 20,182 16,651 16,880
Plus: Shortterm debt and current maturities of longterm debt 1,944 3,656 2,752 3,709 3,826
Less: Cash and cash equivalents (9,190) (6,071) (7,892) (7,823) (10,891)
Less: Current availableforsale financial assets (601) (506) (533) (517) (524)
Plus: Postemployment benefits 9,265 9,325 9,890 9,856 9,801
Less: SFS Debt (15,600) (15,004) (14,879) (14,490) (14,558)
Less: Fair value hedge accounting adjustment 1 (1,247) (1,323) (1,473) (1,570) (1,670)
Capital employed (continuing and discontinued operations) 31,706 37,127 34,667 36,367 34,289
Less: Assets classified as held for disposal presented as discontinued operations (768) (4,783) (4,616) (4,589) (4,693)
Plus: Liabilities associated with assets classified as held for disposal presented as discontinued operations 258 1,948 1,948 2,045 2,010
Capital employed (continuing operations) 31,195 34,291 31,999 33,823 31,606
1 Debt is generally reported with a value representing approximately the amount to be repaid. However, for debt designated in a hedging relationship (fair value hedges), this amount is adjusted by changes in market
value mainly due to changes in interest rates. Accordingly, we deduct these changes in market value in order to end up with an amount of debt that approximately will be repaid, which we believe is a more meaningful
figure for the calculation presented above. For further infor mation on fair value hedges see NOTE 30 in
D.6 NOTES TO CONSOLIDATED FINANCIAL STATEMENTS.

108 A. To our Shareholders 131 B. Corporate Governance 171 C. Combined Management Report
172 C.1 Business and economic environment 187 C.2 Financial performance system 193 C.3 Results of operations 205 C.4 Financial position 210 C.5 Net assets position
192
Year ended September 30,
(in millions of €) 2014 2013
Income from continuing operations before interest after tax
Net income 5,507 4,409
Less: Other interest expenses / income, net (606) (455)
Plus: SFS Other interest expenses / income 1 630 556
Plus: Net interest expenses from postemployment benefits 295 297
Less: Taxes on interest adjustments 2 (87) (111)
Income before interest after tax 5,739 4,695
Less: Income from discontinued operations, net of income taxes (108) (231)
Income from continuing operations before interest after tax 5,632 4,465
Return on capital employed (ROCE) (continuing and discontinued operations)
(I) Income before interest after tax 5,739 4,695
(II) Average capital employed (continuing and discontinued operations) 3 33,219 34,831
(I) / (II) ROCE (continuing and discontinued operations) 17.3% 13.5%
Return on capital employed (ROCE) (continuing operations)
(I) Income from continuing operations before interest after tax 5,632 4,465
(II) Average capital employed (continuing operations) 3 32,777 32,583
(I) / (II) ROCE (continuing operations) 17.2% 13.7%
1 SFS Other interest expenses / income is included in Other interest expenses / income, net. Adding back SFS Other interest expenses / income in the numerator corresponds to the adjustment for SFS Debt in the denominator.
2 Effective tax rate for the determination of taxes on interest adjustments is calculated by dividing Income tax expenses by Income from continuing operations before income taxes, both as reported in D.1 CON-
SOLIDATED STATEMENTS OF INCOME.
3 Average capital employed for a fiscal year is determined as a fivepoint average in capital employed of the respective quarters starting with the capital employed as of September 30 of the previous fiscal year.
C.2.6.3 DEFINITIONS OF OTHER FINANCIAL MEASURESWe also use other financial measures in addition to the mea-sures described above, such as orders and order backlog for the assessment of our future revenue potential. We define and cal-culate orders and order backlog as follows:
Under our policy for the recognition of orders, we generally recognize the total contract amount for an order when we enter into a contract that we consider legally effective and compul-sory based on a number of different criteria. The contract amount is the agreed price or fee for that portion of the contract for which the delivery of goods and / or the provision of services has been irrevocably agreed. Future revenue from long-term service, maintenance and outsourcing contracts is recognized as orders in the amount of the total contract value only if there is adequate assurance that the contract will remain in effect for its entire duration (e.g., due to high exit barriers for the cus-tomer). Orders are generally recognized immediately when the relevant contract is considered legally effective and compul-sory. The only exceptions are orders with short overall contract terms. In this case, a separate reporting of orders would provide no significant additional information regarding our perfor-mance. For orders of this type, the recognition of orders thus occurs when the corresponding revenue is recognized.
Order backlog represents an indicator for the future revenues of our Company resulting from already recognized orders. Order backlog is calculated by adding the orders of the current fiscal year to the balance of the order backlog as of the end of the prior fiscal year and then subtracting the revenue recognized in the current fiscal year. If the amount of an order already recog-nized in the current or the previous fiscal years is modified or if an order from the current fiscal year is cancelled, we adjust orders for the current quarter and also our order backlog accordingly, but do not retroactively adjust previously pub-lished orders. However, if an order from a previous fiscal year is cancelled, orders of the current quarter and, accordingly, the current fiscal year are generally not adjusted; instead, the exist-ing order backlog is revised directly. Aside from cancellations, the order backlog is also subject to currency translation and portfolio effects.
There is no standard system for compiling and calculating or-ders and order backlog information that applies across compa-nies. Accordingly, our orders and order backlog may not be comparable with orders and order backlog measures reported by other companies. We subject our orders and our order back-log to internal documentation and review requirements. We may change our policies for recognizing orders and order back-log in the future without previous notice.

247 D. Consolidated Financial Statements 337 E. Additional Information
213 C.6 Overall assessment of the economic position 214 C.7 Subsequent events 215 C.8 Sustainability and citizenship 225 C.9 Report on expected developments and
associated material opportunities and risks
242 C.10 Compensation Report and legal disclosures 242 C.11 Siemens AG (Discussion on basis
of German Commercial Code)
193
C.3.1 Orders and revenue by region
Orders for fiscal 2014 totaled € 78.350 billion, and revenue came in at € 71.920 billion. Both represented a 2 % decrease year-over-year, due in part to unfavorable currency translation effects. The resulting book-to-bill ratio was 1.09 for Siemens in fiscal 2014. On a comparable basis, excluding currency translation and portfolio effects, orders and revenue both grew 1 % year-over-year.
The order backlog (defined as the sum of order backlogs of the Sectors) was € 100 billion as of September 30, 2014, up from € 94 billion a year earlier.
Orders (location of customer)
Year ended September 30,
% Change therein
2014 2013 ActualCompa
rable 1
Currency
Port folio(in millions of €)
Europe, C.I.S.,2 Africa, Middle East 41,542 43,889 (5)% (4)% (1)% 0%
therein Germany 10,986 11,616 (5)% (5)% 0% 0%
Americas 20,880 21,070 (1)% 4% (5)% 1%
therein U.S. 14,842 13,592 9% 11% (3)% 1%
Asia, Australia 15,929 14,796 8% 12% (4)% 0%
therein China 6,641 6,053 10% 12% (2)% 0%
Siemens 78,350 79,755 (2)% 1% (3)% 0%
1 Excluding currency translation and portfolio effects.
2 Commonwealth of Independent States.
Orders related to external customers in fiscal 2014 decreased 2 %, largely due to a moderate decline in Infrastructure & Cities where prior-year orders included a € 3.0 billion contract for trains and maintenance in the U.K. Slight decreases in Health-care and Energy were only partially offset by order growth in Industry.
In the region Europe, C.I.S., Africa, Middle East, the decline in orders was due mainly to a double-digit decrease in Infra-structure & Cities caused by a lower volume from large orders compared to a year earlier. Orders came in slightly lower in the Americas, despite 9 % order growth in the U.S. Key growth drivers here included Siemens’ largest-ever order for light rail vehicles in the U.S. and a rebound in the U.S. wind business after a sharp drop in the previous year. Clear order growth in Asia, Australia was due in part to a higher volume from large orders in Energy. In addition, China contributed to the regional development with a sharp increase in Infrastructure & Cities and double-digit order growth in Industry.
On a global basis, orders from emerging markets, as these mar-kets are defined by the International Monetary Fund, remained level year-over-year, and accounted for € 27.471 billion, or 35 %, of total orders for fiscal 2014. Comparable order growth in emerging markets was 6 % year-over-year.
Revenue (location of customer)
Year ended September 30,
% Change therein
2014 2013 ActualCompa
rable 1
Currency
Port folio(in millions of €)
Europe, C.I.S.,2 Africa, Middle East 38,732 39,390 (2)% (1)% (1)% 0%
therein Germany 10,857 10,652 2% 2% 0% 0%
Americas 18,756 19,644 (5)% 0% (5)% 0%
therein U.S. 12,876 13,110 (2)% 1% (3)% 1%
Asia, Australia 14,433 14,411 0% 4% (4)% 0%
therein China 6,442 5,866 10% 12% (2)% 0%
Siemens 71,920 73,445 (2)% 1% (3)% 0%
1 Excluding currency translation and portfolio effects.
2 Commonwealth of Independent States.
Revenue related to external customers declined 2 % com-pared to fiscal 2013. Clear revenue growth year-over-year in Infra structure & Cities resulting from the continuing execution of large rolling-stock projects, was more than offset by a clear decline in Energy, which saw revenue fall in many of its businesses and in all three reporting regions. Industry revenue came in near the prior-year level and Healthcare reported a slight decline, both including unfavorable currency trans-lation effects.
While revenue in Asia, Australia came in near the prior-year level, it included double-digit revenue growth in China that resulted from a sharp increase in Infrastructure & Cities and a solid contribution from Industry. In the Americas, revenue was lower year-over-year in all Sectors, due in part to currency trans-lation headwinds as mentioned above. A double-digit decrease in Energy revenue in Europe, C.I.S., Africa, Middle East more than offset clear growth in Infrastructure & Cities. Emerging markets reported a 2 % decline compared to fiscal 2013 and accounted for € 24.312 billion, or 34 %, of total revenue in fiscal 2014. Comparable revenue growth in emerging markets was 3 % year-over-year.
C.3 Results of operations

108 A. To our Shareholders 131 B. Corporate Governance 171 C. Combined Management Report
172 C.1 Business and economic environment 187 C.2 Financial performance system 193 C.3 Results of operations 205 C.4 Financial position 210 C.5 Net assets position
194
C.3.2 Segment information analysis
C.3.2.1 ENERGY
Sector
Year ended September 30, % Change therein
(in millions of €) 2014 2013 Actual Comparable 1 Currency Portfolio
Profit 1,569 1,955 (20)%
Profit margin 6.4% 7.3%
Orders 28,646 28,797 (1)% 4% (3)% (1)%
Total revenue 24,631 26,638 (8)% (3)% (3)% (1)%
External revenue 24,380 26,425 (8)%
therein:
Europe, C.I.S.,2 Africa, Middle East 12,766 14,382 (11)%
therein Germany 2,507 2,246 12%
Americas 7,013 7,155 (2)%
Asia, Australia 4,601 4,888 (6)%
1 Excluding currency translation and portfolio effects. 2 Commonwealth of Independent States.
Energy Sector profit of € 1.569 billion in fiscal 2014 was down significantly compared to a year earlier, due mainly to continu-ing profitability challenges including a revenue decline and a less favorable business mix. Both periods included substantial burdens on profit. In the current period, the impacts included € 538 million in charges at Power Transmission and € 272 mil-lion in charges at Wind Power. Burdens on Sector profit a year ago included € 301 million in charges for the “Siemens 2014” program, a loss of € 255 million at Siemens’ solar activities, € 171 million in charges at Power Transmission, among others, € 94 million in charges related to onshore wind turbine blades and € 46 million in charges related to compliance with sanc-tions on Iran at Power Generation. The Power Generation Divi-sion increased its profit year-over-year, benefiting from a gain on the sale of the Division’s turbo fan business and a positive effect from a successful project completion. Power Trans-mission posted a sharply higher loss year-over-year, and Wind Power reported a loss compared to a profit in fiscal 2013.
Revenue for the Sector came in 8 % lower than a year ago on decreases in all three reporting regions, reflecting weak order development at Power Generation and selective order intake at Power Transmission in the past. Power Generation and Power Transmission posted revenue declines compared to the prior year, while Wind Power clearly increased its revenue. Orders for the Sector came in 1 % lower than in the prior year. On a regional basis, an increase in the Asia, Australia reporting region was more than offset by a decline in the Americas. Negative currency translation effects took three percentage points from both revenue and order development during the year. The book-to-bill ratio for Energy was 1.16, and its order backlog was € 58 billion at the end of the fiscal year. Out of the order backlog as of September 30, 2014, orders of € 19 billion are expected to be converted into revenue in fiscal 2015 and the remainder in the periods thereafter.
Orders and revenue by quarter (in millions of €)
Orders Revenue Booktobill ratio
Q4 2014 20,733 Q4 2014 20,621 1.01
Q3 2014 19,284 Q3 2014 17,692 1.09
Q2 2014 18,027 Q2 2014 16,865 1.07
Q1 2014 20,306 Q1 2014 16,742 1.21
Q4 2013 20,298 Q4 2013 20,559 0.99
Q3 2013 19,928 Q3 2013 18,363 1.09
Q2 2013 20,761 Q2 2013 17,226 1.21
Q1 2013 18,767 Q1 2013 17,297 1.09

247 D. Consolidated Financial Statements 337 E. Additional Information
213 C.6 Overall assessment of the economic position 214 C.7 Subsequent events 215 C.8 Sustainability and citizenship 225 C.9 Report on expected developments and
associated material opportunities and risks
242 C.10 Compensation Report and legal disclosures 242 C.11 Siemens AG (Discussion on basis
of German Commercial Code)
195
Orders by Business
Year ended September 30, % Change therein
(in millions of €) 2014 2013 Actual Comparable 1 Currency Portfolio
Power Generation 15,478 16,366 (5)% 0% (4)% (2)%
Wind Power 7,748 6,593 18% 19% (2)% 0%
Power Transmission 5,586 5,700 (2)% 2% (4)% 0%
1 Excluding currency translation and portfolio effects.
Revenue by Business
Year ended September 30, % Change therein
(in millions of €) 2014 2013 Actual Comparable 1 Currency Portfolio
Power Generation 13,909 15,242 (9)% (4)% (3)% (2)%
Wind Power 5,500 5,174 6% 9% (3)% 0%
Power Transmission 5,310 6,167 (14)% (10)% (3)% 0%
1 Excluding currency translation and portfolio effects.
Profit and Profit margin by Business
Profit Profit margin
Year ended September 30, Year ended September 30,
(in millions of €) 2014 2013 % Change 2014 2013
Power Generation 2,186 2,126 3% 15.7% 13.9%
Wind Power (15) 306 n / a (0.3)% 5.9%
Power Transmission (636) (156) >(200)% (12.0)% (2.5)%
Profit at Power Generation in fiscal 2014 increased moderately year-over-year to € 2.186 billion, despite a 9 % revenue decline. The current period benefited from a € 73 million gain on the sale of the Division’s turbo fan business and a positive € 72 million effect from a successful project completion in the turnkey busi-ness. The Division continues to face challenges in an increas-ingly competitive market for large gas turbines. For comparison, profit development a year earlier was held back by € 163 million in “Siemens 2014” charges and € 46 million in charges related to compliance with sanctions on Iran. Revenue for the Division decreased 9 % year-over-year on declines in all three reporting regions, due in part to negative currency translation. Order in-take was below the level of the prior year, including strong neg-ative currency translation effects, as declines in the Americas and Europe, C.I.S., Africa, Middle East were only partially offset by an increase in Asia, Australia. On an organic basis, order intake was on the same level as in the prior year.
Wind Power reported a loss of € 15 million in fiscal 2014, com-pared to a profit of € 306 million in fiscal 2013. The Division recorded charges of € 272 million for inspecting and replacing main bearings in onshore wind turbines and for repairing offshore and onshore wind blades. The revenue mix was clearly less favorable year-over-year, due to a significantly lower
contribution from the higher-margin offshore business. In addi-tion, the Division’s production costs were higher compared to the prior year. For comparison, fiscal 2013 profit was burdened by € 94 million in charges related to inspecting and retrofitting onshore turbine blades, but benefited from positive effects re-lated to project completions and the settlement of a claim related to an offshore wind-farm project. Revenue was up 6 % as an increase in the onshore business, particularly in the Ameri-cas, more than offset the above-mentioned decline in the off-shore business. Order intake was up significantly year-over-year as order intake in the Americas region grew sharply, driven mainly by a recovery in the U.S., the Division’s largest national market for onshore wind power, from a low basis of comparison in the prior year that resulted from uncertainty about continu-ation of production tax incentives.
Power Transmission reported a loss of € 636 million, substan-tially wider than the loss a year earlier mainly due to project execution challenges. In the current year, the Division took charges totaling € 298 million related to two high voltage direct current (HVDC) transmission line projects in Canada, resulting from revised estimates for civil engineering and infrastructure provided by suppliers as well as penalties for associated project delays, among other factors. In addition, the Division took

108 A. To our Shareholders 131 B. Corporate Governance 171 C. Combined Management Report
172 C.1 Business and economic environment 187 C.2 Financial performance system 193 C.3 Results of operations 205 C.4 Financial position 210 C.5 Net assets position
196
charges of € 240 million primarily related to grid connections to offshore wind-farms resulting from transport, installation and commissioning costs, compared to charges of € 171 million in the prior year. The Division reached several material milestones with respect to its North Sea grid connection projects in fiscal 2014. Finally, profit development in fiscal 2014 was also held back by a less favorable revenue mix due to a high proportion of projects with low or negligible profit margins. In the prior
C.3.2.2 HEALTHCARE
Sector
Year ended September 30, % Change therein
(in millions of €) 2014 2013 Actual Comparable 1 Currency Portfolio
Profit 2,027 2,033 0%
Profit margin 16.3% 16.1%
Orders 12,819 13,004 (1)% 3% (4)% 0%
Total revenue 12,429 12,649 (2)% 2% (4)% 0%
External revenue 12,401 12,626 (2)%
therein:
Europe, C.I.S.,2 Africa, Middle East 4,391 4,392 0%
therein Germany 880 903 (2)%
Americas 4,729 4,815 (2)%
Asia, Australia 3,281 3,419 (4)%
1 Excluding currency translation and portfolio effects. 2 Commonwealth of Independent States.
The Healthcare Sector delivered € 2.027 billion in profit in fiscal 2014, close to the level of the prior year. Results in the current period include burdens on profit from currency effects due to the greater strength of the euro compared to fiscal 2013. These unfavorable effects were strongest at the Sector’s imaging and therapy systems businesses and at Diagnostics, and they more than offset a € 66 million positive effect related to the sale of a particle therapy installation in Marburg, Germany. For compar-ison, Sector profit in fiscal 2013 was burdened by € 80 million in charges associated with the Sector’s “Agenda 2013” initiative.
Despite negative currency effects, profit at Diagnostics rose significantly to € 417 million. For comparison, profit of € 350 mil-lion a year earlier was held back by € 35 million in charges for the Sector’s “Agenda 2013” initiative. Purchase price allocation (PPA) effects related to past acquisitions at Diagnostics were € 163 million in fiscal 2014. A year earlier, Diagnostics recorded € 169 million in PPA effects.
year, the Division recorded € 129 million in charges for the “Siemens 2014” program. Revenue was down 14 % on decreases in all reporting regions, due mainly to selective order intake in prior periods primarily in the solutions business. Order intake was down 2 % year-over-year on decreases in the Americas and Asia, Australia, held back by negative currency translation effects. On an organic basis, orders grew 2 %. Legacy projects are expected to hold back results going forward.
Revenue and orders for Healthcare in fiscal 2014 declined slightly year-over-year. Negative currency translation effects affected reported results for most of the Sector’s businesses, and also reduced reported revenue and orders in Asia, Australia and the Americas compared to fiscal 2013. On a comparable basis, both revenue and orders were up. The book-to-bill ratio was 1.03, and Healthcare’s order backlog was € 4 billion at the end of fiscal 2014. Out of the order backlog as of September 30, 2014, orders of € 3 billion are expected to be converted into rev-enue in fiscal 2015 and the remainder in the periods thereafter.
The Diagnostics business reported revenue of € 3.834 billion in fiscal 2014, a 3 % decrease from € 3.942 billion a year earlier. A clear decline in the Americas was due primarily to headwinds from currency translation as mentioned above. On a compara-ble basis, Diagnostics revenue was up 1 % year-over-year.
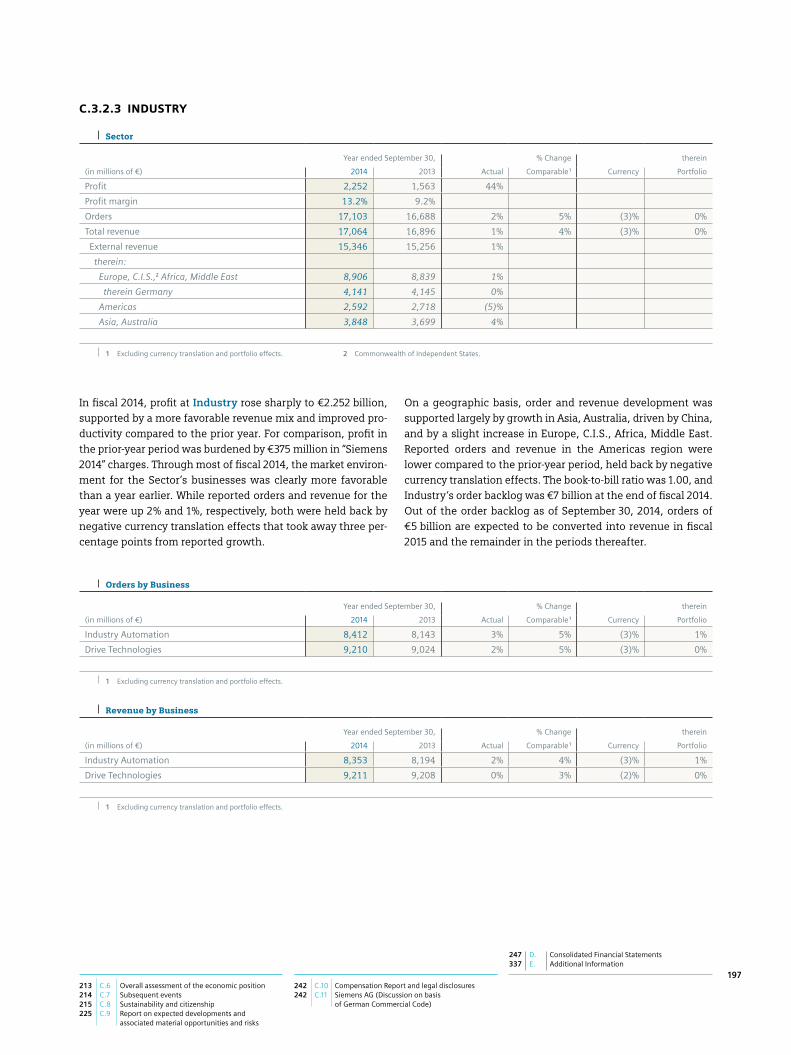
247 D. Consolidated Financial Statements 337 E. Additional Information
213 C.6 Overall assessment of the economic position 214 C.7 Subsequent events 215 C.8 Sustainability and citizenship 225 C.9 Report on expected developments and
associated material opportunities and risks
242 C.10 Compensation Report and legal disclosures 242 C.11 Siemens AG (Discussion on basis
of German Commercial Code)
197
C.3.2.3 INDUSTRY
Sector
Year ended September 30, % Change therein
(in millions of €) 2014 2013 Actual Comparable 1 Currency Portfolio
Profit 2,252 1,563 44%
Profit margin 13.2% 9.2%
Orders 17,103 16,688 2% 5% (3)% 0%
Total revenue 17,064 16,896 1% 4% (3)% 0%
External revenue 15,346 15,256 1%
therein:
Europe, C.I.S.,2 Africa, Middle East 8,906 8,839 1%
therein Germany 4,141 4,145 0%
Americas 2,592 2,718 (5)%
Asia, Australia 3,848 3,699 4%
1 Excluding currency translation and portfolio effects. 2 Commonwealth of Independent States.
In fiscal 2014, profit at Industry rose sharply to € 2.252 billion, supported by a more favorable revenue mix and improved pro-ductivity compared to the prior year. For comparison, profit in the prior-year period was burdened by € 375 million in “Siemens 2014” charges. Through most of fiscal 2014, the market environ-ment for the Sector’s businesses was clearly more favorable than a year earlier. While reported orders and revenue for the year were up 2 % and 1 %, respectively, both were held back by negative currency translation effects that took away three per-centage points from reported growth.
On a geographic basis, order and revenue development was supported largely by growth in Asia, Australia, driven by China, and by a slight increase in Europe, C.I.S., Africa, Middle East. Reported orders and revenue in the Americas region were lower compared to the prior-year period, held back by negative currency translation effects. The book-to-bill ratio was 1.00, and Industry ’s order backlog was € 7 billion at the end of fiscal 2014. Out of the order backlog as of September 30, 2014, orders of € 5 billion are expected to be converted into revenue in fiscal 2015 and the remainder in the periods thereafter.
Orders by Business
Year ended September 30, % Change therein
(in millions of €) 2014 2013 Actual Comparable 1 Currency Portfolio
Industry Automation 8,412 8,143 3% 5% (3)% 1%
Drive Technologies 9,210 9,024 2% 5% (3)% 0%
1 Excluding currency translation and portfolio effects.
Revenue by Business
Year ended September 30, % Change therein
(in millions of €) 2014 2013 Actual Comparable 1 Currency Portfolio
Industry Automation 8,353 8,194 2% 4% (3)% 1%
Drive Technologies 9,211 9,208 0% 3% (2)% 0%
1 Excluding currency translation and portfolio effects.

108 A. To our Shareholders 131 B. Corporate Governance 171 C. Combined Management Report
172 C.1 Business and economic environment 187 C.2 Financial performance system 193 C.3 Results of operations 205 C.4 Financial position 210 C.5 Net assets position
198
Profit and Profit margin by Business
Profit Profit margin
Year ended September 30, Year ended September 30,
(in millions of €) 2014 2013 % Change 2014 2013
Industry Automation 1,401 1,038 35% 16.8% 12.7%
Drive Technologies 843 527 60% 9.1% 5.7%
Profit at Industry Automation increased substantially year-over year to € 1.401 billion on an improved business mix and higher results in all businesses, up from € 1.038 billion in the prior-year period which included € 114 million in “Siemens 2014” charges. Profit development further included higher revenue and lower acquisition-related effects. In particular, PPA effects related to the acquisition of UGS Corp. in fiscal 2007 were € 93 million in the current period compared to € 147 million a year earlier. In addition, the Division recorded PPA effects of € 44 million related to LMS International NV (LMS), acquired in the second quarter of fiscal 2013. For comparison, PPA effects related to LMS in the prior year were € 33 million, while de-ferred revenue adjustments and inventory step-ups totaled € 43 million.
Order and revenue development for the Division was driven mainly by double-digit growth in Asia, Australia, led by China. In addition, order growth of 3 % year-over-year included a mod-erate increase in the Americas. Revenue came in 2 % above the prior year and included a slight increase in Europe, C.I.S.,
Africa, Middle East. Reported revenue in the Americas showed a slight decline due to unfavorable currency translation effects.
Profit at Drive Technologies in fiscal 2014 increased to € 843 million on contributions from most of its businesses. Profit development included a higher share of revenue from the Division’s higher-margin motion control business and an improved cost position. For comparison, profit of € 527 million a year earlier was burdened by € 243 million in “Siemens 2014” charges. Due to unfavorable currency translation effects, reported revenue was level year-over-year while orders grew 2 % on a higher volume of large internal orders from Siemens’ rail business.
On a geographic basis, double-digit order growth in China drove a moderate increase in Asia, Australia while orders in Europe, C.I.S., Africa, Middle East came in slightly above their prior-year level. Revenue was flat in these two reporting regions. Both orders and revenue came in lower in the Americas, held back by unfavorable currency translation effects.
C.3.2.4 INFRASTRUCTURE & CITIES
Sector
Year ended September 30, % Change therein
(in millions of €) 2014 2013 Actual Comparable 1 Currency Portfolio
Profit 1,487 291 >200%
Profit margin 7.9% 1.6%
Orders 21,001 21,894 (4)% (4)% (2)% 2%
Total revenue 18,934 17,879 6% 6% (3)% 3%
External revenue 18,291 17,149 7%
therein:
Europe, C.I.S.,2 Africa, Middle East 11,560 10,494 10%
therein Germany 2,763 2,635 5%
Americas 4,075 4,288 (5)%
Asia, Australia 2,656 2,367 12%
1 Excluding currency translation and portfolio effects. 2 Commonwealth of Independent States.

247 D. Consolidated Financial Statements 337 E. Additional Information
213 C.6 Overall assessment of the economic position 214 C.7 Subsequent events 215 C.8 Sustainability and citizenship 225 C.9 Report on expected developments and
associated material opportunities and risks
242 C.10 Compensation Report and legal disclosures 242 C.11 Siemens AG (Discussion on basis
of German Commercial Code)
199
In fiscal 2014, Infrastructure & Cities executed its projects solidly, improved its productivity, and again won a number of very large infrastructure orders. Profit for the Sector rose to € 1.487 billion and all its Businesses contributed to the increase year-over-year. For comparison, profit of € 291 million in the prior year was impacted by € 468 million in “Siemens 2014” charges as well as project charges including charges of € 270 million related to high-speed trains. Transportation & Logistics, which posted a loss in the prior fiscal year due to the project charges just mentioned and a majority share of the Sec-tor’s “Siemens 2014” charges, delivered a profit of € 440 million in fiscal 2014 and made the strongest contribution to the Sector’s profit improvement year-over-year. Power Grid Solu-tions & Products and Building Technologies improved their prof-its sharply year-over-year, to € 566 million and € 501 million, re-spectively. While both Businesses posted lower revenue, they improved productivity and generated a more favorable revenue mix year-over-year.
Sector revenue in fiscal 2014 rose 6 % compared to the prior fiscal year, due to a double-digit increase at Transportation & Logistics. This business continued to execute large rolling stock projects won in prior periods, and also recorded four quarters of revenue from the acquisition of Invensys Rail which closed during the third quarter of the prior year. Large orders in the current period included a contract worth € 1.6 billion for two driverless subway lines in Saudi Arabia. A year earlier, large orders included among others a contract worth € 3.0 billion for trains and maintenance in the U.K., and as a result fiscal 2014 orders for the Sector came in 4 % lower year-over-year. On a geo-graphic basis, the Sector reported double- digit revenue in-creases in Asia, Australia and Europe, C.I.S, Africa, Middle East, only partly offset by a decline in the Americas. For orders, double- digit increases in the Americas and Asia, Australia were more than offset by a double-digit decline in Europe, C.I.S., Africa, Middle East. On a book-to-bill ratio of 1.11, Infra-structure & Cities’ order backlog rose to € 31 billion at the end of fiscal 2014. Out of the order backlog as of September 30, 2014, orders of € 10 billion are expected to be converted into revenue in fiscal 2015 and the remainder in the periods thereafter.
Orders by Business
Year ended September 30, % Change therein
(in millions of €) 2014 2013 Actual Comparable 1 Currency Portfolio
Transportation & Logistics 9,184 10,040 (9)% (13)% (1)% 5%
Power Grid Solutions & Products 6,481 6,392 1% 6% (5)% 0%
Building Technologies 5,587 5,769 (3)% (1)% (2)% 0%
1 Excluding currency translation and portfolio effects.
Revenue by Business
Year ended September 30, % Change therein
(in millions of €) 2014 2013 Actual Comparable 1 Currency Portfolio
Transportation & Logistics 7,615 6,318 21% 14% (2)% 8%
Power Grid Solutions & Products 6,005 6,102 (2)% 3% (4)% 0%
Building Technologies 5,569 5,754 (3)% (1)% (2)% 0%
1 Excluding currency translation and portfolio effects.
Profit and Profit margin by Business
Profit Profit margin
Year ended September 30, Year ended September 30,
(in millions of €) 2014 2013 % Change 2014 2013
Transportation & Logistics 440 (448) n / a 5.8% (7.1)%
Power Grid Solutions & Products 566 403 41% 9.4% 6.6%
Building Technologies 501 351 43% 9.0% 6.1%
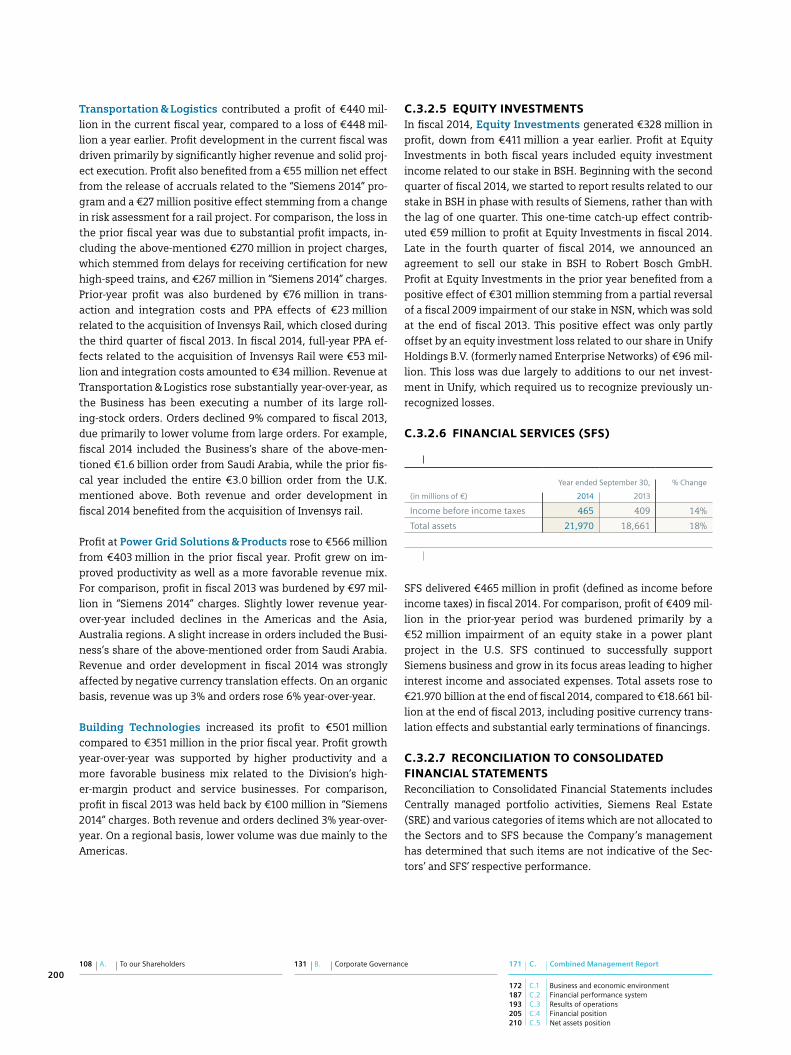
108 A. To our Shareholders 131 B. Corporate Governance 171 C. Combined Management Report
172 C.1 Business and economic environment 187 C.2 Financial performance system 193 C.3 Results of operations 205 C.4 Financial position 210 C.5 Net assets position
200
Transportation & Logistics contributed a profit of € 440 mil-lion in the current fiscal year, compared to a loss of € 448 mil-lion a year earlier. Profit development in the current fiscal was driven primarily by significantly higher revenue and solid proj-ect execution. Profit also benefited from a € 55 million net effect from the release of accruals related to the “Siemens 2014” pro-gram and a € 27 million positive effect stemming from a change in risk assessment for a rail project. For comparison, the loss in the prior fiscal year was due to substantial profit impacts, in-cluding the above-mentioned € 270 million in project charges, which stemmed from delays for receiving certification for new high-speed trains, and € 267 million in “Siemens 2014” charges. Prior-year profit was also burdened by € 76 million in trans-action and integration costs and PPA effects of € 23 million related to the acquisition of Invensys Rail, which closed during the third quarter of fiscal 2013. In fiscal 2014, full-year PPA ef-fects related to the acquisition of Invensys Rail were € 53 mil-lion and integration costs amounted to € 34 million. Revenue at Transportation & Logistics rose substantially year-over-year, as the Business has been executing a number of its large roll-ing-stock orders. Orders declined 9 % compared to fiscal 2013, due primar ily to lower volume from large orders. For example, fiscal 2014 included the Business’s share of the above-men-tioned € 1.6 billion order from Saudi Arabia, while the prior fis-cal year included the entire € 3.0 billion order from the U.K. mentioned above. Both revenue and order development in fiscal 2014 benefited from the acquisition of Invensys rail.
Profit at Power Grid Solutions & Products rose to € 566 million from € 403 million in the prior fiscal year. Profit grew on im-proved productivity as well as a more favorable revenue mix. For comparison, profit in fiscal 2013 was burdened by € 97 mil-lion in “Siemens 2014” charges. Slightly lower revenue year-over-year included declines in the Americas and the Asia, Australia regions. A slight increase in orders included the Busi-ness’s share of the above-mentioned order from Saudi Arabia. Revenue and order development in fiscal 2014 was strongly affected by negative currency translation effects. On an organic basis, revenue was up 3 % and orders rose 6 % year-over-year.
Building Technologies increased its profit to € 501 million compared to € 351 million in the prior fiscal year. Profit growth year-over-year was supported by higher productivity and a more favorable business mix related to the Division’s high-er-margin product and service businesses. For comparison, profit in fiscal 2013 was held back by € 100 million in “Siemens 2014” charges. Both revenue and orders declined 3 % year- over-year. On a regional basis, lower volume was due mainly to the Americas.
C.3.2.5 EQUITY INVESTMENTSIn fiscal 2014, Equity Investments generated € 328 million in profit, down from € 411 million a year earlier. Profit at Equity Investments in both fiscal years included equity investment income related to our stake in BSH. Beginning with the second quarter of fiscal 2014, we started to report results related to our stake in BSH in phase with results of Siemens, rather than with the lag of one quarter. This one-time catch-up effect contrib-uted € 59 million to profit at Equity Investments in fiscal 2014. Late in the fourth quarter of fiscal 2014, we announced an agreement to sell our stake in BSH to Robert Bosch GmbH. Profit at Equity Investments in the prior year benefited from a positive effect of € 301 million stemming from a partial reversal of a fiscal 2009 impairment of our stake in NSN, which was sold at the end of fiscal 2013. This positive effect was only partly offset by an equity investment loss related to our share in Unify Holdings B.V. (formerly named Enterprise Networks) of € 96 mil-lion. This loss was due largely to additions to our net invest-ment in Unify, which required us to recognize previously un-recognized losses.
C.3.2.6 FINANCIAL SERVICES (SFS)
(in millions of €)
Year ended September 30, % Change
2014 2013
Income before income taxes 465 409 14%
Total assets 21,970 18,661 18%
SFS delivered € 465 million in profit (defined as income before income taxes) in fiscal 2014. For comparison, profit of € 409 mil-lion in the prior-year period was burdened primarily by a € 52 million impairment of an equity stake in a power plant project in the U.S. SFS continued to successfully support Siemens business and grow in its focus areas leading to higher interest income and associated expenses. Total assets rose to € 21.970 billion at the end of fiscal 2014, compared to € 18.661 bil-lion at the end of fiscal 2013, including positive currency trans-lation effects and substantial early terminations of financings.
C.3.2.7 RECONCILIATION TO CONSOLIDATED FINANCIAL STATEMENTSReconciliation to Consolidated Financial Statements includes Centrally managed portfolio activities, Siemens Real Estate (SRE) and various categories of items which are not allocated to the Sectors and to SFS because the Company’s management has determined that such items are not indicative of the Sec-tors’ and SFS’ respective performance.

247 D. Consolidated Financial Statements 337 E. Additional Information
213 C.6 Overall assessment of the economic position 214 C.7 Subsequent events 215 C.8 Sustainability and citizenship 225 C.9 Report on expected developments and
associated material opportunities and risks
242 C.10 Compensation Report and legal disclosures 242 C.11 Siemens AG (Discussion on basis
of German Commercial Code)
201
Centrally managed portfolio activitiesCentrally managed portfolio activities reported a profit of € 44 million in fiscal 2014, compared to a loss of € 113 million in fiscal 2013. Results for the prior year included € 100 million in charges related to two large projects remaining from the Metals Technologies business, formerly reported within Industry, that were not classified as discontinued operations.
Siemens Real Estate (SRE)Income before income taxes at SRE was € 241 million in fiscal 2014, compared to € 168 million in fiscal 2013. As in the past, income from SRE continues to be highly dependent on dis-posals of real estate.
Corporate items and pensionsCorporate items and pensions reported a loss of € 938 million in fiscal 2014, compared to a loss of € 836 million in fiscal 2013. Within these figures, the loss at Corporate items was € 545 mil-lion, compared to a loss of € 419 million in fiscal 2013. The
current period included expenses resulting from changes in the fair value of warrants issued together with US $ 3 billion in bonds in fiscal 2012, as well as negative effects related to legal and regulatory matters. The fair value of the warrants depends on the underlying Siemens and OSRAM share prices as well as their respective volatilities. Because this effect is accounted for in Corporate items, results for Corporate items are expected to remain variable in coming periods. Centrally carried pen-sion expense totaled € 393 million in fiscal 2014, compared to € 416 million in fiscal 2013.
Eliminations, Corporate Treasury and other reconciling itemsIncome before income taxes from Eliminations, Corporate Treasury and other reconciling items was a negative € 48 mil-lion in fiscal 2014, compared to a negative € 70 million in the same period a year earlier. The change year-over-year in-cluded higher interest income from liquidity at Corporate Treasury.
C.3.3 Income
Year ended September 30,
(in millions of €) 2014 2013 % Change
Energy 1,569 1,955 (20)%
Healthcare 2,027 2,033 0%
Industry 2,252 1,563 44%
Infrastructure & Cities 1,487 291 >200%
Total Sectors profit 7,335 5,842 26%
Equity Investments 328 411 (20)%
Financial Services (SFS) 465 409 14%
Reconciliation to Consolidated Financial Statements (700) (850) 17%
Income from continuing operations before income taxes 7,427 5,813 28%
Income tax expenses (2,028) (1,634) (24)%
Income from continuing operations 5,400 4,179 29%
Income from discontinued operations, net of income taxes 108 231 (53)%
Net income 5,507 4,409 25%
Net income attributable to non-controlling interests 134 126 –
Net income attributable to shareholders of Siemens AG 5,373 4,284 25%
As a result of the developments described in C.3.2 SEGMENT
INFORMATION ANALYSIS, Income from continuing operations before income taxes increased 28% year-over-year. With a lower effective tax rate compared to fiscal 2013 (27% in fiscal 2014 vs. 28% in fiscal 2013), Income from continuing opera-tions increased 29% year-over-year.
In fiscal 2014, the hospital information system business, for-merly included in the Healthcare Sector, and nearly all of the Metals Technology business, formerly included in the Industry Sector, were classified as discontinued operations. Income from discontinued operations, net of income taxes in fiscal 2014 was €108 million compared to €231 million a year earlier.

108 A. To our Shareholders 131 B. Corporate Governance 171 C. Combined Management Report
172 C.1 Business and economic environment 187 C.2 Financial performance system 193 C.3 Results of operations 205 C.4 Financial position 210 C.5 Net assets position
202
While Income from discontinued operations in the current period benefited from a positive €64 million tax effect related to former Communications activities, the prior year included Income from discontinued operations of €277 million related to OSRAM, which was spun off in the fourth quarter of fiscal 2013.
As a result of the changes in Income from continuing opera-tions and Income from discontinued operations, Net income and Net income attributable to shareholders were 25% higher than a year earlier.
Corresponding basic EPS rose 25% to €6.37 compared to €5.08 in the prior year, primarily reflecting higher Net income attri-butable to shareholders of Siemens AG.
In fiscal 2014, ROCE from continuing operations was 17.2%, thus clearly returning to our target range of 15 to 20%. In fiscal 2013, ROCE from continuing operations was 13.7%. The increase was due primarily to the substantial increase in Income from continuing operations and a slightly lower average capital employed. For more detail on the calculation of ROCE, see
C.2.6.2 RETURN ON CAPITAL EMPLOYED (ROCE).
C.3.4 Reconciliation to adjusted EBITDA
The following table gives additional information on topics included in Profit and Income before income taxes and pro-vides a reconciliation to adjusted EBITDA based on continuing operations.
For the fiscal years ended September 30, 2014 and 2013
Profit Income (loss) from investments accounted
for using the equity method, net
Financial income (expenses), net
Adjusted EBIT Amortization and impairment of other
intangible assets
Depreciation and impairments of
property, plant and equipment and goodwill
Adjusted EBITDA Adjusted EBITDA margin
(in millions of €) 2014 2013 2014 2013 2014 2013 2014 2013 2014 2013 2014 2013 2014 2013 2014 2013
Sectors
Energy Sector 1,569 1,955 129 (39) (41) (27) 1,481 2,022 101 132 406 478 1,988 2,631 8.1% 9.9%
therein: Power Generation 2,186 2,126 32 32 (22) (16) 2,177 2,110 57 68 204 222 2,438 2,399
Wind Power (15) 306 52 (8) (12) (6) (55) 320 31 32 109 103 85 454
Power Transmission (636) (156) 29 20 (10) (10) (655) (167) 14 13 89 114 (552) (39)
Healthcare Sector 2,027 2,033 6 8 23 (19) 1,999 2,045 245 266 308 311 2,551 2,622 20.5% 20.7%
therein: Diagnostics 417 350 – – 25 (27) 392 377 184 196 200 211 776 784
Industry Sector 2,252 1,563 2 (4) 2 (16) 2,248 1,583 242 296 302 342 2,792 2,220 16.4% 13.1%
therein: Industry Automation 1,401 1,038 – – 4 (4) 1,396 1,041 196 240 119 123 1,711 1,404
Drive Technologies 843 527 2 (5) (2) (11) 843 542 45 56 182 219 1,070 817
Infrastructure & Cities Sector 1,487 291 28 26 (17) (14) 1,476 279 127 154 170 226 1,772 658 9.4% 3.7%
therein: Transportation & Logistics 440 (448) 16 18 (12) (7) 435 (459) 65 39 57 99 556 (321)
Power Grid Solutions & Products 566 403 10 8 (3) (6) 560 401 22 57 70 78 652 536
Building Technologies 501 351 2 – (2) – 501 352 40 58 40 46 581 456
Total Sectors 7,335 5,842 165 (10) (33) (75) 7,203 5,928 715 848 1,185 1,356 9,103 8,131
Equity Investments 328 411 297 372 29 23 1 16 – – – – 1 16
Financial Services (SFS) 465 409 66 85 552 389 (153) (64) 5 5 190 225 41 166
Reconciliation to Consolidated Financial Statements
Centrally managed portfolio activities 44 (113) 55 69 (2) (2) (9) (180) 1 2 3 2 (5) (177)
Siemens Real Estate (SRE) 241 168 – – (103) (109) 344 278 1 1 263 307 608 586
Corporate items and pensions (938) (836) (2) – (360) (246) (576) (590) 19 17 59 74 (498) (498)
Eliminations, Corporate Treasury and other reconciling items (48) (70) 1 (6) 35 30 (83) (94) – – (29) (34) (112) (128)
Siemens 7,427 5,813 582 510 118 9 6,728 5,293 741 873 1,670 1,931 9,139 8,097
Beginning with fiscal 2015, we calculate EBITDA without the elimination of income (loss) from investments accounted for using the equity method, net.

247 D. Consolidated Financial Statements 337 E. Additional Information
213 C.6 Overall assessment of the economic position 214 C.7 Subsequent events 215 C.8 Sustainability and citizenship 225 C.9 Report on expected developments and
associated material opportunities and risks
242 C.10 Compensation Report and legal disclosures 242 C.11 Siemens AG (Discussion on basis
of German Commercial Code)
203
C.3.4 Reconciliation to adjusted EBITDA
The following table gives additional information on topics included in Profit and Income before income taxes and pro-vides a reconciliation to adjusted EBITDA based on continuing operations.
For the fiscal years ended September 30, 2014 and 2013
Profit Income (loss) from investments accounted
for using the equity method, net
Financial income (expenses), net
Adjusted EBIT Amortization and impairment of other
intangible assets
Depreciation and impairments of
property, plant and equipment and goodwill
Adjusted EBITDA Adjusted EBITDA margin
(in millions of €) 2014 2013 2014 2013 2014 2013 2014 2013 2014 2013 2014 2013 2014 2013 2014 2013
Sectors
Energy Sector 1,569 1,955 129 (39) (41) (27) 1,481 2,022 101 132 406 478 1,988 2,631 8.1% 9.9%
therein: Power Generation 2,186 2,126 32 32 (22) (16) 2,177 2,110 57 68 204 222 2,438 2,399
Wind Power (15) 306 52 (8) (12) (6) (55) 320 31 32 109 103 85 454
Power Transmission (636) (156) 29 20 (10) (10) (655) (167) 14 13 89 114 (552) (39)
Healthcare Sector 2,027 2,033 6 8 23 (19) 1,999 2,045 245 266 308 311 2,551 2,622 20.5% 20.7%
therein: Diagnostics 417 350 – – 25 (27) 392 377 184 196 200 211 776 784
Industry Sector 2,252 1,563 2 (4) 2 (16) 2,248 1,583 242 296 302 342 2,792 2,220 16.4% 13.1%
therein: Industry Automation 1,401 1,038 – – 4 (4) 1,396 1,041 196 240 119 123 1,711 1,404
Drive Technologies 843 527 2 (5) (2) (11) 843 542 45 56 182 219 1,070 817
Infrastructure & Cities Sector 1,487 291 28 26 (17) (14) 1,476 279 127 154 170 226 1,772 658 9.4% 3.7%
therein: Transportation & Logistics 440 (448) 16 18 (12) (7) 435 (459) 65 39 57 99 556 (321)
Power Grid Solutions & Products 566 403 10 8 (3) (6) 560 401 22 57 70 78 652 536
Building Technologies 501 351 2 – (2) – 501 352 40 58 40 46 581 456
Total Sectors 7,335 5,842 165 (10) (33) (75) 7,203 5,928 715 848 1,185 1,356 9,103 8,131
Equity Investments 328 411 297 372 29 23 1 16 – – – – 1 16
Financial Services (SFS) 465 409 66 85 552 389 (153) (64) 5 5 190 225 41 166
Reconciliation to Consolidated Financial Statements
Centrally managed portfolio activities 44 (113) 55 69 (2) (2) (9) (180) 1 2 3 2 (5) (177)
Siemens Real Estate (SRE) 241 168 – – (103) (109) 344 278 1 1 263 307 608 586
Corporate items and pensions (938) (836) (2) – (360) (246) (576) (590) 19 17 59 74 (498) (498)
Eliminations, Corporate Treasury and other reconciling items (48) (70) 1 (6) 35 30 (83) (94) – – (29) (34) (112) (128)
Siemens 7,427 5,813 582 510 118 9 6,728 5,293 741 873 1,670 1,931 9,139 8,097
Beginning with fiscal 2015, we calculate EBITDA without the elimination of income (loss) from investments accounted for using the equity method, net.

108 A. To our Shareholders 131 B. Corporate Governance 171 C. Combined Management Report
172 C.1 Business and economic environment 187 C.2 Financial performance system 193 C.3 Results of operations 205 C.4 Financial position 210 C.5 Net assets position
204
C.3.5 Selected information based on new organizational structure
In May 2014, we announced a new organizational structure that became effective with the beginning of fiscal 2015. In gen-eral, financial measures presented in this Combined Manage-ment Report are based on our organizational structure during fiscal 2014. In this subchapter, we present selected financial results for fiscal 2014 and fiscal 2013 as they would have looked
if the new organizational structure as of beginning of fiscal year 2015 had already been in place. As described in more detail in C.7 SUBSEQUENT EVENTS, Audiology Solutions, formerly reported within Healthcare, was classified as discontinued op-erations in the first quarter of fiscal 2015. This classification is already reflected in the numbers presented. Profit amounts are reported in accordance with our enhanced definition of seg-ment profit, which is described in more detail in C.2 FINAN-
CIAL PERFORMANCE SYSTEM.
Orders Revenue
Year ended September 30, Year ended September 30,
(in millions of €) 2014 2013 2014 2013
Power and Gas 13,996 15,100 12,720 14,016
Wind Power and Renewables 7,759 6,870 5,567 5,382
Energy Management 11,210 11,405 10,708 11,672
Building Technologies 5,587 5,769 5,569 5,754
Mobility 9,280 9,707 7,249 5,823
Digital Factory 9,233 8,897 9,201 8,950
Process Industries and Drives 9,968 9,695 9,645 9,834
Healthcare 12,126 12,338 11,736 11,983
Industrial business 79,158 79,781 72,396 73,414
Profit Profit margin
Year ended September 30, Year ended September 30,
(in millions of €) 2014 2013 2014 2013
Power and Gas 2,215 2,129 17.4% 15.2%
Wind Power and Renewables 6 7 0.1% 0,1%
Energy Management (86) 254 (0.8)% 2.2%
Building Technologies 511 377 9.2% 6.6%
Mobility 532 (232) 7.3% (4.0)%
Digital Factory 1,681 1,320 18.3% 14.8%
Process Industries and Drives 773 510 8.0% 5.2%
Healthcare 2,072 2,123 17.7% 17.7%
Industrial business 7,703 6,488 10.6% 8.8%
Financial Services 466 410
Reconciliation to Consolidated Financial Statements (862) (1,177)
Income from continuing operations before income taxes 7,306 5,722
Income tax expenses (2,014) (1,652)
Income from continuing operations 5,292 4,070
Income from discontinued operations, net of income taxes 215 340
Net income 5,507 4,409

247 D. Consolidated Financial Statements 337 E. Additional Information
213 C.6 Overall assessment of the economic position 214 C.7 Subsequent events 215 C.8 Sustainability and citizenship 225 C.9 Report on expected developments and
associated material opportunities and risks
242 C.10 Compensation Report and legal disclosures 242 C.11 Siemens AG (Discussion on basis
of German Commercial Code)
205
C.4.1 Principles and objectives of financial management
Siemens is committed to a strong financial profile, which pro-vides the financial flexibility to achieve growth and portfolio optimization goals largely independent of capital market con-ditions.
Financial management at Siemens is executed according to applicable laws and internal guidelines and regulations. It includes the following activities:
LIQUIDITY MANAGEMENTSiemens’ principal source of financing is cash inflows from operating activities. Corporate Treasury generally manages cash and cash equivalents for Siemens and has primary respon-sibility for raising funds in the capital markets for Siemens through various debt products, with the exception of countries with conflicting capital market controls. The relevant consoli-dated subsidiaries in these countries obtain financing primarily from local banks. Siemens follows a prudent borrowing policy that is aimed towards a balanced financing portfolio, a diversi-fied maturity profile and a comfortable liquidity cushion. Espe-cially since the beginning of the global financial markets crisis, Siemens monitors very closely the funding options available in the capital markets, trends in the availability of funds and the cost of such funding in order to evaluate possible strategies regarding its financial and risk profile.
CASH MANAGEMENT Cash management comprises the management of bank partner relationships and bank accounts as well as the execution of payments, including the administration of cash pools, on a global level. Siemens strives to raise efficiency and transpar-ency through a high level of standardization and continuous advancement of payment processes. Where permissible, the execution of intercompany and third party payments is effected centrally through group-wide tools with central controls to en-sure compliance with internal and external guidelines and requirements. To ensure efficient management of Siemens’ funds, Corporate Treasury has established a central cash man-agement approach: to the extent legally and economically fea-sible, funds are pooled and managed centrally by Corporate Treasury. Conversely, funding needs within Siemens are cov-ered centrally by Corporate Treasury via intercompany current accounts and / or loans where legally and economically feasible.
FINANCIAL RISK MANAGEMENT Investments of cash and cash equivalents are subject to credit requirements and counterparty limits. Corporate Treasury pools and centrally manages Siemens’ interest rate exposure as well as certain commodity, currency and credit risk exposures
and uses financial derivative instruments in transactions with external financial institutions to offset such concentrated expo-sures. Especially since the beginning of the global financial market crisis, Siemens monitors very closely the counterparty risk in its financial assets and financial derivative instruments. For more detailed information about financial risk manage-ment at Siemens, see NOTE 31 in D.6 NOTES TO CONSOLIDATED
FINANCIAL STATEMENTS.
MANAGEMENT OF POST-EMPLOYMENT BENEFITSSiemens’ funding policy for post-employment-benefits is part of its overall commitment to sound financial management, which includes a continuous analysis of the structure of its pen-sion liabilities. For more detailed information about Siemens’ pension plan funding, see NOTE 22 in D.6 NOTES TO CON-
SOLIDATED FINANCIAL STATEMENTS.
CAPITAL STRUCTURE MANAGEMENTTo effectively manage Siemens’ capital structure, Siemens seeks to maintain ready access to the capital markets through various debt products and to preserve its ability to repay and service its debt obligations over time.
C.4.2 Capital structure
As of September 30, 2014 and 2013 our capital structure was as follows:
(in millions of €)
September 30, % Change
2014 2013
Total equity attributable to shareholders of Siemens AG 30,954 28,111 10%
As percentage of total capital 60% 58%
Shortterm debt and current maturities of longterm debt 1,620 1,944
Longterm debt 19,326 18,509
Total debt 20,947 20,453 2%
As percentage of total capital 40% 42%
Total capital (total equity and total debt) 51,900 48,564 7%
For information on changes in equity and debt, see C.5 NET
ASSETS POSITION.
We believe that sustainable revenue and profit development is supported by a healthy capital structure. A key consideration of our capital structure management is to maintain ready access to the capital markets through various debt products and to preserve our ability to repay and service our debt obligations
C.4 Financial position
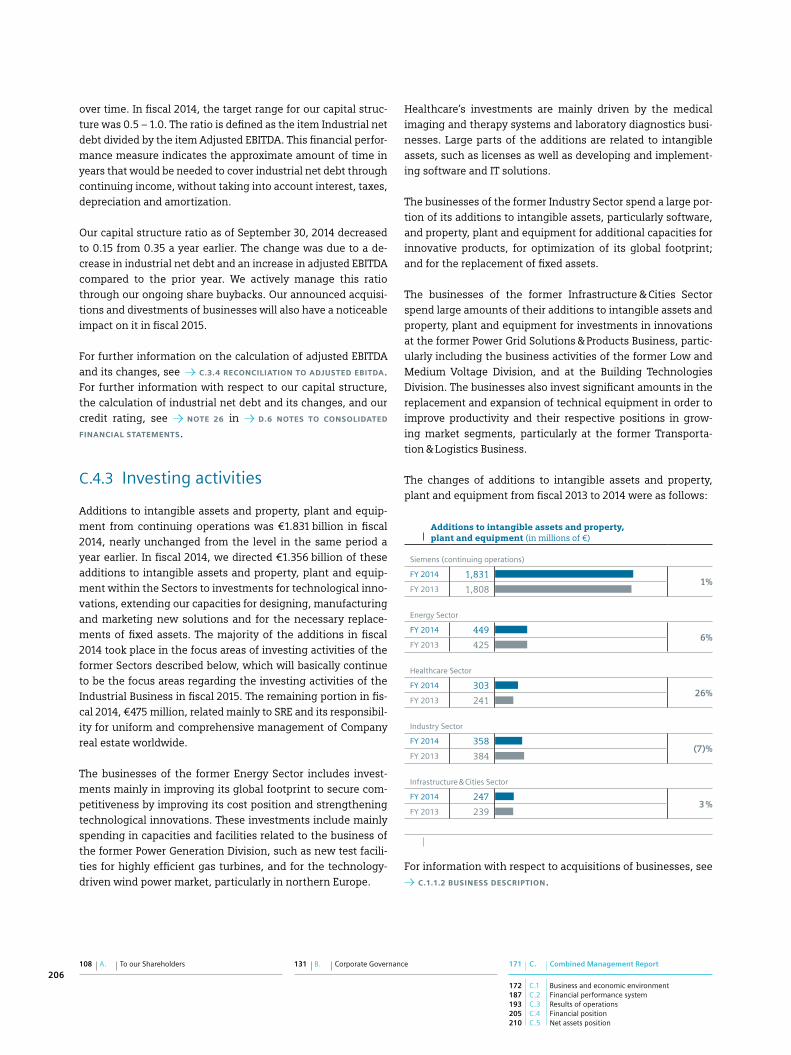
108 A. To our Shareholders 131 B. Corporate Governance 171 C. Combined Management Report
172 C.1 Business and economic environment 187 C.2 Financial performance system 193 C.3 Results of operations 205 C.4 Financial position 210 C.5 Net assets position
206
over time. In fiscal 2014, the target range for our capital struc-ture was 0.5 – 1.0. The ratio is defined as the item Industrial net debt divided by the item Adjusted EBITDA. This financial perfor-mance measure indicates the approximate amount of time in years that would be needed to cover industrial net debt through continuing income, without taking into account interest, taxes, depreciation and amortization.
Our capital structure ratio as of September 30, 2014 decreased to 0.15 from 0.35 a year earlier. The change was due to a de-crease in industrial net debt and an increase in adjusted EBITDA compared to the prior year. We actively manage this ratio through our ongoing share buybacks. Our announced acquisi-tions and divestments of businesses will also have a noticeable impact on it in fiscal 2015.
For further information on the calculation of adjusted EBITDA and its changes, see C.3.4 RECONCILIATION TO ADJUSTED EBITDA. For further information with respect to our capital structure, the calculation of industrial net debt and its changes, and our credit rating, see NOTE 26 in D.6 NOTES TO CONSOLIDATED
FINANCIAL STATEMENTS.
C.4.3 Investing activities
Additions to intangible assets and property, plant and equip-ment from continuing operations was € 1.831 billion in fiscal 2014, nearly unchanged from the level in the same period a year earlier. In fiscal 2014, we directed € 1.356 billion of these additions to intangible assets and property, plant and equip-ment within the Sectors to investments for technological inno-vations, extending our capacities for designing, manufacturing and marketing new solutions and for the necessary replace-ments of fixed assets. The majority of the additions in fiscal 2014 took place in the focus areas of investing activities of the former Sectors described below, which will basically continue to be the focus areas regarding the investing activities of the Industrial Business in fiscal 2015. The remaining portion in fis-cal 2014, € 475 million, related mainly to SRE and its responsibil-ity for uniform and comprehensive management of Company real estate worldwide.
The businesses of the former Energy Sector includes invest-ments mainly in improving its global footprint to secure com-petitiveness by improving its cost position and strengthening technological innovations. These investments include mainly spending in capacities and facilities related to the business of the former Power Generation Division, such as new test facili-ties for highly efficient gas turbines, and for the technology- driven wind power market, particularly in northern Europe.
Healthcare’s investments are mainly driven by the medical imaging and therapy systems and laboratory diagnostics busi-nesses. Large parts of the additions are related to intangible assets, such as licenses as well as developing and implement-ing software and IT solutions.
The businesses of the former Industry Sector spend a large por-tion of its additions to intangible assets, particularly software, and property, plant and equipment for additional capacities for innovative products, for optimization of its global footprint; and for the replacement of fixed assets.
The businesses of the former Infrastructure & Cities Sector spend large amounts of their additions to intangible assets and property, plant and equipment for investments in innovations at the former Power Grid Solutions & Products Business, partic-ularly including the business activities of the former Low and Medium Voltage Division, and at the Building Technologies Division. The businesses also invest significant amounts in the replacement and expansion of technical equipment in order to improve productivity and their respective positions in grow-ing market segments, particularly at the former Transporta-tion & Logistics Business.
The changes of additions to intangible assets and property, plant and equipment from fiscal 2013 to 2014 were as follows:
Additions to intangible assets and property, plant and equipment (in millions of €)
Siemens (continuing operations)
FY 2014 1,8311%
FY 2013 1,808
Energy Sector
FY 2014 4496%
FY 2013 425
Healthcare Sector
FY 2014 30326%
FY 2013 241
Industry Sector
FY 2014 358(7)%
FY 2013 384
Infrastructure & Cities Sector
FY 2014 2473 %
FY 2013 239
For information with respect to acquisitions of businesses, see C.1.1.2 BUSINESS DESCRIPTION.

247 D. Consolidated Financial Statements 337 E. Additional Information
213 C.6 Overall assessment of the economic position 214 C.7 Subsequent events 215 C.8 Sustainability and citizenship 225 C.9 Report on expected developments and
associated material opportunities and risks
242 C.10 Compensation Report and legal disclosures 242 C.11 Siemens AG (Discussion on basis
of German Commercial Code)
207
C.4.4 Cash flows
Cash flows
Continuing operations Discontinued operations Continuing and discontinued operations
Year ended September 30, Year ended September 30, Year ended September 30,
(in millions of €) 2014 2013 2014 2013 2014 2013
Cash flows from:
Operating activities 7,230 7,186 (131) 154 7,100 7,340
Investing activities (4,364) (4,759) 339 (317) (4,026) (5,076)
therein: Additions to intangible assets and property, plant and equipment (1,831) (1,808) (67) (204) (1,898) (2,012)
Free cash flow 5,399 5,378 (198) (50) 5,201 5,328
Financing activities (4,485) (3,715) (2) 319 (4,487) (3,396)
Cash flows from operating activities – Continuing operations provided cash from operating activities of € 7.230 billion in fis-cal 2014, nearly unchanged from the level a year earlier. In both periods, the major component of cash inflows was income from continuing operations, which increased to € 5.400 billion in fiscal 2014 from € 4.179 billion in the prior year. Included therein were amortization, depreciation and impairments of € 2.411 billion in the current period and € 2.804 billion in the prior year. A decrease in operating net working capital led to cash inflows of € 0.1 billion in the current period compared to outflows of € 1.7 billion due to a build-up in operating net work-ing capital a year earlier. The positive change year-over-year in operating net working capital related mainly to Energy, in par-ticular to the Wind Power Division, and to Infrastructure & Cities’ Transportation & Logistics Business. In fiscal 2014 we recorded negative effects related to changes in other assets and liabilities, particularly personnel-related liabilities, compared to positive effects in the prior year. The current period included cash outflows of approximately € 0.5 billion corresponding to charges to income taken for the “Siemens 2014” program, com-pared to € 0.4 billion in such outflows in the prior year.
Discontinued operations used cash of € 131 million in fiscal 2014, compared to cash provided of € 154 million in the prior year, which included significant cash inflows at OSRAM.
Cash flows from investing activities – Cash used in investing activities for continuing operations amounted to € 4.364 billion in fiscal 2014, compared to cash used of € 4.759 billion in the prior year. In the current period, cash outflows from investing activities were due mainly to two factors. Firstly, SFS executed its planned asset growth during fiscal 2014 and we recorded cash outflows totaling € 2.501 billion for a net increase in new business volume at SFS. Secondly, we had additions to intan-gible assets and property, plant and equipment of € 1.831 bil-lion, which related mainly to investments within the Sectors.
For comparison, the prior year included cash outflows from the financing activities at SFS of € 2.175 billion and additions to in-tangible assets and property, plant and equipment of € 1.808 bil-lion. In the prior year, cash outflows for acquisitions of businesses, net of cash acquired, totaled € 2.786 billion. This total included the preliminary purchase price (excluding cash acquired) of € 1.987 billion related to Infrastructure & Cities’ ac-quisition of Invensys Rail, and € 670 million related to Indus-try ’s acquisitions of LMS International NV. Also in the prior year cash inflows from the disposal of investments, intangibles and property, plant and equipment were € 2.462 billion. This total included proceeds of € 1.7 billion relating to the sale of our 50 % stake in NSN and € 0.3 billion relating to the sale of our AtoS convertible bonds.
Discontinued operations provided cash of € 339 million in fiscal 2014, compared to cash used of € 317 million in the prior year. The current period included proceeds (excluding cash sold) of € 0.5 billion related to the sale of the Water Technologies Business Unit.
Free cash flow from continuing and discontinued operations of € 5.201 billion in fiscal 2014 was near the high level of the prior year. On a sequential basis, Free cash flow during fiscal 2014 and fiscal 2013 developed as follows:
Free cash flow (in millions of €) 1
Q4 2014 3,450
Q3 2014 1,048
Q2 2014 1,402
Q1 2014 (699)
Q4 2013 4,336
Q3 2013 1,053
Q2 2013 1,335
Q1 2013 (1,395)
1 Continuing and discontinued operations.

108 A. To our Shareholders 131 B. Corporate Governance 171 C. Combined Management Report
172 C.1 Business and economic environment 187 C.2 Financial performance system 193 C.3 Results of operations 205 C.4 Financial position 210 C.5 Net assets position
208
Cash flows from financing activities – Financing activities for continuing operations used cash of € 4.485 billion in fiscal 2014, compared to cash used of € 3.715 billion a year earlier. In the current period, the major cash outflows were dividends of € 2.533 billion paid (for fiscal 2013) to shareholders of Siemens AG and the repayment of € 1.452 billion in long-term debt. In addition we recorded cash outflows of € 1.066 billion for the purchase of treasury shares under Siemens’ share buyback program and paid interest totaling € 617 million. These cash outflows were partly offset by cash inflows of € 801 million from the change in short-term debt and other financing activities related to the issuance of commercial paper and by proceeds of € 527 million from the issuance of long-term debt, related to a total of US$ 700 million in privately placed floating-rate instru-ments. For comparison, in the prior year we paid dividends of € 2.528 billion (for fiscal 2012) to shareholders of Siemens AG and € 2.927 billion for the repayment of long-term debt. We re-corded € 1.394 billion in cash outflows for the purchase of treas-ury shares and € 479 million for the payment of interest. In the prior year these cash outflows were partly offset by cash inflows from the issuance of long-term debt totaling € 3.772 billion.
C.4.5 Capital resources and requirements
Our capital resources consist of a variety of short- and long-term instruments including debt instruments and credit facili-ties. In addition to cash and cash equivalents and available- for-sale financial assets, liquid resources consist of future cash flows from operating activities.
Our capital requirements include, among others, scheduled debt service, regular capital spending, ongoing cash require-ments from operating and SFS financing activities, dividend payments, pension plan funding, portfolio activities and share buybacks.
DEBT AND CREDIT FACILITIESAs of September 30, 2014 we recorded in total € 18.2 billion in bonds, € 1.7 billion in loans from banks, € 0.9 billion in other financial indebtedness, primarily consisted of US$-commercial paper, and € 0.1 billion in obligations under finance leases.
Below we present the maturity profile of our assignable and term loans and our bonds, issued mainly in Euro and US$ and to a lower extent in £, as of September 30, 2014:
Bonds and loans maturity profile (nominal amounts outstanding in billions of €)
2015 2016 2017 2018 2019 2020 2021 2025 2026 2028 2042 2066
1 The maturity of the hybrid bond depends on the exercise of a call option: the bond is callable by us in September 2016 and thereafter, with a final legal maturity ending in September 2066.
2 We may redeem, at any time, all or some of US$-notes, issued in August 2006, at the early redemption amount (call) according to the conditions of the notes.
In order to optimize the Company’s position with regard to in-terest income and interest expense, and to manage the associ-ated interest rate risk, Corporate Treasury uses derivative finan-cial instruments to comprehensively and actively manage our interest rate risk relative to a benchmark. The interest rate risk relating to SFS is managed separately, considering the term structure of SFS’s financial assets and liabilities.
We have three credit facilities at our disposal for general corpo-rate purposes. The credit facilities as of September 30, 2014 consisted of € 6.8 billion in committed, unused lines of credit.
Further information about our debt and credit facilities, interest rate risk management and the use of financial instruments for hedging purposes is provided in NOTES 21, 30 AND 31 in
D.6 NOTES TO CONSOLIDATED FINANCIAL STATEMENTS.
4.62
2.0
0.3
2.5
1.31.6
0.51.1
0.81.42
1.912.3
1.91
0.4

247 D. Consolidated Financial Statements 337 E. Additional Information
213 C.6 Overall assessment of the economic position 214 C.7 Subsequent events 215 C.8 Sustainability and citizenship 225 C.9 Report on expected developments and
associated material opportunities and risks
242 C.10 Compensation Report and legal disclosures 242 C.11 Siemens AG (Discussion on basis
of German Commercial Code)
209
NET DEBTNet debt results from total debt less total liquidity. Total liquid-ity refers to the liquid financial assets we have available at the end of a reporting period to fund our business operations and pay for near-term obligations. Total liquidity comprises Cash and cash equivalents as well as current Available-for-sale finan-cial assets, as stated in the Consolidated Statements of Finan-cial Position. Management uses the Net debt measure for inter-nal finance management, as well as for external communication with investors, analysts and rating agencies.
(in millions of €)
September 30,
2014 2013
Shortterm debt and current maturities of longterm debt 1,620 1,944
Longterm debt 19,326 18,509
Total debt 20,947 20,453
Cash and cash equivalents (8,013) (9,190)
Availableforsale financial assets (current) (925) (601)
Total liquidity (8,938) (9,790)
Net debt 1 12,008 10,663
1 We typically need a considerable portion of our cash and cash equivalents and our current availableforsale financial assets for purposes other than debt reduction. The deduction of these items from total debt in the calculation of Net debt therefore should not be understood to mean that these items are available exclusively for debt reduction at any given time.
The changes in Net debt from fiscal 2013 to 2014 may also be presented as follows:
Changes in Net debt (in millions of €)
1 In fiscal 2014, cash inflows for the decrease in operating net working capital included cash inflows for inventories less advance payments received of €336 million, for trade and other receivables of €200 million, for trade
payables of €205 million and cash outflows for billings in excess of costs and in estimated earnings on uncompleted contracts and related advances of €657 million.
2 Continuing operations.
3 Included cash flows relating to certain financing activities such as dividends paid and purchase of treasury shares as well as effects without cash flow impact such as from currency translations.
OFF-BALANCE-SHEET COMMITMENTS As of September 30, 2014 and 2013 we recorded € 6.687 billion and € 5.970 billion, respectively, of the undiscounted amount of maximum potential future payments related to guarantees. The increase in these commitments included guarantees related to the disposition of businesses and agreements related to our project businesses. As of September 30, 2014 and 2013 we recorded also € 3.217 billion and € 3.120 billion, respectively, of future payment obligations under non-cancellable operating leases and € 132 million and € 223 million, respectively, for com-mitments to make capital contributions to the equity of various companies.
Further information about these off-balance-sheet commit-ments is provided in NOTE 27 in D.6 NOTES TO CONSOLIDATED
FINANCIAL STATEMENTS.
As of September 30, 2014 and 2013 we recorded also irrevoca-ble loan commitments of € 3.604 billion and € 2.950 billion. A considerable portion of these commitments resulted from
10,663 (83) (7,147) 4,364 4,211 12,008
Net debt as of September 30, 2013
Cash inflows for the decrease in operating net working capital 1
Income and other changes in cash flows from operating activities
Cash flows from investing activities 2
Changes in certain financing activities 3
Net debt as of September 30, 2014
Total cash flows from operating activities 2
asset-based lending transactions, meaning that the respective loans can be drawn only after the borrower has provided suffi-cient collateral. The increase in these commitments year-over-year was due mainly to new business volume at SFS, including positive currency translation effects.
OTHER CAPITAL RESOURCES AND REQUIREMENTSFor information related to the expected payments for dividend and share buybacks, see C.2.5 DIVIDEND AND SHARE BUYBACKS.
For information related to expected cash inflows and outflows in connection with portfolio transactions, see NOTE 4 in
D.6 NOTES TO CONSOLIDATED FINANCIAL STATEMENTS.
With our ability to generate positive operating cash flows, our total liquidity of € 8.9 billion and our € 6.8 billion in unused lines of credit and given our credit ratings at year-end, we believe that we have sufficient flexibility to fund our capital requirements. Also in our opinion, our working capital is sufficient for our present requirements.

108 A. To our Shareholders 131 B. Corporate Governance 171 C. Combined Management Report
172 C.1 Business and economic environment 187 C.2 Financial performance system 193 C.3 Results of operations 205 C.4 Financial position 210 C.5 Net assets position
210
Structure of Consolidated Statements of Financial Position (in millions of €)
Our total assets in fiscal 2014 were influenced by positive cur-rency translation effects of € 2.8 billion, led by the US$. Within total assets of € 104.879 billion, total assets related to SFS increased to € 21.970 billion as of September 30, 2014 from € 18.661 billion a year earlier. Within total liabilities, SFS debt increased to € 18.663 billion from € 15.600 billion a year earlier. Both changes were driven by planned asset growth at SFS during fiscal 2014. SFS assets represented 21 % of Siemens’ total assets as of September 30, 2014, compared to 18 % a year earlier. SFS debt represented 18 % of Siemens total liabilities and equity, compared to 15 % at the end of fiscal 2013.
During fiscal 2014 we classified a number of businesses as held for disposal. These classifications affected a number of line items in our Consolidated Statements of Financial Position, which are noted in the discussion below. The relevant busi-nesses include the following: the Metals Technologies busi-ness formerly within Industry, the Hospital Information System business and Microbiology business formerly within Health-care, and our equity investment stake in BSH.
104,879 101,936
37,868(37%)
35,443(35%)
Total assets
3%
28,625(28%)
Total current liabilities36,598 (35%)
Total noncurrent liabilities36,767 (35%)
Total equity31,514 (30%)
Sep. 30, 2014
Sep. 30, 2013
104,879 101,936
Total liabilities and equity
3%
Sep. 30, 2014
Sep. 30, 2013
54,999(54%)
therein: Total liquidity 8,938 (9%)
Total current assets 48,076 (46%)
46,937 (46%)
Total noncurrent assets56,803 (54%)
9,790 (10%)
(in millions of €)
September 30,
2014 2013
Cash and cash equivalents 8,013 9,190
Availableforsale financial assets 925 601
Trade and other receivables 14,526 14,853
Other current financial assets 3,710 3,250
Inventories 15,100 15,560
Current income tax assets 577 794
Other current assets 1,290 1,297
Assets classified as held for disposal 3,935 1,393
Total current assets 48,076 46,937
Cash and cash equivalents decreased by € 1.177 billion from the prior-year level. For detailed information regarding the change, see C.4.4 CASH FLOWS.
The line items Trade and other receivables and Inventories decreased by € 328 million and € 461 million, respectively, year-over-year. The main factor in the decreases was assets related to the Metals Technologies business, which were classified as held for disposal. These decreases were partly offset by positive currency translation effects.
The line item Other current financial assets increased by € 461 million year-over-year, which included higher loans receiv-ables of SFS.
Assets classified as held for disposal increased by € 2.542 billion due mainly to the classification of assets related to the Metals Technologies business, our stake in BSH and the Hospital Infor-mation System business. This increase was partly offset by a reduction in assets due to the sale of the Water Technologies business.
(in millions of €)
September 30,
2014 2013
Goodwill 17,783 17,883
Other intangible assets 4,560 5,057
Property, plant and equipment 9,638 9,815
Investments accounted for using the equity method 2,127 3,022
Other financial assets 18,416 15,117
Deferred tax assets 3,334 3,234
Other assets 945 872
Total noncurrent assets 56,803 54,999
C.5 Net assets position

247 D. Consolidated Financial Statements 337 E. Additional Information
213 C.6 Overall assessment of the economic position 214 C.7 Subsequent events 215 C.8 Sustainability and citizenship 225 C.9 Report on expected developments and
associated material opportunities and risks
242 C.10 Compensation Report and legal disclosures 242 C.11 Siemens AG (Discussion on basis
of German Commercial Code)
211
Goodwill decreased slightly to € 17.783 billion as of Septem-ber 30, 2014 compared to € 17.883 billion a year earlier. The decrease was mainly related to goodwill in the Metals Techno-logies, Hospital Information System and Microbiology busi-nesses, which were classified as assets classified as held for disposal. This decrease was nearly offset by positive currency translation effects.
Other intangible assets decreased to € 4.560 billion as of Sep-tember 30, 2014, compared to € 5.057 billion a year earlier. The major factor in the decrease was amortization.
Investments accounted for using the equity method decreased by € 894 million year-over-year. The main factor was the classi-fication of our stake in BSH as assets classified as held for dis-posal, partly offset by an investment in the joint venture re-lated to the TurboCare Business Unit within Energy.
The line item Other financial assets increased to € 18.416 billion as of September 30, 2014 compared to € 15.117 billion a year ear-lier. The change was due primarily to higher loans receivable driven by planned asset growth at SFS in fiscal 2014 and also to a minor extent positive currency effects.
(in millions of €)
September 30,
2014 2013
Shortterm debt and current maturities of longterm debt 1,620 1,944
Trade payables 7,594 7,599
Other current financial liabilities 1,717 1,515
Current provisions 4,354 4,485
Current income tax liabilities 1,762 2,151
Other current liabilities 17,954 19,701
Liabilities associated with assets classified as held for disposal 1,597 473
Total current liabilities 36,598 37,868
Short-term debt and current maturities of long-term debt de-creased by € 324 million year-over-year. The main factors in the decrease were the redemption of € 1.0 billion in 5.375 % p.a. instruments and € 400 million in 0.375 % p.a. instruments, partly offset by the issuance of commercial paper.
Other current liabilities decreased to € 17.954 billion as of Sep-tember 30, 2014 from € 19.701 billion a year earlier. The main factors were a decrease in billings in excess of costs and esti-mated earnings on uncompleted contracts and related ad-vances, mainly in Energy and Industry, and, to a lesser extent, lower personnel-related liabilities. The decrease in Industry re-lated primarily to the Metals Technologies business, where lia-bilities were classified as liabilities associated with assets clas-sified as held for disposal.
Liabilities associated with assets classified as held for disposal increased to € 1.597 billion as of September 30, 2014 from € 473 million a year earlier. The main factor in the increase was the above-mentioned classification of liabilities associated within Metals Technologies business.
(in millions of €)
September 30,
2014 2013
Longterm debt 19,326 18,509
Postemployment benefits 9,324 9,265
Deferred tax liabilities 552 504
Provisions 4,071 3,907
Other financial liabilities 1,620 1,184
Other liabilities 1,874 2,074
Total noncurrent liabilities 36,767 35,443
Long-term debt increased by € 817 million as of September 30, 2014, compared to the prior year, due mainly to positive cur-rency translation effects and the issuance of US$ 700 million in privately placed floating-rate instruments.

108 A. To our Shareholders 131 B. Corporate Governance 171 C. Combined Management Report
172 C.1 Business and economic environment 187 C.2 Financial performance system 193 C.3 Results of operations 205 C.4 Financial position 210 C.5 Net assets position
212
As of September 30, 2014, the funded status of our defined ben-efit plans showed an underfunding of € 9.1 billion, unchanged from the prior year. Within these figures, underfunding for pension plans amounted to € 8.5 billion, as of September 30, 2014 and 2013, respectively. An increase in our defined benefit obligation (DBO) by € 2.418 billion mainly resulted from the im-pact of decreasing market interest rates which was offset partly by the effect of a refined determination of the discount rate. At the same time, plan assets increased by € 2.427 billion due mainly to a positive return, primarily driven by fixed-income and equity investments.
(in millions of €)
September 30,
2014 2013
Total equity attributable to shareholders of Siemens AG 30,954 28,111
Equity ratio 30% 28%
Noncontrolling interests 560 514
Total liabilities and equity 104,879 101,936
Total equity attributable to shareholders of Siemens AG in-creased from € 28.111 billion at the end of fiscal 2013 to € 30.954 billion at the end of fiscal 2014. In fiscal 2014, the main factors relating to the increase in total equity attributable to shareholders of Siemens AG were € 5.373 billion in net income attributable to shareholders of Siemens AG and € 825 million in other comprehensive income, net of income taxes. These in-creases were partly offset by dividend payments of € 2.533 bil-lion (paid for fiscal 2013) and the repurchase of 11,331,922 treas ury shares at average costs per share of € 95.27 totaling € 1.080 billion (including incidental transaction charges).
For additional information on our net assets position, see the corresponding notes in D.6 NOTES TO CONSOLIDATED FINANCIAL
STATEMENTS.
247 D. Consolidated Financial Statements 337 E. Additional Information
213 C.6 Overall assessment of the economic position 214 C.7 Subsequent events 215 C.8 Sustainability and citizenship 225 C.9 Report on expected developments and
associated material opportunities and risks
242 C.10 Compensation Report and legal disclosures 242 C.11 Siemens AG (Discussion on basis
of German Commercial Code)
213
We reached most of the goals for fiscal 2014 that we set in our Annual Report for fiscal 2013, particularly including 1 % organic revenue growth and net income and basic EPS (net income) growth of well over 15 % compared to the prior year. We also achieved a return on capital employed (ROCE) in our target range. Among the primary measures of our economic position, only our capital structure ratio was outside the target range, as we kept our capital structure conservative in fiscal 2014.
During the fiscal year, we finished the remaining measures from the “Siemens 2014” program, which helped to increase our cost productivity. Furthermore, we initiated “Vision 2020,” a long-term and comprehensive concept for sustainable value creation. With this concept we aim to achieve profitable growth through greater customer proximity and accelerated innova-tion, while further optimizing our portfolio, streamlining our management structures and processes, and fostering an “owner-ship culture” throughout the Company.
Revenue for fiscal 2014 was € 71.920 billion, a 2 % decline com-pared to the prior fiscal year. Within the change, Infrastruc-ture & Cities and Industry reported higher revenue while Energy and Healthcare reported declines. Overall, the decline was due to negative currency translation effects. On an organic basis, excluding currency translation and portfolio effects, revenue was up 1 % year-over-year, with three Sectors contributing to the increase and only Energy reporting a decline year-over-year. This fulfilled our expectation that organic revenue would remain near the prior-year level in fiscal 2014.
Orders for fiscal 2014 were € 78.350 billion, fulfilling our expec-tation for a book-to-bill ratio above 1, which came in at 1.09. Order development followed the pattern for revenue: while reported orders were 2 % lower year-over-year, organic orders were up 1 % on increases in three of the four Sectors. Energy and Infrastructure & Cities again won large order volumes from major contract wins, demonstrating the trust that customers place in our ability to execute large projects despite setbacks in certain project businesses in recent years. While Energy’s Wind Power Division achieved a strong order increase year-over-year, the volume from large orders at Infrastructure & Cities came in lower than a year earlier, when the Sector won an extraordi-narily large contract worth € 3.0 billion in the U.K.
Total Sectors profit for fiscal 2014 was € 7.335 billion. As ex-pected, this was a substantial increase from € 5.842 billion a year earlier, when the Sectors took € 1.2 billion in charges for the “Siemens 2014” productivity improvement program.
Higher Total Sectors profit was the main driver for growth in net income and basic EPS from net income. These primary
indicators of our economic performance rose 25 % year-over-year to € 5.507 billion and € 6.37, respectively, which clearly fulfilled our forecast for an increase of basic EPS from net income of at least 15 %.
Total Sectors profit margin in fiscal 2014 was 10.0 %, in the mid-dle of our forecast of 9.5 % to 10.5 % given in our Annual Report for fiscal 2013. Infrastructure & Cities and Industry were key drivers in meeting this expectation, as both Sectors showed im-pressive performance improvements in fiscal 2014. Healthcare maintained its profit and profit margin near the high level achieved in the prior fiscal year. In contrast, the performance of the Energy Sector was disappointing. Profit fell significantly and, contrary to our expectation, profit margin also declined year-over-year due mainly to sharply higher project-related charges.
The Sectors’ results regarding adjusted EBITDA margin followed the same pattern. Infrastructure & Cities and Industry increased their EBITDA margins significantly year-over-year, with the for-mer re-entering its target range and the latter approaching the top of its target range. Healthcare again achieved an EBITDA margin above its target corridor. Energy fell even further below its EBITDA margin range than it was in fiscal 2013.
ROCE is a primary measure of our capital efficiency. As we fore-cast in our Annual Report for fiscal 2013, ROCE for continuing operations for fiscal 2014 returned to the target range of 15 % to 20 %. We increased our income compared to a year earlier and decreased our average capital employed slightly year-over-year. As a result, ROCE for continuing operations rose to 17.2 % from 13.7 % in fiscal 2013.
Free cash flow from continuing and discontinued operations for fiscal 2014 came in at € 5.201 billion, 2 % lower than the high level we achieved a year earlier. While cash inflows from oper-ating activities declined moderately year-over-year, we partly offset this change by reducing cash outflows for investments in intangible assets and property, plant and equipment.
Our primary measure for evaluating our capital structure is defined as the ratio of industrial net debt to adjusted EBITDA. Our target for this ratio in fiscal 2014 was 0.5 to 1.0. As the net result of the portfolio measures that we initiated in fiscal 2014 is expected to result in a significant net cash outflow in fiscal 2015, we kept our capital structure in fiscal 2014 more conser-vative. As a result of a combination of sharply lower industrial net debt and clearly higher EBITDA from continuing operations year-over-year the ratio declined to 0.15, down from 0.35 a year earlier. Thus we did not fulfill our forecast for the capital structure ratio, which was to approach the lower end of the target range.
C.6 Overall assessment of the economic position
108 A. To our Shareholders 131 B. Corporate Governance 171 C. Combined Management Report
172 C.1 Business and economic environment 187 C.2 Financial performance system 193 C.3 Results of operations 205 C.4 Financial position 210 C.5 Net assets position
214
Our “Vision 2020” concept mentioned above, which was initi-ated in fiscal 2014, focuses Siemens on profitable growth along the value chain of electrification. During the year we announced a number of portfolio changes for this purpose, including acquisition of two major energy businesses: the Rolls-Royce aero-derivative gas turbine and compressor busi-ness and the Dresser-Rand oil and gas equipment business. We have also announced planned divestments of our hearing aid business and our stake in the home appliance business BSH. To streamline our processes, we reduced layers of management by eliminating the Sector structure and reducing the number of our Divisions, effective with the beginning of fiscal 2015. We also streamlined our regional go-to-market structure, with a smaller number of entities that have greater ability to penetrate
attractive geographic markets and get closer to our customers. With regard to innovation, we expect to intensify R & D activi-ties e.g. to shorten product development cycles and increase our application of new technologies, such as data analytics. To better balance risks and rewards when we take on innovative projects, we intend to explicitly rely on our so-called corporate memory as an early-warning system that takes advantage of the experience and expertise we already possess.
We intend to continue providing an attractive return to share-holders. As in the past, we intend to fund the dividend payout from Free cash flow. The Siemens Managing Board, in agree-ment with the Supervisory Board, proposes a dividend of € 3.30 per share, up from € 3.00 a year earlier.
In November 2014, we announced the sale of our hearing aid business to the investment company EQT and the German entre preneurial family Strüngmann as co-investors. The trans-action volume is € 2.15 billion plus an earn-out component and includes that the new owners will also be allowed to continue using the Siemens product brand for the hearing aid business over the medium term. The hearing aid business so far rep-resents a Business Unit within Healthcare. The transaction is subject to approval by the regulatory authorities. Closing is expected in the first quarter of calendar year 2015. The hearing aid business is presented as held for disposal and discontinued operations since the first quarter of fiscal 2015.
C.7 Subsequent events

247 D. Consolidated Financial Statements 337 E. Additional Information
213 C.6 Overall assessment of the economic position 214 C.7 Subsequent events 215 C.8 Sustainability and citizenship 225 C.9 Report on expected developments and
associated material opportunities and risks
242 C.10 Compensation Report and legal disclosures 242 C.11 Siemens AG (Discussion on basis
of German Commercial Code)
215
C.8.1 Sustainability at Siemens
C.8.1.1 OVERVIEWSiemens has defined sustainability to mean achieving profit-able and long-term growth, acting responsibly on behalf of future generations and to keep the three dimensions of sus-tainability – people, planet, profit – in balance. We are aware of the associated high standards and the possibility of conflicting goals. Nevertheless, we are convinced that sustainability, especially in the sense of resource efficiency is a business opportunity, and worth seizing.
Sustainability is a guiding principle within our Company, incor-porated in our philosophy, central theme of our corporate strat-egy, and integral part of the Siemens Management model. In our Sustainability activities we focus on three areas: “Sustain-able business practices,” “Contribution to our customers’ com-petiveness,” and “Contribution to sustainable development of societies” in order to achieve sustainable progress for Siemens, its customers and societies.
> “Sustainable business practices” comprises our commitment to embedding sustainability throughout our organization and operations. We want to be a role model ourselves and walk the talk across all areas of the Company covering oper-ational businesses, countries, and corporate functions.
> The second area means that we contribute to our customers’ competitiveness with our products, solutions and services and enable them to increase energy efficiency, save re-sources and reduce carbon emissions at a significant cost advantage.
> Siemens contributes to the sustainable development of soci-eties with its innovative products and solutions, local opera-tions, thought leadership and the fostering of long-term relationships with local communities through Corporate Citizenship projects with partners.
C.8.1.2 SUSTAINABILITY MANAGEMENT AND ORGANIZATIONThe importance we attach to the topic of sustainability is evi-dent in its central position within the Company ’s organization and in our programs and the measures we execute. Efficient sustainability management is a company-wide task that requires a clear organizational structure and a thorough anchoring of sustainability in our corporate culture. All our sustainability ac-tivities are steered by the Chief Sustainability Officer, who is a member of our Managing Board. In order to coordinate and manage our sustainability activities efficiently, we established the Siemens Sustainability Board, the Sustainability Office and the Siemens Sustainability Advisory Board.
The Siemens Sustainability Board, which is chaired by the Chief Sustainability Officer, is the central steering committee for sustainability at Siemens. In its regular meetings it directs our sustainability activities as part of our sustainable strategy and adopts appropriate measures and initiatives. Our Chief Sus-tainability Officer also manages the Sustainability Office, which is responsible for driving sustainability further within Siemens and for coordinating the sustainability activities and other company-wide programs and measures.
To help us maintain an objective perspective on our sustain-ability challenges and performance, we have also created the Siemens Sustainability Advisory Board, composed of eight eminent figures in science and industry from a range of disci-plines and regions of the world. None are employees of Siemens. Furthermore, a network of assigned Sustainability Managers in the businesses and regional units ensure that sus-tainability measures are implemented and multiplied through-out the Company.
C.8.1.3 COLLABORATING FOR SUSTAINABILITY Our sustainability efforts are based on our Business Conduct Guidelines, which provide the ethical and legal framework within which we conduct our business activities. They contain the basic principles and rules for our conduct internally and externally. Specific issues, such as those relating to the environ-ment, are covered in more detailed regulations and guidelines. The Business Conduct Guidelines are binding for all companies controlled by Siemens.
Furthermore, we believe that close collaboration with stake-holders supports us in addressing complex, interlocking sus-tainability challenges and topics. Maintaining an intensive dia-logue with partners along the supply chain and with external stakeholder groups and organizations is important for us: Siemens is actively engaged with leading global sustainability organizations, such as the World Business Council for Sustain-able Development (WBCSD) and the World Resources Institute (WRI). We also liaise regularly with a broad group of stakehold-ers on key sustainability issues, track their most material topics and use them as guide for our activities.
In addition, we are committed to international standards and guidelines for sustainability. For example, we signed on to the United Nations Global Compact in 2003 and became a signatory to the Global Compact’s CEO Water Mandate in 2008; since fiscal 2011, we are a member of the steering committee of the Global Compact’s “Caring for Climate” initiative. We regularly report on our sustainability performance using the guidelines (G3.0) of the Global Reporting Initiative (GRI), which aim at high transpar-ency and comparability for corporate sustainability reporting.
C.8 Sustainability and citizenship
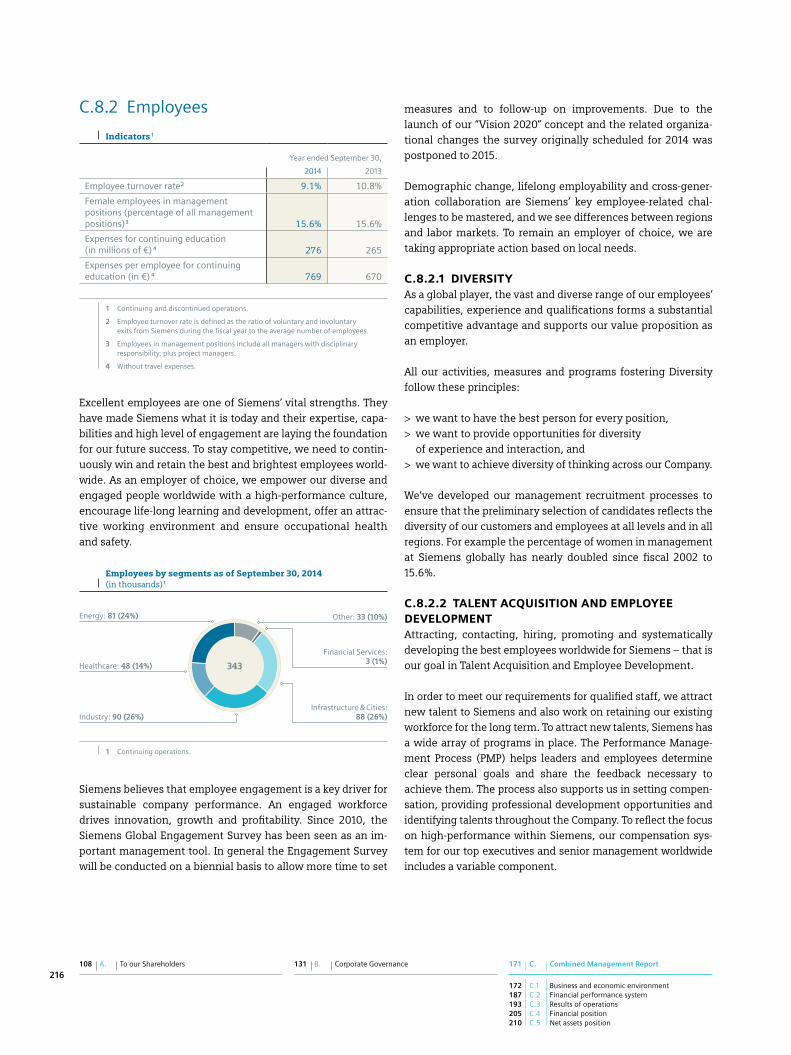
108 A. To our Shareholders 131 B. Corporate Governance 171 C. Combined Management Report
172 C.1 Business and economic environment 187 C.2 Financial performance system 193 C.3 Results of operations 205 C.4 Financial position 210 C.5 Net assets position
216
C.8.2 Employees
Indicators 1
Year ended September 30,
2014 2013
Employee turnover rate 2 9.1% 10.8%
Female employees in management positions (percentage of all management positions) 3 15.6% 15.6%
Expenses for continuing education (in millions of €) 4 276 265
Expenses per employee for continuing education (in €) 4 769 670
1 Continuing and discontinued operations.
2 Employee turnover rate is defined as the ratio of voluntary and involuntary exits from Siemens during the fiscal year to the average number of employees.
3 Employees in management positions include all managers with disciplinary responsibility, plus project managers.
4 Without travel expenses.
Excellent employees are one of Siemens’ vital strengths. They have made Siemens what it is today and their expertise, capa-bilities and high level of engagement are laying the foundation for our future success. To stay competitive, we need to contin-uously win and retain the best and brightest employees world-wide. As an employer of choice, we empower our diverse and engaged people worldwide with a high-performance culture, encourage life-long learning and development, offer an attrac-tive working environment and ensure occupational health and safety.
Employees by segments as of September 30, 2014 (in thousands) 1
Energy: 81 (24%)
Healthcare: 48 (14%)
Industry: 90 (26%)
Financial Services: 3 (1%)
Other: 33 (10%)
Infrastructure & Cities: 88 (26%)
343
1 Continuing operations.
Siemens believes that employee engagement is a key driver for sustainable company performance. An engaged workforce drives innovation, growth and profitability. Since 2010, the Siemens Global Engagement Survey has been seen as an im-portant management tool. In general the Engagement Survey will be conducted on a biennial basis to allow more time to set
measures and to follow-up on improvements. Due to the launch of our “Vision 2020” concept and the related organiza-tional changes the survey originally scheduled for 2014 was postponed to 2015.
Demographic change, lifelong employability and cross-gener-ation collaboration are Siemens’ key employee-related chal-lenges to be mastered, and we see differences between regions and labor markets. To remain an employer of choice, we are taking appropriate action based on local needs.
C.8.2.1 DIVERSITYAs a global player, the vast and diverse range of our employees’ capabilities, experience and qualifications forms a substantial competitive advantage and supports our value proposition as an employer.
All our activities, measures and programs fostering Diversity follow these principles:
> we want to have the best person for every position, > we want to provide opportunities for diversity of experience and interaction, and
> we want to achieve diversity of thinking across our Company.
We’ve developed our management recruitment processes to ensure that the preliminary selection of candidates reflects the diversity of our customers and employees at all levels and in all regions. For example the percentage of women in management at Siemens globally has nearly doubled since fiscal 2002 to 15.6 %.
C.8.2.2 TALENT ACQUISITION AND EMPLOYEE DEVELOPMENTAttracting, contacting, hiring, promoting and systematically developing the best employees worldwide for Siemens – that is our goal in Talent Acquisition and Employee Development.
In order to meet our requirements for qualified staff, we attract new talent to Siemens and also work on retaining our existing workforce for the long term. To attract new talents, Siemens has a wide array of programs in place. The Performance Manage-ment Process (PMP) helps leaders and employees determine clear personal goals and share the feedback necessary to achieve them. The process also supports us in setting compen-sation, providing professional development opportunities and identifying talents throughout the Company. To reflect the focus on high-performance within Siemens, our compensation sys-tem for our top executives and senior management worldwide includes a variable component.
247 D. Consolidated Financial Statements 337 E. Additional Information
213 C.6 Overall assessment of the economic position 214 C.7 Subsequent events 215 C.8 Sustainability and citizenship 225 C.9 Report on expected developments and
associated material opportunities and risks
242 C.10 Compensation Report and legal disclosures 242 C.11 Siemens AG (Discussion on basis
of German Commercial Code)
217
employees – which already apply worldwide and are firmly anchored in our Business Conduct Guidelines. Underscoring this commitment, Siemens, the Siemens Central Works Coun-cil, the German trade union IG Metall and the global industrial union IndustriAll have signed an international framework agreement on the principles of corporate responsibility.
C.8.2.6 OCCUPATIONAL SAFETY AND HEALTH MANAGEMENTOccupational safety and health management are key elements of our Company’s sustainable strategy and an integral part of our business processes. We therefore develop central programs and processes that are applied locally and adapted to the respec-tive business needs. Occupational safety and health manage-ment are an integral part of our Business Conduct Guidelines, our internal monitoring systems, and our risk management and internal controls. In addition, occupational safety is part of an international framework agreement between Siemens AG, the Central Works Council of Siemens AG, IG Metall and the global union IndustriAll.
Promote a culture of safety – In the past, occupational safety was often characterized by a focus on technical protective measures, an approach which achieved considerable success. We are convinced, however, that further improvement can be achieved only through an actively practiced occupational safety culture and optimal working conditions – in every coun-try and for all Siemens employees as well as those of our con-tractors. Both, as a company and as individuals, we are respon-sible for ensuring that the working environment at Siemens is safe at all times and for every employee. At present, local man-agement systems and best practices exist which we can build on. We will achieve sustainability, however, only through a global and consistent approach.
Our customers, suppliers and regulatory authorities expect high safety standards from us. Safe behavior is governed not only by complying with laws, regulations and procedures, but also by the personal values of managers and employees. Our “Zero Harm Culture @ Siemens” program, which has been launched in fiscal 2012 is having an increasingly positive impact. It contains three principles:
> Zero incidents – it is achievable. > Health and safety – no compromises! > We take care of each other!
In addition to this global approach of “Zero Harm Culture @ Siemens,” our businesses and countries themselves improve safety locally through various activities depending on the cur-rent safety performance and the business needs. Management attention is of utmost importance to foster and improve safety.
C.8.2.3 LEARNING AND CONTINUING EDUCATIONWe encourage our employees at all locations to develop their qualifications and expertise. In fiscal 2014, we invested around € 276 million for continuing education (without travel ex-penses), which equals about € 769 per employee. The expenses include courses and training programs both for individual em-ployees and for entire company units.
Siemens Learning Campus and Siemens Leadership Excellence, two corporate-level organizations, are responsible for imple-menting the global learning portfolio: Siemens Learning Campus offers regional learning opportunities to employees in all countries, ranging from courses for employees and manag-ers, through tailored training programs and services for groups, to solutions for entire organizations. Additionally Siemens Leadership Excellence (SLE) is addressing our current and future senior and top leaders. Siemens continues to be one of Germany’s largest providers of professional education for sec-ondary school graduates (7,100 places for Siemens trainees and 2,800 places for trainees from other companies). As in previous years, we again made 10 % of our trainee positions available to disadvantaged youths.
C.8.2.4 SIEMENS EQUITY CULTURESiemens established its first employee share program in Germany as early as 1969. Building on this successful program in Germany, Siemens decided in 2008 to extend employee and management participation. Today, Siemens offers approxi-mately 97 % of its employees in 60 countries the opportunity to acquire Siemens shares with the Company’s financial support. The Share Matching Plan is based on a simple principle: Em-ployees participating in the plan will receive one Siemens share without payment of consideration (matching share) for every three Siemens shares bought and continuously held over a period of three years. Only condition: The employee still needs to be employed by Siemens. The main idea of the plan has always been to make stock ownership available to employees at all income levels.
We are convinced that empowering employees with shares motivates them to assume greater responsibilities and helps them identify more closely with the company they work for – a fundamental prerequisite for the sustainable development of Siemens.
C.8.2.5 EMPLOYEE RIGHTS AND RELATIONS TO EMPLOYEE REPRESENTATIVESFair-minded collaboration among Company management, em-ployees and employee representatives plays a central role at Siemens. As one of the largest corporate employers in Germany and worldwide, we are committed to our social responsibil-ity and respect and uphold the fundamental rights of our

108 A. To our Shareholders 131 B. Corporate Governance 171 C. Combined Management Report
172 C.1 Business and economic environment 187 C.2 Financial performance system 193 C.3 Results of operations 205 C.4 Financial position 210 C.5 Net assets position
218
Therefore, the responsible CEO of the affected unit shows com-mitment by personally reporting every work related fatality, its cause and the measures taken to the Siemens Managing Board.
In fiscal 2014 the overall number of fatalities was lower than in fiscal 2013. We attribute this to the numerous and rigorous actions and specific initiated projects. An implemented process for the assessment of suppliers is supporting these activities. Furthermore, Supply Chain Management and Business have developed collaborative plans to improve the EHS profile of suppliers. Regrettably, we report seven fatalities. Of that three fatalities are with contractors (all are work-related fatalities) and four with Siemens employees (one business trip fatality and three commuting accidents). In the previous year, there were five fatalities involving Siemens employees and ten in-volving contractors.
Promoting health – Siemens has established a high standard of occupational health and safety to avoid work-related health risks and promote employees’ health. We help our employees assume responsibility for their own personal behavior in health-related matters, and support health-promoting general conditions within the Company. We promote the physical, mental and social well-being of our employees through a range of activities governing the five topics of healthy work environ-ment, psychosocial well-being, physical activity, healthy nutri-tion and medical care.
C.8.3 Research and development
C.8.3.1 RESEARCH AND DEVELOPMENT – ORGANIZATION AND STRATEGYIn fiscal 2014, we continued to focus on the following areas in research and development (R & D):
> ensuring long-term future viability, > enhancing technological competitiveness, and > optimizing the allocation of R & D resources.
Our R & D activities are geared toward ensuring economically sustainable energy supplies and developing software solutions, which are essential to maintaining the long-term competitive-ness of our businesses. Accordingly, major focus areas include:
> increasing the efficiency of renewable and conventional en-ergy sources for power generation and improving low-loss electricity transmission systems,
> developing new solutions for smart grids and technologies for storing energy from fluctuating renewable sources,
> further development of industrial software to accelerate pro-cesses at every point along the value chain,
> using smart analytical systems and our domain expertise to develop new services from previously unstructured data (Examples of such services include anticipatory maintenance work and cost-efficient warehousing offers.), and
> making medical imaging, in-vitro diagnostics, and health-care IT an integral part of outcome oriented treatment plans.
Another major focus is promoting more efficient energy use in buildings, industrial facilities, and the transport sector. Exam-ples include the development of electric drives and mass trans-portation systems such as local and long-distance trains and subways.
Across all focus areas, we recognize the vital importance of sophisticated software solutions. This is true not just for the areas mentioned above but also in nearly all of the other fields in which Siemens is active.
R & D activities are carried out by the businesses of our former Sectors and our Corporate Technology (CT) department. CT is a worldwide network with primary locations in Germany, the U.S., China, Russia, India, and Austria. The more than 7,400 CT employees contribute their in-depth understanding of funda-mental technologies, models, and trends, as well as their wealth of software and process expertise. The businesses focus their R & D efforts on the next generations of their products and solutions. In contrast, the aim of CT is to work with our operat-ing units to develop the Group’s technology and innovation strategies, especially for the next generation of their products and solutions. In addition, CT strives to secure the technologi-cal and innovative future through commonly developed core technology initiatives such as future of automation, data to business or system integration. With its global network of ex-perts, our corporate research unit serves as a strategic partner for Siemens’ operating units. CT makes important contributions along the entire value chain, from research and development to production technology, manufacturing processes, and the testing of products and solutions. All of CT’s activities are cho-sen to optimize the allocation of R & D resources, with a balance between support the current offerings of our businesses and development of longer-term opportunities.
CT is also networked with leading universities and research institutes worldwide. Close collaborative approaches with such partners are also a substantial part of our Open Innovation (OI) concept, in which we receive input from internal as well as external experts that significantly contributes to the innovative power of the Company. With OI we aim to overcome the bar-riers of silo thinking, to prove and truly leverage the potential of an open network enterprise.

247 D. Consolidated Financial Statements 337 E. Additional Information
213 C.6 Overall assessment of the economic position 214 C.7 Subsequent events 215 C.8 Sustainability and citizenship 225 C.9 Report on expected developments and
associated material opportunities and risks
242 C.10 Compensation Report and legal disclosures 242 C.11 Siemens AG (Discussion on basis
of German Commercial Code)
219
In addition, Siemens takes part in publicly funded research pro-grams. The most important research areas include the develop-ment of sustainable technologies including recycling, the com-munication of machines, the creation of new materials and bio-technology.
CT offers extensive process and production consulting services for development and manufacturing units at Siemens. CT em-ploys more than 4,200 software developers at locations in Asia, Europe, and the Americas. These specialists help our Business Units develop concepts from the initial idea to the finished product. In addition, CT strategically handles the intellectual property of Siemens. Around 440 experts help the Company register patents and trademarks, establish them, and put them to profitable use.
C.8.3.2 RESEARCH AND DEVELOPMENT FIGURESIn fiscal 2014, we reported research and development expenses of € 4.065 billion, compared to € 4.048 billion in fiscal 2013. The resulting R & D intensity, defined as the ratio of R & D expenses and revenue, was 5.7 %, above the R & D intensity in fiscal 2013.
R&D intensity
Research and development expenses (in billions of €)
Research and development
intensity 1
FY 2014 4.065 5.7%
FY 2013 4.048 5.5%
1 R&D intensity is defined as the ratio of R&D expenses and revenue.
R & D expenses and intensity for the Sectors in fiscal 2014 and 2013:
R&D expenses
Year ended September 30,
(in millions of €) 2014 2013
Energy 873 872
Healthcare 1,010 1,048
Industry 1,229 1,204
Infrastructure & Cities 719 731
R&D intensity
Year ended September 30,
2014 2013
Energy 3.5% 3.3%
Healthcare 8.1% 8.3%
Industry 7.2% 7.1%
Infrastructure & Cities 3.8% 4.1%
CT incurred additional R & D expenses.
R&D indicators 1
Year ended September 30,
(in thousands) 2014 2013
Employees 2 28.8 28.1
Inventions 3 8.6 8.3
Patent first filings 4 4.3 4.0
1 Continuing operations.
2 Average number of employees in fiscal year.
3 Number of inventions reported by the Business Units in an internal report.
4 First filings as part of inventions submitted to patent offices.
As of September 30, 2014, Siemens held approximately 56,100 granted patents worldwide in its continuing operations. As of September 30, 2013, it held approximately 56,000 granted pat-ents. In terms of the number of published patent applications in calendar year 2013, Siemens ranked fourth in Germany and second in Europe. Siemens was also ranked thirteenth in the statistics for patents issued in the U.S. in calendar year 2013.
Rank in patent office statistics
2013 2012
Germany – German Patent and Trade Mark Office (DPMA) 4 3
Europe – European Patent Office (EPO) 2 2
U.S. – United States Patent and Trademark Office (US PTO) 13 11
In our continuing operations, we had an average of approxi-mately 13,200 R & D employees in Germany and approximately 15,600 employees in approximately 30 other countries during fiscal 2014.
C.8.3.3 RESEARCH AND DEVELOPMENT IN OUR BUSINESSESThe R & D activities of the businesses in our former Energy Sector are focused on developing methods for the efficient generation and transmission of electrical energy, including advanced gas turbines that increase the efficiency and reduce emissions of power plants, combined cycle power plants, to increase the availability of electricity through higher flexibility and efficient and reliable power supply for decentralized struc-tures such as those in the oil and gas industries, innovations for reducing the cost of wind turbines, innovations for increas-ing the efficiency of wind turbines (offshore and onshore), the development of an HVDC super grid and the development of a subsea power grid to make deep-sea oil and gas extraction more profitable.
108 A. To our Shareholders 131 B. Corporate Governance 171 C. Combined Management Report
172 C.1 Business and economic environment 187 C.2 Financial performance system 193 C.3 Results of operations 205 C.4 Financial position 210 C.5 Net assets position
220
The R & D activities in the businesses of our former Healthcare Sector are focused on meeting customer requirements, which are the result of two major trends: the world’s population con-tinues to grow steadily and to get older. These trends increase the pressure on healthcare providers to treat more and more people at increasingly lower costs in order to stabilize rising healthcare expenditures. To overcome the challenges of mak-ing healthcare more efficient and more effective, the health-care measures have to focus on the individual patient and the success of the treatment.
One of the R & D fields involves the development of systems that help physicians make precise diagnoses of large numbers of patients and are also robust, easy to use, and inexpensive to purchase and maintain. Examples include interventional radiol-ogy or catheter labs. Ultrasound with wireless transducers is also ideally suited for minimally-invasive procedures such as nerve blockades, access to blood vessels, and positioning for therapeutic interventions and biopsies.
Another focus area is automating clinical work processes and optimizing laboratory diagnostics, with a goal of enabling physi-cians to identify diseases more precisely and at an earlier stage. Physicians are then able to monitor the effect of medications more accurately and benefit from the evaluation and analytical capabilities of modern computer technology. As a result, thera-pies can be tailored more closely to a patient’s needs. Healthcare also develops products that meet the specific, targeted require-ments of the healthcare systems of emerging countries.
One of the R & D priorities of the businesses in our former Industry Sector is the software-based integration of product development, production planning, production processes and services within the framework of product lifecycle manage-ment. The objective is to accelerate processes at every point along the value chain. Innovative technologies can cut the time from design to market in the manufacturing industry by up to 50 %. The further development of automation and drive tech-nology, and industrial software in particular, plays a major role here. This applies to the product development and production process as well as to the integration of the drive system. More-over, the businesses of the former Industry Sector are striving to achieve greater energy efficiency, reduce raw material con-sumption, and lower emissions. These objectives also guide the development of technology-based service concepts such as energy management and remote maintenance systems.
R & D activities of the businesses in our former Infrastruc-ture & Cities Sector focus on urban growth issues. Main research fields therefore cover sustainable technologies for major metro-politan areas and their infrastructures. The main aims are to in-crease energy efficiency, reduce burdens on the environment,
increase cost-effectiveness, and improve the quality of life in cities. To this end, the businesses develop building technologies that conserve energy, solutions for ensuring an efficient and secure supply of electricity in cities, and intelligent traffic and transport systems. In addition, researchers are looking for ways to integrate buildings into smart grids. Through such integration, the buildings can feed the electricity they produce into the grids and provide additional power during times of peak demand.
C.8.4 Supply chain management
The principal goal of supply chain management (SCM) at Siemens is to ensure the availability and quality of the materi-als we require to serve our customers also considering innova-tion strength and sustainability of our suppliers. We aim to strengthen our competitiveness by achieving substantial sav-ings in our purchasing volume. In fiscal 2014, Siemens’ pur-chasing volume amounted to approximately € 37 billion, which equaled roughly half of our total revenue. Our primary strate-gies for achieving savings in purchasing include:
> Siemens-wide managed volume, > Sourcing from emerging markets, and > E-sourcing.
The successful restructuring of our SCM function since the end of fiscal 2013 led to a substantial decrease of the cost for the SCM organization, driven by optimizing towards a less complex setup and process improvements. Going forward, we will con-tinue with reshaping the SCM function in alignment with Vision 2020 to support the new Siemens organization structure overall.
We also continue to strengthen Siemens’ innovation power by benefiting from the innovative strength in our supplier net-work. In May 2014, we held our “1st Siemens Supplier Innova-tion Day,” the first event of its kind on Siemens corporate level. With this event, we established a platform for regular dialogue with our top innovative suppliers at the CEO level. With this dialogue, we aim to increase our innovation capabilities, realize shared growth potential and ensure long-term cost leadership.
Sustainability requirements – as a guiding principle for our supply chain management – are an integral part of all relevant supplier management processes – such as supplier selection, supplier qualification and evaluation, and supplier develop-ment. We require all of our suppliers to comply with the princi-ples of our Code of Conduct for Siemens Suppliers, which in-clude, besides others, respect for the basic rights of employees, strong safety & health and environmental protection standards as well as zero-tolerance on corruption & bribery. We also re-quire them to support its implementation in their own supply

247 D. Consolidated Financial Statements 337 E. Additional Information
213 C.6 Overall assessment of the economic position 214 C.7 Subsequent events 215 C.8 Sustainability and citizenship 225 C.9 Report on expected developments and
associated material opportunities and risks
242 C.10 Compensation Report and legal disclosures 242 C.11 Siemens AG (Discussion on basis
of German Commercial Code)
221
chains. We have established and continually further develop a risk-based system of appropriate processes to enable us to systematically identify potential risks in our supply chain. It consists of sustainability self-assessments by suppliers, risk evaluation conducted by our purchasing department, sustain-ability questions within supplier quality audits and sustainabil-ity audits by external auditors. To further encourage sustain-able business conduct throughout our entire global supply chain, we are committed to building our suppliers’ competence and intensifying knowledge transfers related to sustainability.
C.8.5 Distribution and customer relations
Our Divisions have global responsibility for their business, sales and results. They are able to support customers around the world directly from their respective headquarters, espe-cially for large contracts and projects. However, most of our customers are small and medium-sized companies and organi-zations that require local support. To address local business opportunities with them, we are able to draw upon a large global sales force steered by our regional companies. They are responsible for serving our customers in the respective coun-tries, leveraging our global network of market partners like consultants, distributors, integrators, EPCs and machine build-ers. We are currently selling products and services in almost every country in the world.
Sustainable customer relationships are the basis for our long-term success. We employ a structured key account manage-ment (KAM) approach throughout the Company to take care of our key customers. This means that we tailor our products and solutions to their size and regional site structures. We also ensure that our key account managers continually develop and maintain relationships with them over the long term. This approach is supplemented by our Executive Relationship Pro-gram. In this program, members of the Company’s Executive Management stay in direct contact with selected customers and maintain an ongoing dialogue with them to familiarize Siemens with their needs.
Our business success is strongly dependent on the satisfaction of our customers. For this reason, we measure customer satis-faction in every unit of the Company using the Net Promoter Score (NPS). This internationally recognized and commonly ap-plied managerial performance indicator, which we determine annually on a worldwide basis by means of customer surveys, measures the referral rate of our customers. The NPS for fiscal 2014 was based on the results of more than 25,500 interviews, compared to more than 25,200 interviews in fiscal 2013. In fiscal 2014, our company-wide NPS once again increased com-pared to previous fiscal year.
An elementary component of all our global marketing and sell-ing activities is compliance with applicable laws and internal rules and regulations. Therefore, Siemens values and compli-ance are an integral part of our training program.
C.8.6 Environmental Portfolio
Indicators 1
Year ended September 30,
2014 2013
Revenue generated by the Siemens Environmental Portfolio (in billions of €) 33.0 31.9
Accumulated annual customer reductions of carbon dioxide emissions generated by elements from the Siemens Environmental Portfolio (in millions of metric tons) 428 369
1 Continuing operations.
Our Environmental Portfolio serves as an example of how we strive to align our business activities with the aforementioned megatrends, in this case climate change. The Environmental Portfolio consists of products, systems, solutions and services (Environmental Portfolio elements) that reduce negative im-pacts on the environment and emissions of carbon dioxide and other greenhouse gases (defined together in the following as carbon dioxide emissions) responsible for climate change.
In addition to its environmental benefits, our Environmental Portfolio enables us to compete successfully in attractive mar-kets and generate profitable growth. In fiscal 2014, revenue from continuing operations from the Environmental Portfolio amounted to € 33.0 billion, which accounted for 46 % of our rev-enue from continuing operations in this fiscal year. This rev-enue includes revenue from newly developed and additionally qualified elements, and excludes revenue from elements that no longer fulfill our qualifications.
In fiscal 2010, we set ourselves a revenue target for the Environ-mental Portfolio within the One Siemens framework: to exceed € 40 billion in revenue from the Environmental Portfolio by the end of fiscal 2014. Due to recent and ongoing portfolio changes we have not been able to achieve this target. Siemens’ strategic focus on technologies for energy efficiency and climate and en-vironmental protection will nevertheless remain in place. For fiscal year 2014, almost three-quarter of the revenue from our Environmental Portfolio were already generated with products and solutions for energy efficiency.
With our Environmental Portfolio, we intend, among other things, to help our customers reduce their carbon dioxide foot-print, cut their energy costs and improve their profitability

108 A. To our Shareholders 131 B. Corporate Governance 171 C. Combined Management Report
172 C.1 Business and economic environment 187 C.2 Financial performance system 193 C.3 Results of operations 205 C.4 Financial position 210 C.5 Net assets position
222
through an increase in productivity. Taking together all ele-ments of the Environmental Portfolio that were installed at cus-tomer locations since the beginning of fiscal 2002 and remain in use today, we have reduced customer carbon dioxide emis-sions by 428 million metric tons in fiscal 2014, which is the equivalent of the following thirteen cities’ combined yearly emissions: Berlin, Bogotá, Cape Town, Hong Kong, London, Los Angeles, Melbourne, Mexico City, Moscow, New York City, São Paulo, Seoul and Tokyo.
C.8.6.1 SELECTION CRITERIAAn Environmental Portfolio element can be a product, a system, a solution or a service. Furthermore, a core component of a system or solution may qualify as an Environmental Portfolio element if the component provided by Siemens is key to en-abling environmental benefits resulting from the system’s or solution’s overall application. To qualify for inclusion in the Environmental Portfolio, an element must meet one of the se-lection criteria described below, which are energy efficiency, renewable energy or environmental technologies. Products, systems, solutions and services with planned application in military use or nuclear power are not included in the Environ-mental Portfolio.
> Energy efficiency: The criteria for energy efficiency are an improvement in energy efficiency of 20 % or more during the customer use phase compared to the applicable baseline, or a reduction of at least 100,000 metric tons of carbon dioxide equivalents per reporting period in the customer use phase. Examples of elements that meet the energy efficiency crite-rion are combined cycle power plants and intelligent build-ing technology systems.
> Renewable energy: This criterion covers technologies in the field of renewable energy sources such as wind turbines or smart grid applications and their respective core compo-nents.
> Environmental technologies: This criterion is related to wa-ter and wastewater treatment, air pollution control, waste reduction, recycling, e-car infrastructure and its core compo-nents. It also includes the Siemens Consulting Service which analyzes customers’ environmental impact. Additionally, a criterion for the Healthcare Sector is an environmental impact reduction in terms of noise, radiation or total weight of at least 25 % compared to the baseline.
C.8.6.2 GOVERNANCE AND REPORTING APPROACHThe qualification of Environmental Portfolio elements as well as their respective reporting is based on defined processes and criteria. The business portfolio of Siemens’ continuing opera-tions is reviewed annually regarding the qualification of Envi-ronmental Portfolio elements based on the criteria described before. This covers the inclusion of newly developed elements
as well as the integration of additionally qualified elements where evidence of fulfillment of the qualification criteria was not available in prior reporting periods. For additionally quali-fied Environmental Portfolio elements, we report their pri-or-year revenue and prior-year contribution to reducing cus-tomer carbon dioxide emissions on a comparable basis. Elements that no longer fulfill our qualification criteria are ex-cluded from our Environmental Portfolio.
We report the revenue from our Environmental Portfolio and annual customer reductions of carbon dioxide emissions gener-ated by it in accordance with internal regulations defined in our Environmental Portfolio Guideline. This Guideline is based on the Reporting Principles of the Greenhouse Gas Protocol Corpo-rate Accounting and Reporting Standard, revised edition, and the Greenhouse Gas Protocol for Project Accounting. The rev-enue generated by the Environmental Portfolio is recognized in accordance with revenue recognition policies as described in
NOTE 2 in D.6 NOTES TO CONSOLIDATED FINANCIAL STATEMENTS.
C.8.7 Environmental protection
Indicators 1
Year ended September 30,
2014 2013
Energy efficiency improvement compared to baseline in fiscal 2010 2 11% 5%
Waste efficiency improvement compared to baseline in fiscal 2010 12% 8%
Waste for disposal reduction compared to baseline in fiscal 2010 8% 10%
Carbon dioxide emission efficiency improvement compared to baseline in fiscal 2010 20% 14%
1 Continuing operations.
2 Indicator incorporates weighted calculations related to the primary fuels consumed in generating the energy used at our sites and the amount of energy used to extract, convert and distribute the fuels consumed.
To meet today’s global ecological challenges responsibly, Siemens has a comprehensive EHS (Environmental Protection, Health Management and Safety) management system. The pro-cess requirements of this management system help our operat-ing units comply with applicable laws, regulations and customer requirements, satisfy our corporate requirements properly and achieve our Siemens-wide environmental targets. The environ-mental protection management system requires that our rele-vant production and office sites must implement an environ-mental management system which fulfills the requirements of the internationally recognized ISO 14001 standard and also our own internal standard, known as “Specifications on environ-mentally compatible product and system design.” This internal
247 D. Consolidated Financial Statements 337 E. Additional Information
213 C.6 Overall assessment of the economic position 214 C.7 Subsequent events 215 C.8 Sustainability and citizenship 225 C.9 Report on expected developments and
associated material opportunities and risks
242 C.10 Compensation Report and legal disclosures 242 C.11 Siemens AG (Discussion on basis
of German Commercial Code)
223
standard defines requirements to reduce the environmental impact of our products and systems during the production, use and disposal phase and is an integral part of our business pro-cesses. We conduct regular internal reviews of our environmen-tal performance and progress, in order to create a cycle of con-tinual improvement.
Our commitment to continual improvement led to two environ-mental protection programs in fiscal 2012: “Serve the Environ-ment” for industrial environmental protection and “Product Eco Excellence” for product-related environmental protection. Both programs were reconfirmed and extended in fiscal 2014. The general objectives to improve energy and resource efficiency, to fulfill growing international requirements with regard to envi-ronmental protection, to increase customer benefits, and to proactively strengthen our position as a sustainable company will be kept. The two reconfirmed programs will run from 2015 to 2020.
C.8.7.1 INDUSTRIAL ENVIRONMENTAL PROTECTIONOur industrial environmental protection efforts focus on opti-mizing energy and resource efficiency at our sites. With the current “Serve the Environment” program we have been com-mitted to the following Siemens-wide main targets in the time period fiscal 2011 to 2014:
> to continue our systematic effort to improve energy efficiency, and thereby achieve corresponding improvement in our carbon dioxide efficiency;
> to improve the waste efficiency each year by 1 %; and > to reduce waste for disposal each year by 1 %.
Furthermore, Siemens continued with the water risk manage-ment approach: In locations where there are particular water risks or negative impacts on the environment (for example as a result of aridity, high waste-water loads or poorly developed technical infrastructure), the local sites need to define targets matched to local conditions. Finally, our “Serve the Environ-ment” program also addressed air pollution by seeking alterna-tive solutions for any ozone-depleting substances still in legally permissible use and control VOC (Volatile organic compounds) emissions. For continuation of the Serve the Environment pro-gram energy and waste efficiency aspects will be integrated into our supply chain. Air pollution control will be considered holistically, taking account not only of own emissions but also of the local air immission situation at our production plants and offices. Climate change induced impacts of water use in our businesses will also be integrated.
We achieved the targets we set ourselves for fiscal 2014. The energy efficiency could be improved due to implementation of energy efficiency measures and implementation of energy
management systems. Due to this and to reasonable energy procurement and increased share of renewable energy in elec-tricity mix the CO2 efficiency was increased considerably.
C.8.7.2 PRODUCT-RELATED ENVIRONMENTAL PROTECTIONThe major focus of product-related environmental protection is to improve the overall environmental performance of our prod-ucts and systems. Therefore the existing “Product Eco Excel-lence” program will continue its approach regarding elements related to the product life cycle by integrating aspects of the circular economy and resource efficiency. The program has a modular design and offers innovative solutions to accomplish a higher transparency in terms of declarable substances, to de-velop and integrate a set of measures to improve resource effi-ciency of materials (e.g. scarcity, criticality) and to increase our claim on product environmental footprint information. On the basis of mandatory requirements as defined in our internal environmental standard, we support the reduction of the envi-ronmental impacts of our products and systems during product development, production, use and end of life. Additionally, the program aims to better prepare the operating units for future regulatory and customer requirements, to strengthen environ-mental communication, and to broaden environmental aware-ness among our employees. In the time period fiscal 2012 to fiscal 2014 for the main elements of the program following objectives have been reached:
> Transparency was enhanced with our list of declarable sub-stances (LoDS), comprising substances that are restricted in use due to regional or application-specific regulations.
> Development and application of a methodological approach for better assessing risks such as environmental, toxicologi-cal and future availability risks associated with used materi-als and substances. The application has been verified within our business.
> Establishment of a harmonized procedure on the basis of ISO 14040 / 44 (Life-cycle-assessment) for determining the “eco-logical footprint” of our products and thereof derived envi-ronmental product declarations based on the requirements of ISO 14025.

108 A. To our Shareholders 131 B. Corporate Governance 171 C. Combined Management Report
172 C.1 Business and economic environment 187 C.2 Financial performance system 193 C.3 Results of operations 205 C.4 Financial position 210 C.5 Net assets position
224
C.8.8 Corporate citizenship
Siemens is committed to providing long-term benefits to the societies in which we operate, through corporate citizenship activities. These activities can take a variety of forms ranging from philanthropic disaster relief to more strategic shared value or inclusive business approaches like our mobile clinics in India.
The responsibility for choosing and carrying out charitable activities lies with the local units in each country. This ensures that we provide support where it is needed most. In doing so, we apply high management standards and strategically focus our corporate citizenship activities in areas where our company competencies, resources and employee volunteering can make a meaningful difference:
> Education and Science: Our goal is to maintain a continu-ous dialogue with young people and to identify and foster talent from an early age on. We support educational and re-search activities particularly in natural sciences, engineering and healthcare.
> Social: Projects in this area aim to bring about a systematic and lasting improvement in people’s living conditions. In addition, we provide urgent humanitarian relief, including financial and technical assistance after natural disasters.
> Environment: We want to make an effective contribution towards protecting the environment, particularly through our core competencies, and raise environmental awareness among younger generations.
> Arts and Culture: We support Arts and Culture because a society ’s cultural heritage is a key aspect of its identity.

247 D. Consolidated Financial Statements 337 E. Additional Information
213 C.6 Overall assessment of the economic position 214 C.7 Subsequent events 215 C.8 Sustainability and citizenship 225 C.9 Report on expected developments and
associated material opportunities and risks
242 C.10 Compensation Report and legal disclosures 242 C.11 Siemens AG (Discussion on basis
of German Commercial Code)
225
C.9.1 Report on expected developments
C.9.1.1 WORLDWIDE ECONOMYFor the year 2015 we expect world GDP to expand by 3.2 % with fixed investment and manufacturing value added growing even more strongly at 4.5 % and 3.9 %, respectively. The slight acceleration compared to 2.7 % GDP growth anticipated in 2014 is expected to be driven mainly by the U.S. economy which seems to be on a stable recovery path. The monetary environ-ment is still expansive which should further support growth especially in the housing market. Nevertheless the outlook for the world economy remains uncertain, as indicated by the deterioration of many early indicators (especially for the Euro zone and China), the increased volatility in equity markets in October, and the severe decline in oil prices since summer 2014. On the one hand, the oil price decline is a symptom of slack global demand relative to supply. On the other hand it is a stabilizing factor for oil importing countries, because it in-creases purchasing power for consumers and reduces costs for many businesses. The biggest downside risks stem from geo-political tensions. An escalation of the Ukraine conflict would lead to a steep decline in investment activity. Similarly, further expansion of the “Islamic State” (including control over import-ant oil fields) could disrupt global oil markets and hit the global economy. Further downside risks would also emerge from an uncontrolled spread of the Ebola epidemic outside West-Africa.
In the region Europe, C.I.S., Africa, Middle East the condition of many Euro zone economies is a cause for concern. Given the latest indicators, there is some danger of a possible premature lapse of the recovery in the Euro zone. In the near term, defla-tion is the most important threat to these economies. While the German economy is expected to still suffer from Euro zone weakness and geopolitical tensions, it should also benefit from stabilizing factors, such as a relatively strong service sector, solid consumer demand, strong employment data, a weaker Euro and cheaper energy. For Russia, the outlook for 2015 depends on the future course of the Ukraine conflict and the reaction of western countries, which is not foreseeable now. While many African countries have achieved a steeper growth path in recent years, they might be negatively affected by lower raw material prices and by the Ebola epidemic in West-Africa.
For the Americas, we expect the U.S. economy to be the deci-sive force. The U.S. recovery seems to be broad-based and sup-ported by improving labor markets. The possible start of tight-ening monetary measures should not disrupt the underlying recovery. The outlook for Brazil, the second-largest economy in the Americas region, is less optimistic. The expected GDP growth rate of 1.0 % for 2015 (a little more than the population growth rate) has to be regarded as very low, given the poor
growth rate of 2014. The newly re-elected government has to enact substantial structural reforms to increase the growth potential of the country.
As in past years, Asia, Australia is expected to exhibit the high-est GDP growth. We expect China to contribute the main part of the region’s growth. However, the Chinese economy still suf-fers from overcapacities in several industries and fragile real estate and banking sectors. However, the government should be able to contain these problems if they become more severe. China’s gradual shift from an investment-driven to a consump-tion-driven economy is expected to slow down its economy in the near term. For India, the outlook for next year is better than in 2014. Growth should pick up slightly. However, similar to Brazil, the country needs structural reforms and substantial improvements in infrastructure.
All in all, for 2015 we expect growth of the global economy to accelerate slightly compared to 2014. However, there is an un-usually high number of downside risks, which – even if only some of them materialize – could substantially weigh on global economic activity. On the upside, a quick solution of political conflicts together with strong economic growth in the U.S. could boost global demand.
The forecasts presented here for GDP, gross fixed investments and manufacturing value added are based on a report from IHS Global Insight dated October 15, 2014.
C.9.1.2 MARKET DEVELOPMENTIn fiscal 2015, we expect growth in the markets served by the Power and Gas Division to remain on a low level. While we anticipate slightly increasing market volume year-over-year in advanced gas turbine markets – especially in the large-scale range (H class) – we also expect continued price declines due to manufacturing overcapacities and increased competitive pressure. We expect growth in the Division’s oil and gas mar-kets to accelerate in South America and Eastern Europe (e.g. Turkey, Azerbaijan). Investments in markets in the Americas are likely to pick up, despite delays, due mainly to demand for gas-fired power plants. We anticipate flat development for the coal-fired steam power plant market, due to an anticipated slow-down in China. We expect that clear growth in distributed power generation will continue to support growth for the Divisions’ markets as a whole.
For the markets served by our Wind Power and Renewables Division, we expect growth in fiscal 2015 to come in slightly lower than in fiscal 2014, which saw particularly strong growth rates. For onshore wind power markets, investments in the U.S. are expected to decline in fiscal 2015, following the strong prior
C.9 Report on expected developments and associated material opportunities and risks

108 A. To our Shareholders 131 B. Corporate Governance 171 C. Combined Management Report
172 C.1 Business and economic environment 187 C.2 Financial performance system 193 C.3 Results of operations 205 C.4 Financial position 210 C.5 Net assets position
226
fiscal year. In Europe, we expect the onshore market to see con-tinuous moderate growth. In both cases, market development strongly depends on the energy policy framework, including tax incentives in the U.S. and regulatory frameworks in Ger-many and the U.K. We expect these latter factors to have a sim-ilar effect on growth in the offshore wind power market, which is dominated by Europe. We expect the offshore wind power markets in Asia, Australia and the Americas to remain largely undeveloped in the short term.
For the markets served by our Energy Management Division, we expect overall moderate growth in fiscal 2015. Within the Division’s utility markets, we expect a slight increase in fiscal 2015. On a regional basis, the strongest growth in the utility markets is expected to come from the Europe, C.I.S., Africa, Middle East region. Here we expect strong demand from the Middle East and growth in transmission investments due to the integration of renewable sources into existing power distribu-tion networks. This growth may be partly offset by lower demand from major European utility companies which have an-nounced plans to reduce their capital expenditures. We expect utility markets in the Americas to grow slightly in fiscal 2015. Markets in the Asia, Australia region are expected to grow slightly, benefiting from demand from utility companies in the emerging countries of the region. We expect the Division’s oil and gas market to grow moderately, with the strongest growth rates in the Americas. Production of unconventional oil and gas is expected to be the main growth driver in the Americas, while growth in the Asia, Australia region is driven by investments in liquefied natural gas (LNG) infrastructure. The Division’s miner-als markets are expected to grow slightly in fiscal 2015 driven by demand in the Asia, Australia region. Overcapacities burden the Division’s metals markets, which are expected to grow even more slowly than the minerals markets. We expect a more posi-tive outlook in the Division’s chemicals and non-residential con-struction markets. Both markets are forecast to grow moderately in fiscal 2015 year-over-year. In all regions the chemical industry is contributing to growth. For the non-residential construction markets, we expect growth to be driven by the recovery of U.S. markets and by ongoing construction investments in Asia, Australia, particularly in China.
For the markets served by our Building Technologies Division, we expect moderate growth in fiscal 2015. On a regional basis, we expect growth in Europe, C.I.S., Africa, Middle East to pick up in fiscal 2015. Within the region, we expect growth rates in Europe including Germany to increase slightly year-over-year. For the Middle East we expect moderate growth rates year-over-year. Within the Americas, we expect the Division to ben-efit from a slow but continued recovery in U.S. construction markets. We expect markets in the Asia, Australia region to grow moderately as in fiscal 2014.
We expect markets served by our Mobility Division to grow slightly in fiscal 2015. Within Europe and the Middle East we expect decisions on large contract tenders in fiscal 2015, stem-ming from major public rail investments in the U.K. and the Middle East. Liberalization of the Turkish rail industry is on-going and large contract tenders are expected in the upcoming years. Within the Americas, we expect a continued high level of investments in mainline passenger and urban transport infra-structures in the U.S. Within the Asia, Australia region, we ex-pect growth in fiscal 2015 to benefit from a recovery of China’s high-speed rail infrastructure market. In Australia, we expect demand to be held back by lower investments in infrastructure industries.
In fiscal 2015, we do not expect growth momentum to acceler-ate in markets served by our Digital Factory and Process Industries and Drives Divisions compared to fiscal 2014. With the exception of the oil and gas industry, we expect conserva-tive investments in industries served by both Divisions over-all, particularly in Europe. Furthermore, we expect demand from emerging markets, which were growth drivers in the past, to be weak in fiscal 2015, with the exception of China. Within the region Europe, C.I.S., Africa, Middle East, we expect markets in Europe to continue to grow, albeit at a slow pace. While we expect moderate growth rates in some central Euro-pean countries, we expect growth to remain weak in the industrial markets of some large economies, such as France and Italy. While we expect currency-related headwinds for export-oriented industries in the Euro-zone to recede in fiscal 2015 compared to fiscal 2014, we expect weak demand from emerging markets to limit growth opportunities for those industries in fiscal 2015. The latter development is expected to be particularly evident in Germany’s export- oriented OEM businesses, such as the machine building industry. Also, we expect growth in Germany’s large automotive industry to slow in fiscal 2015 compared to fiscal 2014, resulting in less expan-sive investments year-over-year. Within the Americas, we expect that growth will be driven mainly by the U.S., which will also benefit manu facturing industries in Canada and Mex-ico. We expect a less favorable development in Brazil and other Latin American countries, where industrial growth is largely dependent on mining industries. Within the Asia, Aus-tralia region, we expect industrial markets in China to grow moderately in fiscal 2015, but below the growth rates in previ-ous years, as development in the country ’s export- oriented industries is held back by a stronger currency, higher labor costs and weakness in many other emerging economies which are important for Chinese exports. Growth in Asia, Australia is expected to benefit from a pick-up of industrial markets in South Korea. Industrial markets in India are expected to im-prove slightly. Overall, rising regional political uncertainties may further limit investment behavior.

247 D. Consolidated Financial Statements 337 E. Additional Information
213 C.6 Overall assessment of the economic position 214 C.7 Subsequent events 215 C.8 Sustainability and citizenship 225 C.9 Report on expected developments and
associated material opportunities and risks
242 C.10 Compensation Report and legal disclosures 242 C.11 Siemens AG (Discussion on basis
of German Commercial Code)
227
For fiscal 2015, we expect slight growth in the markets served by Healthcare. We expect markets in emerging countries to grow faster than markets in the industrialized countries. In emerging markets, we expect continued strong demand, in particular for entry-level products and solutions, as these coun-tries build up their healthcare infrastructure to provide their populations with affordable access to modern medical technol-ogy, including in rural areas. In contrast, demand in industrial-ized countries is expected to be held back by healthcare reforms and budgetary constraints. We expect industrialized countries – especially those more reliant on government healthcare expenditures – to continue to focus on improving the efficiency of healthcare and on slowing the growth of healthcare spending, thus driving demand for cost-efficient and high-throughput products and solutions. For the healthcare market overall, we anticipate that the trends towards entry- level solutions, higher efficiency and focus on patient outcomes will continue. On a regional basis, we expect that growth in the Americas in fiscal 2015 will be supported by moderate growth in the U.S., where we expect the trends towards higher effi-ciency and increased accountability of healthcare providers to continue. Our customers continue to face legislative and regu-latory reimbursement risks as governments and regulators seek to curb healthcare costs. Within the Europe, C.I.S., Africa, Middle East region, we expect the gradual stabilizing of Euro-pean markets to continue in fiscal 2015. While we expect the markets in the region Asia, Australia to grow faster than other regions in fiscal 2015, we expect growth to slow down year-over-year. This is expected to be particularly evident in China, where we expect increasing price and competitive pressure due mainly to increasing numbers of local vendors.
Our SFS Division is geared to Siemens’ Industrial Business and its markets. As such SFS is, among other factors, influenced by the overall business development of the markets served by our Industrial Business.
C.9.1.3 SIEMENS GROUPWe are basing our outlook for fiscal 2015 for the Siemens Group and its segments on the above-mentioned expectations regard-ing the overall economic situation and specific market condi-tions for the next fiscal year.
This outlook excludes impacts related to legal and regulatory matters.
We are exposed to currency translation effects, particularly in-volving the US$, British £ and currencies of emerging markets, such as China, India and Brazil. During fiscal 2014, the average exchange rate conversion for our large volume of US$-denomi-nated revenue was US$ 1.357 per Euro. While we expect vola-tility in global currency markets to continue in fiscal 2015,
we have improved our natural hedge on a global basis through geographic distribution of our production facilities during the past. Nevertheless, Siemens is still a net exporter from the Euro zone to the rest of the world, so a weak Euro is principally favorable for our business and a strong Euro is principally un-favorable. In addition to the natural hedging strategy just men-tioned, we also hedge currency risk in our export business using derivative financial instruments, see NOTE 30 in D.6
NOTES TO CONSOLIDATED FINANCIAL STATEMENTS. We expect these steps to help us limit effects on income related to currency in fiscal 2015.
Revenue growthGiven our complex economic and market developments, as described in the previous section, we expect that fiscal 2015 revenue for Siemens on an organic basis, excluding currency translation and portfolio effects, will be flat year-over-year. We expect that a moderate organic revenue decline particularly in our Power and Gas Division will be offset by organic revenue growth in other Divisions. Also, we expect a stabilizing effect on revenue from conversion of our order backlog (defined as the sum of order backlogs of our Industrial Business) which totaled € 100 billion as of September 30, 2014. From this back-log we expect to convert approximately € 37 billion of past orders into current revenue in fiscal 2015. We expect that orders for fiscal 2015 will exceed revenue, leading to a book-to-bill ratio above 1.
ProfitabilityIn fiscal 2015, we expect substantial gains from divestments mentioned in this Annual Report, particularly including the sale of our stake in BSH and the sale of our hearing aid business. We expect that these gains will more than offset charges associated with our “Vision 2020” concept, which includes efforts to increase customer proximity, accelerate innovation, and streamline our management and internal service processes. We anticipate that such charges during fiscal 2015 will be in the mid-to-high triple- digit-million euro range. We expect a significant rise in net income in fiscal 2015, which will enable us to increase basic earnings per share (EPS) from net income by at least 15 % from € 6.37 in fiscal 2014. In this forecast we also expect EPS growth to benefit modestly from our current program to repurchase Siemens shares in a volume of up to € 4 billion; repurchases under this program in fiscal 2014 totaled € 1.1 billion.
Our assumptions regarding net income for fiscal 2015 in-clude targeted increases in selling and R & D expenses, aimed at organic volume growth and strengthening our capacities for innovation. As part of our One Siemens framework, we target a total cost productivity increase of 3 % to 4 %. Furthermore, we expect a significant reduction in project charges compared to fiscal 2014.
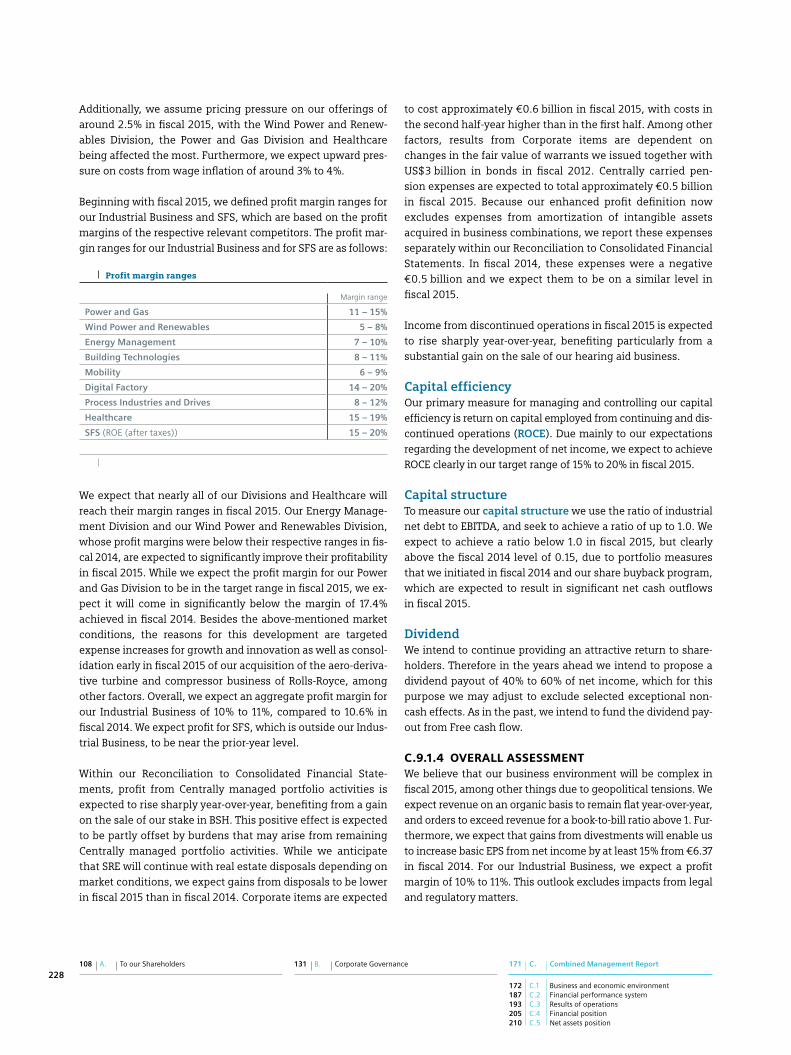
108 A. To our Shareholders 131 B. Corporate Governance 171 C. Combined Management Report
172 C.1 Business and economic environment 187 C.2 Financial performance system 193 C.3 Results of operations 205 C.4 Financial position 210 C.5 Net assets position
228
Additionally, we assume pricing pressure on our offerings of around 2.5 % in fiscal 2015, with the Wind Power and Renew-ables Division, the Power and Gas Division and Healthcare being affected the most. Furthermore, we expect upward pres-sure on costs from wage inflation of around 3 % to 4 %.
Beginning with fiscal 2015, we defined profit margin ranges for our Industrial Business and SFS, which are based on the profit margins of the respective relevant competitors. The profit mar-gin ranges for our Industrial Business and for SFS are as follows:
Profit margin ranges
Margin range
Power and Gas 11 – 15%
Wind Power and Renewables 5 – 8%
Energy Management 7 – 10%
Building Technologies 8 – 11%
Mobility 6 – 9%
Digital Factory 14 – 20%
Process Industries and Drives 8 – 12%
Healthcare 15 – 19%
SFS (ROE (after taxes)) 15 – 20%
We expect that nearly all of our Divisions and Healthcare will reach their margin ranges in fiscal 2015. Our Energy Manage-ment Division and our Wind Power and Renewables Division, whose profit margins were below their respective ranges in fis-cal 2014, are expected to significantly improve their profitability in fiscal 2015. While we expect the profit margin for our Power and Gas Division to be in the target range in fiscal 2015, we ex-pect it will come in significantly below the margin of 17.4 % achieved in fiscal 2014. Besides the above-mentioned market conditions, the reasons for this development are targeted expense increases for growth and innovation as well as consol-idation early in fiscal 2015 of our acquisition of the aero-deriva-tive turbine and compressor business of Rolls-Royce, among other factors. Overall, we expect an aggregate profit margin for our Industrial Business of 10 % to 11 %, compared to 10.6 % in fiscal 2014. We expect profit for SFS, which is outside our Indus-trial Business, to be near the prior-year level.
Within our Reconciliation to Consolidated Financial State-ments, profit from Centrally managed portfolio activities is expected to rise sharply year-over-year, benefiting from a gain on the sale of our stake in BSH. This positive effect is expected to be partly offset by burdens that may arise from remaining Centrally managed portfolio activities. While we anticipate that SRE will continue with real estate disposals depending on market conditions, we expect gains from disposals to be lower in fiscal 2015 than in fiscal 2014. Corporate items are expected
to cost approx imately € 0.6 billion in fiscal 2015, with costs in the second half-year higher than in the first half. Among other factors, results from Corporate items are dependent on changes in the fair value of warrants we issued together with US$ 3 billion in bonds in fiscal 2012. Centrally carried pen-sion expenses are expected to total approximately € 0.5 billion in fiscal 2015. Because our enhanced profit definition now excludes expenses from amortization of intangible assets acquired in business combinations, we report these expenses separately within our Reconciliation to Consolidated Financial Statements. In fiscal 2014, these expenses were a negative € 0.5 billion and we expect them to be on a similar level in fiscal 2015.
Income from discontinued operations in fiscal 2015 is expected to rise sharply year-over-year, benefiting particularly from a substantial gain on the sale of our hearing aid business.
Capital efficiencyOur primary measure for managing and controlling our capital efficiency is return on capital employed from continuing and dis-continued operations (ROCE). Due mainly to our expec tations regarding the development of net income, we expect to achieve ROCE clearly in our target range of 15 % to 20 % in fiscal 2015.
Capital structureTo measure our capital structure we use the ratio of industrial net debt to EBITDA, and seek to achieve a ratio of up to 1.0. We expect to achieve a ratio below 1.0 in fiscal 2015, but clearly above the fiscal 2014 level of 0.15, due to portfolio measures that we initiated in fiscal 2014 and our share buyback program, which are expected to result in significant net cash outflows in fiscal 2015.
DividendWe intend to continue providing an attractive return to share-holders. Therefore in the years ahead we intend to propose a dividend payout of 40 % to 60 % of net income, which for this purpose we may adjust to exclude selected exceptional non-cash effects. As in the past, we intend to fund the dividend pay-out from Free cash flow.
C.9.1.4 OVERALL ASSESSMENTWe believe that our business environment will be complex in fiscal 2015, among other things due to geopolitical tensions. We expect revenue on an organic basis to remain flat year-over-year, and orders to exceed revenue for a book-to-bill ratio above 1. Fur-thermore, we expect that gains from divestments will enable us to increase basic EPS from net income by at least 15 % from € 6.37 in fiscal 2014. For our Industrial Business, we expect a profit margin of 10 % to 11 %. This outlook excludes impacts from legal and regulatory matters.

247 D. Consolidated Financial Statements 337 E. Additional Information
213 C.6 Overall assessment of the economic position 214 C.7 Subsequent events 215 C.8 Sustainability and citizenship 225 C.9 Report on expected developments and
associated material opportunities and risks
242 C.10 Compensation Report and legal disclosures 242 C.11 Siemens AG (Discussion on basis
of German Commercial Code)
229
Overall, the actual development for Siemens and its Segments may vary, positively or negatively, from our expectations due to the risks and opportunities described below. See C.9.3 RISKS
as well as C.9.4 OPPORTUNITIES. This report on expected devel-opments should be read in conjunction with E.6 NOTES AND
FORWARD-LOOKING STATEMENTS.
C.9.2 Risk management
C.9.2.1 BASIC PRINCIPLES OF THE RISK MANAGEMENTOur risk management policy stems from a philosophy of pursu-ing sustainable growth and creating economic value while avoiding and managing inappropriate risks. As risk manage-ment is an integral part of how we plan and execute our busi-ness strategies, our risk management policy is set by the Man-aging Board. Our organizational and accountability structure as of September 30, 2014 requires each of the respective manage-ments of our Sectors, SFS, SRE, regions and Corporate Units to implement risk management programs that are tailored to their specific industries and responsibilities, while being consistent with the overall policy established by the Managing Board.
C.9.2.2 ENTERPRISE RISK MANAGEMENT PROCESSWe have implemented and coordinated a set of risk manage-ment and control systems which support us in the early recog-nition of developments jeopardizing the continuity of our busi-ness. The most important of these systems include our enterprise-wide processes for strategic planning and manage-ment reporting. Strategic planning is intended to support us in considering potential risks well in advance of major business decisions, while management reporting is intended to enable us to monitor such risks more closely as our business pro-gresses. Our internal auditors regularly review the adequacy and effectiveness of our risk management system. Accordingly, if deficits are detected, it is possible to adopt appropriate mea-sures for their elimination. This coordination of processes and procedures is intended to help ensure that the Managing Board and the Supervisory Board are fully informed about significant risks in a timely manner.
Risk management at Siemens is based on a comprehensive, in-teractive and management-oriented Enterprise Risk Manage-ment (ERM) approach that is integrated into the organization and that addresses both risks and opportunities. Our ERM approach is based on the worldwide accepted Enterprise Risk Management – Integrated Framework (2004) developed by the Committee of Sponsoring Organizations of the Treadway Com-mission (COSO). The framework connects the ERM process with our financial reporting process and our internal control
system. It considers a company’s strategy, the efficiency and effectiveness of its business operations, the reliability of its financial reporting as well as compliance with relevant laws and regulations to be equally important.
The ERM process aims for early identification and evaluation of, and response regarding, risks and opportunities that could ma-terially affect the achievement of our strategic, operational, financial and compliance objectives. Our ERM is based on a net risk approach, covering risks and opportunities remaining after the execution of existing control measures. In order to provide a comprehensive view on our business activities, risks and op-portunities are identified in a structured way combining ele-ments of both top-down and bottom-up approaches. Risks and opportunities are generally reported on a quarterly basis. This regular reporting process is complemented by an ad-hoc reporting process that aims to escalate critical issues in a timely manner. Relevant risks and opportunities are prioritized in terms of impact and likelihood, considering different perspec-tives, including business objectives, reputation and regulatory matters. The bottom-up identification and prioritization pro-cess is supported by workshops with the respective manage-ment of the Sector, SFS, SRE, regional and Corporate Unit orga-nizations. This top-down element ensures that potential new risks and opportunities are discussed at the management level and are included in the subsequent reporting process, if found to be relevant. Reported risks and opportunities are analyzed regarding potential cumulative effects and are aggregated at Sector, SFS, SRE, regional and corporate level.
Responsibilities are assigned for all relevant risks and opportu-nities with the hierarchical level of responsibility depending on the significance of the respective risk or opportunity. In a first step, assuming responsibility for a specific risk or opportunity involves deciding upon one of our general response strategies, or a combination of them. Our general response strategies with respect to risks are avoidance, transfer, reduction or acceptance of the relevant risk. Our general response strategies with respect to opportunities are partial or complete realization of the relevant opportunity. In a second step, responsibility for a risk or opportunity also involves the development, initiation and monitoring of appropriate response measures correspond-ing to the chosen response strategy. These response measures have to be specifically tailored to allow for effective risk man-agement. Accordingly, we have developed a variety of response measures with different characteristics: For example, we miti-gate the risk of fluctuations in currency and interest rates by engaging in hedging activities. Regarding our long-term proj-ects, systematic and comprehensive project management with standardized project milestones, including provisional accep-tances during project execution, and complemented by clearly

108 A. To our Shareholders 131 B. Corporate Governance 171 C. Combined Management Report
172 C.1 Business and economic environment 187 C.2 Financial performance system 193 C.3 Results of operations 205 C.4 Financial position 210 C.5 Net assets position
230
defined approval processes assists us in identifying and re-sponding to project risks at an early stage, even before entering the bidding phase. Furthermore, we maintain appropriate insurance levels for potential cases of damage and liability risks in order to reduce our exposure to such risks and to avoid or minimize potential losses. Among others, we address the risk
of fluctuations in economic activity and customer demand by closely monitoring the macroeconomic conditions and devel-opments in relevant industries, and by adjusting capacity and implementing cost-reduction measures in a timely and consis-tent manner, if deemed necessary.
C.9.2.3 RISK MANAGEMENT ORGANIZATION AND RESPONSIBILITIES
Operational and organizational structure of the Enterprise Risk Management (ERM) process as of September 30, 2014
Corporate Risk & Internal Control Committee (CRIC)
Reports to and supports the Managing Board in matters relating to the implementation, operation and oversight of an effective
Risk and Internal Control System.
Managing Board
Overall responsibility for the Risk and Internal Control System. Defines risk policy and ERM strategy.
Chief Risk & Internal Control Officer
Chairman of the CRIC. Defines and monitors application of ERM strategy, policy and methodology. Consolidates Siemens wide risk and opportunity
profile for CRIC.
Audit Committee
Oversees the effectiveness of the risk management and internal control system.
Sector Risk & Internal Control Committees
Lead Country Risk & Internal Control Committees
Oversee the risk and internal control activities for their area of responsibility and provide the Management with information necessary to report to the CRIC.
Sector Management 1 Lead Country Management Heads of Corporate Units
Implement ERM system and ensure management and monitoring of risks and opportunities in their respective organization.
1 The term “Sector” in this chart comprises Sectors, SFS and SRE.
To oversee the ERM process and to further drive the integration and harmonization of existing control activities to align with legal and operational requirements, the Managing Board estab-lished a Corporate Risk and Internal Control Department, headed by the Chief Risk & Internal Control Officer, and a Cor-porate Risk and Internal Control Committee (CRIC). The CRIC obtains risk and opportunity information from the Risk Com-mittees established at the Sector, SFS, SRE and regional level as well as from the Heads of Corporate Units, which then forms the basis for the evaluation of the company-wide risk and op-portunity situation. The CRIC reports to and supports the Man-aging Board on matters relating to the implementation, opera-tion and oversight of the risk and internal control system and assists the Managing Board in reporting to the Audit Commit-tee of the Supervisory Board. The CRIC is composed of the Chief Risk & Internal Control Officer, as the chairperson, and mem-bers of senior management such as the Sector and SFS CEOs, the CFO of Siemens, and selected Heads of Corporate Units.
C.9.3 Risks
Below we describe the risks that could have a material adverse effect on our business, financial condition (including effects on assets, liabilities and cash flows), results of operations and repu tation. The order in which the risks are presented in each of the four categories reflects the currently estimated relative exposure for Siemens associated with these risks and thus provides an indication of the risks’ current importance to us. Nevertheless, risks currently considered to entail a lower risk exposure could potentially result in a higher negative impact on Siemens than risks currently considered to entail a higher risk exposure. Additional risks not known to us or that we cur-rently consider immaterial may also negatively impact our busi-ness operations. Unless otherwise stated, the risks described below relate to all of our segments.

247 D. Consolidated Financial Statements 337 E. Additional Information
213 C.6 Overall assessment of the economic position 214 C.7 Subsequent events 215 C.8 Sustainability and citizenship 225 C.9 Report on expected developments and
associated material opportunities and risks
242 C.10 Compensation Report and legal disclosures 242 C.11 Siemens AG (Discussion on basis
of German Commercial Code)
231
C.9.3.1 STRATEGIC RISKSWe operate in highly competitive markets, which are sub-ject to price pressures and rapid changes: The worldwide markets for our products and solutions are highly competitive in terms of pricing, product and service quality, product devel-opment and introduction time, customer service and financ-ing terms. In many of our businesses, we face downward price pressure and we are or could be exposed to market downturns or slower growth, which may increase in times of declining investment activities and consumer demand. We face strong competitors, some of which are larger and may have greater resources in a given business area, and also competitors from emerging markets, which may have a better cost structure. Some industries in which we operate are undergoing con-solidation, which may result in stronger competition and a change in our relative market position. Certain competitors may be more effective and faster in capturing available market opportunities, such as through heavy investments or new entrance of IT companies into emerging service fields (e.g. data- driven services). These factors alone or in combination may negatively impact our business, financial condition, and results of operations.
Furthermore, we see a risk that suppliers (and to some extent even smaller customers), especially from emerging countries (e.g. China), could develop into serious competitors for Siemens resulting in even more competition and thus in re-duced volume, loss of market share, and / or lower profit margin.
Our business, financial condition and results of operations may be affected by the uncertainties of economic and polit-ical conditions, particularly in the current macroeconomic environment, which is characterized by a high degree of un-certainty and modest recovery as well as the continuing risk of resurgence of crisis in financial markets and / or renewed global economic downturn: Our business environment is in-fluenced by both domestic and global demand, which in turn is influenced by economic conditions. These conditions and, in consequence, the speed of economic growth and the sustain-ability of our market environment are dependent upon the evo-lution of a number of global and local factors. We still see a high level of uncertainty regarding the global economic out-look, primarily as a result of the anemic economic recovery in the Euro zone, sluggish growth in various emerging countries, and ongoing geopolitical tensions. The main downside risks stem from these political tensions. A severe escalation of the conflict in Eastern Europe would strongly affect the European and world economy and lead to a steep decline in investment activity. Similarly, an escalation of the conflicts in the Middle East could disrupt global oil markets and hit the global econ-omy. Additional risks for our market environment include such possibilities as a prolonged decline in investment sentiment,
a renewed crisis in financial and credit markets, a renewed banking crisis in Europe, a hard landing of the Chinese econ-omy, a supra-regional spread of the Ebola epidemic, fluctuating commodity prices, bankruptcies, natural disasters, political crises including further independence debates, social unrest and other challenges.
In general, due to the significant proportion of long-cycle busi-nesses in our former Sectors and the importance of long-term contracts for Siemens, there is usually a time lag between the development of macroeconomic conditions and their impact on our financial results. Important exceptions include our short- cycle businesses in the former Industry Sector, particularly those in the former Industry Automation Division and parts of the former Drive Technologies Division as well as parts of the former Power Grid Solutions & Products Business within the for-mer Infrastructure & Cities Sector, which are highly sensitive to volatility in market demand. If the moderate recovery of macro-economic growth stalls again and if we are not successful in adapting our production and cost structure to subsequent changes to conditions in the markets in which we operate, there can be no assurance that we will not experience adverse effects (e.g. underutilization of manufacturing and engineer-ing capacities) that may be material to our business, financial condition and results of operations. For example, it may be-come more difficult for our customers to obtain financing and as a result they may modify, delay or cancel plans to purchase our products and services or to follow through on purchases or contracts already executed. Furthermore, prices may decline as a result of adverse market conditions to a greater extent than currently anticipated. In addition, contracted payment terms, especially regarding the level of advance payments by our cus-tomers relating to long-term projects, may become less favor-able, which could negatively impact our cash flows. Addition-ally, if customers are not successful in generating sufficient revenue or securing access to the capital markets, they may not be able to pay, or may delay payment of, the amounts they owe us, which may adversely affect our business, financial condi-tion and results of operations.
Numerous other headwinds continue to constrain the world economy, such as the increasing popular support for anti-EU and anti-business parties, ongoing high public debt, and significant fluctuations in exchange rates, energy prices and raw material prices. These and other factors could impact macroeconomic parameters and the international capital and credit markets, and the resulting uncertainty could have an adverse impact on our business, financial condition and results of operations.
Our business is affected by a variety of market conditions and regulations. For example, our former Energy Sector is exposed to the development of global demand for energy and strongly

108 A. To our Shareholders 131 B. Corporate Governance 171 C. Combined Management Report
172 C.1 Business and economic environment 187 C.2 Financial performance system 193 C.3 Results of operations 205 C.4 Financial position 210 C.5 Net assets position
232
affected by regulations and policies related to energy and the environment. Healthcare is dependent on policy development and regulations affecting healthcare systems around the world, particularly in the important U.S. healthcare market. Our for-mer Industry Sector is vulnerable to unfavorable market condi-tions in certain segments of the automotive and manufac-turing industries. Our former Infrastructure & Cities Sector focuses, among other things, on business with public authori-ties around the world and is thus vulnerable to restrictions in public budgets.
Our business, financial condition and results of operations may be adversely affected by continued strategic alignments and cost-cutting initiatives: We are in a continuous process of strategic alignments and constantly engage in cost-cutting initiatives, including ongoing capacity adjustment measures and structural initiatives. Capacity adjustments through consolidation of business activities and manufacturing facili-ties, and the streamlining of product portfolios are also part of these cost reduction efforts. These measures may not be imple-mented as planned, may turn out to be less effective than an-ticipated, may become effective later than estimated or may not become effective at all. Each of these factors alone or in combination may negatively impact our business, financial condition, and results of operations. Any future contribution of these measures to our profitability will be influenced by the actual savings achieved and by our ability to sustain them.
Our businesses must keep pace with technological changes and develop new products and services to remain competitive: The markets in which our businesses operate ex-perience rapid and significant changes due to the introduction of innovative technologies. To meet our customers’ needs, we must continuously design new products and services and up-date existing ones, while investing in and developing new technologies. Introducing new products and technologies requires a significant commitment to research and develop-ment, which in return requires expenditure of considerable financial resources that may not always result in success. Our sales and profitability may suffer if we invest in technologies that do not operate or may not be integrated as expected, or that are not accepted in the market place as anticipated, or if our products or systems are not introduced to the market in a timely manner, particularly compared to our competitors, or become obsolete. We constantly apply for new patents and actively manage our intellectual property portfolio to secure our technological position. However, our patents and other intellectual property may not prevent competitors from inde-pendently developing or selling products and services that are similar to or duplicates of ours. There can be no assurance that the resources we invest to protect our intellectual property will be sufficient or that our intellectual property portfolio will
adequately deter misappropriation or improper use of our technology. Furthermore, in some of our markets, the need to develop and introduce new products rapidly in order to cap-ture available opportunities may lead to quality problems. Our operating results depend to a significant extent on our ability to anticipate and adapt to changes in our markets and to reduce the costs of producing high-quality products. Among recent technology trends, we are carefully evaluating the potential and relevance of digitalization. We believe that the potential and usage scenarios of this technology vary among our products, solutions and services depending on the degree of information technology utilized. However, we also believe that this trend needs to be monitored closely, because it might bear the potential to change the competitive landscape. Any inability to adapt to the aforementioned factors could have an adverse effect on our business, financial condition and results of operations.
Our business, financial condition and results of operations may be adversely affected by portfolio measures: Our strat-egy includes divesting activities in some business areas and strengthening others through portfolio measures, including mergers and acquisitions.
With respect to divestments, we may not be able to divest some of our activities as planned, and the divestitures we do carry out could have a negative impact on our business, financial condition, results of operations and our reputation. As a major divestment, we agreed that Bosch will acquire Siemens’ stake in BSH Bosch und Siemens Hausgeräte GmbH.
Mergers and acquisitions are inherently risky because of diffi-culties that may arise when integrating people, operations, technologies and products. There can be no assurance that any of the businesses we acquire can be integrated successfully and as timely as originally planned, or that they will perform as anticipated once integrated. In addition, we may incur signifi-cant acquisition, administrative and other costs in connection with these transactions, including costs related to integration of acquired businesses. For example, in September 2014, we entered into an agreement with Dresser-Rand to acquire all of its issued and outstanding common shares by way of a friendly takeover bid. At the beginning of May 2014, we announced the acquisition of the Rolls-Royce Energy aero-derivative gas turbine and compressor business of Rolls-Royce plc, U.K. (Rolls-Royce). Furthermore, portfolio measures may result in addi-tional financing needs and adversely affect our financial leverage and our debt-to-equity ratio. Acquisitions may also lead to substantial increases in intangible assets, including goodwill. Our Statements of Financial Position reflect a signifi-cant amount of intangible assets, including goodwill. Among our businesses, the largest amount of goodwill is allocated to

247 D. Consolidated Financial Statements 337 E. Additional Information
213 C.6 Overall assessment of the economic position 214 C.7 Subsequent events 215 C.8 Sustainability and citizenship 225 C.9 Report on expected developments and
associated material opportunities and risks
242 C.10 Compensation Report and legal disclosures 242 C.11 Siemens AG (Discussion on basis
of German Commercial Code)
233
the former Diagnostics Division and the former Imaging & Therapy Systems Division of Healthcare, and the former Indus-try Automation Division of the former Industry Sector. If we were to encounter continuing adverse business developments including negative effects on our revenues, profits or cash, or adverse effects from an increase in the weighted average cost of capital (WACC) or from foreign exchange rate developments, or if we were otherwise to perform worse than expected at acqui-sition activities, then these intangible assets, including good-will, might have to be written off, which could adversely affect our business, financial condition and results of operations. The likelihood of such adverse business developments increases in times of difficult or uncertain macroeconomic conditions.
Our business, financial condition and results of operations may be adversely affected by our equity interests, other investments and strategic alliances: Our strategy includes strengthening our business interests through joint ventures, associated companies and strategic alliances. Certain of our investments, particularly in our former segment Equity Invest-ments, are accounted for using the equity method, including, among others, Unify (formerly EN) and, after contractual clos-ing of the transaction, our Metals Technologies joint venture with Mitsubishi Heavy Industries. Furthermore, we hold other investments, for example Atos SE and OSRAM Licht AG. Any factors negatively influencing the profitability of our equity and other investments, including negative effects on revenues, profits or cash, could have an adverse effect on our equity pick-up related to these equity interests or may result in a write-off of these investments. In addition, our business, financial condition and results of operations could also be adversely affected in connection with loans, guarantees or non-compli-ance with financial covenants related to these equity and other investments. Furthermore, such investments are inherently risky as we may not be able to sufficiently influence corporate governance processes or business decisions taken by our equity investments, other investments and strategic alliances that may have a negative effect on our business. In addition, joint ventures bear the risk of difficulties that may arise when integrating people, operations, technologies and products. Strategic alliances may also pose risks for us because we com-pete in some business areas with companies with which we have strategic alliances.
We are subject to changes of regulations, laws and policies concerning our products: As a diversified company with global businesses we are exposed to various product-related regula-tions, laws and policies influencing our processes. Recently, some jurisdictions around the world have adopted certain reg-ulations, laws and policies requiring us to extend our recycling efforts, limit the sourcing and usage of certain raw materials, and request that suppliers provide additional due diligence and
disclosures on sourcing and usage of the regulated raw materi-als. In particular, there is U.S. legislation concerning the sourc-ing of “conflict minerals” from mines located in the conflict zones of the Democratic Republic of Congo (DRC) and its adjoining countries. This U.S. legislation requires manufactur-ers listed on U.S. stock exchanges to investigate and disclose their use of any conflict minerals originating in the DRC or ad-joining countries. Many of our customers fall into this category. If their (sub-)suppliers do not provide them with requested in-formation and do not take other steps to ensure that no such conflict minerals are included in minerals or components sup-plied to them, they may be forced to disclose information about the use of conflict minerals in their supply chain in filings with the SEC. Thus, our customers pass on these transparency obli-gations within their supply chain in which we are also involved. We exercise our duty within the supply chain, as our customers request transparency in the supply chain and as the obligation to do so already forms an element of customer contracts. If we are unable to achieve sufficient confidence throughout our supply chain, or if any of these risks or similar risks associated with these kinds of regulations, laws and policies were to materialize, our business, financial condition, results of opera-tions and reputation could be adversely affected.
C.9.3.2 OPERATIONAL RISKSOur business, financial condition and results of operations may be adversely affected by cost overruns or additional payment obligations related to the management of our long-term, fixed-price or turnkey projects: We perform a por-tion of our business, especially large projects, under long-term contracts that are awarded on a competitive bidding basis. Some of these contracts are inherently risky because we may assume substantially all of the risks associated with complet-ing a project and the post-completion warranty obligations. For example, we face the risk that we must satisfy technical re-quirements of a project even though we may not have gained experience with those requirements before we win the project. The profit margins realized on fixed-priced contracts may vary from original estimates as a result of changes in costs and pro-ductivity over their term. We sometimes bear the risk of unan-ticipated project modifications, shortage of key personnel, quality problems, financial difficulties of our customers, cost overruns or contractual penalties caused by unexpected tech-nological problems, unforeseen developments at the project sites, unforeseen changes or difficulties in the regulatory or political environment, performance problems with our suppli-ers, subcontractors and consortium partners or other logistical difficulties. Certain of our multi-year contracts also contain demanding installation and maintenance requirements in addition to other performance criteria relating to timing, unit cost and compliance with government regulations require-ments, which, if not satisfied, could subject us to substantial

108 A. To our Shareholders 131 B. Corporate Governance 171 C. Combined Management Report
172 C.1 Business and economic environment 187 C.2 Financial performance system 193 C.3 Results of operations 205 C.4 Financial position 210 C.5 Net assets position
234
contractual penalties, damages, non-payment and contract ter-mination. There can be no assurance that contracts and proj-ects, in particular those with long-term duration and fixed-price calculation, can be completed profitably.
Increased IT security threats and higher levels of profes-sionalism in computer crime could pose a risk to our systems, networks, products, solutions and services as well as to those of our service providers: Our business portfolio includes a broad array of systems, networks, products, solu-tions and services across our businesses that rely on digital technologies. We observe a global increase in IT security threats and higher levels of professionalism in computer crime, which pose a risk to the security of systems and networks and the confidentiality, availability and integrity of data. We attempt to mitigate these risks by employing a number of measures, including employee training, comprehensive monitoring of our networks and systems, and maintenance of backup and protective systems such as firewalls and virus scanners. To the extent we employ service providers, such as in the area of IT infrastructure, we have contractual arrangements in place in order to ensure that these risks are reduced in a similar man-ner. Nonetheless, our systems, networks, products, solutions and services, as well as those of our service providers remain potentially vulnerable to attacks. Depending on their nature and scope, such attacks could potentially lead to the leakage of confidential information, improper use of our systems and net-works, manipulation and destruction of data, defective prod-ucts, production downtimes and supply shortages, which in turn could adversely affect our business, financial condition, results of operations and reputation.
We may face operational failures and quality problems in our value chain processes: Our value chain comprises all steps, from research and development to supply chain manage-ment, production, marketing, sales and services. Operational failures in our value chain processes could result in quality problems or potential product, labor safety, regulatory or envi-ronmental risks. Such risks are particularly present in our former Sectors in relation to our production and construction facilities, which are located all over the world and have a high degree of organizational and technological complexity. From time to time, some of the products we sell might have quality issues resulting from the design or manufacture of such prod-ucts or from the software integrated into them. Our Healthcare business, for example, is subject to regulatory authorities including the U.S. Food and Drug Administration and the Euro-pean Commission’s Health and Consumer Policy Department, which require us to make certain efforts to safeguard our prod-uct quality. If we are not able to comply with these require-ments, our business, financial condition, results of operations and reputation may be adversely affected.
Furthermore, failures on the part of service providers we employ, such as in the area of IT, may have an adverse effect on our processes and operations and our ability to meet our com-mitments to customers or increase our operating costs. Any operational failures or quality issues could have an adverse effect on our business, financial condition, results of opera-tions and reputation.
We are dependent upon hiring, developing and retaining highly qualified management and technical personnel: Competition for highly qualified personnel remains intense in the industries and regions in which our businesses operate. In many of our business areas, we intend to expand our busi-ness activities, for which we will need highly skilled employ-ees. Our future success depends in part on our continued abil-ity to hire, integrate, develop and retain engineers and other qualified personnel. We address this risk with various measures, for example succession planning, employer branding, retention and career management. However, there can be no assurance that we will continue to be successful in attracting and retain-ing all the highly qualified employees and key personnel needed in the future, including in appropriate geographic locations, and any inability to do so could have an adverse effect on our busi-ness, financial condition, results of operations and reputation.
We may face interruption of our supply chain, including the inability of third parties to deliver parts, components and services on time and in the contractually agreed quality, and we may be subject to rising raw material prices: Our financial performance depends in part on reliable and effective supply chain management for components, sub-assemblies and other materials. Capacity constraints and supply shortages resulting from ineffective supply chain management may lead to delays and additional cost. We rely on third parties to supply us with parts, components and services. Using third parties to manufacture, assemble and test our products reduces our con-trol over manufacturing yields, quality assurance, product delivery schedules and costs. The third parties that supply us with parts and components also have other customers and may not have sufficient capacity to meet all of their customers’ needs, including ours, during periods of excess demand. Com-ponent supply delays can affect the performance of our former Sectors. Although we work closely with our suppliers to avoid supply-related problems, there can be no assurance that we will not encounter supply problems in the future or that we will be able to replace a supplier that is not able to meet our demand. This risk is particularly evident in businesses with a very limited number of suppliers. Shortages and delays could materially harm our business. Unanticipated increases in the price of components or raw materials due to market shortages or other reasons could also adversely affect the performance of our former Sectors. Furthermore, we may be exposed to the
247 D. Consolidated Financial Statements 337 E. Additional Information
213 C.6 Overall assessment of the economic position 214 C.7 Subsequent events 215 C.8 Sustainability and citizenship 225 C.9 Report on expected developments and
associated material opportunities and risks
242 C.10 Compensation Report and legal disclosures 242 C.11 Siemens AG (Discussion on basis
of German Commercial Code)
235
risk of delays and interruptions of the supply chain as a conse-quence of natural disasters in case we are unable to identify alternative sources of supply or ways of transportation in a timely manner or at all. A general shortage of materials, com-ponents or sub-components as a result of natural disasters also bears the risk of unforeseeable fluctuations in prices and demand, which might adversely affect our business, financial condition and results of operations.
Our former Sectors purchase raw materials including so-called rare-earth metals, copper, steel, aluminum and oil, which ex-pose them to fluctuations in energy and raw material prices. In recent times, commodities prices have been subject to volatile markets, and such volatility is expected to continue. If we are not able to compensate for our increased costs or pass them on to customers, price increases could have an adverse impact on our business, financial condition and results of operations. In contrast, in times of falling commodity prices, we may not fully profit from such price decreases as we attempt to reduce the risk of rising commodity prices by several means, such as long-term contracting or physical and financial hedging. In addition to price pressure that we may face from our customers expect-ing to benefit from falling commodity prices or adverse market conditions, this could also adversely affect our business, finan-cial condition and results of operations.
C.9.3.3 FINANCIAL RISKSWe are exposed to market price risks: We are exposed to fluc-tuations in exchange rates, especially between the U.S. dollar and the euro, because a high percentage of our business volume is conducted in the U.S. and as exports from Europe. In addition, we are exposed to currency effects involving the currencies of emerging markets, in particular the Chinese Yuan. A strengthening of the euro (particularly against the U.S. dollar) may change our competitive position, as many of our competitors may benefit from having a substantial portion of their costs based in weaker currencies, enabling them to offer their products at lower prices. As a result, a strong euro in rela-tion to the U.S. dollar and other currencies could have an adverse impact on our revenues and results of operations. Certain currency risks as well as interest rate risks are hedged using derivative financial instruments. Depending on the development of foreign currency exchange and interest rates, our hedging activities could have significant effects on our business, financial condition and results of operations. Changes in the fair value of warrants issued together with US$ 3 billion bonds in fiscal 2012 depends mainly on the under-lying Siemens and OSRAM share prices as well as their respec-tive volatilities, irrespective of the fact that our potential obligation related to the warrant writer position to physically deliver Siemens and OSRAM shares could be covered out of existing stock. Accordingly, exchange rate, interest rate and
share price fluctuations may lead to higher volatility and adverse effects on our business, financial condition and results of operations.
We are exposed to volatile credit spreads: Regarding our Corporate Treasury activities, widening credit spreads due to uncertainty and risk aversion in the financial markets might lead to adverse changes of fair market values of our financial assets, in particular concerning our derivative financial instru-ments. In addition, widening credit spreads could lead to increasing refinancing costs if the Euro zone sovereign debt crisis with its ongoing significant impact on global financial markets and the European financial sector in particular, contin-ues or even worsens. Any such development could also further increase the costs for buying protection against credit risks due to a potential increase of counterparty risks.
Our future financing via Corporate Treasury may particu-larly be affected by the uncertainty of economic condi-tions and the developments of capital and financial mar-kets: Our Corporate Treasury is responsible for the financing of the Company. Negative developments in foreign exchange, money or capital markets, such as limited availability of funds (particularly U.S. dollar funds), may increase our overall cost of funding. The ongoing Euro zone sovereign debt crisis con-tinues to have an impact on global capital markets. The result-ing higher risk awareness of governments led to more regula-tions on the use of financial instruments through (1) the Regulation on OTC derivatives, central counterparties and trade repositories (European Market Infrastructure Regula-tion) and (2) other similar regulations in other jurisdictions, which may have an impact on the future availability or the costs of adequate hedging instruments for the Company. It may even lead to further regulations of the financial sector as well as to the use of financial instruments that could adversely influence our future possibilities of obtaining debt financing, and / or may increase our refinancing costs. Deterio-rating credit quality or even default of business partners may adversely affect our business, financial condition and results of operations.
Downgrades of our rating could increase our cost of capital and therefore could negatively affect our business: Our business, financial condition and results of operations are influ-enced significantly by the actual and expected performance of the former Sectors and SFS, as well as our portfolio measures. An actual or expected negative development of our business, financial condition or results of operations could result in the deterioration of our credit rating. Downgrades by rating agen-cies could increase our cost of capital, may reduce our potential investor base and may negatively affect our business, financial condition and results of operations.

108 A. To our Shareholders 131 B. Corporate Governance 171 C. Combined Management Report
172 C.1 Business and economic environment 187 C.2 Financial performance system 193 C.3 Results of operations 205 C.4 Financial position 210 C.5 Net assets position
236
Our financing activities subject us to various risks, includ-ing credit, interest rate and foreign exchange risk: We pro-vide our customers with various forms of direct and indirect financing in connection with large projects. We also finance a large number of customer orders, for example, the leasing of medical equipment, mainly through SFS. SFS also bears credit risk by financing third-party equipment or by taking direct or indirect participation in financings, such as syndicated loans. In part, we take a security interest in the assets we finance or we receive additional collateral. Our business, financial condi-tion and results of operations may be adversely affected if the credit quality of our customers deteriorates or if they default on their payment obligation to us, if the value of the assets in which we have taken a security interest or additional collateral declines, if interest rates or foreign exchange rates fluctuate, or if the projects in which we invest are unsuccessful. Potential adverse changes in economic conditions could cause a decline in the fair market values of assets, derivative instruments as well as collateral, resulting in losses which could have an adverse effect on our business, financial condition and results of operations.
Our business, financial condition and results of operations may be adversely affected by several parameters influenc-ing the funded status of our pension benefit plans: The funded status of our pension plans may be affected by an increase or decrease in the defined benefit obligation (DBO), as well as by an increase or decrease in the value of plan assets. A significant increase in the underfunding may have a negative effect on our rating. Pensions are accounted for in accordance with actuarial valuations, which rely on statistical and other factors in order to anticipate future events. These factors include key pension plan valuation assumptions such as the discount rate, rate of future compensation increases and pension progression. Actual developments may differ from assumptions due to changing market and economic conditions, thereby resulting in an increase or decrease in the DBO. Signif-icant movements in financial markets or a change in the port-folio mix of invested assets could result in corresponding increases or decreases in the value of plan assets, particularly equity securities. Also, changes in pension plan assumptions could affect defined benefit costs. For example, a change in dis-count rates may result in changes in the defined benefit costs in the following fiscal year. In order to comply with local pen-sion regulations in selected foreign countries, we may face a risk of increasing cash outflows to reduce an underfunding of our pension plans in these countries, if any.
With respect to sales-related bank guarantees to be issued in the course of orders or supplies, we are exposed to cer-tain risks arising from our banks’ rating and its develop-ment: Frequently customers request from the supplier that
guarantees customary for the business are procured from banks, such as down-payment or warranty bonds, as part of the order. Sometimes customers may also set minimum requirements as to the creditworthiness of acceptable guarantors. Accordingly, situations may arise with respect to existing orders that, during the order’s execution phase, customers request the provision of alternative security upon the deterioration of a guaranteeing bank’s creditworthiness.
Examinations by tax authorities and changes in tax regula-tions could adversely affect our business, financial condi-tion and results of operations: We operate in nearly all coun-tries of the world and therefore are subject to many different tax regulations. Changes in tax law in any of these jurisdictions could result in higher tax expense and payments. Furthermore, legislative changes could impact our tax receivables and liabil-ities as well as deferred tax assets and deferred tax liabilities. In addition, the uncertain tax environment in some regions could limit our ability to enforce our rights. As a globally operating organization, we conduct business in countries subject to com-plex tax rules, which may be interpreted in different ways. Future interpretations or developments of tax regimes may affect our business, financial condition and results of operations. We are regularly examined by tax authorities in various jurisdictions.
For further information on derivative financial instruments, hedging activities and financial risk management, see NOTE
30 AND 31 in D.6 NOTES TO CONSOLIDATED FINANCIAL STATEMENTS.
C.9.3.4 COMPLIANCE RISKSWe are subject to regulatory risks associated with our inter-national operations: Protectionist trade policies and changes in the political and regulatory environment in the markets in which we operate, such as import and export controls, tariffs and other trade barriers including debarment from certain mar-kets and price or exchange controls, could affect our business in several national markets, impact our sales and profitability and make the repatriation of profits difficult, and may expose us to penalties, sanctions and reputational damage. In addi-tion, the uncertainty of the legal environment in some regions could limit our ability to enforce our rights and subject us to continually increasing costs related to designing and imple-menting appropriate compliance programs and protocols.
As a globally operating organization, we conduct business with customers in countries, such as Iran, Syria, Cuba and countries in Eastern Europe, that are subject to export control regulations, embargoes, economic sanctions or other forms of trade restric-tions imposed by the U.S., the European Union or other coun-tries or organizations. New or expanded export control regu-lations, economic sanctions, embargoes or other forms of trade restrictions imposed on Iran, Syria or on other sanctioned

247 D. Consolidated Financial Statements 337 E. Additional Information
213 C.6 Overall assessment of the economic position 214 C.7 Subsequent events 215 C.8 Sustainability and citizenship 225 C.9 Report on expected developments and
associated material opportunities and risks
242 C.10 Compensation Report and legal disclosures 242 C.11 Siemens AG (Discussion on basis
of German Commercial Code)
237
countries in which we do business may result in a curtailment of our existing business in such countries or indirectly in other countries and in amendments to our policies. We are also aware of initiatives by institutional investors, such as pension funds or other companies, to adopt or consider adopting policies prohib-iting investment in and transactions with, or requiring divest-ment of interests in entities doing business with, Iran and other countries identified as state sponsors of terrorism by the U.S. Secretary of State. It is possible that such initiatives may result in us being unable to gain or retain investors, customers or sup-pliers. In addition, the termination of our activities in sanctioned countries may expose us to customer claims and other actions. Our reputation could also suffer due to our activities with coun-terparties in or affiliated with these countries. As previously disclosed, Siemens has decided that, subject to certain limited exceptions, it will not enter into new contracts with customers in Iran and has issued group-wide policies establishing the details of its general decision.
We expect that sales to emerging markets will account for an increasing portion of our total revenue, as our business natu-rally evolves and as developing nations and regions around the world increase their demand for our offering. Emerging market operations involve various risks, including civil unrest, health concerns, cultural differences such as employment and busi-ness practices, volatility in gross domestic product, economic and governmental instability, the potential for nationalization of private assets and the imposition of exchange controls. The Asian markets, in particular, are important for our long-term growth strategy, and our sizeable operations in China are influ-enced by a legal system that is still developing and is subject to change. Our growth strategy could be limited by govern-ments supporting local industries. Our former Sectors, partic-ularly those that derive their revenue from large projects, could be adversely affected if future demand, prices and gross domestic product in the markets in which those former Sectors operate do not develop as favorably as expected due to such regulatory measures. If any of these risks or similar risks asso-ciated with our international operations were to materialize, our business, financial condition and results of operations could be adversely affected.
Current and future investigations regarding allegations of public corruption, antitrust violations and other illegal acts could have an adverse effect on our business, financial condition and results of operations and on our reputation: We engage in a substantial amount of business with govern-ments and government-owned enterprises around the world. We also participate in a number of projects funded by govern-ment agencies and intergovernmental and supranational orga-nizations such as multilateral development banks. If we are found to have been engaged in public corruption, antitrust
violations and other illegal acts, such activities may impair our ability to do business with these or other organizations. Cor-ruption, antitrust and related proceedings may lead to criminal and civil fines as well as penalties, sanctions, injunctions against future conduct, profit disgorgements, disqualifications from directly and indirectly engaging in certain types of busi-ness, the loss of business licenses or permits or other restric-tions. Accordingly, we may be required to record material pro-visions to cover potential liabilities arising in connection with such investigations and proceedings, including potential tax penalties. Moreover, any findings related to public corruption that are not covered by the 2008 and 2009 corruption charge settlements, which were concluded with American and German authorities, may endanger our business with government agencies and intergovernmental and supranational organiza-tions, further monitors could be appointed to review future business practices and we may otherwise be required to further modify our business practices and our compliance program.
Our involvement in ongoing and potential future corruption or antitrust proceedings could damage our reputation and have an adverse impact on our ability to compete for business from public and private sector customers around the world. If we or our subsidiaries are found to have engaged in certain illegal acts or not to have taken effective steps to address allegations or findings of corruption or antitrust violations in our business, this may impair our ability to participate in business with gov-ernments or intergovernmental organizations and may result in our formal exclusion from such business. Even if we are not formally excluded from participating in government business, government agencies or intergovernmental or supranational organizations may informally exclude us from tendering for or participating in certain contracts. For example, legislation of member states of the European Union could in certain cases result in our mandatory or discretionary exclusion from public contracts in case of a conviction for bribery and certain other offences or for other reasons. As described in more detail in
NOTE 28 in D.6 NOTES TO CONSOLIDATED FINANCIAL STATEMENTS, we and certain of our subsidiaries have in the past been ex-cluded or currently are excluded from some contracting, in-cluding with governments, development banks and multilat-eral financial institutions, as a result of findings of corruption or other misconduct. Ongoing or potential future investiga-tions into allegations of corruption or antitrust violations could also impair existing relationships with, and our ability to ac-quire new private sector business partners. For instance, such investigations may adversely affect our ability to pursue poten-tially important strategic projects and transactions, such as strategic alliances, joint ventures or other business combina-tions, or could result in the cancellation of certain of our exist-ing contracts and third parties, including our competitors, could initiate significant third-party litigation.

108 A. To our Shareholders 131 B. Corporate Governance 171 C. Combined Management Report
172 C.1 Business and economic environment 187 C.2 Financial performance system 193 C.3 Results of operations 205 C.4 Financial position 210 C.5 Net assets position
238
In addition, future developments in ongoing and potential future investigations, such as responding to the requests of governmental authorities and cooperating with them, could divert management’s attention and resources from other issues facing our business. The materialization of any of these risks could have an adverse effect on our business, financial condi-tion and results of operations and on our reputation.
We are subject to environmental and other governmental regulations: Some of the industries in which we operate are highly regulated. Current and future environmental and other governmental regulations or changes thereto may require us to change the way we run our operations and could result in significant increases in our operating or production costs. In addition, while we have procedures in place to ensure compli-ance with applicable governmental regulations in the conduct of our business operations, it cannot be excluded that viola-tions of applicable governmental regulations may be caused either by us or by third parties that we contract with, including suppliers or service providers, whose activities may be at-tributed to us. Any such violations expose us to the risk of lia-bility, reputational damage or loss of licenses or permits that are important to our business operations. In particular, we could also face liability for damage or remediation for environ-mental contamination at the facilities we design or operate. For example, we are required to bear environmental clean-up costs mainly related to remediation and environmental protection liabilities, which have been accrued based on the estimated costs of decommissioning facilities for the production of ura-nium and mixed-oxide fuel elements in Hanau, Germany, as well as a nuclear research and service center in Karlstein, Germany. For further information, see NOTE 23 in D.6 NOTES TO
CONSOLIDATED FINANCIAL STATEMENTS. Under certain circum-stances, we establish provisions for environmental risks. With regard to certain environmental risks, we maintain liability in-surance at levels that our management believes are appropri-ate and consistent with industry practice. We may incur envi-ronmental losses beyond the limits, or outside the coverage, of such insurance, and such losses may have an adverse effect on our business, financial condition and results of our operations. In addition, our provisions for environmental liabilities may not be sufficient to cover our ultimate losses or expenditures resulting therefrom.
Our business, financial condition and results of operations could suffer as a result of current or future litigation: We are subject to numerous risks relating to legal, governmental and regulatory proceedings to which we are currently a party or to which we may become a party in the future. We routinely be-come subject to legal, governmental and regulatory investiga-tions and proceedings involving, among other things, requests for arbitration, allegations of improper delivery of goods or
services, product liability, product defects, quality problems, intellectual property infringement, non-compliance with tax reg-ulations and / or alleged or suspected violations of applicable laws. In addition, we may face further claims in connection with the circumstances that led to the corruption charges. For addi-tional information with respect to specific proceedings, see
NOTE 28 in D.6 NOTES TO CONSOLIDATED FINANCIAL STATEMENTS. There can be no assurance that the results of these or any other proceedings will not materially harm our business, financial con-dition and results of operations. Moreover, even if we ultimately prevail on the merits in any such proceedings, we may have to incur substantial legal fees and other costs defending ourselves against the underlying allegations. Under certain circumstances we record a provision for risks arising from legal disputes and proceedings. In addition, we maintain liability insurance for cer-tain legal risks at levels our management believes are appropriate and consistent with industry practice. Our insurance policy, how-ever, does not protect us against reputational damage. Moreover, we may incur losses relating to legal proceedings beyond the lim-its, or outside the coverage, of such insurance or exceeding any provisions made for legal proceedings related losses. Finally, there can be no assurance that we will be able to maintain ade-quate insurance coverage on commercially reasonable terms in the future. Each of these risks may have an adverse effect on our business, financial condition and results of operations.
C.9.3.5 ASSESSMENT OF THE OVERALL RISK SITUATIONThe most significant challenges have been mentioned first in each of the four categories Strategic, Operations, Financial and Compliance with the risks caused by highly competitive mar-kets currently being our most significant. Even though the as-sessments of individual risk exposures have changed during fiscal 2014 due to developments in the external environment as well as the effects of our own mitigation measures, the overall risk situation for Siemens did not change significantly as com-pared to the prior year. At present, no risks have been identified that either individually or in combination could endanger our ability to continue as a going concern. We are confident that we can continue to successfully counter the challenges arising from the risks mentioned above.
C.9.4 Opportunities
Within our comprehensive, interactive and management-ori-ented Enterprise Risk Management (ERM) approach that is inte-grated into the organization and that addresses both risks and opportunities, we regularly identify, evaluate and respond to opportunities that present themselves in our various fields of activity. Below we describe our most significant opportunities. Unless otherwise stated, the opportunities described below

247 D. Consolidated Financial Statements 337 E. Additional Information
213 C.6 Overall assessment of the economic position 214 C.7 Subsequent events 215 C.8 Sustainability and citizenship 225 C.9 Report on expected developments and
associated material opportunities and risks
242 C.10 Compensation Report and legal disclosures 242 C.11 Siemens AG (Discussion on basis
of German Commercial Code)
239
relate to all of our segments. The order in which the opportuni-ties are presented reflects the currently estimated relative ex-posure for Siemens associated with these opportunities and thus provides an indication of the opportunities’ current impor-tance to us. Nevertheless, opportunities currently considered to entail a lower opportunity exposure could potentially result in a higher positive impact on Siemens than opportunities cur-rently considered to entail a higher opportunity exposure. The described opportunities are necessarily not the only ones we encounter. In addition, our assessment of opportunities is sub-ject to change as our Company, our markets and technologies are constantly developing. As a consequence, new opportuni-ties may arise, existing opportunities may cease to be relevant, or the significance of an opportunity may change. Generally, opportunities are assessed to the best of our knowledge, con-sidering certain assumptions, including market development, market potential of technologies or solutions, and anticipated developments in customer demand or prices, among other things. When opportunities materialize, they may have a lower effect than previously estimated on the basis of the underlying assumptions. It is also possible that opportunities we see today will never materialize.
In our view, the overall opportunity situation did not change significantly as compared to the prior year.
We constantly strive to develop new technologies, offer new products, solutions and services, and improve existing ones: We invest in new technologies that we expect will meet future demands in accordance with the megatrends demographic change, urbanization, climate change, globalization and digital transformation (for further information see C.1.3 STRATEGY). Furthermore, a growing awareness for cyber security could lead to additional business for high quality solutions offered by the former Industry Sector’s Industry Automation Division.
We see further opportunities in the growth potential of emerging markets as well as established markets: We ex-pect that in coming years growth in our markets will be driven by countries in Asia and the Middle East, in particular by coun-tries such as Indonesia and Turkey. Within One Siemens, we take measures aimed at continuously increasing our share of revenue from emerging markets. Our “Vision 2020” concept, which puts a stronger focus on getting close to customers is expected to result in higher market penetration (for further information, see C.1.3 STRATEGY).
We believe that developing the capability to design, manufac-ture and sell so-called SMART products (simple, maintenance- friendly, affordable, reliable, and timely-to-market) will pro-vide us with opportunities to gain market share and enhance our local presence in these strategic growth markets. Adding
further SMART products to our portfolio and developing stron-ger sales channels would enable us to increase our revenues by serving large and fast-growing geographic markets, where cus-tomers making a purchase decision may consider price more strongly than product features without compromising on prod-uct quality and reliability.
Through selective acquisitions, equity investments and partnerships we constantly strive to strengthen our lead-ing technology position, open up additional potential mar-kets and further develop our product portfolio: We con-stantly monitor our current and future markets for opportunities for strategic acquisitions, equity investments or partnerships to complement organic growth. Such activities could help us to strengthen our market position in our existing markets, provide access to new markets or complement our technological port-folio in selected areas.
Localizing value chain activities in low-cost countries could further improve our cost position: Localizing certain value chain activities, such as procurement, manufacturing, mainte-nance and service in markets such as the BRIC countries, other emerging markets, and the Middle East could enable us to re-duce costs and strengthen our global competitive position, in particular compared to competitors based in countries with a more favorable cost structure.
We are in the process of continuously developing and im-plementing initiatives to reduce costs, adjust capacities, improve our processes and streamline our portfolio: In an increasingly competitive market environment, a competitive cost structure complements the competitive advantage of being innovative. We believe that further improvements in our cost position can strengthen our global competitive position and secure our market presence against emerging and incum-bent competitors. For example, we expect to create sustainable value from productivity measures in connection with our “Vision 2020” (for further information, see C.1.3 STRATEGY). Moreover, fostering a stringent claim management process can help materialize opportunities by enforcing our claims towards our contract partners even stronger.
We are realigning our organization: As of November, 2013, we disbanded our Regional Cluster organization. Following this organizational change, we have designated 30 Lead Countries which are individually responsible for managing a number of other countries regarding market penetration. Each Lead Country reports directly to the Managing Board. By implement-ing this move, Siemens intends to intensify its customer access and expand its regional business. We expect this new setup to further enhance our local market penetration and our customer proximity going forward.
108 A. To our Shareholders 131 B. Corporate Governance 171 C. Combined Management Report
172 C.1 Business and economic environment 187 C.2 Financial performance system 193 C.3 Results of operations 205 C.4 Financial position 210 C.5 Net assets position
240
As of October 1, 2014, we have also eliminated the Sector level and consolidated our business activities into nine Divisions and one separately managed unit, Healthcare (for details see
C.1.1.1 ORGANIZATION AND BASIS OF PRESENTATION). This change is expected to increase our customer proximity and accelerate our decision-making. In addition, we have made governance even more stringent across all levels of our organization. Our Man-aging Board leads the Company and maintains the balance be-tween our businesses and Regions. It is supported by strong, efficient corporate governance functions, our Corporate Core, which is expected to ensure fast, nonbureaucratic deci-sion-making across key company functions (for details, see
C.1.3 STRATEGY).
C.9.5 Significant characteristics of the accountingrelated internal control and risk management system
The following discussion describes information required pursu-ant to Section 289 (5) and Section 315 (2) no. 5 of the German Commercial Code (Handelsgesetzbuch) and explanatory report.
The overarching objective of our accounting-related internal control and risk management system is to ensure that finan-cial reporting is conducted in a proper manner such that the Consolidated Financial Statements and the Combined Man-agement Report are prepared in accordance with all relevant regulations.
As described in C.9.2 RISK MANAGEMENT, our ERM approach is based on the worldwide accepted “Enterprise Risk Manage-ment – Integrated Framework” developed by the COSO. As one of the objectives of this framework is reliability of a company’s financial reporting, it also includes an accounting-related per-spective. The accounting-related internal control system (control system) implemented by us is based on Internal Control – Integrated Framework (2013), an internationally recognized framework also developed by the COSO. The two systems are complementary.
Our management is responsible for establishing and maintain-ing adequate internal control over financial reporting. At the end of each fiscal year, our management performs an evalua-tion of the effectiveness of its control system, both in design and operating effectiveness. We have a standardized procedure under which necessary controls are defined, documented in accordance with uniform standards, and tested regularly on their effectiveness. Nevertheless, there are inherent limitations in the effectiveness of any control system, and no system, in-cluding one determined to be effective, may prevent or detect all misstatements.
Our Consolidated Financial Statements are prepared on the ba-sis of a conceptual framework which primarily consists of com-pany-wide uniform Financial Reporting Guidelines and a chart of accounts, both issued centrally and to be applied consistently throughout Siemens. New laws, accounting standards, and other official announcements are analyzed on an ongoing basis with regard to their relevance and impact on the Consolidated Financial Statements and the Combined Management Report and where necessary, our Financial Reporting Guidelines and the chart of accounts are adjusted accordingly. In quarterly clos-ing letters, accounting departments of Siemens AG and its sub-sidiaries are informed about current topics from an accounting and closing process perspective and any deadlines that must be met for the respective closing processes.
The base data used in preparing the Consolidated Financial Statements consists of the closing data reported by the opera-tions of Siemens AG and its subsidiaries, which are derived from the various accounting records. The preparation of the closing data of most of our subsidiaries is supported by an internal shared services organization. Furthermore, other ac-counting activities, such as governance and monitoring related activities, are bundled on regional level. In addition, for some areas requiring specialized know-how such as valuations relat-ing to post-employment benefits support from external service providers is obtained and used. The reported closing data is used to prepare the Consolidated Financial Statements in the consolidation system. The steps necessary to prepare the Con-solidated Financial Statements are subject to both manual and automated controls at all levels.
247 D. Consolidated Financial Statements 337 E. Additional Information
213 C.6 Overall assessment of the economic position 214 C.7 Subsequent events 215 C.8 Sustainability and citizenship 225 C.9 Report on expected developments and
associated material opportunities and risks
242 C.10 Compensation Report and legal disclosures 242 C.11 Siemens AG (Discussion on basis
of German Commercial Code)
241
The specialist skills required of employees involved in the ac-counting process are assessed when the employees are initially selected; thereafter, the employees receive regular training. As a fundamental principle, at the different levels and based on materiality considerations, items must be verified by at least one other person (four eyes principle) and specific procedures must be adhered to for the authorization of the data. Additional control mechanisms include target-performance comparisons and analyses of the composition of, and changes in, individual line items, both in the closing data reported by units and in the Consolidated Financial Statements. Accounting-related IT sys-tems provide for defined access rules in order to ensure that accounting related data is protected from unauthorized access, use or modification. Every unit included in our Consolidated Financial Statements is subject to the rules and regulations of the Corporate Information Security Guide.
On a quarterly basis, an internal certification process is ex-ecuted. Management of different levels of our organization, supported by confirmations of management of entities under their responsibility, confirms the accuracy of the financial data that has been reported to Siemens’ corporate headquarters and reports on the effectiveness of the related control systems.
In addition, we have set up a Disclosure Committee – compris-ing selected heads of Corporate Units – which is responsible for reviewing certain financial and non-financial information prior to publication.
The Supervisory Board, through the Audit Committee, is also integrated into our control system. In particular, the Audit Committee oversees the accounting process, the effectiveness of the control system, the risk management system and the internal audit system, and the independent audit of financial statements. In addition, it conducts an audit of the documents related to the Annual Financial Statements of Siemens AG and the Consolidated Financial Statements and discusses the Annual Financial Statements of Siemens AG, the Consolidated Financial Statements and Combined Management Report of these statements with the Managing Board and the indepen-dent auditors.
Through audits on a continuous and Siemens wide basis our internal corporate audit function monitors compliance with our guidelines and the reliability and functional operation of our control system as well as the adequacy and effectiveness of our risk management system.
In addition we have rules for accounting-related complaints and a Code of Ethics for Financial Matters.
ADDITIONAL INFORMATION RELATED TO THE ANNUAL FINANCIAL STATEMENTS OF SIEMENS AG (GERMAN COMMERCIAL CODE)Siemens AG as the parent company of the Siemens Group is integrated into the company-wide accounting-related internal control system described above. Generally, the information set out above also applies for Annual Financial Statements of Siemens AG prepared in accordance with the German Com-mercial Code.
The Consolidated Financial Statements are prepared in accor-dance with IFRS. Where required, i.e. for purposes of preparing statements for local regulatory or tax purposes, data is adopted in accordance with relevant regulations by means of reconcili-ation at account level. Accordingly, accurately determined IFRS closing data also forms an important basis for the Annual Financial Statements of Siemens AG. In the case of Siemens AG and other group companies required to prepare financial state-ments in accordance with German Commercial Code, the conceptual framework described above is complemented by mandatory regulations specific to German Commercial Code within our Financial Reporting Guidelines and a German Com-mercial Code chart of accounts. The manual and system-based control mechanisms referred to above generally also apply when reconciling the IFRS closing data to the Annual Financial Statements of Siemens AG.
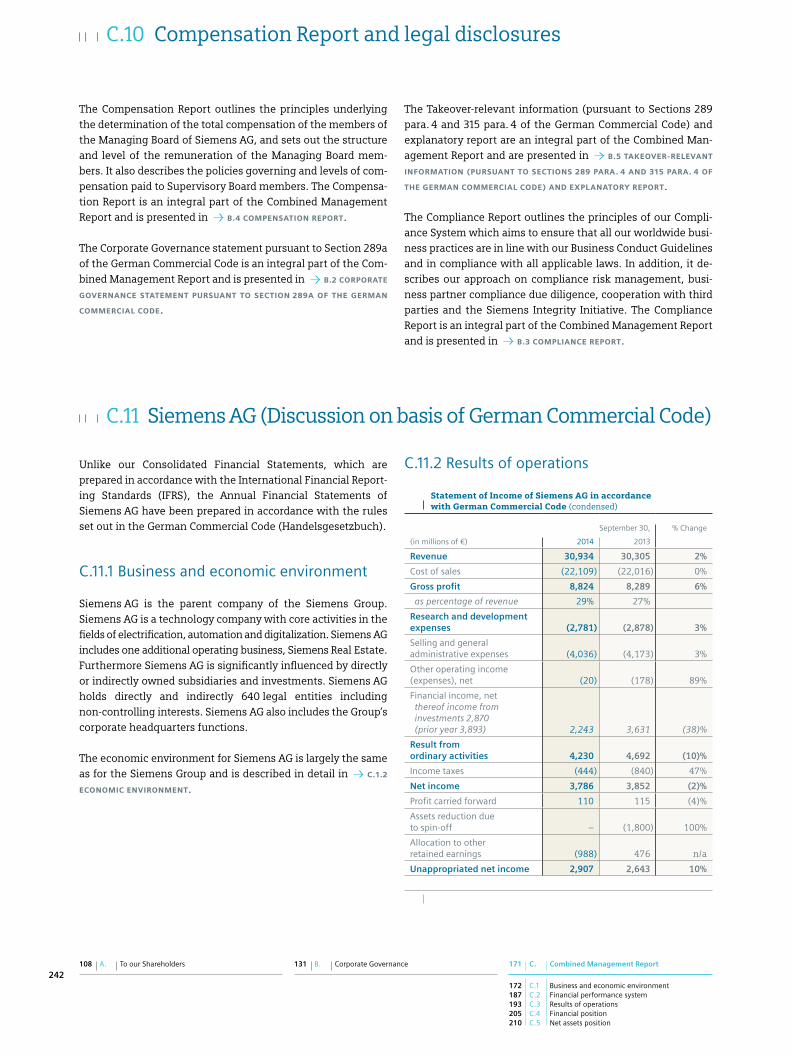
108 A. To our Shareholders 131 B. Corporate Governance 171 C. Combined Management Report
172 C.1 Business and economic environment 187 C.2 Financial performance system 193 C.3 Results of operations 205 C.4 Financial position 210 C.5 Net assets position
242
The Compensation Report outlines the principles underlying the determination of the total compensation of the members of the Managing Board of Siemens AG, and sets out the structure and level of the remuneration of the Managing Board mem-bers. It also describes the policies governing and levels of com-pensation paid to Supervisory Board members. The Compensa-tion Report is an integral part of the Combined Management Report and is presented in B.4 COMPENSATION REPORT.
The Corporate Governance statement pursuant to Section 289a of the German Commercial Code is an integral part of the Com-bined Management Report and is presented in B.2 CORPORATE
GOVERNANCE STATEMENT PURSUANT TO SECTION 289A OF THE GERMAN
COMMERCIAL CODE.
The Takeover-relevant information (pursuant to Sections 289 para. 4 and 315 para. 4 of the German Commercial Code) and explanatory report are an integral part of the Combined Man-agement Report and are presented in B.5 TAKEOVER-RELEVANT
INFORMATION (PURSUANT TO SECTIONS 289 PARA. 4 AND 315 PARA. 4 OF
THE GERMAN COMMERCIAL CODE) AND EXPLANATORY REPORT.
The Compliance Report outlines the principles of our Compli-ance System which aims to ensure that all our worldwide busi-ness practices are in line with our Business Conduct Guidelines and in compliance with all applicable laws. In addition, it de-scribes our approach on compliance risk management, busi-ness partner compliance due diligence, cooperation with third parties and the Siemens Integrity Initiative. The Compliance Report is an integral part of the Combined Management Report and is presented in B.3 COMPLIANCE REPORT.
C.10 Compensation Report and legal disclosures
C.11 Siemens AG (Discussion on basis of German Commercial Code)
Unlike our Consolidated Financial Statements, which are prepared in accordance with the International Financial Report-ing Standards (IFRS), the Annual Financial Statements of Siemens AG have been prepared in accordance with the rules set out in the German Commercial Code (Handelsgesetzbuch).
C.11.1 Business and economic environment
Siemens AG is the parent company of the Siemens Group. Siemens AG is a technology company with core activities in the fields of electrification, automation and digitalization. Siemens AG includes one additional operating business, Siemens Real Estate. Furthermore Siemens AG is significantly influenced by directly or indirectly owned subsidiaries and investments. Siemens AG holds directly and indirectly 640 legal entities including non-controlling interests. Siemens AG also includes the Group’s corporate headquarters functions.
The economic environment for Siemens AG is largely the same as for the Siemens Group and is described in detail in C.1.2
ECONOMIC ENVIRONMENT.
C.11.2 Results of operations
Statement of Income of Siemens AG in accordance with German Commercial Code (condensed)
(in millions of €)
September 30, % Change
2014 2013
Revenue 30,934 30,305 2%
Cost of sales (22,109) (22,016) 0%
Gross profit 8,824 8,289 6%
as percentage of revenue 29% 27%
Research and development expenses (2,781) (2,878) 3%
Selling and general administrative expenses (4,036) (4,173) 3%
Other operating income (expenses), net (20) (178) 89%
Financial income, net thereof income from investments 2,870 (prior year 3,893) 2,243 3,631 (38)%
Result from ordinary activities 4,230 4,692 (10)%
Income taxes (444) (840) 47%
Net income 3,786 3,852 (2)%
Profit carried forward 110 115 (4)%
Assets reduction due to spinoff – (1,800) 100%
Allocation to other retained earnings (988) 476 n / a
Unappropriated net income 2,907 2,643 10%
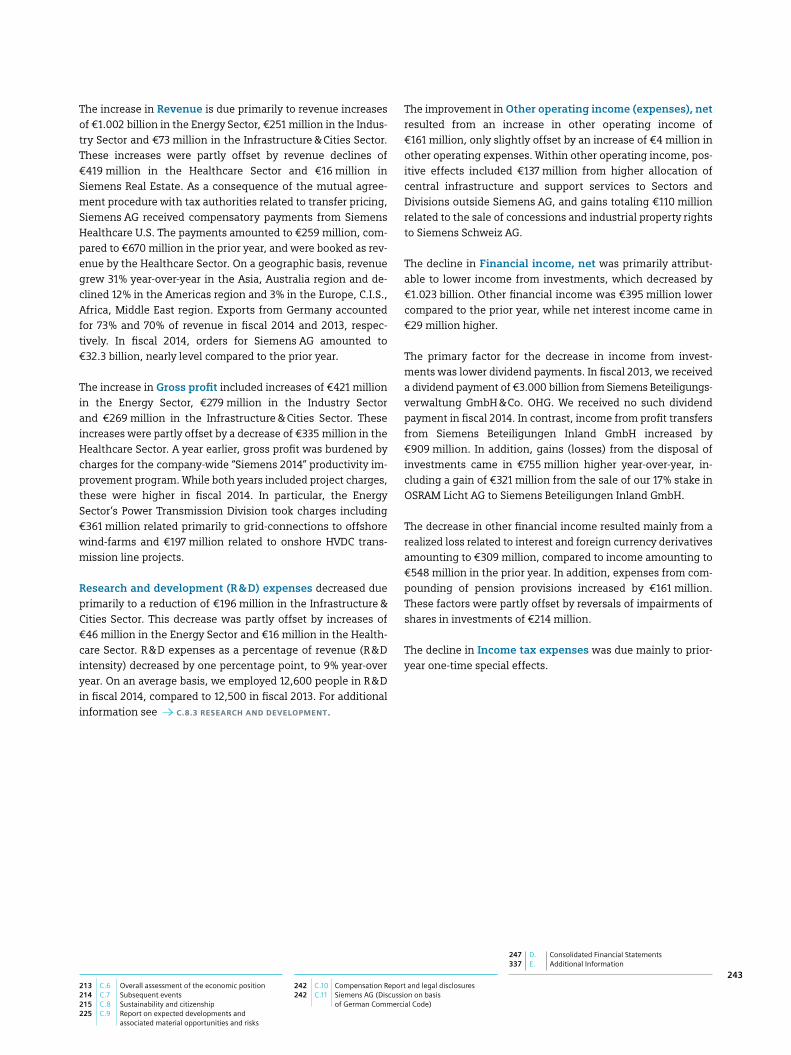
247 D. Consolidated Financial Statements 337 E. Additional Information
213 C.6 Overall assessment of the economic position 214 C.7 Subsequent events 215 C.8 Sustainability and citizenship 225 C.9 Report on expected developments and
associated material opportunities and risks
242 C.10 Compensation Report and legal disclosures 242 C.11 Siemens AG (Discussion on basis
of German Commercial Code)
243
The increase in Revenue is due primarily to revenue increases of € 1.002 billion in the Energy Sector, € 251 million in the Indus-try Sector and € 73 million in the Infrastructure & Cities Sector. These increases were partly offset by revenue declines of € 419 million in the Healthcare Sector and € 16 million in Siemens Real Estate. As a consequence of the mutual agree-ment procedure with tax authorities related to transfer pricing, Siemens AG received compensatory payments from Siemens Healthcare U.S. The payments amounted to € 259 million, com-pared to € 670 million in the prior year, and were booked as rev-enue by the Healthcare Sector. On a geographic basis, revenue grew 31 % year-over-year in the Asia, Australia region and de-clined 12 % in the Americas region and 3 % in the Europe, C.I.S., Africa, Middle East region. Exports from Germany accounted for 73 % and 70 % of revenue in fiscal 2014 and 2013, respec-tively. In fiscal 2014, orders for Siemens AG amounted to € 32.3 billion, nearly level compared to the prior year.
The increase in Gross profit included increases of € 421 million in the Energy Sector, € 279 million in the Industry Sector and € 269 million in the Infrastructure & Cities Sector. These increases were partly offset by a decrease of € 335 million in the Healthcare Sector. A year earlier, gross profit was burdened by charges for the company-wide “Siemens 2014” productivity im-provement program. While both years included project charges, these were higher in fiscal 2014. In particular, the Energy Sector’s Power Transmission Division took charges including € 361 million related primarily to grid-connections to offshore wind-farms and € 197 million related to onshore HVDC trans-mission line projects.
Research and development (R & D) expenses decreased due primarily to a reduction of € 196 million in the Infrastructure & Cities Sector. This decrease was partly offset by increases of € 46 million in the Energy Sector and € 16 million in the Health-care Sector. R & D expenses as a percentage of revenue (R & D intensity) decreased by one percentage point, to 9 % year-over year. On an average basis, we employed 12,600 people in R & D in fiscal 2014, compared to 12,500 in fiscal 2013. For additional information see C.8.3 RESEARCH AND DEVELOPMENT.
The improvement in Other operating income (expenses), net resulted from an increase in other operating income of € 161 million, only slightly offset by an increase of € 4 million in other operating expenses. Within other operating income, pos-itive effects included € 137 million from higher allocation of central infrastructure and support services to Sectors and Divisions outside Siemens AG, and gains totaling € 110 million related to the sale of concessions and industrial property rights to Siemens Schweiz AG.
The decline in Financial income, net was primarily attribut-able to lower income from investments, which decreased by € 1.023 billion. Other financial income was € 395 million lower compared to the prior year, while net interest income came in € 29 million higher.
The primary factor for the decrease in income from invest-ments was lower dividend payments. In fiscal 2013, we received a dividend payment of € 3.000 billion from Siemens Beteiligungs-verwaltung GmbH & Co. OHG. We received no such dividend payment in fiscal 2014. In contrast, income from profit transfers from Siemens Beteiligungen Inland GmbH increased by € 909 million. In addition, gains (losses) from the disposal of investments came in € 755 million higher year-over-year, in-cluding a gain of € 321 million from the sale of our 17 % stake in OSRAM Licht AG to Siemens Beteiligungen Inland GmbH.
The decrease in other financial income resulted mainly from a realized loss related to interest and foreign currency derivatives amounting to € 309 million, compared to income amounting to € 548 million in the prior year. In addition, expenses from com-pounding of pension provisions increased by € 161 million. These factors were partly offset by reversals of impairments of shares in investments of € 214 million.
The decline in Income tax expenses was due mainly to prior- year one-time special effects.

108 A. To our Shareholders 131 B. Corporate Governance 171 C. Combined Management Report
172 C.1 Business and economic environment 187 C.2 Financial performance system 193 C.3 Results of operations 205 C.4 Financial position 210 C.5 Net assets position
244
C.11.3 Net assets and financial position
Statement of Financial Position of Siemens AG in accordance with German Commercial Code (condensed)
September 30, % Change
(in millions of €) 2014 2013
Assets
Noncurrent assets
Intangible and tangible assets 2,419 2,437 (1)%
Financial assets 42,121 40,530 4%
44,540 42,967 4%
Current assets
Receivables and other assets 15,816 17,032 (7)%
Cash and cash equivalents, securities 2,672 2,282 17%
18,488 19,313 (4)%
Prepaid expenses 111 75 48%
Deferred tax assets 2,222 2,467 (10)%
Active difference resulting from offsetting 40 46 (13)%
Total assets 65,400 64,868 1%
Liabilities and equity
Equity 18,798 18,295 3%
Special reserve with an equity portion 759 767 (1)%
Provisions
Pensions and similar commitments 11,103 10,432 6%
Other provisions 7,369 7,827 (6)%
18,472 18,260 1%
Liabilities
Liabilities to banks 208 138 51%
Advanced payments received 677 1,349 (50)%
Trade payables, liabilities to affiliated companies and other liabilities 26,189 25,771 2%
27,075 27,257 (1)%
Deferred income 296 290 2%
Total liabilities and equity 65,400 64,868 1%
The increase in Financial assets was due primarily to the pur-chase of a 14.26 % stake in Atos SE from Siemens Beteiligungen Inland GmbH amounting to € 779 million and a capital increase of € 500 million relating to Siemens Bank GmbH. In addition, loans increased € 297 million and securities in non-current assets came in € 350 million higher. These increases were partly offset by the sale of our 17 % stake in OSRAM Licht AG to Siemens Beteiligungen Inland GmbH. The sale price amounted to € 715 million and the book value amounted to € 395 million.
The decline in Receivables and other assets was due primar-ily to lower receivables from affiliated companies as a result of intra-group financing activities.
Cash and cash equivalents and marketable securities are significantly affected by the liquidity management of Siemens AG. The liquidity management is based on the finance strategy of the Siemens Group. Therefore, the change in liquid-ity of Siemens AG resulted not only from business activities of Siemens AG.
The increase in Equity was attributable to net income for the year of € 3.786 billion and issuance of treasury stock of € 330 million in conjunction with our share-based compensa-tion program. These factors were partly offset by dividends paid in fiscal 2014 (for fiscal 2013) of € 2.533 billion (for additional information see C.2.5 DIVIDEND AND SHARE BUYBACKS). In addi-tion, the equity reduction was due to share buybacks during the year amounting to € 1.079 billion. The equity ratios at Sep-tember 30, 2014 and 2013 were 29 % and 28 %, respectively.
The increase in Pension and similar commitments included interest and service costs amounting to € 1.007 billion and the effect from the adjustment of the discount rate amounting to € 277 million. These factors were partly offset by pension pay-ments amounting to € 514 million.
The decrease in Other provisions was due primarily to a de-crease of € 176 million in provisions for personnel expenses and a decline of € 98 million in provisions for operating expenses.
The increase in Trade payables, liabilities to affiliated com-panies and other liabilities was due primarily to higher liabil-ities to affiliated companies as a result of intra-group financing activities.
247 D. Consolidated Financial Statements 337 E. Additional Information
213 C.6 Overall assessment of the economic position 214 C.7 Subsequent events 215 C.8 Sustainability and citizenship 225 C.9 Report on expected developments and
associated material opportunities and risks
242 C.10 Compensation Report and legal disclosures 242 C.11 Siemens AG (Discussion on basis
of German Commercial Code)
245
C.11.4 Employees
Indicators
Year ended September 30,
2014 2013
Employee turnover rate 1 4.1% 3.0%
Female employees in management positions (percentage of all management positions) 2 11.8% 11.3%
Expenses for continuing education (in millions of €) 3 98 94
Expenses per employee for continuing education (in €) 3 919 864
1 Employee turnover rate is defined as the ratio of voluntary and involuntary exits from Siemens AG during the fiscal year to the average number of employees.
2 Employees in management positions include all managers with disciplinary responsibility, plus project managers.
3 Without travel expenses.
As of September 30, 2014 and 2013, the numbers of employees were 106,860 and 108,234 respectively.
Employees of Siemens AG as of September 30, 2014 (in thousands)
Energy: 25 (24%)
Healthcare: 10 (10%)
Industry: 36 (33%)
Siemens Real Estate: 2 (2%)
Other: 8 (8%)
Infrastructure & Cities: 26 (24%)
107
For additional information see C.8.2 EMPLOYEES.
C.11.5 Subsequent events
There have been no events of particular significance since the end of fiscal 2014.
C.11.6 Risks and opportunities
The business development of Siemens AG is fundamentally subject to the same risks and opportunities as the Siemens Group. Siemens AG generally participates in the risks of its sub-sidiaries and equity investments in line with its percentage of each holding. For additional information see C.9.3 RISKS and
C.9.4 OPPORTUNITIES.
As the parent company of the Siemens Group, Siemens AG is integrated into the group-wide risk management system. For additional information see C.9.2 RISK MANAGEMENT.
The description of the internal control system for Siemens AG required by Section 289 para. 5 of the German Commercial Code is included in C.9.5 SIGNIFICANT CHARACTERISTICS OF THE ACCOUNT-
ING RELATED INTERNAL CONTROL AND RISK MANAGEMENT SYSTEM.
For additional information regarding the use of financial instruments see NOTES TO THE ANNUAL FINANCIAL STATEMENTS OF
SIEMENS AG.
C.11.7 Outlook
Due to the interrelations between Siemens AG and its subsid-iaries and the relative size of Siemens AG within the Group, the outlook of the Group also largely reflects our expectations for Siemens AG. We expect that the anticipated market and rev-enue developments for fiscal 2015 described in statements made by the Siemens Group will be mainly reflected in the revenue of Siemens AG. In fiscal 2015, we continue to execute the Group’s “Vision 2020” concept. In particular, we expect that gains from divestments will significantly influence the profit of Siemens AG. For additional information see C.9.1 REPORT ON
EXPECTED DEVELOPMENTS.
We intend to continue providing an attractive return to share-holders. Therefore in the years ahead we intend to propose a dividend payout of 40 % to 60 % of net income of Siemens Group, which for this purpose we may adjust to exclude selected exceptional non-cash effects.


![Kra Combined Report v2[1]](https://static.fdocuments.net/doc/165x107/577cc16e1a28aba7119305b5/kra-combined-report-v21.jpg)