SIE 265 Warehouse Design Project - Group 10 (1)
33
Warehouse Design Project Group 10: Hassan Alsaleh, Keely Chiou, Elizabeth Hernandez, Chris Miller, Morgan Skillman, & Lorelei Wong SIE 265 Mike O’Brien 7 December 2016
-
Upload
christopher-miller -
Category
Documents
-
view
65 -
download
0
Transcript of SIE 265 Warehouse Design Project - Group 10 (1)
Warehouse Design Project
Group 10:
Hassan Alsaleh, Keely Chiou, Elizabeth Hernandez, Chris Miller, Morgan Skillman, & Lorelei
Wong
SIE 265
Mike O’Brien
7 December 2016

Group 10 – Page 1
Table of Contents
Document 1 …………………………………………………………………………………… 02
Document 2 …………………………………………………………………………………… 08
Document 3 …………………………………………………………………………………… 11
Document 4 …………………………………………………………………………………… 26
Document 5 …………………………………………………………………………………… 30
Group 10 – Page 2
Warehouse Design Project
Document 1: Concept of Operations
Group 10:
Hassan Alsaleh, Keely Chiou, Elizabeth Hernandez, Chris Miller, Morgan Skillman, & Lorelei
Wong
SIE 265
Mike O’Brien
7 December 2016
Group 10 – Page 3
Table of Contents
1. Purpose of the Document ………………………………………………………………… 04
2. Scope of the Project ……………………………………………………………………… 04
3. Referenced Documents …………………………………………………………………… 04
4. Background ………………………………………………………………………………… 04
5. Concept for the Proposed System ………………………………………………………… 04
6. User-Oriented Operation Description ……………………………………………………… 05
7. Operational Needs ………………………………………………………………………… 05
8. System Overview ………………………………………………………………………… 05
9. Operational Environment ………………………………………………………………… 05
10. Support Environment ……………………………………………………………………… 05
11. Operational Scenarios ……………………………………………………………………… 06
12. Operational Impact ………………………………………………………………………… 06
13. Appendices ………………………………………………………………………………… 07
Group 10 – Page 4
1. Purpose of the Document
This document describes the characteristics of the proposed warehouse design project system
from the viewpoint of the system user. The intention of the document is to communicate all
quantitative and qualitative system characteristics to the audience, or stakeholders. The main
purpose of this document is to employ the capabilities of the proposed system to the given
requirements and to find the best model in terms of cost, time, and employee satisfaction.
The content of this document will cover and overview of the project, as well as the concept
and the operations of the system.
2. Scope of the Project
The end goal of the project is to propose three warehouse systems that optimize a picking and
packaging system for a single product company. The project will include a suggested
allocation of resources for a warehouse involving only the company that the warehouse
belongs to. Using MATLAB, Simulink models will simulate the different pick line
combinations that the group has chosen. Each combination will be scored on a zero to one
scale, based on performance, cost, and employee satisfaction, which will be weighed into a
final score that follows that same scale. The warehouse system simulation that produces the
highest score will be the recommended system.
3. Referenced Documents
Lecture materials were referenced for the document.
“8.4.5 Concept of Operations Template.” California Division | Federal Highway
Administration. N.p., 20 Sept. 2016. Web. 04 Dec. 2016.
4. Background
The company currently has available technology (manual and ARS lines) prepared, as well as
demand orders that are required every two hours in the day. The warehouse is effective as it
can complete orders, however, system designs could improve by lowering the operation cost
required to complete the work. The efficiency of the entire system will increase by making
the cost as low as possible, while still meeting all the demand drops throughout the day.
5. Concept for the Proposed System
The concept for the proposed system was structured by first, modelling the demands that are
dropped every two hours. A selected pick-line combination was then modelled in its own
subsystem, showing how the demand drops for the given technology combinations were met.
Scoring was then done using a separate subsystem. Through this grouping of subsystems,
technology combinations could be inserted and scored easily. Other options would be to
model the different technology options separately (one manual subsystem and one ARS
subsystem) to make these simulations easier to change out, but this way, the model is kept
more simple by not making complicated and interchangeable subsystems.
Group 10 – Page 5
6. User-Oriented Operation Description
The stakeholders include the company management, staff, employees, and investors. The
users of the project results are the company managers. The management will make the final
decision regarding allocation of resources. From there, staff and employees will adjust to any
schedule changes. The system may result in either workers needed to fulfill orders. Workers
promoted to operators will need to be trained to handle the ARS machines.
7. Operational Needs
The operational needs are dependent on 3 main categories: customers, stakeholders, and
warehouse system. Customers must be attracted by the satisfaction which the warehouse
provides, and can be met by finishing dropped orders on time, and by minimizing production
costs. Stakeholders, on the other hand, fund the company to make the warehouse running. To
get stakeholders, a great deal of analysis of the system, cost, and profit must be done. Lastly,
the warehouse system must have the best score, while also considering employee happiness.
8. System Overview
The scope of the system is based upon operational cost, capital cost, preferred shift time, and
whether orders are finished within 2 hours. The customers then must focus on the cost of
packaging orders on time. The main goal of the system in terms of the user is finishing orders
quickly and cost efficiently. The system operation can be described through the following
process. First, administration receives the number of orders that must be packaged. Second,
workers are hired, on a need-basis, based upon the order numbers, and the number of needed
pick lines are determined. Lastly, workers should finish orders on time, an ideal, so machines
can be temporarily shut down earlier, to save running costs. The line of communication in
this scenario would be the administration, which links the workers and customers.
9. Operational Environment
The environment of the system depends upon number of orders, overall operational costs, as
well as employee shift satisfaction. Ideally, employees want to work from 8 AM to 4 PM.
Employees must be trained for this kind of work and must have good experience in dealing
with environmental circumstances. The lower the overall cost for production, the better. In
addition, as orders are completed, the system will shut down to further help lower operational
cost. On the other hand, the number of orders would make a difference on the cost and profit,
because as the number of orders increases, the higher the employee demand us, thus
increasing the running cost and capital cost (8.4.5 Concept of Operations Template).
10. Support Environment
The physical support environment includes facilities, utilities, equipment, and the system
hardware and software. The facilities consist of both the administration and its workers. The
administration deals with the system hardware and software, as well as financials (salaries
Group 10 – Page 6
and costs). The utilities are always in favor of the customers, as better utilities will provide
more customers. Utilities consist of freight, quality of packaging, as well as customer service.
The equipment needed for running the systems are the lines (manual and ARS, and a plan).
11. Operational Scenarios
The demand, i.e. the orders, drop to the warehouse every two hours throughout the day every
day. When orders come in, employees on shift begin to work on the first manual line.
However, if there are more than four employees on shift, since there can only be a maximum
of four operators on a line at a time, the second manual line is turned on to operate. In the
case that more than eight operators show up to a shift, operators shall be sent home until the
total number of employees on shift reaches eight or less. When employees have completed
the existing orders and are waiting for the next demand to drop, they will be instructed to
organize and clean in preparation for the next round. Maintenance to both manual lines is
expected to be done throughout the day with check-ups at least once every two weeks.
If by any reason a new demand drops before the previous orders are completed, employees
are expected to continue working on the previous orders. They are not to start working on the
new demand until they have completed all other orders. Employees are expected to keep
record of demands drops and completion time, and report this data and information monthly.
In case of a failure with one of the manual lines, all employees will relocate to the working
line. If there are more than four employees on shift, the remaining employees are expected to
examine the failure and contact the correct people to fix it or else take care of it themselves
(depending on what the issue that brought upon the failure is). Otherwise all employees are
expected to continue working on the orders until they are finished with the current orders
(unless the problem is severe enough to require immediate attention or evacuation).
12. Operational Impact
Company Management
Orders are dropped every 2 hours around the clock on even hours. Employees are first
directed to a single line, and fill it up. If necessary, the rest of the employees will be directed
to the second line. Each employee can complete 240 orders in a 2-hour period on the manual
line. If there are more than 960 orders being dropped at that time, 960 orders will go to the
first line with 4 pickers, and the remaining orders and pickers will populate the second line. If
the pickers on shift complete the dropped orders before the end of the 2-hour period, the line
will be turned off to minimize costs. Throughout this system, there is only one 8-hour shift
(the peak hours shift) where 8 workers will be needed to work, whereas for the other 2 8-hour
shifts only one worker will be needed. During this peak hour shift, both lines may need to be
run, based upon the number of orders dropped at the beginning of each 2-hour period.

Group 10 – Page 7
Employees
Shifts will be scheduled between 10 PM-6 AM, 6 AM-2 PM, and 2-10 PM. The 2-10 PM
shift will be the shift that will have 8 employees, while the other two shifts will only have
one worker scheduled. This is because peak hours for dropped orders occur between 4 and 10
PM. Seeing as this shift doesn’t occur during preferred work hours, employees will be rotated
between the different shifts so everyone will have a shared responsibility and fairness for the
graveyard shifts. Employees will not be required as of now, to be cross trained on manual
and ARS lines. The proposed design only requires employees to be trained on manual
operations. When order are dropped at the start of every even hour, up to 4 pickers are
assigned to a single line with up to 240 orders per picker being placed in that line’s queue. A
maximum of 8 workers can be on shift at once, and can be split evenly between the two lines
if necessary. When all orders are complete, lines are shut off in order to minimize costs.
Investors
The proposed system of 2 manual lines will not impact the budget for capital costs. This
allows investors to use allocate money originally designated for warehouse design elsewhere
within the company that could also use improvements. This dual manual line system design
has the lowest operating costs compared to the other two proposed system designs. This
system aims to maximize the efficiency of on-shift employees to complete the orders within
each 2-hour period. By doing this, customers are satisfied that orders are being fulfilled in a
timely manner, which will thus increase the reliability reputation of the company. A
company reliable in the eyes of customers will normally experience growth and profit
increases when correctly operated.
13. Appendices
The company warehouse currently uses ARS (automated Retrieval System) and Manual pick
lines. The company is able to determine the current demand levels. That is why the
warehouse system needed to restructure by talking to stakeholders to implement the most
desired system.

Group 10 – Page 8
Warehouse Design Project
Document 2: Requirements
Group 10:
Hassan Alsaleh, Keely Chiou, Elizabeth Hernandez, Chris Miller, Morgan Skillman, & Lorelei
Wong
SIE 265
Mike O’Brien
7 December 2016
Group 10 – Page 9
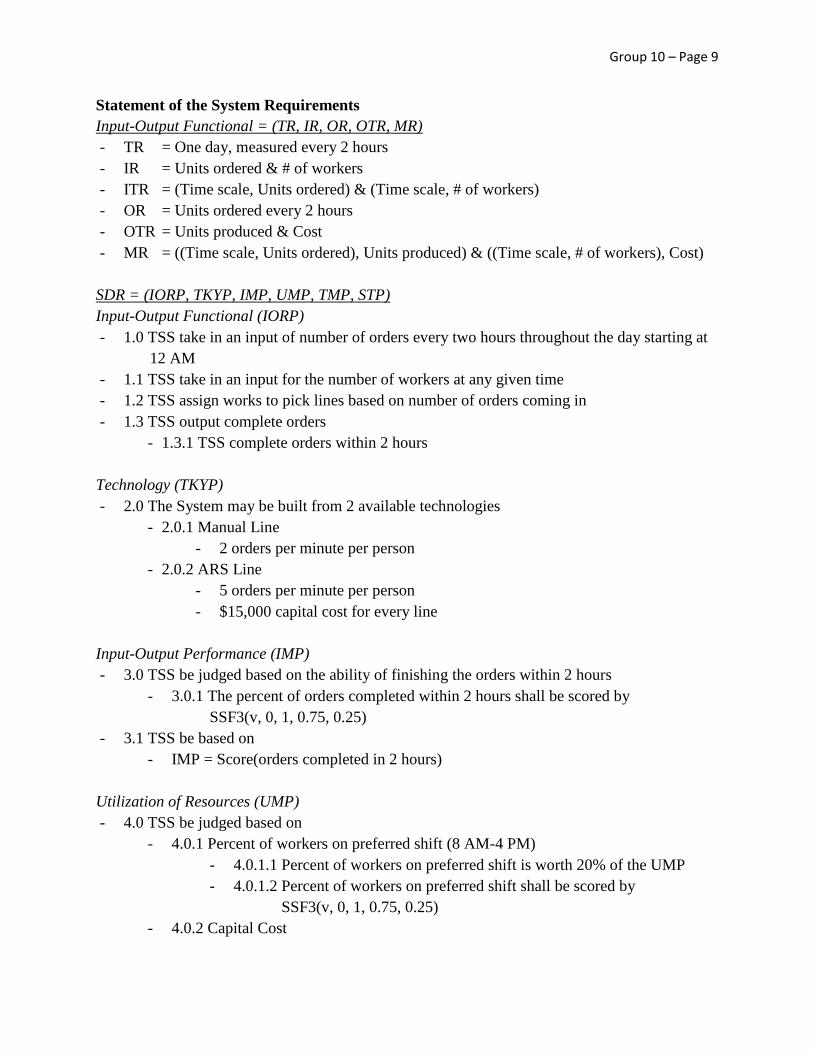
Statement of the System Requirements
Input-Output Functional = (TR, IR, OR, OTR, MR)
- TR = One day, measured every 2 hours
- IR = Units ordered & # of workers
- ITR = (Time scale, Units ordered) & (Time scale, # of workers)
- OR = Units ordered every 2 hours
- OTR = Units produced & Cost
- MR = ((Time scale, Units ordered), Units produced) & ((Time scale, # of workers), Cost)
SDR = (IORP, TKYP, IMP, UMP, TMP, STP)
Input-Output Functional (IORP)
- 1.0 TSS take in an input of number of orders every two hours throughout the day starting at
12 AM
- 1.1 TSS take in an input for the number of workers at any given time
- 1.2 TSS assign works to pick lines based on number of orders coming in
- 1.3 TSS output complete orders
- 1.3.1 TSS complete orders within 2 hours
Technology (TKYP)
- 2.0 The System may be built from 2 available technologies
- 2.0.1 Manual Line
- 2 orders per minute per person
- 2.0.2 ARS Line
- 5 orders per minute per person
- $15,000 capital cost for every line
Input-Output Performance (IMP)
- 3.0 TSS be judged based on the ability of finishing the orders within 2 hours
- 3.0.1 The percent of orders completed within 2 hours shall be scored by
SSF3(v, 0, 1, 0.75, 0.25)
- 3.1 TSS be based on
- IMP = Score(orders completed in 2 hours)
Utilization of Resources (UMP)
- 4.0 TSS be judged based on
- 4.0.1 Percent of workers on preferred shift (8 AM-4 PM)
- 4.0.1.1 Percent of workers on preferred shift is worth 20% of the UMP
- 4.0.1.2 Percent of workers on preferred shift shall be scored by
SSF3(v, 0, 1, 0.75, 0.25)
- 4.0.2 Capital Cost

Group 10 – Page 10
- 4.0.2.1 Capital cost is worth 50% of the UMP
- 4.0.2.2 Capital cost shall be scored by SSF9(v, 0, 45000, 15000, -1/7500)
- 4.0.3 Operating Cost
- 4.0.3.1 Operating cost is worth 30% of the UMP
- 4.0.3.2 Operating cost shall be scored by SSF&(v, 0, 2500, -1/1250)
- 4.1 TSS be judged based on
- UMP = Score(preferred shift)*0.2 + Score(capital cost)*0.5
+ Score(operating cost)*0.3
Trade-Off (TMP)
- 5.0 The trade-off shall be made based on a 67-33 split between IMP & UMP
- 5.0.1 Score = 2/3 (IMP) + 1/3 (UMP)
System Test Requirements (STP)
- 6.0 TSS be tested for 30 days after installation to determine if the performance estimates are
within 5% of estimates used in analysis

Group 10 – Page 11
Warehouse Design Project
Document 3: System Design Concepts
Group 10:
Hassan Alsaleh, Keely Chiou, Elizabeth Hernandez, Chris Miller, Morgan Skillman, & Lorelei
Wong
SIE 265
Mike O’Brien
7 December 2016
Group 10 – Page 12
The design requires that the system will pick and package single products after orders are
dropped every 2 hours throughout the day beginning at 12am. There are two possible types of
pick lines: a manual line and an automated line. Up to three pick lines can fit into the warehouse.
All lines will shut down when not in use and will not be running if there are no orders in their
queue. The company prefers that all orders be completed within 2 hours of being dropped into
the system.
Each line can hold up to four pickers or operators for the manual and automated lines
respectively. Each picker on manual lines can complete 2 orders every minute and each operator
on automated lines can complete 5 orders every minute. Manual lines cost $50/hour for power
while ARS lines cost $15,000/line to buy and $350/hour for power.
Workers must be scheduled in full 8 hour shifts and are paid $12/hr. During these 8 hours it is
assumed that the workers can be shifted between lines if needed.
Our focus for designing the three models is to maximize the efficiency of how many workers are
on shift at a time. It was assumed that because they have the ability to change lines partway
through each 2 hour period, they would also be cross trained and able to work both the manual
and ARS lines.
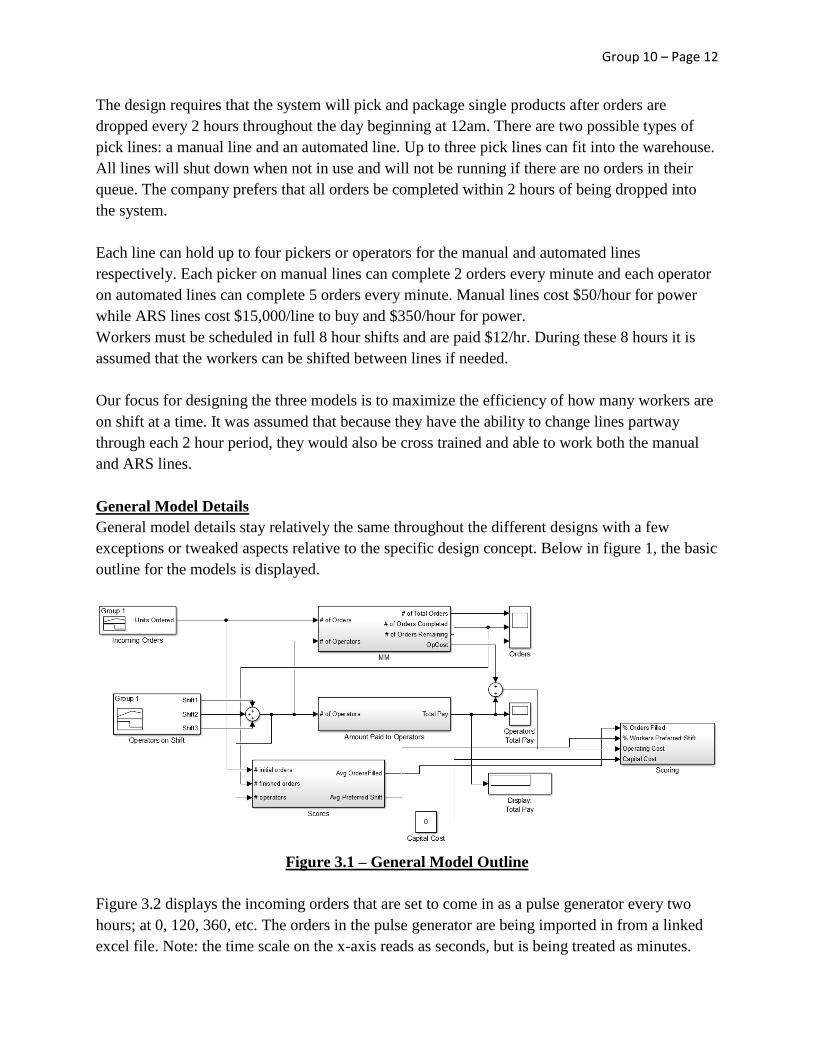
General Model Details
General model details stay relatively the same throughout the different designs with a few
exceptions or tweaked aspects relative to the specific design concept. Below in figure 1, the basic
outline for the models is displayed.
Figure 3.1 – General Model Outline
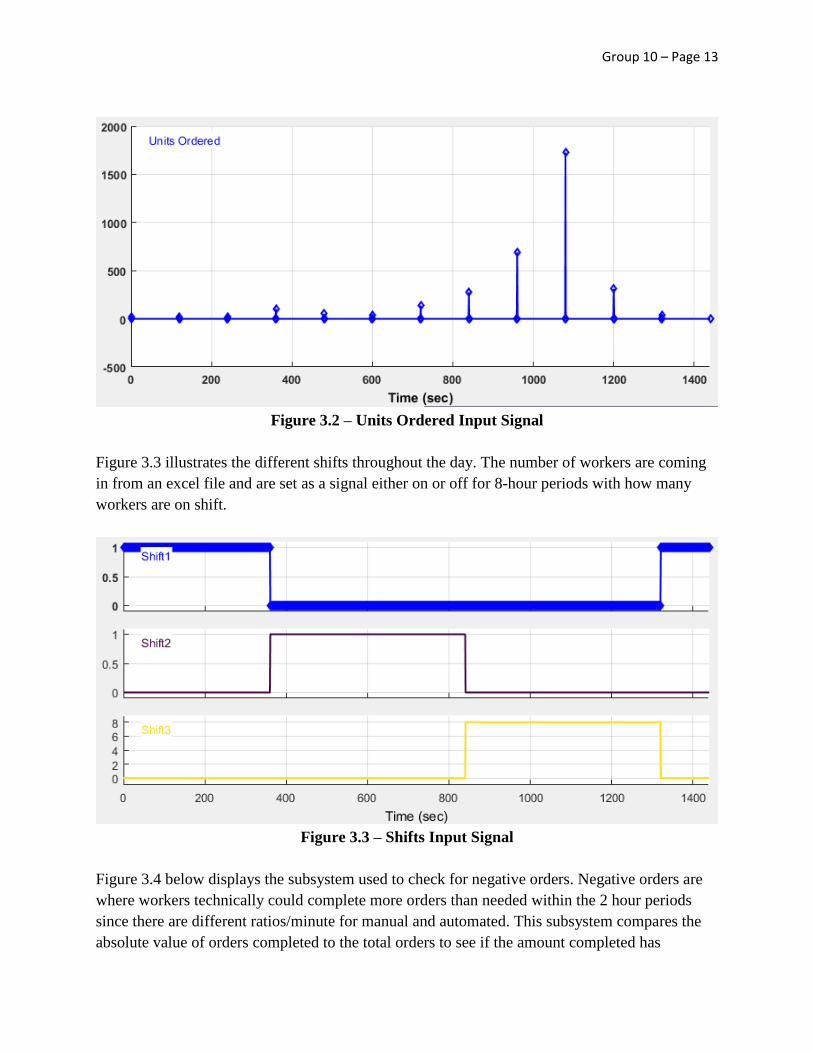
Figure 3.2 displays the incoming orders that are set to come in as a pulse generator every two
hours; at 0, 120, 360, etc. The orders in the pulse generator are being imported in from a linked
excel file. Note: the time scale on the x-axis reads as seconds, but is being treated as minutes.
Group 10 – Page 13
Figure 3.2 – Units Ordered Input Signal
Figure 3.3 illustrates the different shifts throughout the day. The number of workers are coming
in from an excel file and are set as a signal either on or off for 8-hour periods with how many
workers are on shift.
Figure 3.3 – Shifts Input Signal
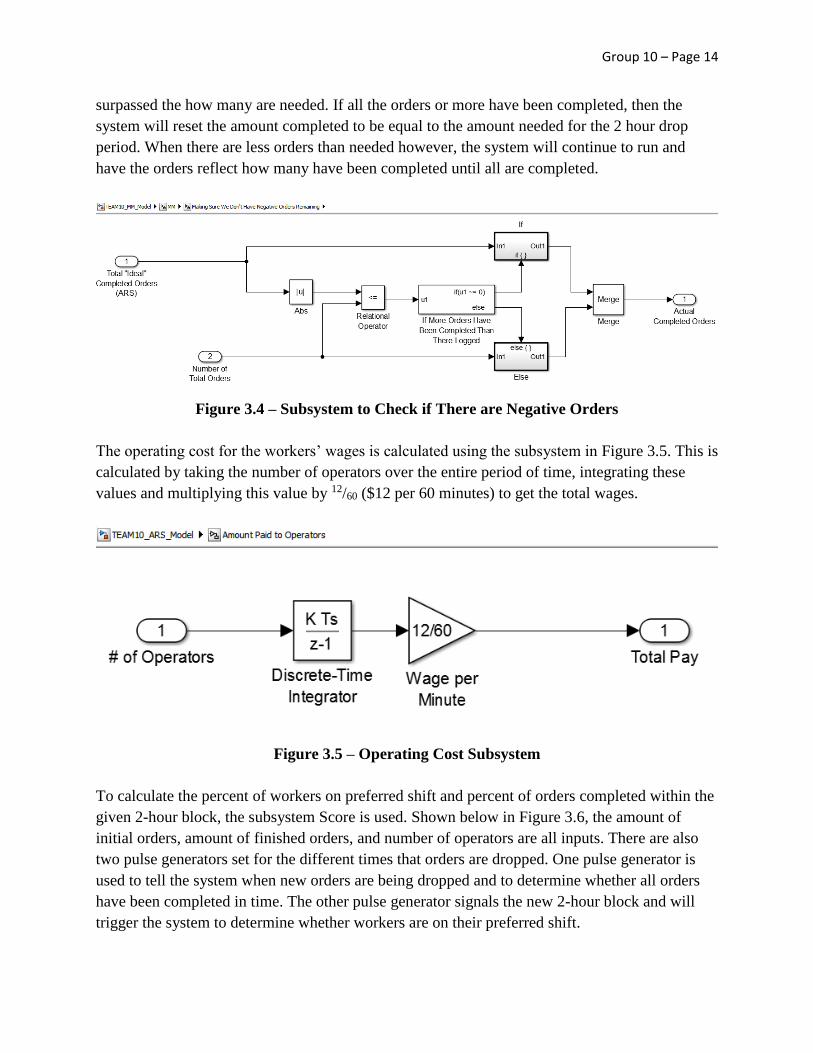
Figure 3.4 below displays the subsystem used to check for negative orders. Negative orders are
where workers technically could complete more orders than needed within the 2 hour periods
since there are different ratios/minute for manual and automated. This subsystem compares the
absolute value of orders completed to the total orders to see if the amount completed has
Group 10 – Page 14
surpassed the how many are needed. If all the orders or more have been completed, then the
system will reset the amount completed to be equal to the amount needed for the 2 hour drop
period. When there are less orders than needed however, the system will continue to run and
have the orders reflect how many have been completed until all are completed.
Figure 3.4 – Subsystem to Check if There are Negative Orders
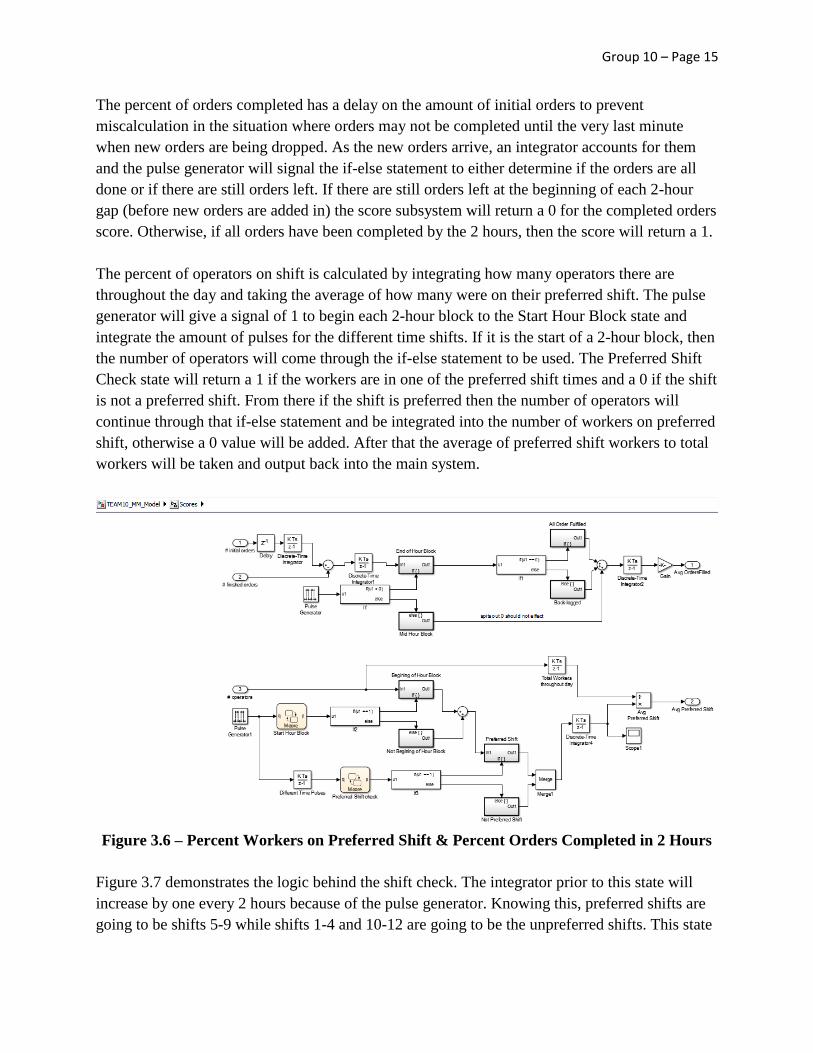
The operating cost for the workers’ wages is calculated using the subsystem in Figure 3.5. This is
calculated by taking the number of operators over the entire period of time, integrating these
values and multiplying this value by 12/60 ($12 per 60 minutes) to get the total wages.
Figure 3.5 – Operating Cost Subsystem
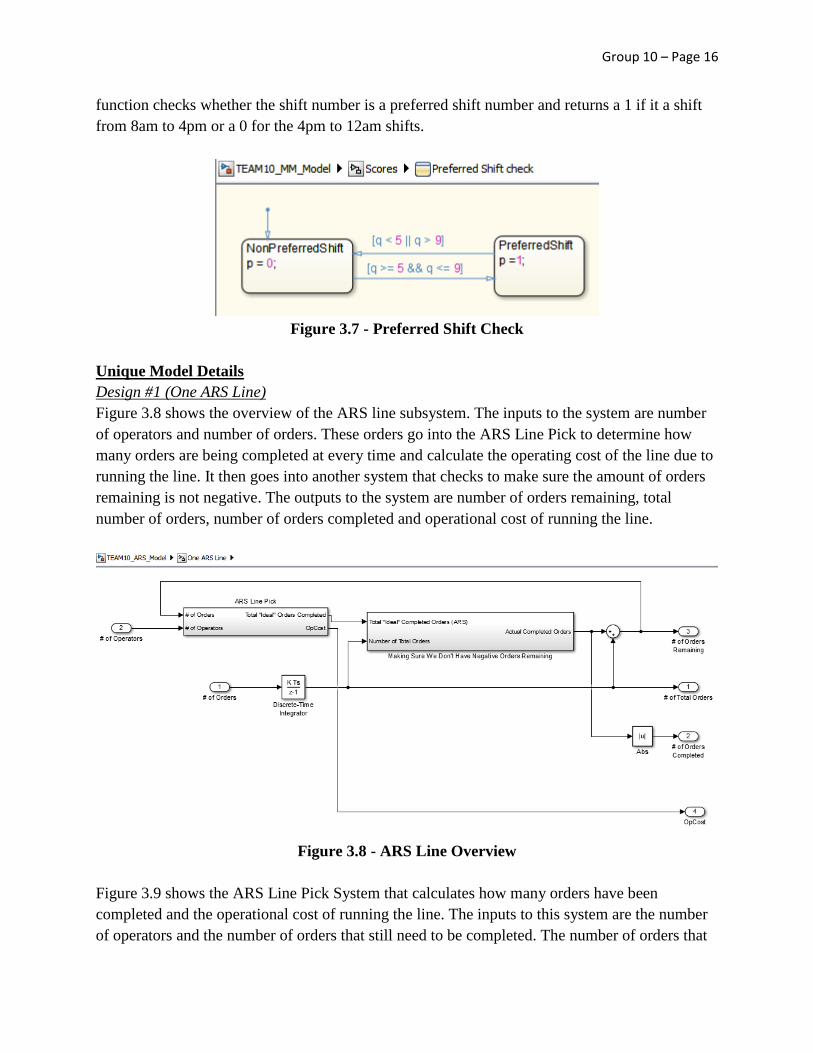
To calculate the percent of workers on preferred shift and percent of orders completed within the
given 2-hour block, the subsystem Score is used. Shown below in Figure 3.6, the amount of
initial orders, amount of finished orders, and number of operators are all inputs. There are also
two pulse generators set for the different times that orders are dropped. One pulse generator is
used to tell the system when new orders are being dropped and to determine whether all orders
have been completed in time. The other pulse generator signals the new 2-hour block and will
trigger the system to determine whether workers are on their preferred shift.
Group 10 – Page 15
The percent of orders completed has a delay on the amount of initial orders to prevent
miscalculation in the situation where orders may not be completed until the very last minute
when new orders are being dropped. As the new orders arrive, an integrator accounts for them
and the pulse generator will signal the if-else statement to either determine if the orders are all
done or if there are still orders left. If there are still orders left at the beginning of each 2-hour
gap (before new orders are added in) the score subsystem will return a 0 for the completed orders
score. Otherwise, if all orders have been completed by the 2 hours, then the score will return a 1.
The percent of operators on shift is calculated by integrating how many operators there are
throughout the day and taking the average of how many were on their preferred shift. The pulse
generator will give a signal of 1 to begin each 2-hour block to the Start Hour Block state and
integrate the amount of pulses for the different time shifts. If it is the start of a 2-hour block, then
the number of operators will come through the if-else statement to be used. The Preferred Shift
Check state will return a 1 if the workers are in one of the preferred shift times and a 0 if the shift
is not a preferred shift. From there if the shift is preferred then the number of operators will
continue through that if-else statement and be integrated into the number of workers on preferred
shift, otherwise a 0 value will be added. After that the average of preferred shift workers to total
workers will be taken and output back into the main system.
Figure 3.6 – Percent Workers on Preferred Shift & Percent Orders Completed in 2 Hours
Figure 3.7 demonstrates the logic behind the shift check. The integrator prior to this state will
increase by one every 2 hours because of the pulse generator. Knowing this, preferred shifts are
going to be shifts 5-9 while shifts 1-4 and 10-12 are going to be the unpreferred shifts. This state
Group 10 – Page 16
function checks whether the shift number is a preferred shift number and returns a 1 if it a shift
from 8am to 4pm or a 0 for the 4pm to 12am shifts.
Figure 3.7 - Preferred Shift Check
Unique Model Details
Design #1 (One ARS Line)
Figure 3.8 shows the overview of the ARS line subsystem. The inputs to the system are number
of operators and number of orders. These orders go into the ARS Line Pick to determine how
many orders are being completed at every time and calculate the operating cost of the line due to
running the line. It then goes into another system that checks to make sure the amount of orders
remaining is not negative. The outputs to the system are number of orders remaining, total
number of orders, number of orders completed and operational cost of running the line.
Figure 3.8 - ARS Line Overview
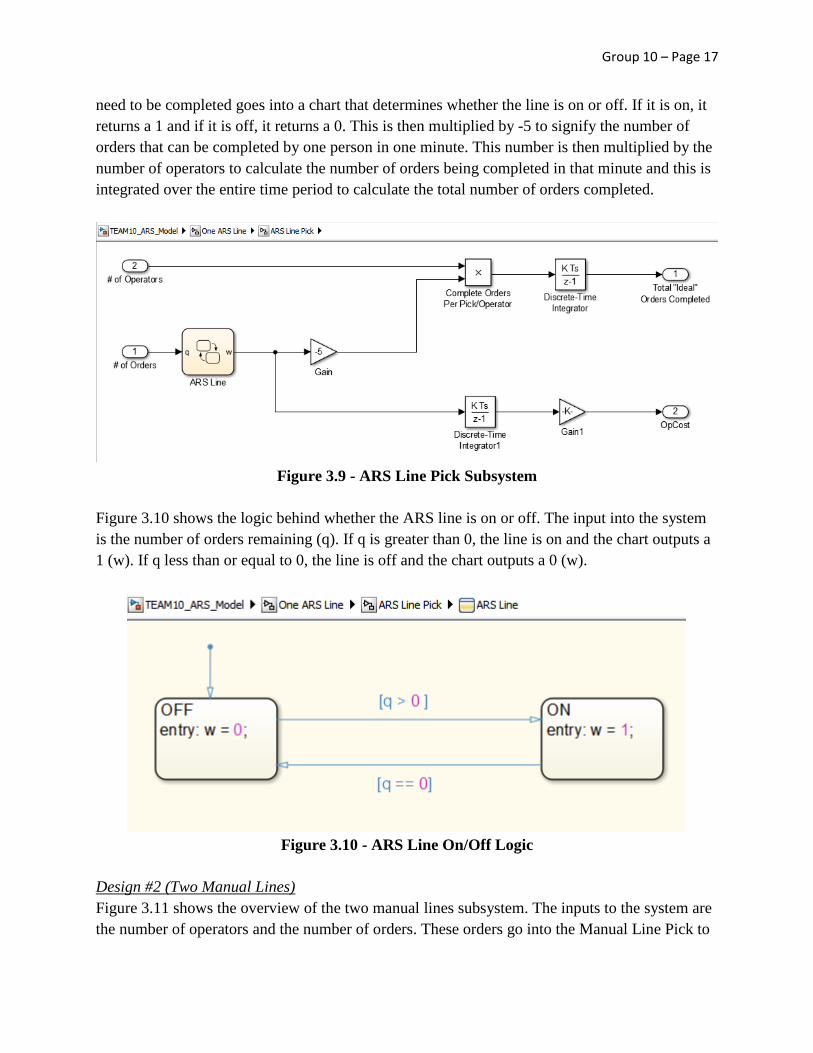
Figure 3.9 shows the ARS Line Pick System that calculates how many orders have been
completed and the operational cost of running the line. The inputs to this system are the number
of operators and the number of orders that still need to be completed. The number of orders that
Group 10 – Page 17
need to be completed goes into a chart that determines whether the line is on or off. If it is on, it
returns a 1 and if it is off, it returns a 0. This is then multiplied by -5 to signify the number of
orders that can be completed by one person in one minute. This number is then multiplied by the
number of operators to calculate the number of orders being completed in that minute and this is
integrated over the entire time period to calculate the total number of orders completed.
Figure 3.9 - ARS Line Pick Subsystem
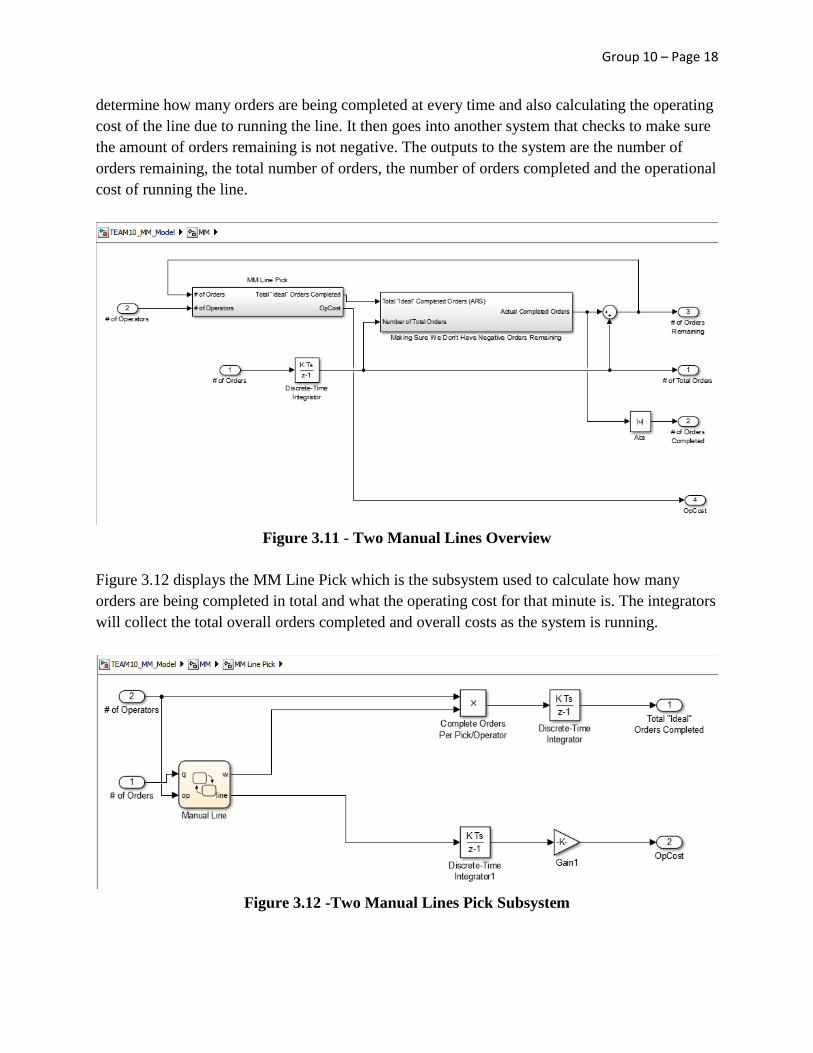
Figure 3.10 shows the logic behind whether the ARS line is on or off. The input into the system
is the number of orders remaining (q). If q is greater than 0, the line is on and the chart outputs a
1 (w). If q less than or equal to 0, the line is off and the chart outputs a 0 (w).
Figure 3.10 - ARS Line On/Off Logic
Design #2 (Two Manual Lines)
Figure 3.11 shows the overview of the two manual lines subsystem. The inputs to the system are
the number of operators and the number of orders. These orders go into the Manual Line Pick to
Group 10 – Page 18
determine how many orders are being completed at every time and also calculating the operating
cost of the line due to running the line. It then goes into another system that checks to make sure
the amount of orders remaining is not negative. The outputs to the system are the number of
orders remaining, the total number of orders, the number of orders completed and the operational
cost of running the line.
Figure 3.11 - Two Manual Lines Overview
Figure 3.12 displays the MM Line Pick which is the subsystem used to calculate how many
orders are being completed in total and what the operating cost for that minute is. The integrators
will collect the total overall orders completed and overall costs as the system is running.
Figure 3.12 -Two Manual Lines Pick Subsystem

Group 10 – Page 19
Figure 3.13 shows the logic behind whether no lines, one line or two lines are running. The
inputs to the chart are the number of orders remaining (q) and the number of operators (op). The
outputs to the system are the number of orders completed during a specific time by one person
(w) and the number of lines that are running at any given time (line). If q is equal to zero, no
lines are running and the system outputs w=0 and line=0. If q is greater than zero and op is less
than or equal to four, then one line is running and it outputs w=-2 and line=1. If q is greater than
zero and op is greater than four, then two lines are running and it outputs w=-2 and line=2.
Figure 3.13 - Two Manual Lines On/Off Logic
Design #3 (One Manual and One ARS Line)
For the Manual/ARS design, the ideal situation would be to complete all orders manually due to
low operational costs, however, the incoming number of orders sometimes outnumber the low
amount of orders that each worker can complete every two hours on the manual pick line. The
number of incoming orders will determine how many operators will go to each line.
A chart diagram will be printed and displayed in several easy-to-see places within the warehouse
with a range of values dictating how many orders and workers will go to each line. It will be easy
enough to read for employees to just count how many workers there are, check the amount of
orders dropped, and then look at where the categories intersect to see the specific breakdown.
Figure 3.14 shows the overview of the one ARS line and one manual line subsystem. The inputs
to the system are number of operators on shift and number of orders. The number of operators
goes into several subsystems and charts, that determine which pick operators will work at. Then
Group 10 – Page 20
the numbers go into subsystems of their respective picks, and outputs of these subsystems (and
inputted number of orders) go into a subsystem that adds amount of completed orders together to
ensure that the amount of orders remaining does not go into negatives. The outputs of the system
are the number of orders remaining, total number of orders, and number of orders completed.
Since operation of the manual and ARS line have each been explained on Design #1 and #2, this
document portion will only discuss how this design determines which pick operators will work.
Figure 3.14 - One ARS, One Manual Overview
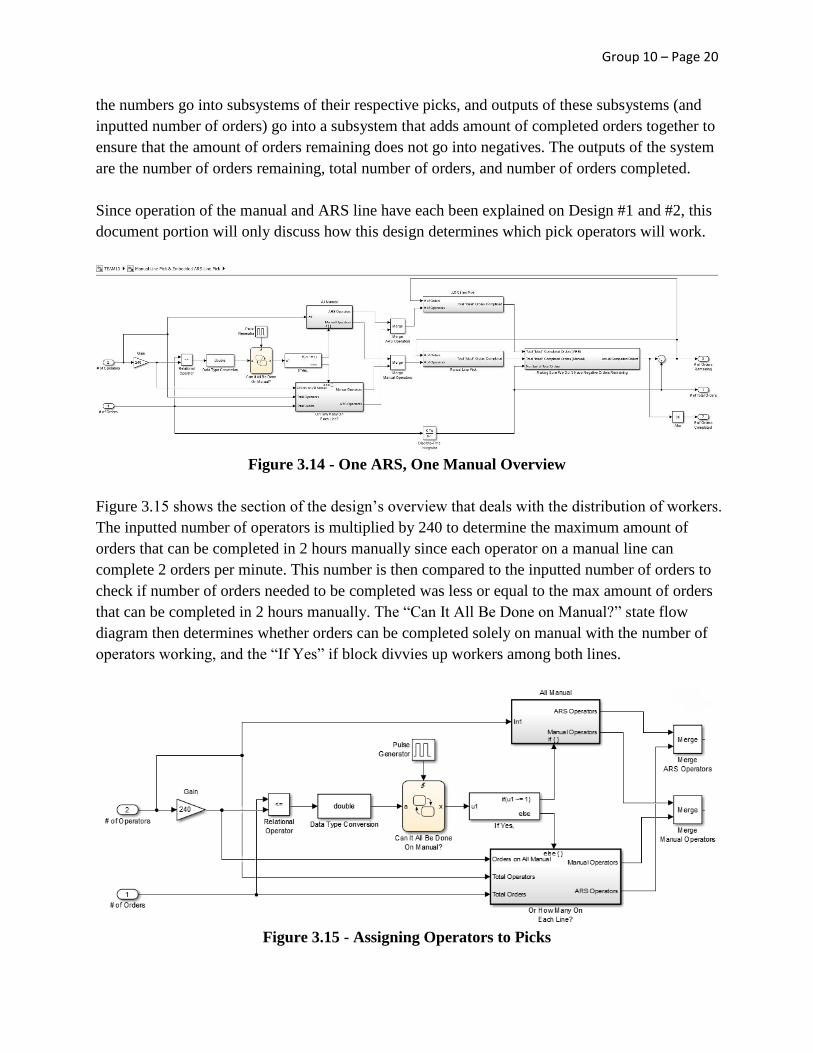
Figure 3.15 shows the section of the design’s overview that deals with the distribution of workers.
The inputted number of operators is multiplied by 240 to determine the maximum amount of
orders that can be completed in 2 hours manually since each operator on a manual line can
complete 2 orders per minute. This number is then compared to the inputted number of orders to
check if number of orders needed to be completed was less or equal to the max amount of orders
that can be completed in 2 hours manually. The “Can It All Be Done on Manual?” state flow
diagram then determines whether orders can be completed solely on manual with the number of
operators working, and the “If Yes” if block divvies up workers among both lines.
Figure 3.15 - Assigning Operators to Picks
Group 10 – Page 21
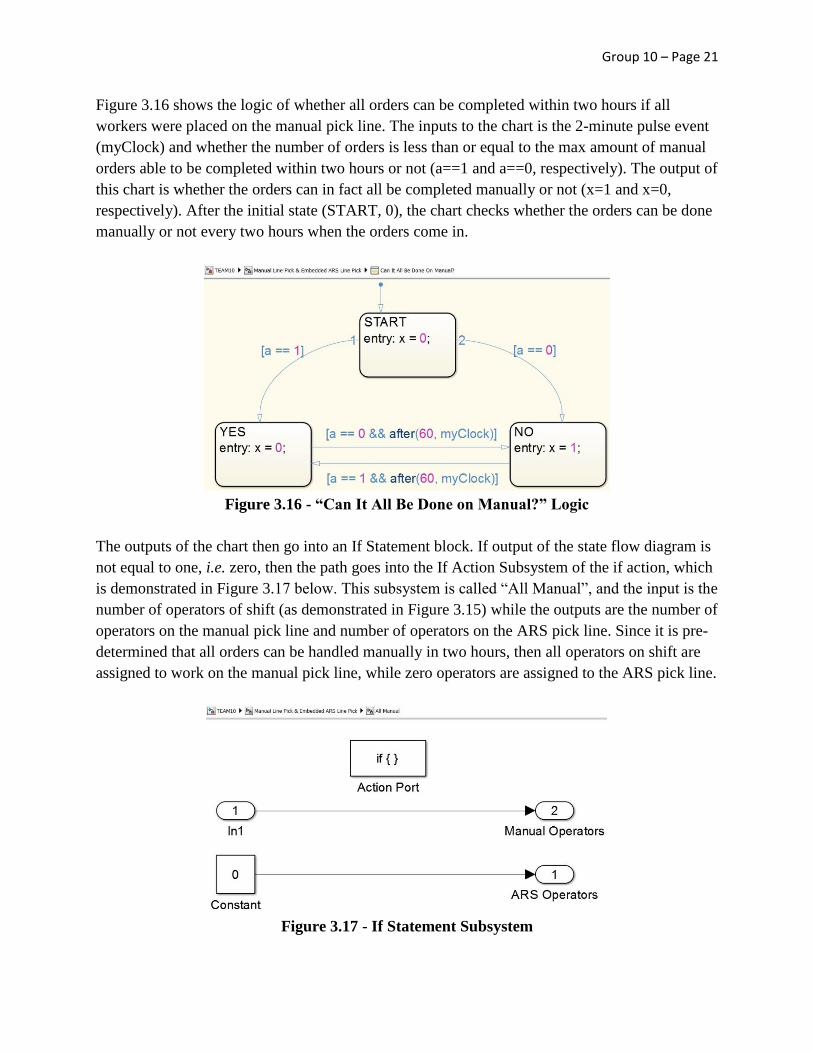
Figure 3.16 shows the logic of whether all orders can be completed within two hours if all
workers were placed on the manual pick line. The inputs to the chart is the 2-minute pulse event
(myClock) and whether the number of orders is less than or equal to the max amount of manual
orders able to be completed within two hours or not (a==1 and a==0, respectively). The output of
this chart is whether the orders can in fact all be completed manually or not (x=1 and x=0,
respectively). After the initial state (START, 0), the chart checks whether the orders can be done
manually or not every two hours when the orders come in.
Figure 3.16 - “Can It All Be Done on Manual?” Logic
The outputs of the chart then go into an If Statement block. If output of the state flow diagram is
not equal to one, i.e. zero, then the path goes into the If Action Subsystem of the if action, which
is demonstrated in Figure 3.17 below. This subsystem is called “All Manual”, and the input is the
number of operators of shift (as demonstrated in Figure 3.15) while the outputs are the number of
operators on the manual pick line and number of operators on the ARS pick line. Since it is pre-
determined that all orders can be handled manually in two hours, then all operators on shift are
assigned to work on the manual pick line, while zero operators are assigned to the ARS pick line.
Figure 3.17 - If Statement Subsystem

Group 10 – Page 22
However, if the state flow diagram of Figure 3.16 outputs a one, the path goes into the If Action
Subsystem of the else action, which is demonstrated in Figure 3.18 below. This subsystem is
called “Or How Many on Each Line?”, and the inputs are the maximum amount of orders that
can be completed manually within the 2-hour time frame and the inputted number of orders. The
latter number is divided by the former number to determine how many times greater the number
of orders is than the number of manageable orders.
Figure 3.18 - Else Statement Subsystem
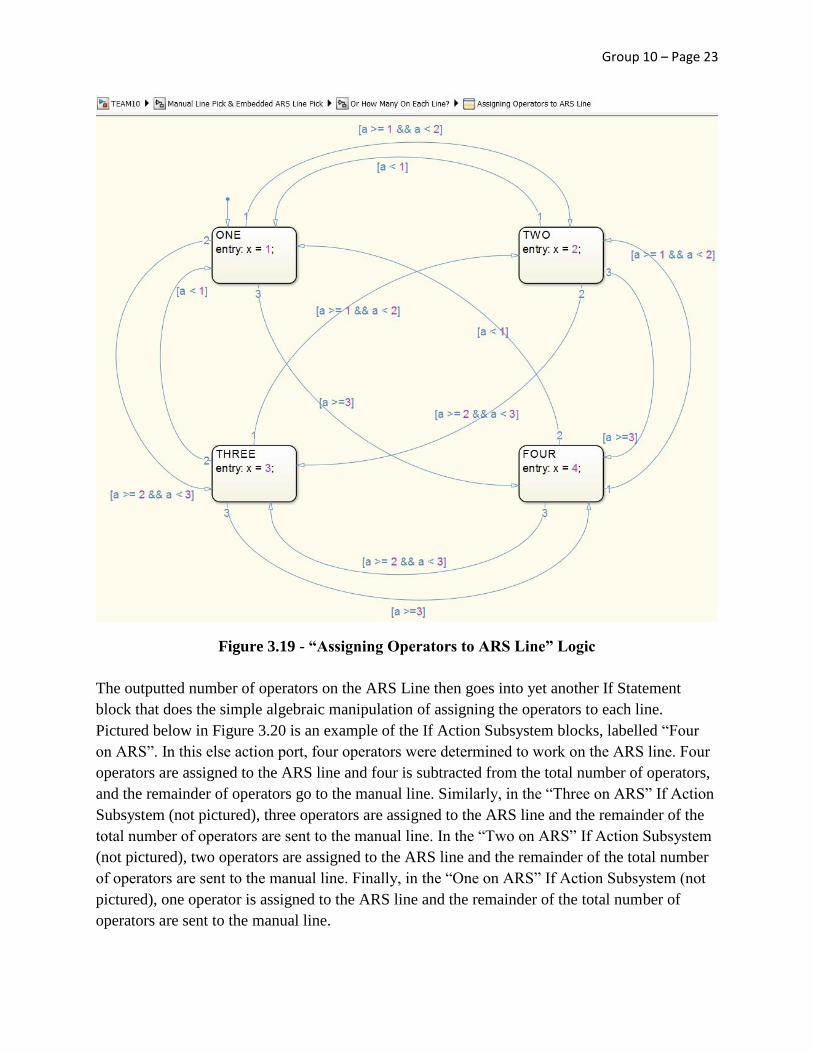
This number then becomes the input (a) to the state flow diagram labelled “Assigning Operators
to ARS Line”, pictured in Figure 3.19 below. The output (and the states, coincidentally) of the
chart is the number of operators that will be assigned to the ARS line. If the number of orders is
less than one time larger than the max amount of manual orders (a < 1), then one operator is
assigned to the ARS pick line. If the number of orders greater than or equal to one time larger
and less than twice larger than the max amount of manual orders (a >= 1 && a < 2), then two
operators are assigned to the ARS line. If the number of orders greater than or equal to twice
larger and less than three times larger than the max amount of manual orders (a >= 2 && a < 3),
then three operators are assigned to the ARS line. If the number of orders greater than or equal to
three times larger than the max amount of manual orders (a >= 3), then four operators are
assigned to the ARS line. The pattern ends here since there can only be a maximum amount of
four workers on the ARS line at a time.
Group 10 – Page 23
Figure 3.19 - “Assigning Operators to ARS Line” Logic
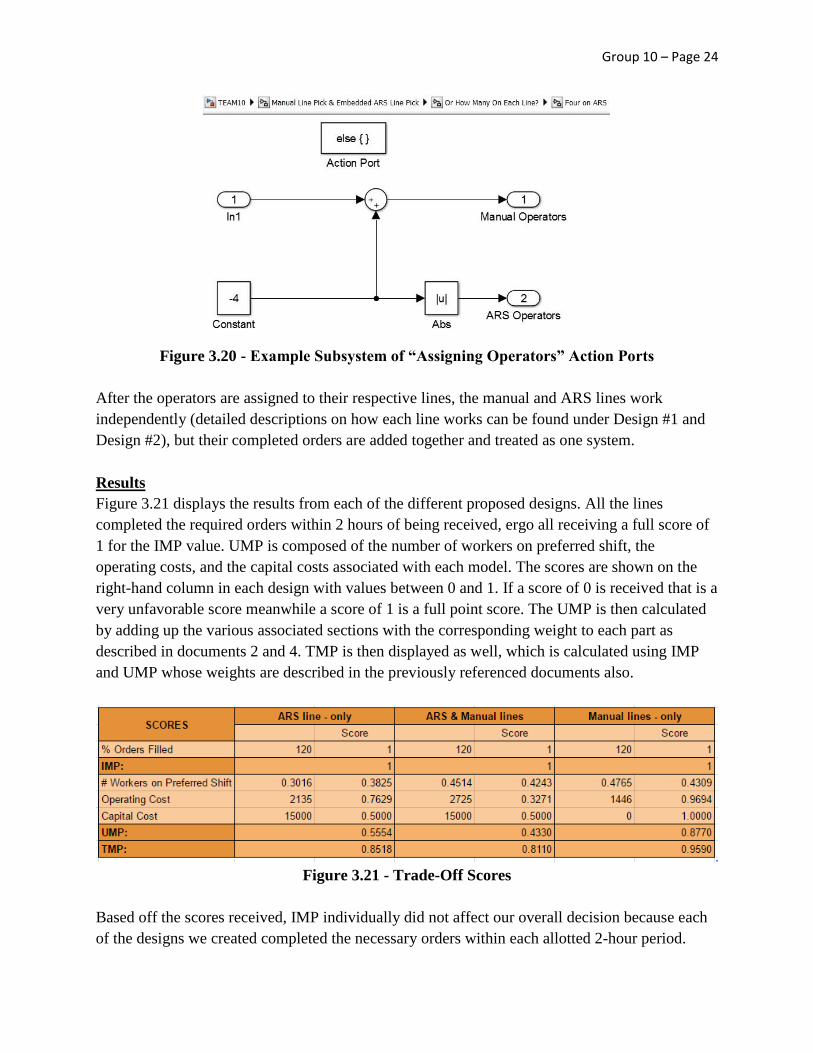
The outputted number of operators on the ARS Line then goes into yet another If Statement
block that does the simple algebraic manipulation of assigning the operators to each line.
Pictured below in Figure 3.20 is an example of the If Action Subsystem blocks, labelled “Four
on ARS”. In this else action port, four operators were determined to work on the ARS line. Four
operators are assigned to the ARS line and four is subtracted from the total number of operators,
and the remainder of operators go to the manual line. Similarly, in the “Three on ARS” If Action
Subsystem (not pictured), three operators are assigned to the ARS line and the remainder of the
total number of operators are sent to the manual line. In the “Two on ARS” If Action Subsystem
(not pictured), two operators are assigned to the ARS line and the remainder of the total number
of operators are sent to the manual line. Finally, in the “One on ARS” If Action Subsystem (not
pictured), one operator is assigned to the ARS line and the remainder of the total number of
operators are sent to the manual line.
Group 10 – Page 24
Figure 3.20 - Example Subsystem of “Assigning Operators” Action Ports
After the operators are assigned to their respective lines, the manual and ARS lines work
independently (detailed descriptions on how each line works can be found under Design #1 and
Design #2), but their completed orders are added together and treated as one system.
Results
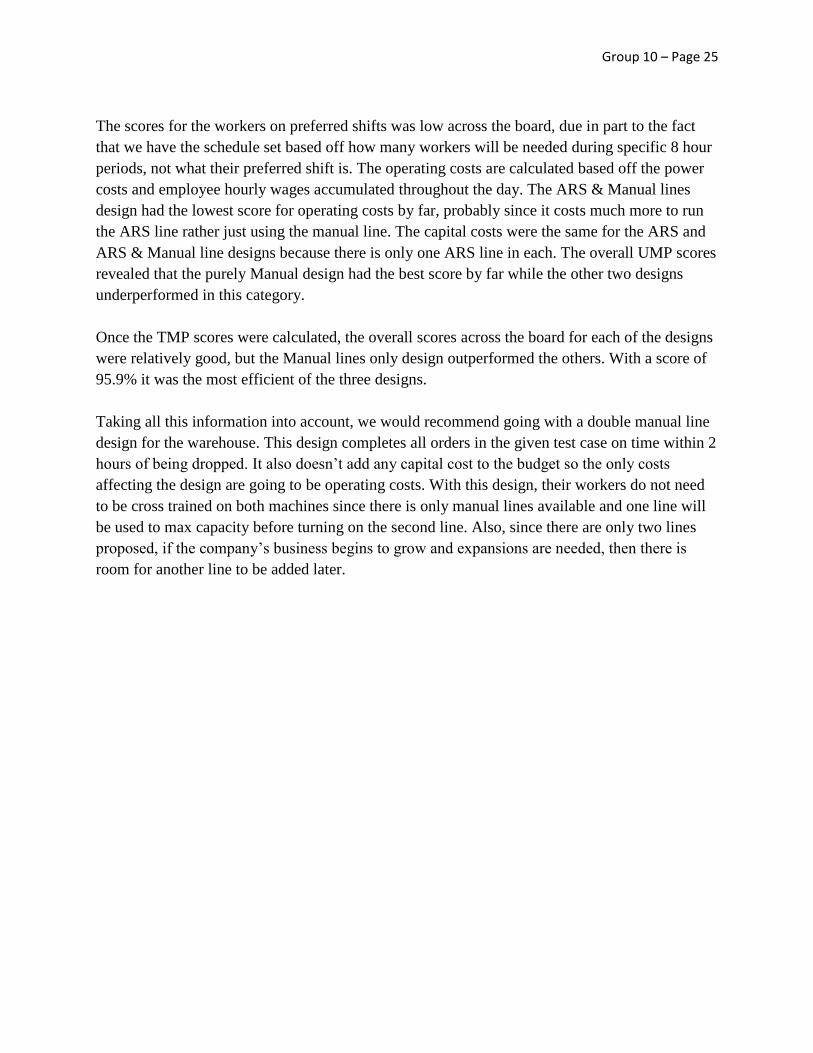
Figure 3.21 displays the results from each of the different proposed designs. All the lines
completed the required orders within 2 hours of being received, ergo all receiving a full score of
1 for the IMP value. UMP is composed of the number of workers on preferred shift, the
operating costs, and the capital costs associated with each model. The scores are shown on the
right-hand column in each design with values between 0 and 1. If a score of 0 is received that is a
very unfavorable score meanwhile a score of 1 is a full point score. The UMP is then calculated
by adding up the various associated sections with the corresponding weight to each part as
described in documents 2 and 4. TMP is then displayed as well, which is calculated using IMP
and UMP whose weights are described in the previously referenced documents also.
Figure 3.21 - Trade-Off Scores
Based off the scores received, IMP individually did not affect our overall decision because each
of the designs we created completed the necessary orders within each allotted 2-hour period.
Group 10 – Page 25
The scores for the workers on preferred shifts was low across the board, due in part to the fact
that we have the schedule set based off how many workers will be needed during specific 8 hour
periods, not what their preferred shift is. The operating costs are calculated based off the power
costs and employee hourly wages accumulated throughout the day. The ARS & Manual lines
design had the lowest score for operating costs by far, probably since it costs much more to run
the ARS line rather just using the manual line. The capital costs were the same for the ARS and
ARS & Manual line designs because there is only one ARS line in each. The overall UMP scores
revealed that the purely Manual design had the best score by far while the other two designs
underperformed in this category.
Once the TMP scores were calculated, the overall scores across the board for each of the designs
were relatively good, but the Manual lines only design outperformed the others. With a score of
95.9% it was the most efficient of the three designs.
Taking all this information into account, we would recommend going with a double manual line
design for the warehouse. This design completes all orders in the given test case on time within 2
hours of being dropped. It also doesn’t add any capital cost to the budget so the only costs
affecting the design are going to be operating costs. With this design, their workers do not need
to be cross trained on both machines since there is only manual lines available and one line will
be used to max capacity before turning on the second line. Also, since there are only two lines
proposed, if the company’s business begins to grow and expansions are needed, then there is
room for another line to be added later.
Group 10 – Page 26
Warehouse Design Project
Document 4: System Model (Scoring Functions)
Group 10:
Hassan Alsaleh, Keely Chiou, Elizabeth Hernandez, Chris Miller, Morgan Skillman, & Lorelei
Wong
SIE 265
Mike O’Brien
7 December 2016
Group 10 – Page 27
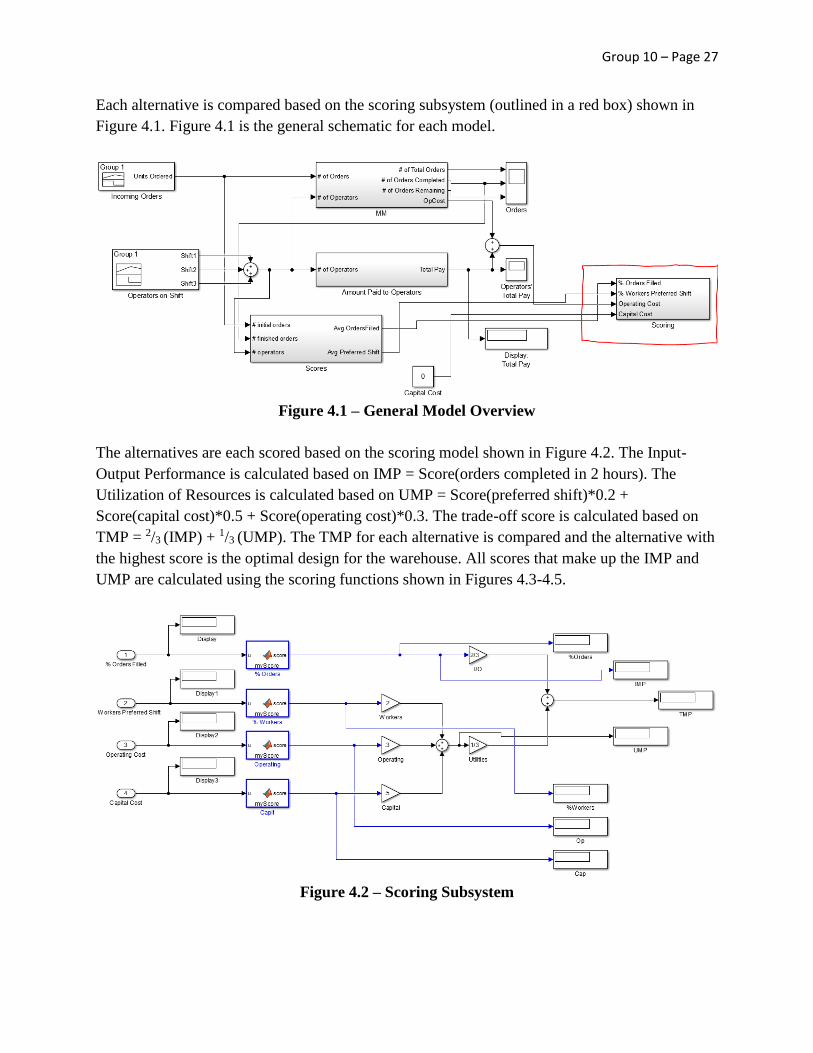
Each alternative is compared based on the scoring subsystem (outlined in a red box) shown in
Figure 4.1. Figure 4.1 is the general schematic for each model.
Figure 4.1 – General Model Overview
The alternatives are each scored based on the scoring model shown in Figure 4.2. The Input-
Output Performance is calculated based on IMP = Score(orders completed in 2 hours). The
Utilization of Resources is calculated based on UMP = Score(preferred shift)*0.2 +
Score(capital cost)*0.5 + Score(operating cost)*0.3. The trade-off score is calculated based on
TMP = 2/3 (IMP) + 1/3 (UMP). The TMP for each alternative is compared and the alternative with
the highest score is the optimal design for the warehouse. All scores that make up the IMP and
UMP are calculated using the scoring functions shown in Figures 4.3-4.5.
Figure 4.2 – Scoring Subsystem
Group 10 – Page 28
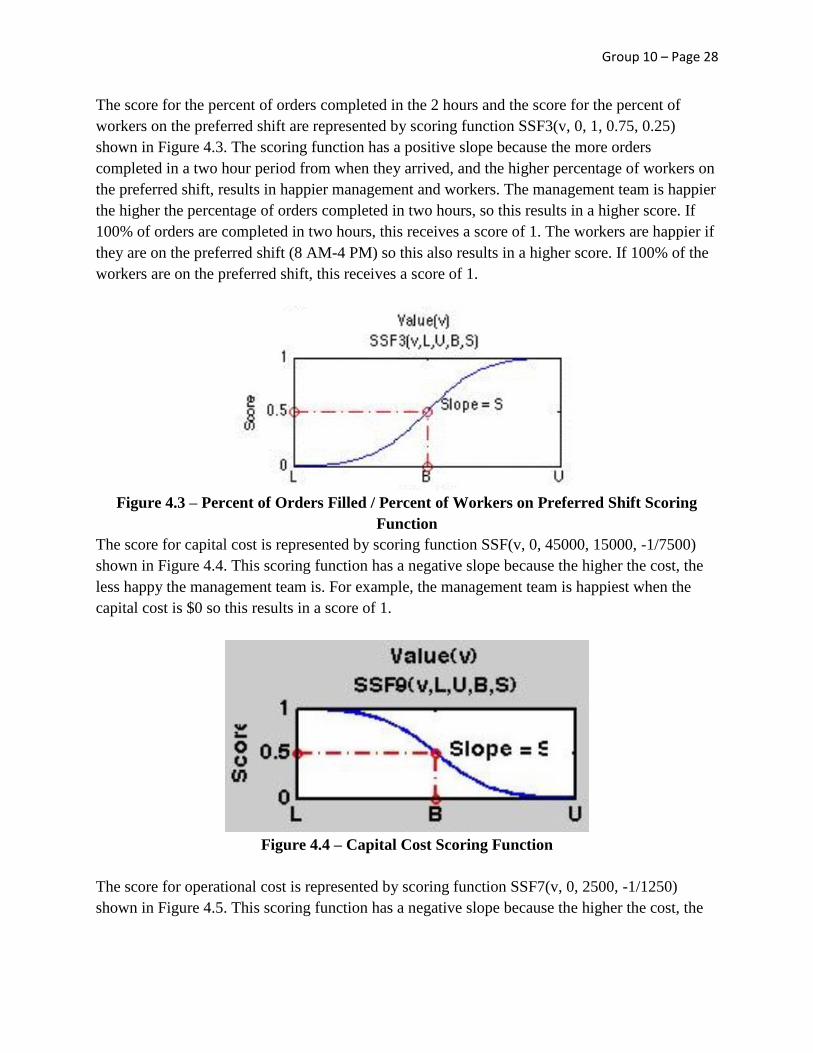
The score for the percent of orders completed in the 2 hours and the score for the percent of
workers on the preferred shift are represented by scoring function SSF3(v, 0, 1, 0.75, 0.25)
shown in Figure 4.3. The scoring function has a positive slope because the more orders
completed in a two hour period from when they arrived, and the higher percentage of workers on
the preferred shift, results in happier management and workers. The management team is happier
the higher the percentage of orders completed in two hours, so this results in a higher score. If
100% of orders are completed in two hours, this receives a score of 1. The workers are happier if
they are on the preferred shift (8 AM-4 PM) so this also results in a higher score. If 100% of the
workers are on the preferred shift, this receives a score of 1.
Figure 4.3 – Percent of Orders Filled / Percent of Workers on Preferred Shift Scoring
Function
The score for capital cost is represented by scoring function SSF(v, 0, 45000, 15000, -1/7500)
shown in Figure 4.4. This scoring function has a negative slope because the higher the cost, the
less happy the management team is. For example, the management team is happiest when the
capital cost is $0 so this results in a score of 1.
Figure 4.4 – Capital Cost Scoring Function
The score for operational cost is represented by scoring function SSF7(v, 0, 2500, -1/1250)
shown in Figure 4.5. This scoring function has a negative slope because the higher the cost, the

Group 10 – Page 29
less happy the management team is. For example, the management team is happiest when the
operational cost is $0, so this results in a score of 1.
Figure 4.5 – Operational Cost Scoring Function

Group 10 – Page 30
Warehouse Design Project
Document 5: Systems Engineering Management Plan
Group 10:
Hassan Alsaleh, Keely Chiou, Elizabeth Hernandez, Chris Miller, Morgan Skillman, & Lorelei
Wong
SIE 265
Mike O’Brien
7 December 2016
Group 10 – Page 31
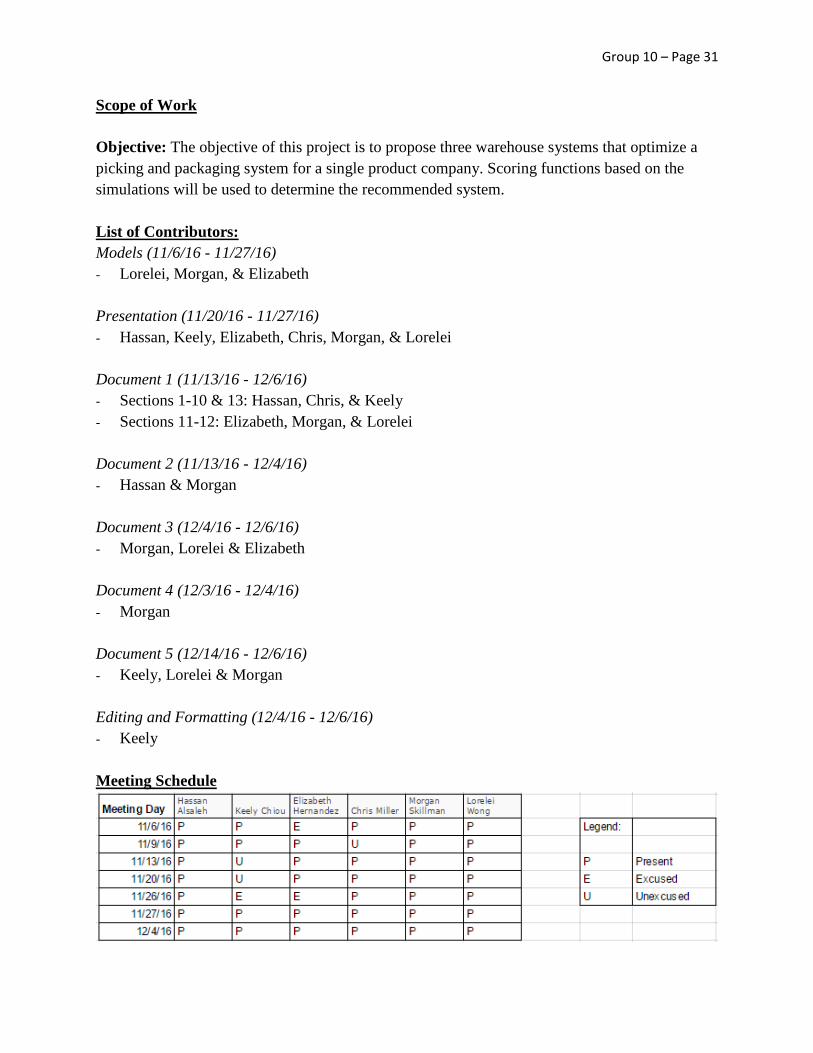
Scope of Work
Objective: The objective of this project is to propose three warehouse systems that optimize a
picking and packaging system for a single product company. Scoring functions based on the
simulations will be used to determine the recommended system.
List of Contributors:
Models (11/6/16 - 11/27/16)
- Lorelei, Morgan, & Elizabeth
Presentation (11/20/16 - 11/27/16)
- Hassan, Keely, Elizabeth, Chris, Morgan, & Lorelei
Document 1 (11/13/16 - 12/6/16)
- Sections 1-10 & 13: Hassan, Chris, & Keely
- Sections 11-12: Elizabeth, Morgan, & Lorelei
Document 2 (11/13/16 - 12/4/16)
- Hassan & Morgan
Document 3 (12/4/16 - 12/6/16)
- Morgan, Lorelei & Elizabeth
Document 4 (12/3/16 - 12/4/16)
- Morgan
Document 5 (12/14/16 - 12/6/16)
- Keely, Lorelei & Morgan
Editing and Formatting (12/4/16 - 12/6/16)
- Keely
Meeting Schedule
Group 10 – Page 32
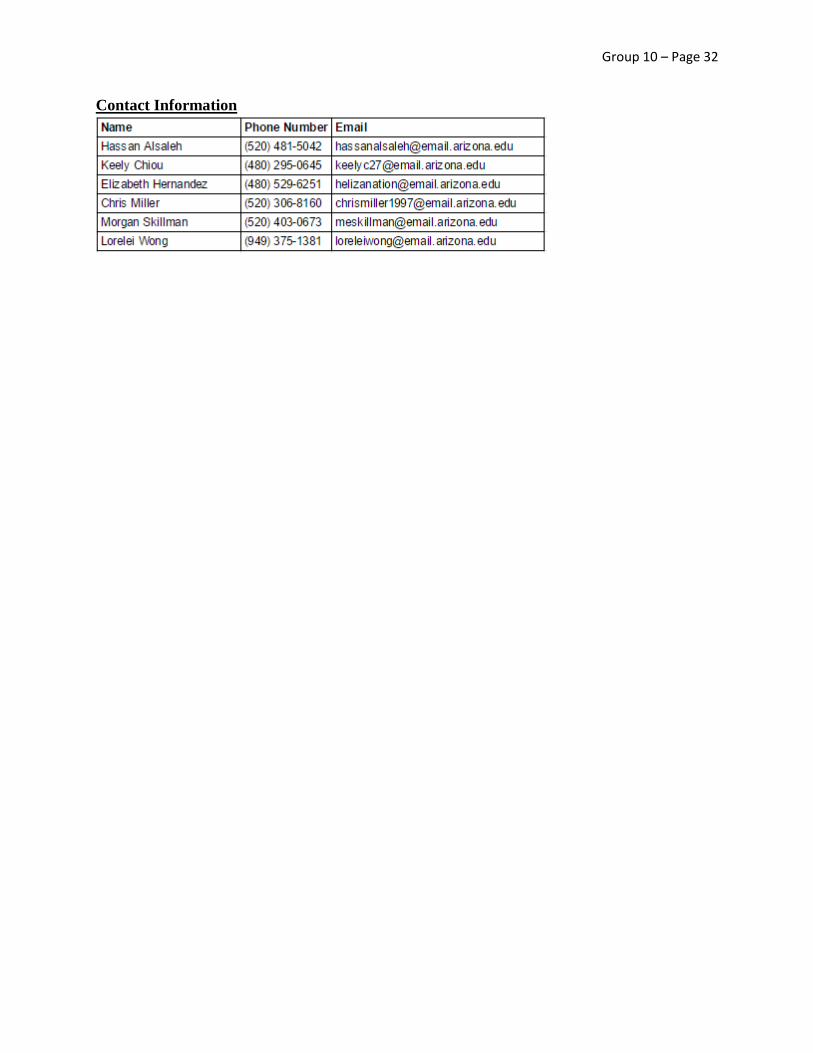
Contact Information