SIAM FUTURE DEVELOPMENT PUBLIC CO.,...
26
SIAM FUTURE DEVELOPMENT PUBLIC CO., LTD. Corporate Presentation 2016
Transcript of SIAM FUTURE DEVELOPMENT PUBLIC CO.,...

SIAM FUTURE DEVELOPMENT PUBLIC CO., LTD.
Corporate Presentation 2016
Overview
Financial Summary
Project Update
2

Overview
Founded: 1994
Staff: 78
Centers: 22
Vision “Unlike other developers,
we create a place for peoplefirst then for business. “
3

32%, 131,901 sq.m.
Business Model
Shopping Center Development
• Neighborhood Center• Lifestyle Center• Power Center• Entertainment Center• Convenience Center• Stand-Alone Retail Center• Super Regional Center
60%242,713 sq.m.
15 centers 4 centers:-Petchkasem-Ekkamai-Ratchayothin-Mega Bangna
8%, 33,949 sq.m.3 centers:-La Villa-Piyarom Place-The Avenue Changwattana
Total Rental Space 408,563 sq.m. with 22 Centers
4
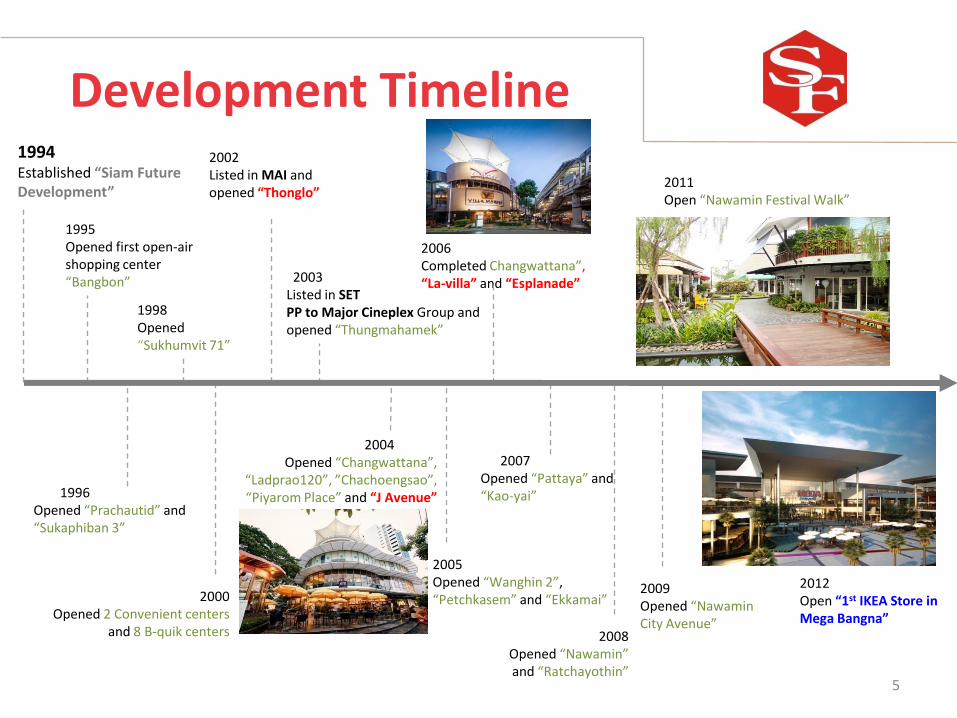
1994 Established “Siam Future Development”
1995 Opened first open-air shopping center“Bangbon”
1996Opened “Prachautid” and “Sukaphiban 3”
1998Opened “Sukhumvit 71”
2000Opened 2 Convenient centers
and 8 B-quik centers
2002Listed in MAI and opened “Thonglo”
2003Listed in SET PP to Major Cineplex Group and opened “Thungmahamek”
2004Opened “Changwattana”,
“Ladprao120”, ”Chachoengsao”,“Piyarom Place” and “J Avenue”
2005Opened “Wanghin 2”, “Petchkasem” and “Ekkamai”
2006Completed Changwattana”,“La-villa” and “Esplanade”
2007Opened “Pattaya” and“Kao-yai”
2008Opened “Nawamin”and “Ratchayothin”
2009Opened “NawaminCity Avenue”
2011 Open “Nawamin Festival Walk”
2012Open “1st IKEA Store in Mega Bangna”
Development Timeline
5
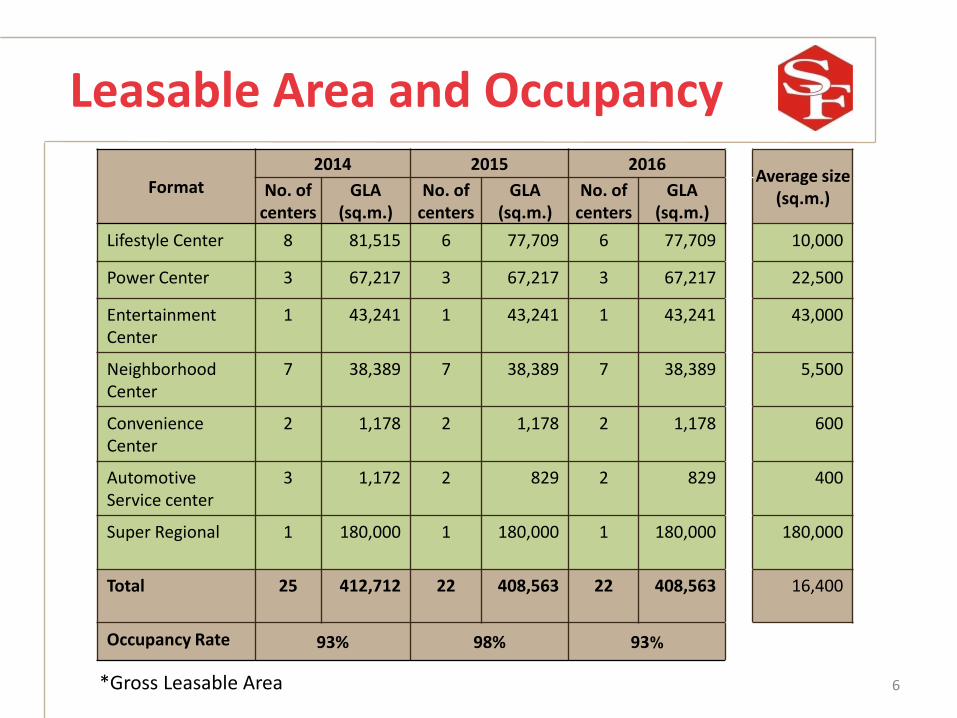
Leasable Area and Occupancy
Format2014 2015 2016
Average size (sq.m.)No. of
centersGLA
(sq.m.)No. of
centersGLA
(sq.m.)No. of
centersGLA
(sq.m.)
Lifestyle Center 8 81,515 6 77,709 6 77,709 10,000
Power Center 3 67,217 3 67,217 3 67,217 22,500
Entertainment Center
1 43,241 1 43,241 1 43,241 43,000
Neighborhood Center
7 38,389 7 38,389 7 38,389 5,500
Convenience Center
2 1,178 2 1,178 2 1,178 600
Automotive Service center
3 1,172 2 829 2 829 400
Super Regional 1 180,000 1 180,000 1 180,000 180,000
Total 25 412,712 22 408,563 22 408,563 16,400
Occupancy Rate 93% 98% 93%
6*Gross Leasable Area

Shareholding Structure
24%
51%
25%
10%
3%
7%
4%
17%
31%
4%
Major Cineplex Group PLC. Management
Freefloat
Witoonchartgroup
PojkasemsinGroup
SuttapongGroup
JantaraprapaGroup
Foreigners
Retails
Number of shares: 1,776.61 Million
Source: Shareholder list as of 31 Dec 16 7
Local Institutions
Overview
Financial Summary
Project Update
8
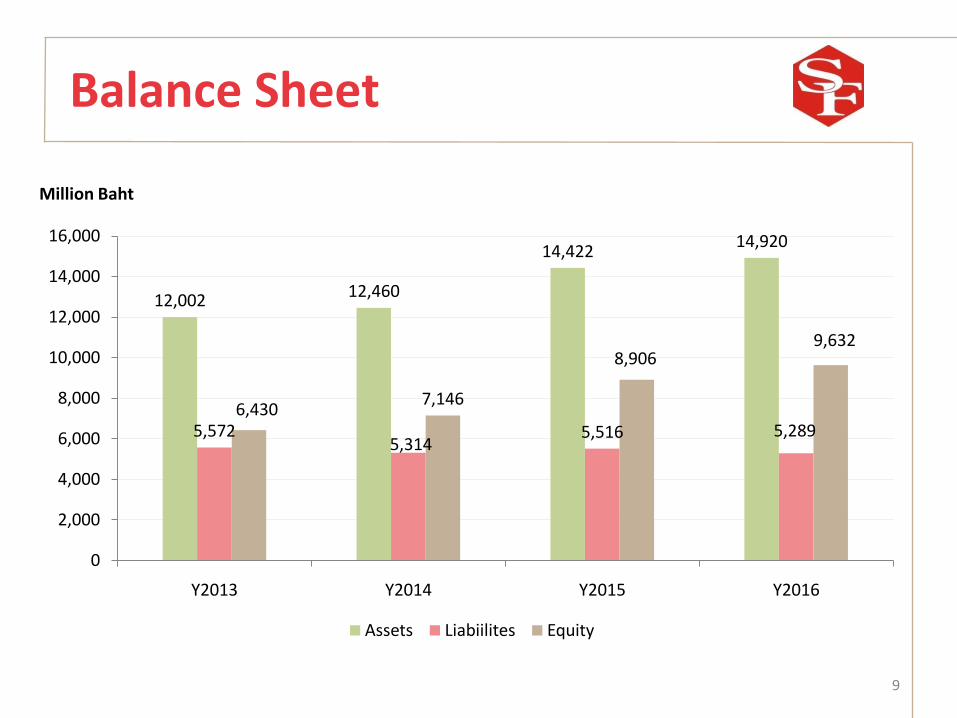
Balance Sheet
12,002 12,460
14,42214,920
5,5725,314
5,516 5,2896,430
7,146
8,9069,632
0
2,000
4,000
6,000
8,000
10,000
12,000
14,000
16,000
Y2013 Y2014 Y2015 Y2016
Million Baht
Assets Liabiilites Equity
9

Income Statement (Management Account)
2013 2014 2015 2016
A C D E F
1 Recurring Revenue 1,396 1,372 1,429 1,431
2 Cost of rental & service (1,002) (936) (909) (911)
3 Gross profit 394 436 520 520
4 SG&A (198) (229) (233) (238)
5 EBIT 197 207 287 282
6 Interest expenses (99) (95) (96) (75)
7 Income tax (27) (32) (38) (46)
8 Minority (18) (18) (21) (18)
9 Recurring profit (excl. MEGA BANGNA) 53 62 131 143
10 Profit from joint venture 118 191 201 281
11 Total recurring profit 170 253 332 424
12 Add: Profit from Fin Lease (after tax) 3 2 - -
13 Fair value adjustment on IP*– SF (after tax) 165 161 679 246
14 Fair value adjustment on IP– Mega Bangna (49%) 174 284 397 294
15 Net profit 512 700 1,408 964
16 Earnings per share (EPS) 0.39 0.47 0.79 0.54
17 Average Occupancy Rate (%) 94% 93% 98% 93%
(Million Baht)
Remarks: * Fair value adjustment on Investment Property= Depreciation & Amortization + Gain (Loss) from revaluation 10
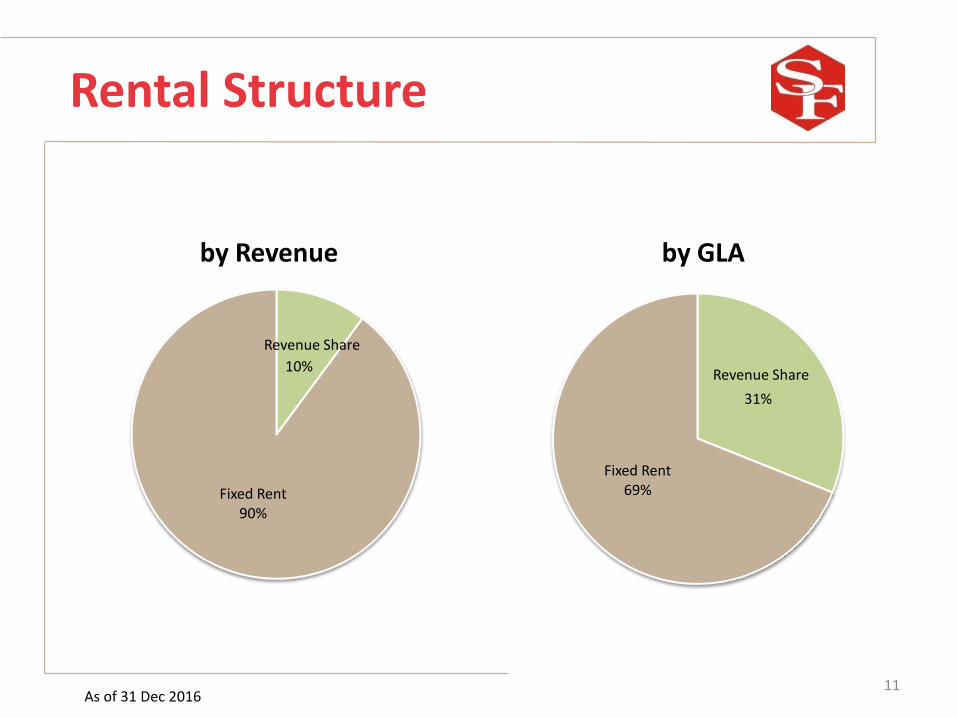
Rental Structure
10%
Fixed Rent90%
by Revenue
31%
Fixed Rent69%
by GLA
As of 31 Dec 2016
Revenue Share
Revenue Share
11
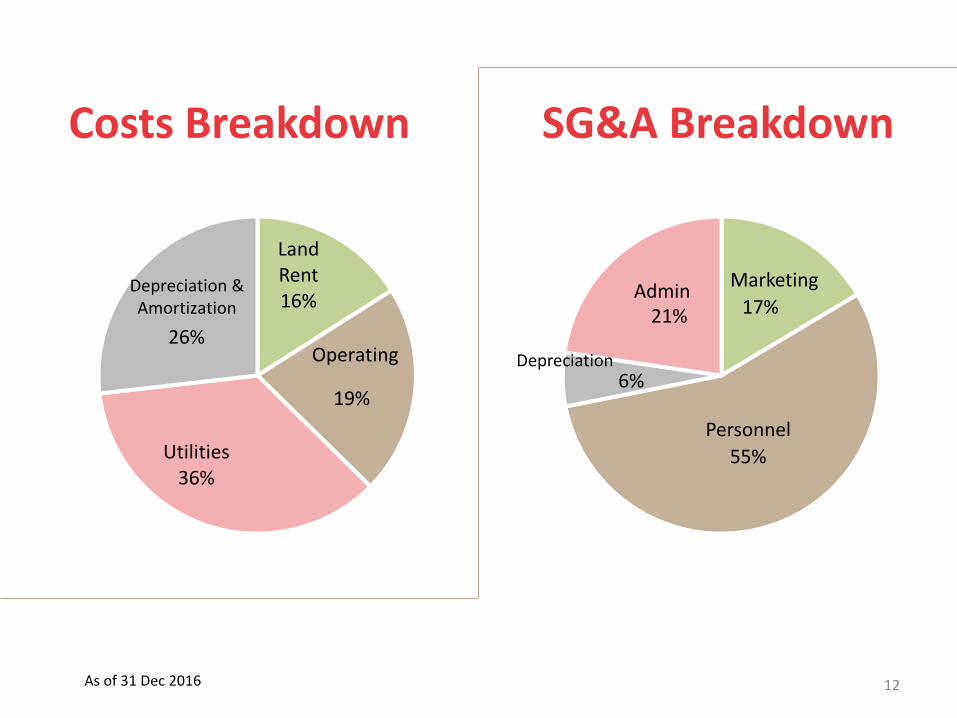
Costs Breakdown
Land Rent16%
19%
Utilities36%
26%
Depreciation & Amortization
Operating
17%
55%
6%
21%
Depreciation
SG&A Breakdown
As of 31 Dec 2016
Personnel
MarketingAdmin
12
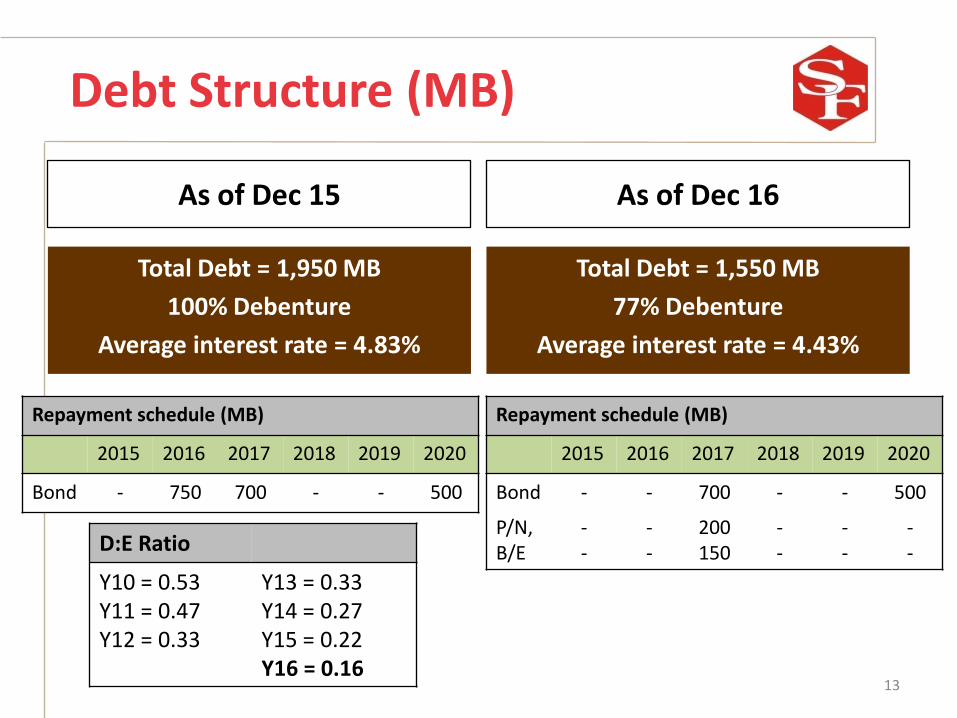
Debt Structure (MB)
As of Dec 15
Total Debt = 1,950 MB
100% Debenture
Average interest rate = 4.83%
As of Dec 16
13
Total Debt = 1,550 MB
77% Debenture
Average interest rate = 4.43%
Repayment schedule (MB)
2015 2016 2017 2018 2019 2020
Bond - 750 700 - - 500
Repayment schedule (MB)
2015 2016 2017 2018 2019 2020
Bond - - 700 - - 500
P/N,B/E
--
--
200150
--
--
--D:E Ratio
Y10 = 0.53Y11 = 0.47Y12 = 0.33
Y13 = 0.33Y14 = 0.27Y15 = 0.22Y16 = 0.16
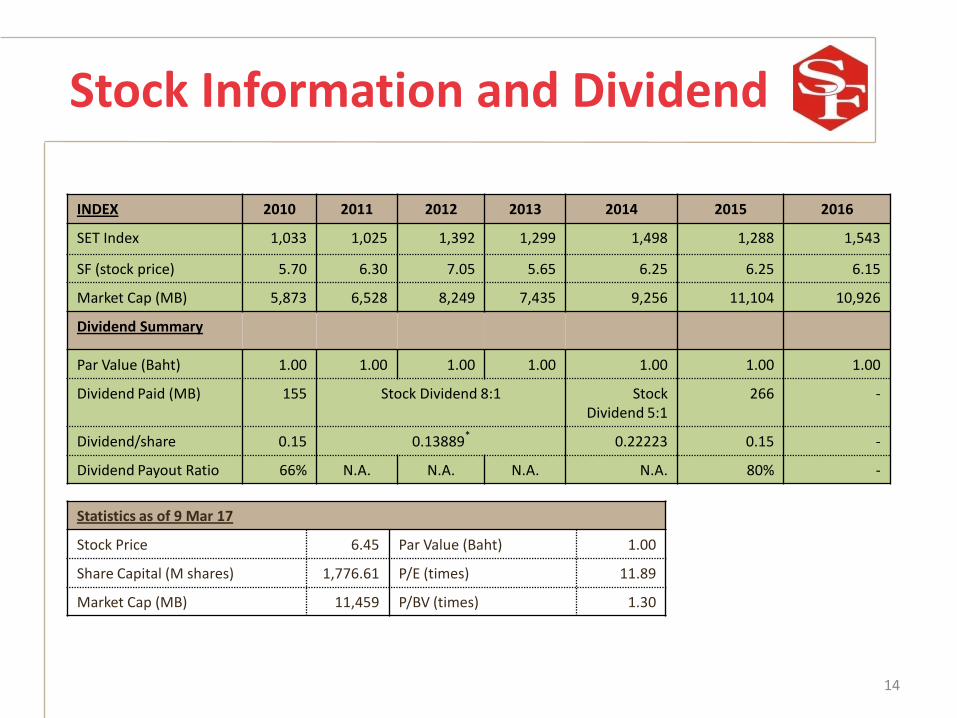
Stock Information and Dividend
INDEX 2010 2011 2012 2013 2014 2015 2016
SET Index 1,033 1,025 1,392 1,299 1,498 1,288 1,543
SF (stock price) 5.70 6.30 7.05 5.65 6.25 6.25 6.15
Market Cap (MB) 5,873 6,528 8,249 7,435 9,256 11,104 10,926
Dividend Summary
Par Value (Baht) 1.00 1.00 1.00 1.00 1.00 1.00 1.00
Dividend Paid (MB) 155 Stock Dividend 8:1 Stock Dividend 5:1
266 -
Dividend/share 0.15 0.13889* 0.22223 0.15 -
Dividend Payout Ratio 66% N.A. N.A. N.A. N.A. 80% -
Statistics as of 9 Mar 17
Stock Price 6.45 Par Value (Baht) 1.00
Share Capital (M shares) 1,776.61 P/E (times) 11.89
Market Cap (MB) 11,459 P/BV (times) 1.30
14

Overview
Financial Summary
Project Update
15
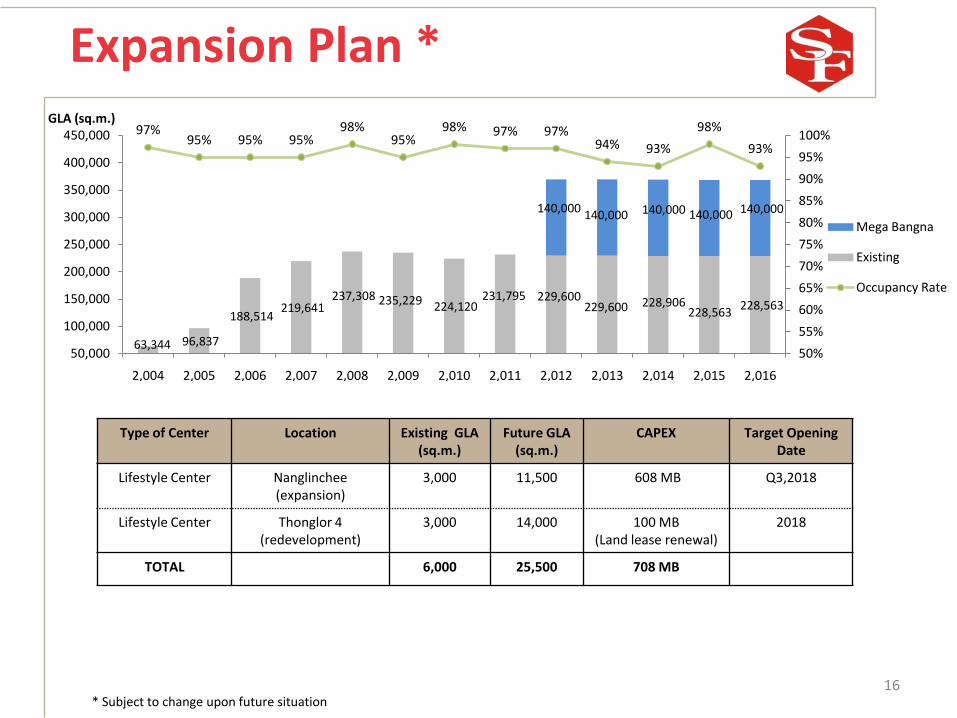
Expansion Plan *
16
Type of Center Location Existing GLA(sq.m.)
Future GLA (sq.m.)
CAPEX Target Opening Date
Lifestyle Center Nanglinchee(expansion)
3,000 11,500 608 MB Q3,2018
Lifestyle Center Thonglor 4(redevelopment)
3,000 14,000 100 MB(Land lease renewal)
2018
TOTAL 6,000 25,500 708 MB
* Subject to change upon future situation
63,344 96,837
188,514 219,641
237,308 235,229 224,120 231,795 229,600
229,600 228,906 228,563
228,563
140,000 140,000 140,000 140,000 140,000
97%95% 95% 95%
98%95%
98% 97% 97%94% 93%
98%
93%
50%
55%
60%
65%
70%
75%
80%
85%
90%
95%
100%
50,000
100,000
150,000
200,000
250,000
300,000
350,000
400,000
450,000
2,004 2,005 2,006 2,007 2,008 2,009 2,010 2,011 2,012 2,013 2,014 2,015 2,016
GLA (sq.m.)
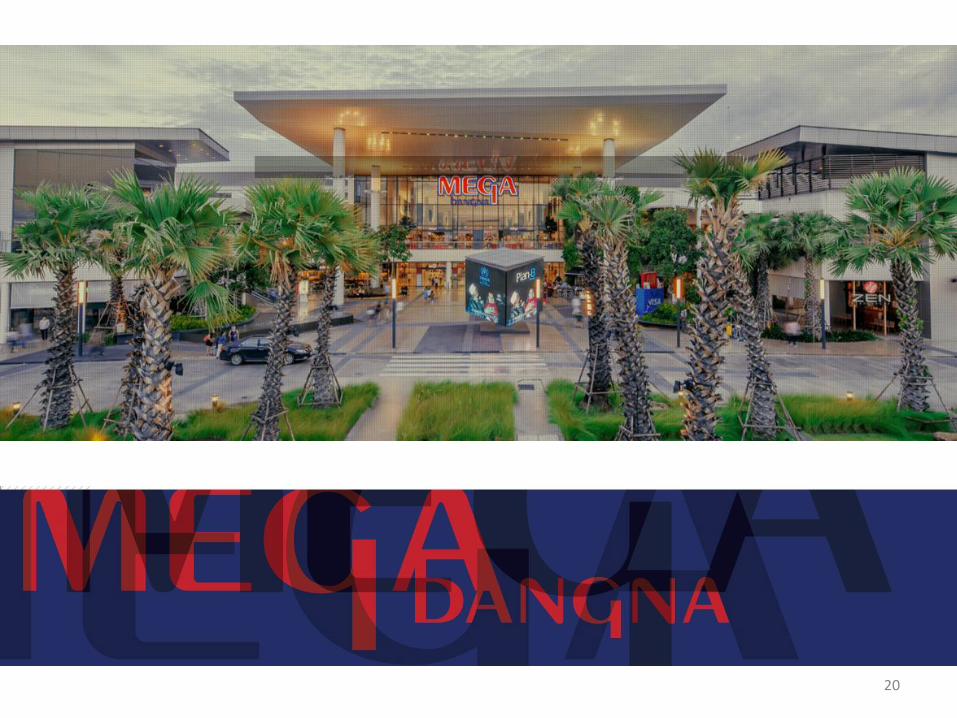
Mega Bangna
Existing
Occupancy Rate
17
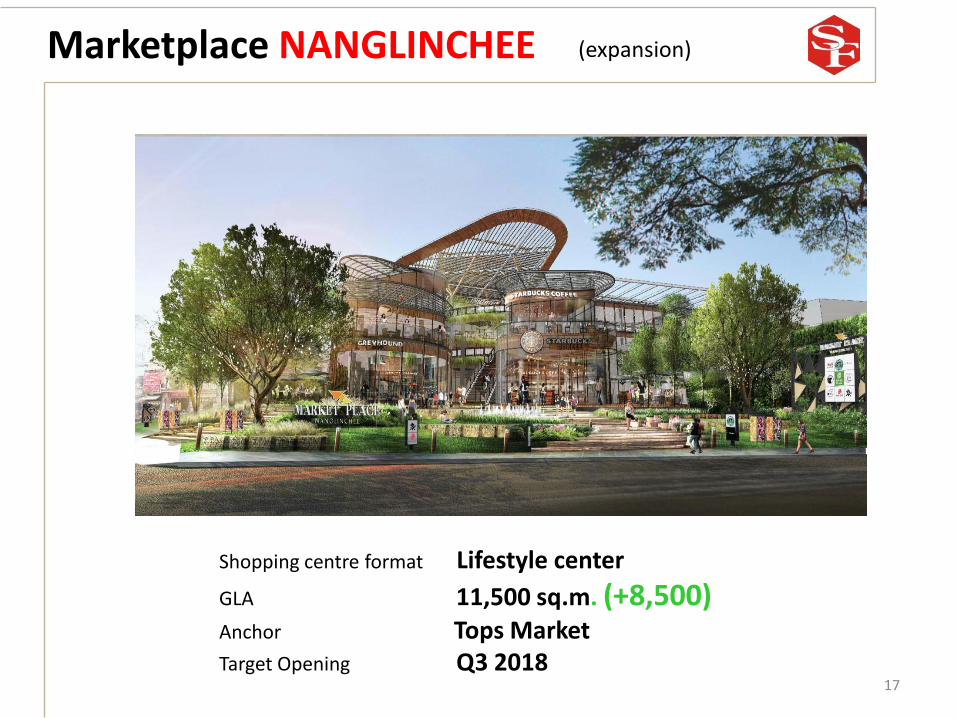
Marketplace NANGLINCHEE
Shopping centre format Lifestyle center
GLA 11,500 sq.m. (+8,500) Anchor Tops MarketTarget Opening Q3 2018
(expansion)
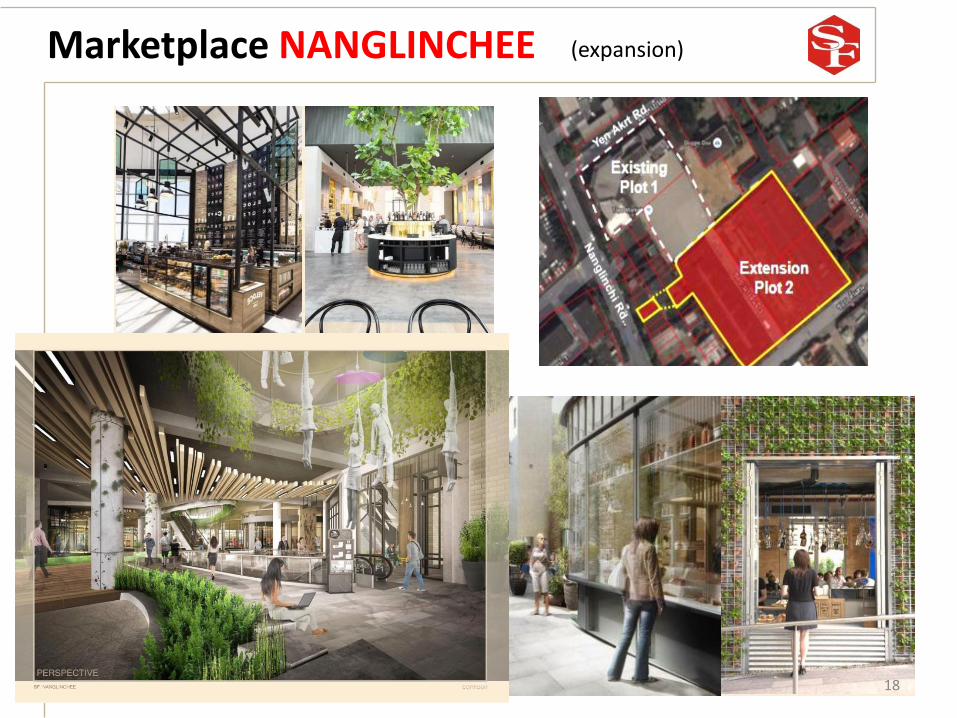
18
Marketplace NANGLINCHEE (expansion)

19
Marketplace THONGLOR 4
Shopping centre format Lifestyle center
GLA 14,000 sq.m. (+11,000) Anchor Tops MarketTarget Opening 2018
(redevelopment)
20
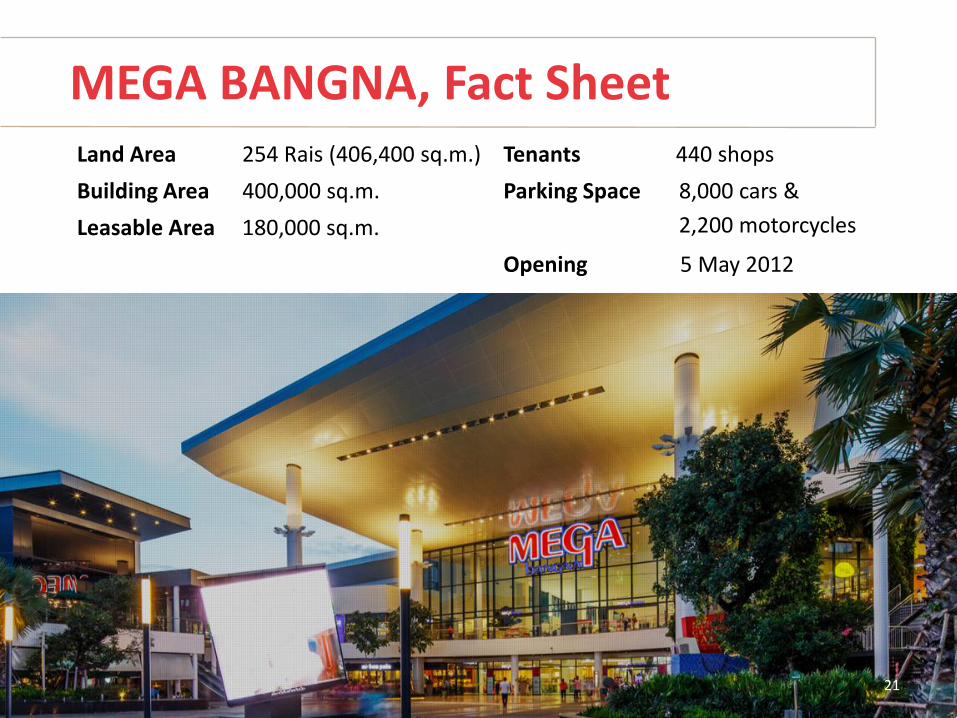
MEGA BANGNA, Fact Sheet
21
Land Area 254 Rais (406,400 sq.m.)
Building Area 400,000 sq.m.
Leasable Area 180,000 sq.m.
Tenants 440 shops
Parking Space 8,000 cars &
2,200 motorcycles
Opening 5 May 2012
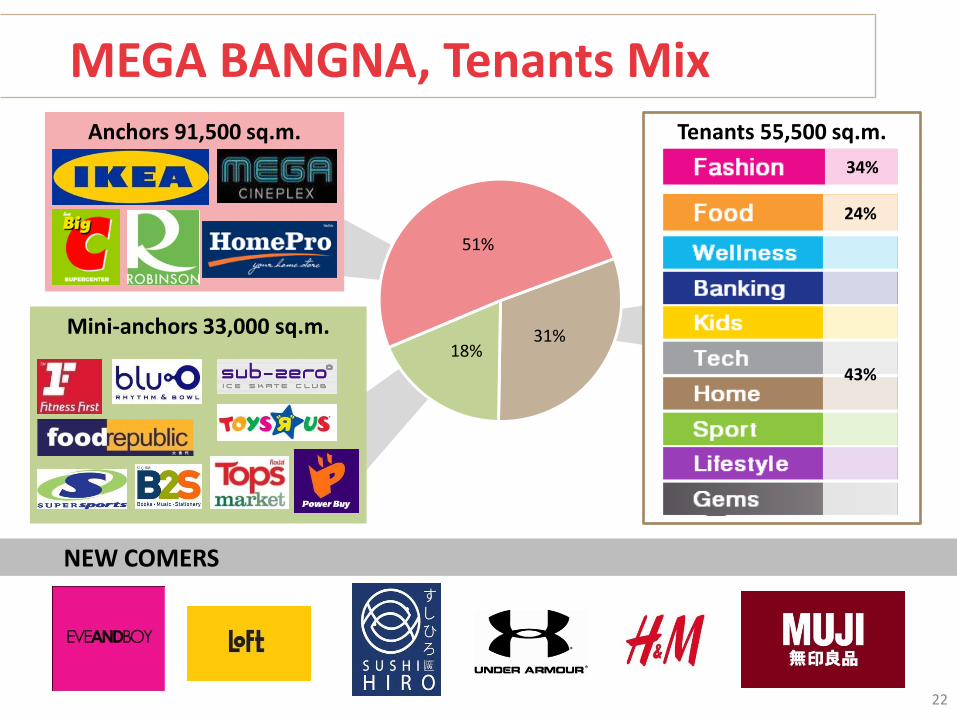
Tenants 55,500 sq.m.
MEGA BANGNA, Tenants Mix
Mini-anchors 33,000 sq.m.
Anchors 91,500 sq.m.
34%
24%
43%
22
31%18%
51%
NEW COMERS
23
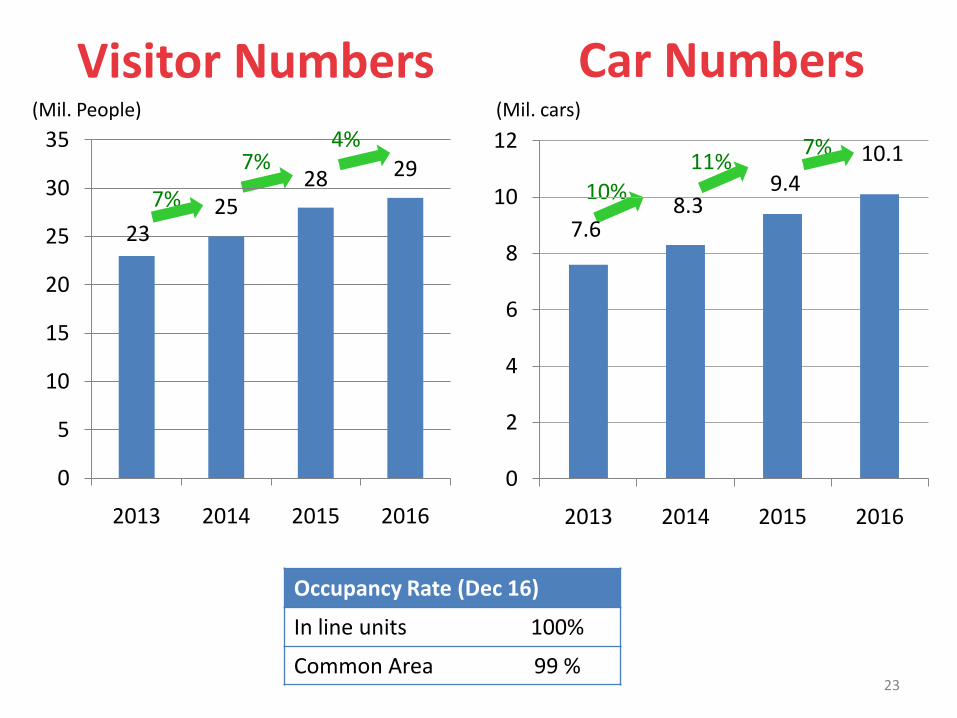
Visitor Numbers Car Numbers
Occupancy Rate (Dec 16)
In line units 100%
Common Area 99 %
(Mil. People) (Mil. cars)
7%
7% 10%
11%
2325
28 29
0
5
10
15
20
25
30
35
2013 2014 2015 2016
8.39.4
10.1
0
2
4
6
8
10
12
2013 2014 2015 2016
7.6
7%4%
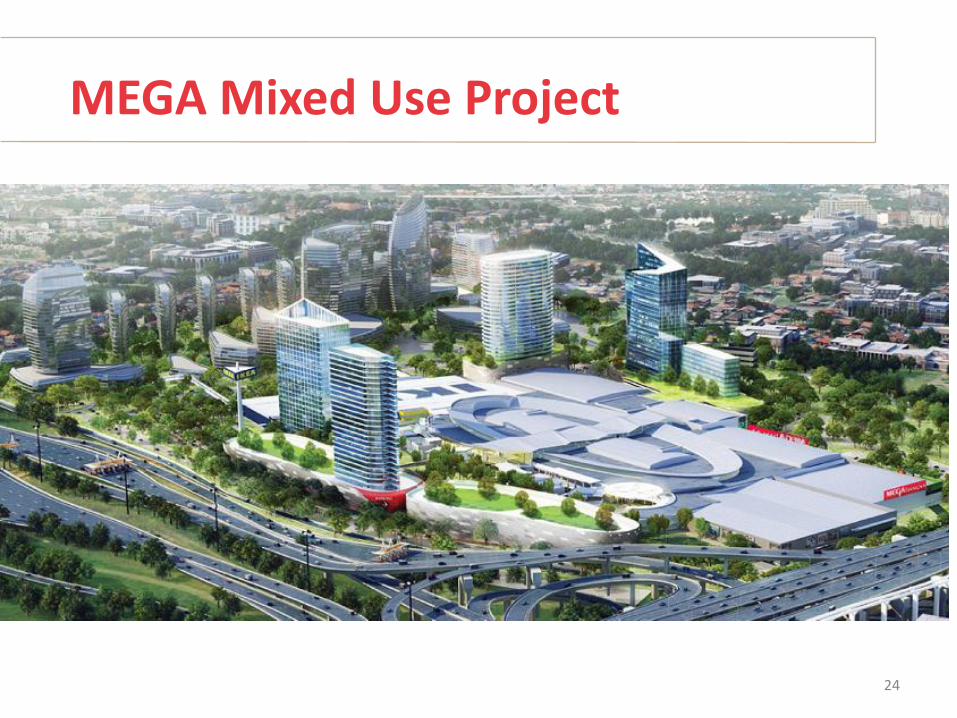
MEGA Mixed Use Project
24
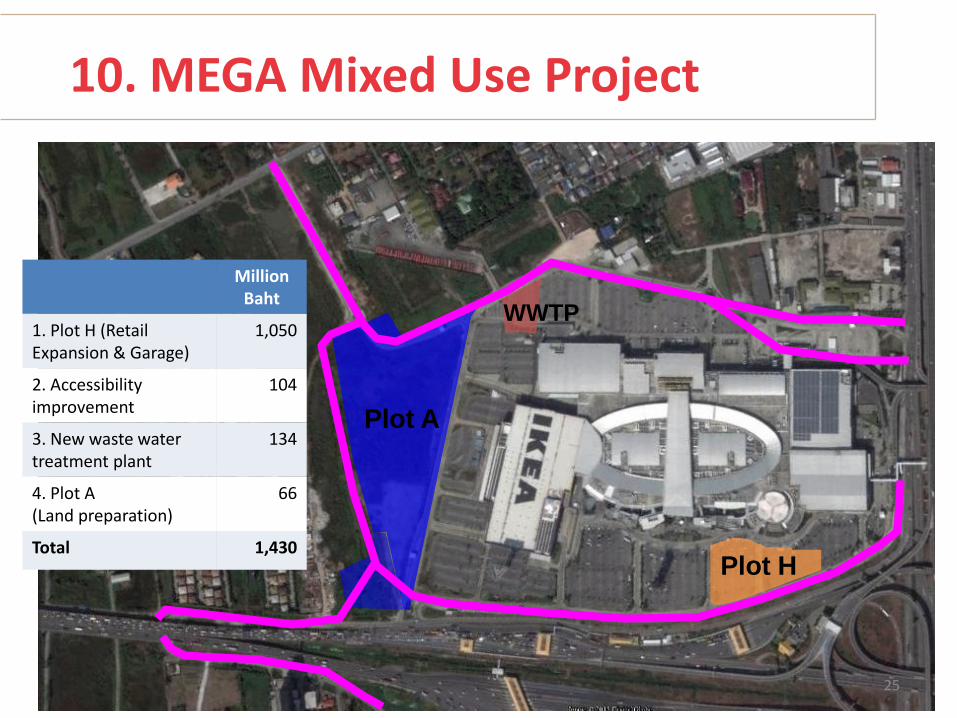
Plot A
Plot H
WWTP
Million Baht
1. Plot H (Retail Expansion & Garage)
1,050
2. Accessibility improvement
104
3. New waste water treatment plant
134
4. Plot A (Land preparation)
66
Total 1,430
10. MEGA Mixed Use Project
25
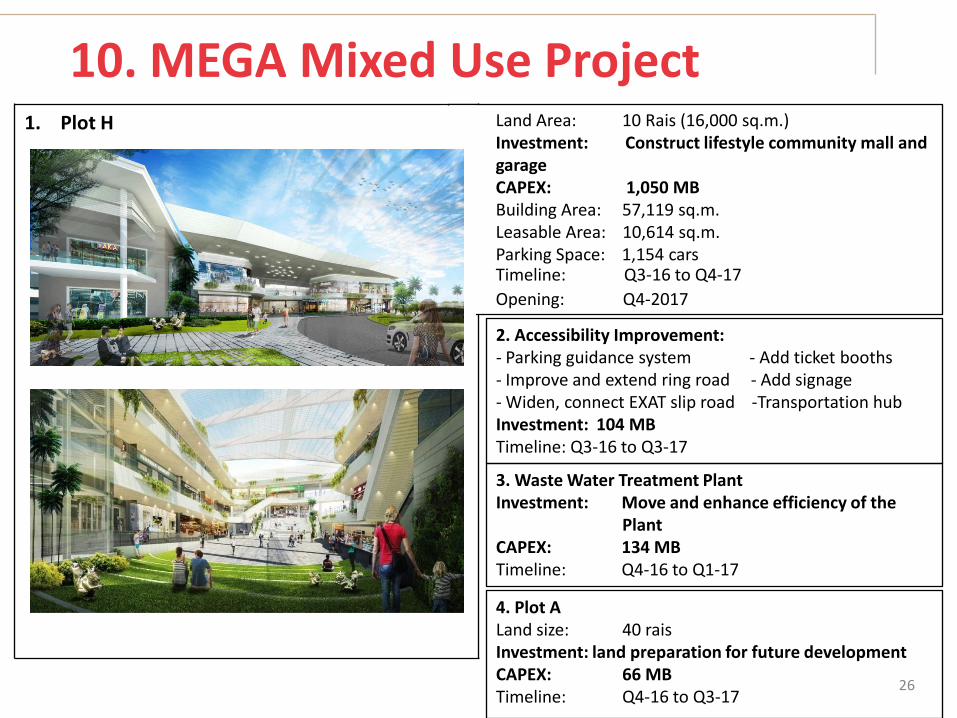
1. Plot H
10. MEGA Mixed Use Project
2. Accessibility Improvement: - Parking guidance system - Add ticket booths - Improve and extend ring road - Add signage - Widen, connect EXAT slip road -Transportation hubInvestment: 104 MBTimeline: Q3-16 to Q3-17
3. Waste Water Treatment PlantInvestment: Move and enhance efficiency of the
PlantCAPEX: 134 MBTimeline: Q4-16 to Q1-17
4. Plot ALand size: 40 raisInvestment: land preparation for future developmentCAPEX: 66 MBTimeline: Q4-16 to Q3-17
26
Land Area: 10 Rais (16,000 sq.m.)Investment: Construct lifestyle community mall and garageCAPEX: 1,050 MBBuilding Area: 57,119 sq.m.Leasable Area: 10,614 sq.m.Parking Space: 1,154 cars Timeline: Q3-16 to Q4-17
Opening: Q4-2017