Shukla 2012
26
ORIGINAL PAPER Seismic hazard and site-specific ground motion for typical ports of Gujarat Jaykumar Shukla • Deepankar Choudhury Rece ived: 30 Marc h 2011 / Accep ted: 2 Novemb er 2011 / Publi shed onlin e: 25 Novembe r 2011 Springer Science+Business Media B.V. 2011 Abstract Econo mic importan ce of major ports is well known , and if ports are located in seismica lly active region s, then site-spe cific seismic hazard studies are essential to mitigate the seismic risk of the ports. Seismic design of port sites and related structures can be accomplished in three steps that include assessment of regional seismicity, geotechnical hazards, and soil structure interaction analysis. In the present study, site-specific proba- bilistic seismic hazard analysis is performed to identify the seismic hazard associated with four typical port sites of Gujarat state (bounded by 20 –25.5N and 68–75E) of India viz. Kandla, Mundra, Hazira, and Dahej ports. The primary aim of the study is to develop consistent seismic ground motion for the structures within the four port sites for different three levels of ground shaking, i.e., operating level earthquake (72 years return period), contingency level earthquake (CLE) (475 year return period), and maximum considered earthquake (2,475 year return period). The geotechnical characterization for each port site is carried out using availabl e geotechnical data. Shear wave velocities of the soil profile are esti mate d from SPT blow counts usi ng vari ous empiric al formulae. Seismicity of the Gujarat region is modeled through delineating the 40 fault sources based on the seismo- tectonic setting. The Gujarat state is divided into three regions, i.e., Kachchh, Saurashtra, and Mai nl and Gujarat , and reg ional rec ur ren ce rel ati ons are ass igned in the form of Gutenberg-Richter parameters in order to calculate seismic hazard associated with each por t site . The hor izonta l compon ent of gro und acceler atio n for thre e leve ls of ground sha kin g is esti mate d by usi ng dif fere nt gro und motion atte nua tion rela tions (GMAR) including one country-specific GMAR for Peninsular India. Uncertainty in seismic hazard computations is handled by using logic tree approach to develop uniform hazard spectra for 5% damping which are consistent with the specified three levels of ground shaking. Using reco rded acceler atio n time histor y of Bhu j 200 1 eart hqu ake as the inp ut time motion , synthetic time histories are generated to match the developed designed response spectra to study site-specific responses of port sites during different levels of ground shaking. It is observed that the Mundra and Kandla port sites are most vulnera ble sites for seismic J. Shukla D. Choudhury (&) Department of Civil Engineering, Indian Institute of Technology Bombay, Powai, Mumbai 400 076, India e-mail: [email protected]; [email protected] Nat Hazards (2012) 60:541–565 DOI 10.1007/s11069-011-0042-z
Transcript of Shukla 2012

8/16/2019 Shukla 2012
http://slidepdf.com/reader/full/shukla-2012 1/25
O R I G I N A L P A P E R
Seismic hazard and site-specific ground motion
for typical ports of Gujarat
Jaykumar Shukla • Deepankar Choudhury
Received: 30 March 2011 / Accepted: 2 November 2011 / Published online: 25 November 2011 Springer Science+Business Media B.V. 2011
Abstract Economic importance of major ports is well known, and if ports are located in
seismically active regions, then site-specific seismic hazard studies are essential to mitigate
the seismic risk of the ports. Seismic design of port sites and related structures can be
accomplished in three steps that include assessment of regional seismicity, geotechnical
hazards, and soil structure interaction analysis. In the present study, site-specific proba-
bilistic seismic hazard analysis is performed to identify the seismic hazard associated with
four typical port sites of Gujarat state (bounded by 20–25.5N and 68–75E) of India viz.Kandla, Mundra, Hazira, and Dahej ports. The primary aim of the study is to develop
consistent seismic ground motion for the structures within the four port sites for different
three levels of ground shaking, i.e., operating level earthquake (72 years return period),
contingency level earthquake (CLE) (475 year return period), and maximum considered
earthquake (2,475 year return period). The geotechnical characterization for each port site
is carried out using available geotechnical data. Shear wave velocities of the soil profile are
estimated from SPT blow counts using various empirical formulae. Seismicity of the
Gujarat region is modeled through delineating the 40 fault sources based on the seismo-
tectonic setting. The Gujarat state is divided into three regions, i.e., Kachchh, Saurashtra,
and Mainland Gujarat, and regional recurrence relations are assigned in the form of
Gutenberg-Richter parameters in order to calculate seismic hazard associated with each
port site. The horizontal component of ground acceleration for three levels of ground
shaking is estimated by using different ground motion attenuation relations (GMAR)
including one country-specific GMAR for Peninsular India. Uncertainty in seismic hazard
computations is handled by using logic tree approach to develop uniform hazard spectra for
5% damping which are consistent with the specified three levels of ground shaking. Using
recorded acceleration time history of Bhuj 2001 earthquake as the input time motion,
synthetic time histories are generated to match the developed designed response spectra to
study site-specific responses of port sites during different levels of ground shaking. It isobserved that the Mundra and Kandla port sites are most vulnerable sites for seismic
J. Shukla D. Choudhury (&)
Department of Civil Engineering, Indian Institute of Technology Bombay, Powai,
Mumbai 400 076, India
e-mail: [email protected]; [email protected]
1 3
Nat Hazards (2012) 60:541–565
DOI 10.1007/s11069-011-0042-z

8/16/2019 Shukla 2012
http://slidepdf.com/reader/full/shukla-2012 2/25
8/16/2019 Shukla 2012
http://slidepdf.com/reader/full/shukla-2012 3/25
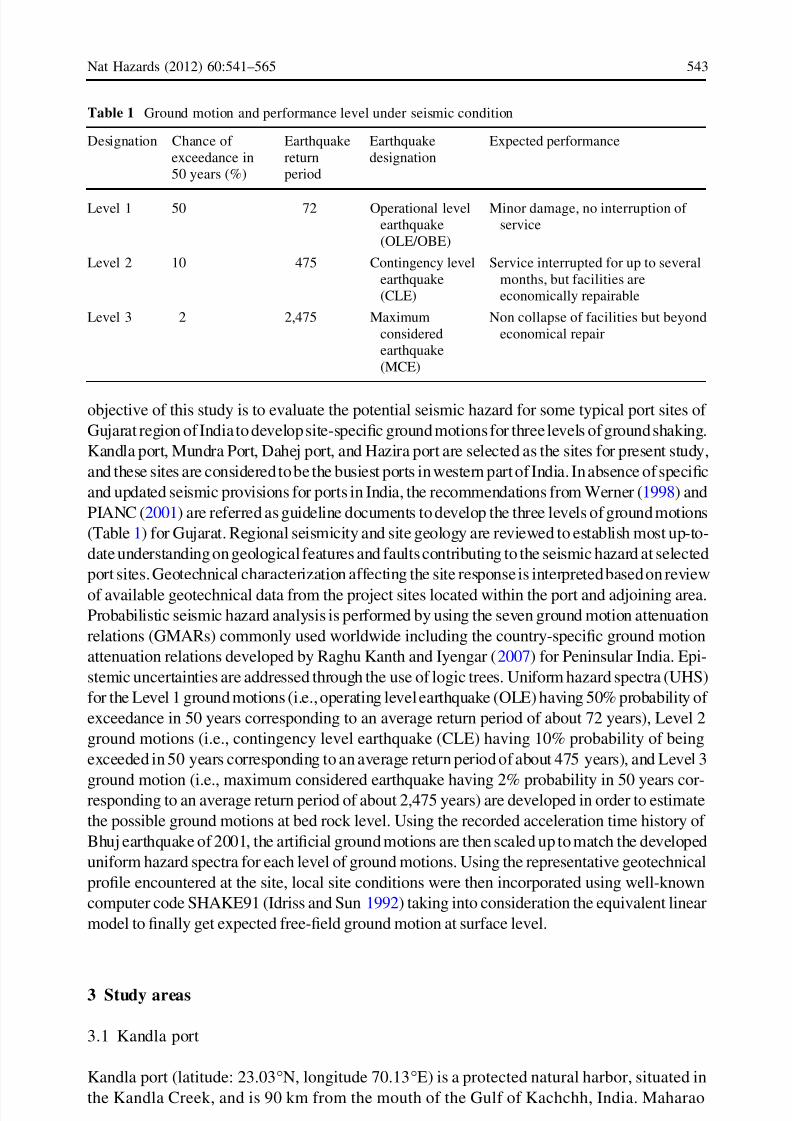
objective of this study is to evaluate the potential seismic hazard for some typical port sites of
Gujarat region of Indiato develop site-specific ground motions for three levels of ground shaking.
Kandla port, Mundra Port, Dahej port, and Hazira port are selected as the sites for present study,
and these sites are considered to be the busiest ports in western part of India. In absence of specific
and updated seismic provisions for ports in India, the recommendations from Werner (1998) and
PIANC (2001) are referred as guideline documents to develop the three levels of ground motions
(Table 1) for Gujarat. Regional seismicity and site geology are reviewed to establish most up-to-
date understanding on geological features and faults contributing to the seismic hazard at selected
port sites. Geotechnical characterization affecting the site response is interpreted based on review
of available geotechnical data from the project sites located within the port and adjoining area.Probabilistic seismic hazard analysis is performed by using the seven ground motion attenuation
relations (GMARs) commonly used worldwide including the country-specific ground motion
attenuation relations developed by Raghu Kanth and Iyengar (2007) for Peninsular India. Epi-
stemic uncertainties are addressed through the use of logic trees. Uniform hazard spectra (UHS)
for the Level 1 ground motions (i.e., operating level earthquake (OLE) having 50% probability of
exceedance in 50 years corresponding to an average return period of about 72 years), Level 2
ground motions (i.e., contingency level earthquake (CLE) having 10% probability of being
exceeded in 50 years corresponding to an average return period of about 475 years), and Level 3
ground motion (i.e., maximum considered earthquake having 2% probability in 50 years cor-responding to an average return period of about 2,475 years) are developed in order to estimate
the possible ground motions at bed rock level. Using the recorded acceleration time history of
Bhuj earthquake of 2001, the artificial ground motions are then scaled up to match the developed
uniform hazard spectra for each level of ground motions. Using the representative geotechnical
profile encountered at the site, local site conditions were then incorporated using well-known
computer code SHAKE91 (Idriss and Sun 1992) taking into consideration the equivalent linear
model to finally get expected free-field ground motion at surface level.
3 Study areas
3.1 Kandla port
Kandla port (latitude: 23.03N, longitude 70.13E) is a protected natural harbor, situated in
the Kandla Creek, and is 90 km from the mouth of the Gulf of Kachchh, India. Maharao
Table 1 Ground motion and performance level under seismic condition
Designation Chance of
exceedance in
50 years (%)
Earthquake
return
period
Earthquake
designation
Expected performance
Level 1 50 72 Operational level
earthquake
(OLE/OBE)
Minor damage, no interruption of
service
Level 2 10 475 Contingency level
earthquake
(CLE)
Service interrupted for up to several
months, but facilities are
economically repairable
Level 3 2 2,475 Maximum
considered
earthquake
(MCE)
Non collapse of facilities but beyond
economical repair
Nat Hazards (2012) 60:541–565 543
1 3

8/16/2019 Shukla 2012
http://slidepdf.com/reader/full/shukla-2012 4/25
Khengarji III of Kachchh built an RCC jetty in 1931 where ships with draft of 8.8 m could
berth round the year. In 1955, Kandla was declared as a major port by the Transport
Ministry of Independent India, and almost twelve states of India are dependent on the
Kandla port for bulk cargo handling. Kandla port has 10 berths, 6 oil jetties, 1 maintenance
jetty, 1 dry dock, and small jetties for small vessels with present cargo handling capacityaround 40 million ton per annum (MTPA). Future plans include development of additional
four dry cargo berths and an offshore berthing facility involving huge investments.
3.2 Mundra port
Mundra port (latitude: 22.74N; longitude: 69.71E) is located at 60 km west of Gand-
hidham in Kachchh district of Gujarat, India. The port was initiated in 1998 by the Adani
Group as logistics base for their international trade operations when the port sector in India
was opened for private operators. It is an independent and commercial port with 8 mul-tipurpose berths, 4 container berths, and a single point mooring (SPM), presently capable
of handling of 30 MTPA cargo and has future plan to achieve 50 MTPA by the fast track
developments.
3.3 Hazira port
Hazira (Surat) port (latitude: 21.13N, longitude: 72.64E) is situated on the west side of
the Hazira (District Surat) peninsula, Gujarat, India. The major development of the port in
form of liquefied natural gas (LNG) terminal was carried out by Royal Dutch Shell group.Further developments in the form of construction of private bulk handling facilities by
various manufacturing groups are in progress and considerable amount of money is
invested to accommodate further vessel handling capacity for the future growth of this port.
3.4 Dahej port
Gujarat Chemical Port Terminal Company Limited (GCPTCL) (latitude: 21.69N, longi-
tude: 72.535E) is the most modern commercial port and storage terminal located at Dahej,
(District: Bharuch), Gujarat, India in the Gulf of Khambhat (Cambay) on the west coast of India. The Port is capable of handling vessels of 6,000 DWT to 60,000 DWT, and the
present Storage Terminal capacity is about 300,000 cubic meters of hazardous liquid and
gaseous chemicals falling in ‘A’, ‘B’, and ‘General’ classes. The location also includes
some private ports within the Dahej area including some future port facilities.
4 Seismicity of Gujarat
Gujarat state (bounded by Latitude 20
–25.5
N and Longitude 68
–75
E) is seismicallyone of the most active regions in India, which has experienced two significant damaging
earthquakes in 1819 ( M w = 7.8) and 2001 ( M w = 7.7) and seven earthquakes of magni-
tude M w C 6.0 during the past two centuries (Rastogi 2004). Petersen et al. (2004) tested
the sensitivity of seismic hazard to three fault source models for the Kachchh region,
Gujarat, and observed the recurrence intervals of 266–533 years on one of these faults.
Tripathi (2006), Yadav et al. (2008), and Choudhury and Shukla (2011) worked out a
544 Nat Hazards (2012) 60:541–565
1 3

8/16/2019 Shukla 2012
http://slidepdf.com/reader/full/shukla-2012 5/25
probabilistic hazard assessment for Kachchh region by considering various probability
distribution functions. The probabilistic seismic hazard assessment of Gujarat is a major
issue presently since it experienced a catastrophic event on January 26, 2001 ( M w = 7.7)
resulting in a huge loss of lives (14,000) and property. According to the seismic zonation
map of India as given in IS: 1893-Part I (2002), Gujarat state falls in all four different
seismic zones. Kachchh and the adjoining region along with the Pakistan border fall under
Zone-V (highest seismic zone). Zone-IV covers a narrow fringe of the northern Kathiawar
peninsula and the remaining part of Kachchh. The rest of Gujarat state falls under Zone-III,except a small eastern part bordering Madhya Pradesh state as Zone-II. Various researchers
have described the seismicity of Gujarat and adjoining regions, i.e., Bilham et al. (2001),
Biswas (2005), Gupta (2006), GSI (2000), Malik et al. (1999), Tripathi (2006), Yadav et al.
(2008, 2010). The Gujarat region has experienced random seismic activity at several places
such as Junagadh, Jamnagar, Dwarka, Paliyad, Rajkot, Ghogha, Bhavnagar, Narmada rift
zone, and Cambay rift zone. During the year 2008, 1,842 shocks with moment magnitude
M w from 0.5 to 4.4 were recorded in Gujarat state. Figure 1 describes the locations of
epicenters for various earthquakes recorded during 2006–2008 throughout entire Gujarat
State Seismic Network (GS-Net) as established by Institute of Seismological Research
(ISR), Gujarat. Large and moderate earthquakes are likely to occur in the future (Cho-
udhury and Shukla 2011), and it is essential to assess the hazard to aid engineers and public
officials in making decisions that will influence the economic and life safety policies for
Gujarat region (Petersen et al. 2004). According to IS:1893-Part 1 (2002), Kandla and
Mundra port sites are located in seismic Zone-V, whereas Hazira and Dahej port sites are
located in seismic Zone-III in the seismic zonation map of India.
Fig. 1 Epicenters of earthquakes during August 2006 to December 2008 recorded by ISR network (Ref.
Annual report of ISR 08-09, http://www.isr.gujarat.gov.in)
Nat Hazards (2012) 60:541–565 545
1 3

8/16/2019 Shukla 2012
http://slidepdf.com/reader/full/shukla-2012 6/25
5 Geotechnical characterization of soils in study areas
Representative soil profiles are established through careful evaluations of the available
geotechnical data from the geotechnical investigation carried out for the particular port
locations. As boring investigation represented most of the available information, in presentstudy, evaluation efforts are largely concerned with assimilations of the various soil
descriptions, SPT blow count, and density data indicated. Shear wave velocity for every
layer is estimated from the measured SPT blow counts ( N -value) using ten imperial cor-
relations given by Imai and Yoshimura (1970), Imai (1977), Seed and Idriss (1981), Imai
and Tonouchi (1982), Jinan (1987)*, Iyisan (1996), Athanasopoulos (1995)*, Jafari et al.
(1997), Yokota et al. (1991)*, Kiku (2001)* (*see Dikmen 2009), and Mhaske and Cho-
udhury (2011) on the correlations available in various literatures worldwide. The four
typical soil profiles used in present analysis are described in Tables 2, 3, 4, and 5. Mea-
sured SPT blow count variations are given in the Fig. 2. Estimated shear wave velocity
data are plotted in the Fig. 3, and average value of the all estimated shear wave velocity is
considered for further site-specific ground response analysis for port sites.
Table 2 Typical soil profile at Kandla port site
Depth Unit
weight
(kN/m3)
Average
SPT-value
Description Modulus reduction curve and
damping curve selectedFrom To Thk. (m)
0 17 17 15 10 Soft clay Sun et al. (1988)17 20 3 15 17 Stiff clay Vucetic and Dobry (1991)
20 24 4 18 35–40 Medium silty
sand
Idriss (1990), upper range
24 29 5 17 50 Stiff to very stiff clay Vucetic and Dobry (1991)
29 32 3 18 [50 Dense silty sandy
gravels
Roblee and Chiou (2004)
Table 3 Typical soil profile at Mundra port site
Depth Unit
weight
(kN/m3)
Average
SPT-value
Description Modulus reduction curve and
damping curve selectedFrom To Thk.
(m)
0 9 9 17 8 Loose to medium dense
silty sand
Seed and Idriss (1970);
average
9 13 4 18.5 10–35 Yellow to gray dense sand Idriss (1990), upper range
13 20 7 17 28–39 Sandy silty clay Vucetic and Dobry (1991),PI = 30
20 30 10 18.5 30–50 Very dense to dense silty
sand
Idriss (1990), upper range
30 38 8 20 40–50 Completely to highly
weathered yellow
sandstone
546 Nat Hazards (2012) 60:541–565
1 3

8/16/2019 Shukla 2012
http://slidepdf.com/reader/full/shukla-2012 7/25
6 Probabilistic seismic hazard analysis (PSHA) for ports of Gujarat
The hazard analysis is performed according to the procedures proposed by Cornell (1968)
and McGuire (1976). It is now most widely used approach to the problem for determining
the characteristics of strong ground motion for earthquake engineering. The analysis is
based on modeling the occurrence of an earthquake as a homogenous Poisson’s process
and the estimation of a peak ground acceleration (PGA) at a selected site in accordance
with appropriate PGA-distance ground motion attenuation relationships (GMARs). In
essence, the Probabilistic Seismic Hazard Analysis (PSHA) is expressed in terms of
probability of exceedance per unit time period, of a given measure of ground motion
intensity at a site by integrating the contributions of available geological, seismological,
and statistical information. The annual hazard curves are the result of the probabilistic
hazard analysis for a site; for a given region, the hazard maps can be obtained by
simultaneously making hazard analysis for many sites in the selected region and con-
structing the contour map for specified ground motion levels corresponding to given return
periods. The analysis of seismic hazard at given site requires an approach for estimating
Table 5 Typical soil profile at Dahej port site
Depth Unit
weight
(kN/m3)
Average
SPT-value
Description Modulus reduction
curve and damping
curve selectedFrom To Thk (m)
0 8 8 18 11–32 Dark gray fine to
medium sand
Seed and Idriss
(1970); average
8 14 6 14 10–39 Stiff clay Vucetic and Dobry
(1991)
14 32 18 19 19–58 Medium dense silty
fine to medium sand
Idriss (1990), upper
range
32 36 4 16 [50 Stiff clay Vucetic and Dobry
(1991)
36 48 12 20 [50 Very dense fine to
medium silty sand
Seed et al. (1986)
Table 4 Typical soil profile at Hazira port site
Depth Unit
weight
(kN/m3)
Average
N -value
Description Modulus reduction
curve and damping
curve selectedFrom To Thk (m)
0 4.5 4.5 16 4–9 Light greenish fine grained
sandy silt
Vucetic and Dobry
(1991); PI = 30
4.5 10.5 6.0 17 9 Light greenish fine-medium
grained sand
Seed and Idriss (1970);
average
10.5 18.0 7.5 17 17–28 Brownish sandy clay with
intermediate plasticity
Vucetic and Dobry (1991)
18.0 23.0 5.0 18 28–50 Brownish sandy silt Seed and Idriss (1970);
average
23.0 30 7.0 19 [50 Medium coarse grained
sand with gravel
Idriss (1990), upper range
Nat Hazards (2012) 60:541–565 547
1 3

8/16/2019 Shukla 2012
http://slidepdf.com/reader/full/shukla-2012 8/25
the probability that particular level of ground motion will be exceeded at a selected
location in some period of interest (usually expressed in return periods). In the present
study, the entire Gujarat region is divided into three sub-regions based on the seismo-
tectonic setting and probable fault map is prepared (Fig. 4). The prepared fault map is then
0 20 40 60 80 100
40
35
30
25
20
15
10
5
0
0 20 40 60 80 100 0 20 40 60 80 100 0 20 40 60 80 100
Hazira port siteMundra port site
D e p t h ( m )
SPT N-Value
Borehole 1
Borehole 2
Kandla port site
Borehole 1
Borehole 2
Dahej port site
Borehole 1
Borehole 2
Borehole 1
Borehole 2
Fig. 2 Typical variation of SPT N-values at various port sites of Gujarat
0 200 400 600 800 1000 1200
25
20
15
10
5
0
200 400 600 800
40
35
30
25
20
15
10
5
0
Average (used in present study) Imai, 1977 (for all soils)
Jinan, 1987 (for all soils)
Imai and Yoshimura, 1970 (for all soils) Imai and Tonouchi, 1982 (for all soils)
Iyisan (for all soils)
Jafari et al., 1997 (for all soils) Yokota et al., 1991 (for all soils)
Seed and Idriss, 1981 (for all soils)
Athanasopoulos, 1995 (for all soils) Kiku, 2001 (for all soils)
D e p t h ( m )
Shear Wave Velocity (m/sec)
Kandla Port site Mundra Port site
D e p t h ( m )
Shear Wave Velocity (m/sec)
0 100 200 300 400 500 600
30
25
20
15
10
5
0
0 100200300400500600700800
50
45
40
35
30
25
20
15
10
5
0
Average (used in present study) Imai, 1977 (for all soils)
Jinan, 1987 (for all soils)
Imai and Yoshimura, 1970 (for all soils) Imai and Tonouchi, 1982 (for all soils)
Iyisan (for all soils) Jafari et al., 1997 (for all soils)
Yokota et al., 1991 (for all soils)
Seed and Idriss, 1981 (for all soils) Athanasopoulos, 1995 (for all soils)
Kiku, 2001 (for all soils)
D e p t h ( m )
Shear Wave Velocity (m/sec)
Hazira port site Dahej port site
D e p t h ( m )
Shear Wave Velocity (m/sec)
Fig. 3 Typical variation of the estimated shear wave velocity at various port sites of Gujarat
548 Nat Hazards (2012) 60:541–565
1 3
8/16/2019 Shukla 2012
http://slidepdf.com/reader/full/shukla-2012 9/25
used to calculate the probabilistic seismic hazard associated with port sites. Detailed
methodologies adopted along with simplification made for the present study are described
in the following sections.
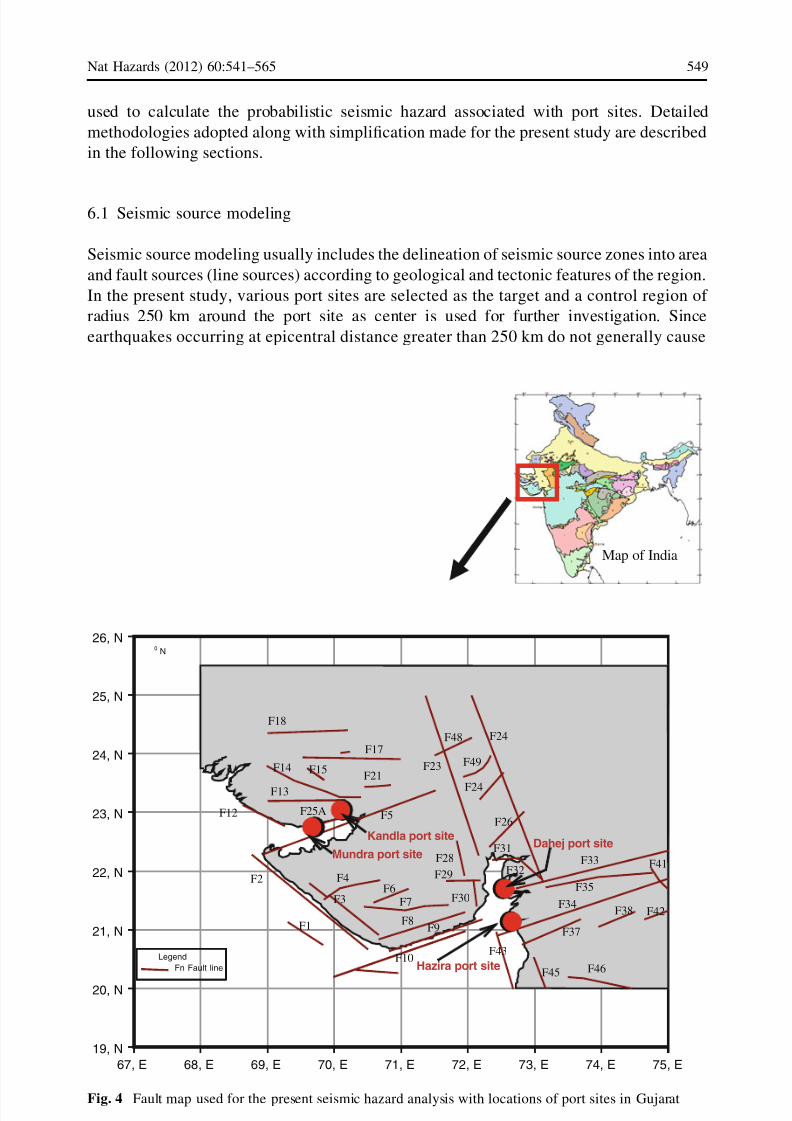
6.1 Seismic source modeling
Seismic source modeling usually includes the delineation of seismic source zones into area
and fault sources (line sources) according to geological and tectonic features of the region.
In the present study, various port sites are selected as the target and a control region of
radius 250 km around the port site as center is used for further investigation. Since
earthquakes occurring at epicentral distance greater than 250 km do not generally cause
67, E 68, E 69, E 70, E 71, E 72, E 73, E 74, E 75, E
19, N
20, N
21, N
22, N
23, N
24, N
25, N
26, N
F18
F17
F14 F15
F13
F12 F25AF5
F2
F1
F4
F3
F6
F7
F8
F10
F9
F33
F35
F34
F37
F38 F42
F41
F43
F45 F46
F31
F32
F24
F49F23
F48
F24
F26
F21
F28
F29
F30
Kandla port site
Mundra port site
Hazira port site
Dahej port site
Fn Fault line
Legend
0 N
Map of India
Fig. 4 Fault map used for the present seismic hazard analysis with locations of port sites in Gujarat
Nat Hazards (2012) 60:541–565 549
1 3

8/16/2019 Shukla 2012
http://slidepdf.com/reader/full/shukla-2012 10/25
structural damage, the faults located beyond maximum distance of 250 km from a par-
ticular site are not considered as the tectonic features for port site under consideration. A
total of 40 major faults, along with major earthquake events, which influence seismic
hazard at Gujarat, are considered in the present study as also given by Shukla and
Choudhury (2011).
6.2 Magnitude recurrence relationship
Development of a magnitude recurrence relationship is done based on the historical and
geological data in the form
Logð N Þ ¼ a bM ð1Þ
as proposed by Gutenberg and Richter (1944), where N = Number of earthquake per year,
M = earthquake magnitude, a, b = Gutenberg and Richter parameters. Using earthquake
catalog of Institute of Seismological Research, Gujarat, the Gutenberg–Richter (G–R)
recurrence relationships for three regions of Gujarat as proposed by Choudhury and Shukla
(2011) are adopted for the present study for further analysis. These regional recurrence
relations are then converted in fault recurrence relations using the procedure adopted by
Raghu Kanth and Iyengar (2006), Anbazhagan et al. (2009), and Shukla and Choudhury
(2011). Assuming one-third of the total fault length as rupture length, the maximum
magnitude each fault can produce is estimated by using the relationship given by Bonilla
et al. (1984), Nowroozi (1985), Slemmon (1989), and Wells and Coppersmith (1994). The
minimum values out of the estimated maximum earthquake magnitude using the rela-
tionships are then assigned to each delineated faults (Fig. 4) for probabilistic seismichazard analysis.
6.3 Recurrence forecasting and seismic hazard
It is assumed that the occurrence of earthquakes in a seismic source can be estimated from
Poisson’s process. Then, the probability that a given site, a ground motion parameter, Z ,
will exceed a specific level, z, during the specified time, T , is represented by the expression.
Pð Z [ zÞ ¼ 1 emð zÞT mð zÞT ð2Þ
where m( z) is the average frequency during the time period T in terms of mean annual rate
of exceedance. Above equation allows one to compute the probability of exceeding
( Z [ z) specified level for a given magnitude and distance. The magnitude and distance of
the future earthquakes are not yet known, but by selecting their probability distributions
that can be combined by using the total probability theorem in form of the following
equation
Pð Z [ zÞ ¼
Z mmax
mmin
Z r max
0
Pð Z [ zÞ=m; r Þ f M ðmÞ f Rðr Þdr dm ð3Þ
where P( Z [ z / m, r ) comes from the ground motion model as given by Eq. 2, f M (m) and
f R(r ) are selected probability distribution function for magnitude and distance, and we then
integrate over all considered magnitude (i.e., mmin = 4 and mmax = maximum magnitude
correspond to each fault) and distances (0–250 km in the present study). The integration
operation adds up the conditional probabilities of exceedance associated with all possible
550 Nat Hazards (2012) 60:541–565
1 3

8/16/2019 Shukla 2012
http://slidepdf.com/reader/full/shukla-2012 11/25
magnitudes and distances. Equation 3 is a probability of exceedance given and earthquake
and does not include any information about how often earthquakes occur on the source of
interest. With some modifications, rate of Z [ z can be computed, rather than the proba-
bility of Z [ z for given occurrence of an earthquake.
kð Z [ zÞ ¼ kð M [mminÞ
Z mmax
mmin
Z r max
0
Pð Z [ zÞ=m; r Þ f M ðmÞ f Rðr Þdr dm ð4Þ
where k( M [mmin) is the rate of occurrence of earthquakes greater than mmin ( M w = 4)
from the source, and k( Z [ z) is the rate of Z [ z. To generalize the analysis further, in the
present study, cases with more than one fault source are considered. Recognizing that the
rate of Z [ z when considering all source is simply the sum of the rates of Z [ z from each
individual source, one can finally write
kð Z [ zÞ ¼Xnsourcei¼1
kð M i[mminÞ
Z mmax
mmin
Z r max
0
Pð Z [ zÞ=m; r Þ f M ðmÞ f Rðr Þdr dm ð5Þ
6.4 Ground motion attenuation relationships (GMARs)
Ground motion attenuation relations are used to predict the attenuation of ground motions
as function of distance from the earthquake location. Raghu Kanth and Iyengar ( 2007) had
proposed an empirical GMAR for Peninsular India based on the stochastic seismologicalmodel and compared it with instrumented data from Koyna (1967) and Bhuj (2001)
earthquakes. Apart from the GMAR given by Raghu Kanth and Iyengar (2007), several
other GMARs were also employed to have a chance for comparison for the present study.
For shallow crustal earthquakes, GMAR proposed by Abrahamson and Silva (1997) is
applicable and used in the present study. Comparison made by Petersen et al. (2004) has
revealed that the crustal intraplate relation of Frankel et al. (1996) yields ground motions
similar to the strong ground motion data recorded from the 2001 earthquake at large
distances. In the present study, the crustal intraplate GMARs from Toro et al. (1997),
Frankel et al. (1996), and other GMARS given by Boore et al. (1997), Campbell (1997)
and Sadigh et al. (1997) are also considered for the comparison.
7 Seismic hazard computations
For each port site, the total hazard contribution given by each fault within the control
region of 250 km (r max) is evaluated using Eq. 5 and GMARs to finally obtain the total
hazard in terms of probability of exceedance for different level of ground motions.The
OLE, CLE, and MCE were represented in the present study with 50, 10, and 2% proba-bility of exceedance in 50 years (i.e., with 72, 475, and 2,475 year return periods),
respectively. The seismic hazard is computed at 12 spectral periods ranging from 0 to 4 s
for each site under consideration. To make the results of probabilistic seismic hazard
assessment clearer and more useful for engineering use, deaggregation procedure is used.
The mean hazard by seismic source for each site was identified and further used to develop
uniform hazard spectra for horizontal component of ground motion. The epistemic
Nat Hazards (2012) 60:541–565 551
1 3

8/16/2019 Shukla 2012
http://slidepdf.com/reader/full/shukla-2012 12/25
uncertainty in the hazard was handled using the logic tree approach as adopted by Shukla
and Choudhury (2011).
8 Uniform hazard spectra and synthetic time histories
Numerical seismic analysis of soil profile and port facilities includes acceleration time
history representation of the site-specific ground motions. These accelerogram should be
consistent with the design spectra developed for the site and should represent the antici-
pated shaking given by return period based spectra. The horizontal component of the
uniform hazard spectra for the rock site corresponding to return periods of the 72, 475, and
2,475 years and 5% damping is developed based on the seismic hazard computations for
the each port site as shown in Fig. 5. These generated uniform hazard spectra (UHS) do not
represent ground motion for a single earthquake, but may be considered as a combinationof the ground motion parameter (i.e., ground acceleration), which will not exceed with a
certain probability in specified time span (i.e., 10% in 50 years). Generated UHS are
0.01 0.1 1 10
0.01
0.1
1
0.01 0.1 1 10
0.01
0.1
1
10
0.01 0.1 1 10
1E-3
0.01
0.1
1
10
0.01 0.1 1 10
1E-3
0.01
0.1
1
10
S p e c t r a l A c c e l e r a t i o n s ( g )
Kandla port site
Mundra port site
Hazira port site
Level 3 ground motion (2475-year Return Period)
Level 2 ground motion(475-year Return Period)
Level 1 ground motion(72-year Return Period)
IS:1893-2002, Soft Soil
Spectral period (sec)
Dahej port site
Fig. 5 Uniform hazard spectra
(horizontal component for 5%
damping) for the different levels
of design ground motions for
typical port sites compared with
specified spectra of IS:1893
(2002)
552 Nat Hazards (2012) 60:541–565
1 3

8/16/2019 Shukla 2012
http://slidepdf.com/reader/full/shukla-2012 13/25
compared with the response spectra specified by seismic design code of India IS:
1893-Part 1 (2002). The spectral matching procedure is then adopted to generate design
ground motion time histories by taking actual earthquake accelerogram and adjusting them
to match a design response spectrum developed for each site. By matching uniform hazard
spectrum, the design ground motion will consider the likelihood of earthquake occurring atall surrounding faults, as well as the ground motion arising at a site from earthquakes of
various magnitudes and distances. The longitudinal components of real ground accelera-
tion time history of the Bhuj earthquake of January 2001, recorded at ground floor of the
Passport office building in Ahmedabad, is selected as the input ground motion for the
spectral matching. The input ground motion is modified to match the obtained horizontal
uniform hazard spectra (UHS) using the program RSPMATCH (Abrahamson 1998) using
the time-domain approach. The aim of this approach is to preserve the general non-
stationary character of the ground motion in the acceleration, velocity, and displacement
while modifying the spectral response to match a given target response spectra. Typical
input uniform spectra for three levels of ground shaking, input ground motion spectra of
Bhuj earthquake and matched spectra are presented in the Fig. 6 for Hazira port site. The
design acceleration time history compatible to three levels of ground motion shaking (i.e.,
with return periods of 72, 475, and 2,475 years) for each port site are shown in Fig. 7.
0.01
0.1
1
10Level 3 ground motion(2475 years return period)
Target Spectra
at Starting for match
Matched Spectra
Original Spectra
0.01
0.1
1
10
Level 2 ground motion(475 years return period)
0.01 0.1 1 10
1E-3
0.01
0.1
1
10Level 1 ground motion(72 years return period)
S p e c t r a l A c c e l e r
a t i o n s ( g )
Spectral period (sec)
Hazira port siteFig. 6 Typical spectral
matching for Hazira port site
corresponding to the uniform
hazard spectra developed inpresent study for various design
ground motion levels
Nat Hazards (2012) 60:541–565 553
1 3

8/16/2019 Shukla 2012
http://slidepdf.com/reader/full/shukla-2012 14/25
0 10 20 30 40 50 60 70 80 90 100
-1.2
-0.8
-0.4
0.0
0.4
0.8
1.2
S p e c t r a l A c c e l e
r a t i o n s ( g )
Time (sec)
Bhuj Earthquake 2001 (recorded at Ahemedand passport office, N-W component)Level 3 ground motion(2475 years return period)Level 2 ground motion(475 years return period)Level 1ground motion(72 years return period)
Kandla Port
0 10 20 30 40 50 60 70 80 90 100
-1.2
-0.8
-0.4
0.0
0.4
0.8
1.2
S p e c t r a l A c c e l e r a t i o n s ( g )
Time (sec)
Bhuj Earthquake 2001 (recorded at Ahemedand passport office, N-W component)Level 3 ground motion(2475 years return period)Level 2 ground motion(475 years return period)Level 1ground motion(72 years return period)
Mundra Port
0 10 20 30 40 50 60 70 80 90 100
-1.2
-0.8
-0.4
0.0
0.4
0.8
1.2
S p e c t r a l A c c e l e r a t i o n s ( g )
Time (sec)
Bhuj Earthquake 2001 (recorded at Ahemedand passport office, N-W component)Level 3 ground motion(2475 years return period)
Level 2 ground motion(475 years return period)Level 1ground motion(72 years return period)
Hazira Port
0 10 20 30 40 50 60 70 80 90 100
-1.2
-0.8
-0.4
0.0
0.4
0.8
1.2
S p e c t r a l A c c e l e r a t i o n s ( g )
Time (sec)
Bhuj Earthquake 2001 (recorded at Ahemedand passport office, N-W component)Level 3 ground motion(2475 years return period)Level 2 ground motion(475 years return period)Level 1ground motion(72 years return period)
Dahej Port
Fig. 7 Generated design ground motions in terms of acceleration time histories for various design levels
ground shaking
554 Nat Hazards (2012) 60:541–565
1 3

8/16/2019 Shukla 2012
http://slidepdf.com/reader/full/shukla-2012 15/25

8/16/2019 Shukla 2012
http://slidepdf.com/reader/full/shukla-2012 16/25
predicts the shear wave velocity very close to the average compared with the other formulae.
Lower bound estimate is observed using the formula given by Kiku (Dikmen 2009), and
upper bound estimate is observed using the formula given by Athanasopoulos (Dikmen 2009)
and Jafari et al. (1997) out of 10 empirical formulae used.
0.01 0.1 1 10
0.01
0.1
1
10
P s e u d o - A c c e l e r a t i o n ( g )
Period (sec)
Layer 1, Damping: 5.0%
Layer 2, Damping: 5.0%
Layer 3, Damping: 5.0%
Layer 4, Damping: 5.0%
Level 1 ground motion(72 years return period)
0.1 1 100.00
0.25
0.50
0.75
1.00
1.25
1.50
Level 1ground motion(72 years return period) A m p l i f i c a t i o n r a t i o
Frequency(Hz)
Layer 1 to Bedrock
Layer 2 to Bedrock
Layer 3 to Bedrock
Layer 4 to Bedrock
0.01 0.1 1 100.01
0.1
1
10
P s e u d o - A c c e l e r a t i o n ( g )
Period (sec)
Layer 1, Damping: 5.0%
Layer 2, Damping: 5.0%
Layer 3, Damping: 5.0%
Layer 4, Damping: 5.0%
Level 2 ground motion(475 years return period)
Level 2 ground motion(475 years return period)
0.1 1 100.00
0.25
0.50
0.75
1.00
1.25
1.50
1.75
2.00
A m p l i f i c a t i o n r a t i o
Frequency(Hz)
Layer 1 to Bedrock
Layer 2 to Bedrock
Layer 3 to Bedrock
Layer 4 to Bedrock
0.01 0.1 1 10
0.1
1
10
P s e u d o
- A c c e l e r a t i o n ( g )
Period (sec)
Layer 1, Damping: 5.0%
Layer 2, Damping: 5.0%
Layer 3, Damping: 5.0%
Layer 4, Damping: 5.0%
Level 3 ground motion (2475 years r eturn period)
Level 3 ground motion(2475 years return period)
0.1 1 10
0.00
0.25
0.50
0.75
1.00
1.25
1.50
1.75
2.00
2.25
2.50
A
m p l i f i c a t i o n r a t i o
Frequency(Hz)
Layer 1 to Bedrock
Layer 2 to Bedrock
Layer 3 to Bedrock
Layer 4 to Bedrock
A
Fig. 8 a Pseudo-acceleration response spectra and amplification ratio for the Kandla port site for three
design ground motions. b Pseudo-acceleration response spectra and amplification ratio for the Mundra port
site for three design ground motions. c Pseudo-acceleration response spectra and amplification ratio for the
Hazira port site for three design ground motions. d Pseudo-acceleration response spectra and amplificationratio for the Dahej port site for three design ground motions
556 Nat Hazards (2012) 60:541–565
1 3

8/16/2019 Shukla 2012
http://slidepdf.com/reader/full/shukla-2012 17/25
10.2 Seismic hazard computations and uniform hazard spectra (UHS)
Seismic hazard computed for each port site using the weighted average of all the GMARs
is given in Table 6. From the deaggregation of the seismic hazard, it is observed that for
fault F13, F25A, F14, and F12 are having major contributions of the expected seismic
hazard for Kandla port site and fault F25A and F13 contribute largely for Mundra port site.
0.01 0.1 1 10
0.01
0.1
1
P s e u d o -
A c c e l e r a t i o n ( g )
P s e u d o - A c c e l e r a t i o n ( g )
Layer 4, Damping: 5.0%
Layer 1, Damping: 5.0%
Layer 2, Damping: 5.0%
Layer 3, Damping: 5.0%
P s e u d o - A c c e l e r a t i o n ( g )
0.1 1 10
0.00
0.25
0.50
0.75
1.00
1.25
1.50
1.75
2.00
A m p l i f
i c a t i o n r a t i o
A m p l i f i c a t i o n r a t i o
A m p l i f i c a t i o n
r a t i o
Layer 4 to Bedrock
Layer 1 to Bedrock
Layer 2 to Bedrock
Layer 3 to Bedrock
0.01 0.1 1 10
0.01
0.1
1
Level 2(475 years return period)
Layer 4, Damping: 5.0%
Layer 1, Damping: 5.0%
Layer 2, Damping: 5.0%
Layer 3, Damping: 5.0%
0.1 1 10
0.00
0.25
0.50
0.75
1.00
1.25
1.50
1.75
2.00
Level 2(475 years return period)
Layer 4 to Bedrock
Layer 1 to Bedrock
Layer 2 to Bedrock
Layer 3 to Bedrock
0.01 0.1 1 10
0.1
1
10
Level 3(2475 years return period)Level 3(2475 years return period)
Layer 4, Damping: 5.0%
Layer 1, Damping: 5.0%
Layer 2, Damping: 5.0%
Layer 3, Damping: 5.0%
0.1 1 10
0.00
0.25
0.50
0.75
1.00
1.25
1.50
1.75
2.00
Level 1 ground motion(72 years return period)
Level 1 ground motion(72 years return period)
Frequency(Hz)Frequency(Hz)
Frequency(Hz)Frequency(Hz)
Frequency(Hz)Frequency(Hz)
Layer 4 to Bedrock
Layer 1 to Bedrock
Layer 2 to Bedrock
Layer 3 to Bedrock
B
Fig. 8 continued
Nat Hazards (2012) 60:541–565 557
1 3

8/16/2019 Shukla 2012
http://slidepdf.com/reader/full/shukla-2012 18/25
For Hazira port site F34 and for Dahej port site, F33 and F30 contribute largely for
expected seismic hazard. The computed hazard for the various port sites is described in
Table 6. For frequency of exceedance of 0.01, the computed hazard shows higher hazard
for Kandla and Mundra port site with PGA, 0.236 and 0.18 g, respectively, whereas for
Hazira and Mundra ports, almost same hazard with PGA, 0.13 and 0.137 g, respectively,
are obtained. Similarly, the hazard values are computed for other time periods and used in
development of uniform hazard spectra.
0.01 0.1 1 10
0.01
0.1
1
P s e u d o - A c c e l e r a t i o
n ( g )
Period (sec)
Layer 1, Damping: 5.0%
Layer 2, Damping: 5.0%
Layer 3, Damping: 5.0%
Layer 4, Damping: 5.0%
Layer 5, Damping: 5.0%
0.1 1 10
0.00
0.25
0.50
0.75
1.00
1.25
1.50
1.75
2.00
Level 1 ground motion(72 years return period)
A m p l i f i c a t i o n r a
t i o
Frequency(Hz)
Layer 1 to Bedrock
Layer 2 to Bedrock
Layer 3 to Bedrock
Layer 4 to Bedrock
Layer 5 to Bedrock
0.01 0.1 1 10
0.01
0.1
1
Level 2 ground motion(475 years return period)
P s e u d o - A c c e l e r a t i o n ( g )
Period (sec)
Layer 1, Damping: 5.0%
Layer 2, Damping: 5.0%
Layer 3, Damping: 5.0%
Layer 4, Damping: 5.0%
Layer 5, Damping: 5.0%
0.1 1 10
0.00
0.25
0.50
0.75
1.00
1.25
1.50
1.75
2.00
Level 2 ground motion(475 years return period) A m p l i f i c a t i o n r a t i o
Frequency(Hz)
Layer 1 to Bedrock
Layer 2 to Bedrock
Layer 3 to Bedrock
Layer 4 to Bedrock
Layer 5 to Bedrock
0.01 0.1 1 10
0.01
0.1
1
Level 3 ground motion(2475 years return period)
P s e u d o
- A c c e l e r a t i o n ( g )
Period (sec)
Layer 1, Damping: 5.0%
Layer 2, Damping: 5.0%
Layer 3, Damping: 5.0%
Layer 4, Damping: 5.0%
Layer 5, Damping: 5.0%
0.1 1 10
0.00
0.25
0.50
0.75
1.00
1.25
1.50
1.75
2.00
Level 3 ground motion(2475 years return period)
Level 1 ground motion(72 years return period)
A m p
l i f i c a t i o n r a t i o
Frequency(Hz)
Layer 1 to Bedrock
Layer 2 to Bedrock
Layer 3 to Bedrock
Layer 4 to Bedrock
Layer 5 to Bedrock
C
Fig. 8 continued
558 Nat Hazards (2012) 60:541–565
1 3

8/16/2019 Shukla 2012
http://slidepdf.com/reader/full/shukla-2012 19/25
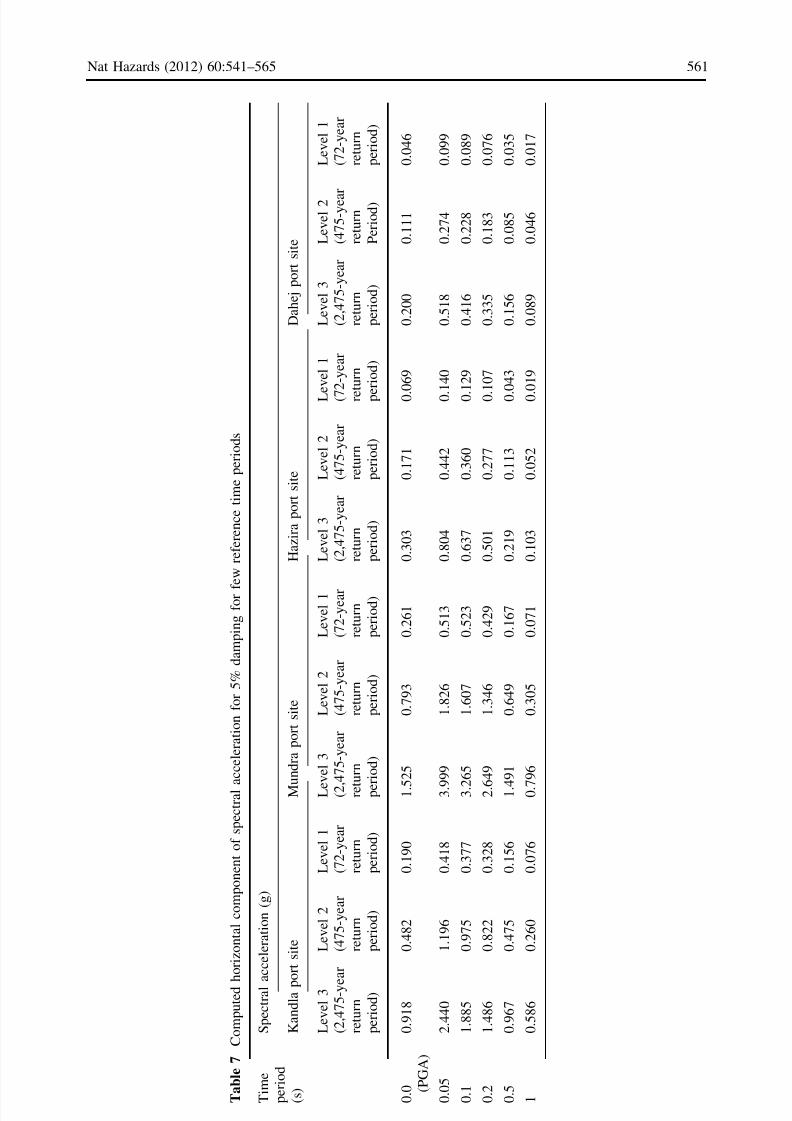
Uniform hazard spectra for the three levels of ground motions as per guidelines given by
PIANC (2001) are developed for the four port sites studied representing uniform level of
probabilistic seismic hazard at all periods. In present study, the 5% damping is selected in
order to compare the generated spectra with the spectra specified by IS: 1893 Part I (2002).
Sokolov (2000) has noted that Uniform Hazard Spectra generated this way can represent
spectra of small and large, nearby and distant earthquake events. The obtained spectral
accelerations for few specified time periods are given in Table 7. For Mundra port site, the
0.01 0.1 1 10
0.01
0.1
1
Level 1 ground motion(72 years return period)
Level 1ground motion(72 years return period)
P s e u d o - A c c e l e r a t i o n ( g )
Period (sec)
Layer 1, Damping: 5.0%
Layer 2, Damping: 5.0%
Layer 3, Damping: 5.0%
Layer 4, Damping: 5.0%
Layer 5, Damping: 5.0%
0.1 1 10
0.00
0.25
0.50
0.75
1.00
1.25
1.50
1.75
2.00
A m p l i f i c a t i o n r a
t i o
Frequency(Hz)
Layer 1 to Bedrock
Layer 2 to Bedrock
Layer 3 to Bedrock
Layer 4 to Bedrock
Layer 5 to Bedrock
0.01 0.1 1 10
0.01
0.1
1
P s e u d o - A c c e l e r a t i o n ( g )
Period (sec)
Layer 1, Damping: 5.0%
Layer 2, Damping: 5.0%
Layer 3, Damping: 5.0%
Layer 4, Damping: 5.0%
Layer 5, Damping: 5.0%
0.1 1 10
0.00
0.25
0.50
0.75
1.00
1.25
1.50
1.75
2.00
A m p l i f i c a t i o n r a t i o
Frequency(Hz)
Layer 1 to Bedrock
Layer 2 to Bedrock
Layer 3 to Bedrock
Layer 4 to Bedrock
Layer 5 to Bedrock
0.01 0.1 1 10
0.01
0.1
1
Level 3 ground motion(2475 years return period)
P s e u d
o - A c c e l e r a t i o n ( g )
Period (sec)
Layer 1, Damping: 5.0%
Layer 2, Damping: 5.0%
Layer 3, Damping: 5.0%
Layer 4, Damping: 5.0%
Layer 5, Damping: 5.0%
0.1 1 10
0.00
0.25
0.50
0.75
1.00
1.25
1.50
1.75
2.00
Level 2 ground motion(475 years return period)
Level 2 ground motion(475 years return period)
Level 3 ground motion(2475 years return period) A m
p l i f i c a t i o n r a t i o
Frequency(Hz)
Layer 1 to Bedrock
Layer 2 to Bedrock
Layer 3 to Bedrock
Layer 4 to Bedrock
Layer 5 to Bedrock
D
Fig. 8 continued
Nat Hazards (2012) 60:541–565 559
1 3

8/16/2019 Shukla 2012
http://slidepdf.com/reader/full/shukla-2012 20/25
obtained spectral accelerations are highest compared with all other sites. This is possibly due
to its proximity of the faults F13 and F25A, whereas expected spectral acceleration for
Kandla is comparatively less. The lowest spectral acceleration is obtained for Dahej port site.
Having been close to the Narmada Son Lineament (F34), Hazira port site has greater spectral
acceleration compared with the Dahej port site. For level 1 ground motions (return period of
72 years), the expected ground motions are 0.19, 0.26, 0.069, and 0.046 g for Kandla,
Mundra, Hazira, and Dahej port sites, respectively, and similarly can be obtained from the
Fig. 7 for other level of ground motions for seismic design purposes. Though it is not
explicitly mentioned in the code, but in the foreword of the code IS:1893-Part 1 (2002), it has
been assumed that the specified MCE (Maximum Considered Earthquake) spectra corre-
spond to 100 years of exposure time with 50% confidence level, whereas DBE (Design Basis
Earthquake)corresponds to 50 years of exposure time and with 90% confidence level. Thisfurther shows that the specified code which is specifically described for buildings cannot be
used for port structures directly and this has been also demonstrated by the guidelines given
by PIANC (2001) and Werner (1998). It is also clear from the comparison with IS: 1893-Part
1 (2002) spectra that specified spectra given in the code underestimate the ground motions at
lower time periods. Corresponding time histories are further estimated through RSPMATCH
code for the UHS obtained for three level of ground motion for all four port sites (Fig. 7) to
use them in performance-based design and time history analysis.
10.3 Ground response analysis and site amplifications
Using generated time histories for three levels of ground motions for each port site, the
results of ground response analysis are typically presented in the form of the spectral
response and transfer function calculated for each layer of the soil profile (Fig. 8). For
Kandla port site, the observed amplification factor is observed to be around 1.37 for
frequency range between 1.37 and 2.1 Hz. It is also observed that the amplification factor
Table 6 Total hazard computed
for horizontal ground motion for
5% damping at zero period
Annual frequency
of exceedance
Peak (horizontal) ground acceleration (g)
Mundra
port site
Kandla
port site
Hazira
port site
Dahej
port site
0.0001 0.710 0.713 0.711 0.717
0.001 0.506 0.527 0.463 0.504
0.01 0.180 0.236 0.130 0.137
0.02 0.106 0.164 0.061 0.057
0.05 0.053 0.084 0.021 0.012
0.07 0.042 0.059 0.014 0.006
0.1 0.033 0.038 0.007 0.003
0.2 0.019 0.013 0.001 *0.00
0.3 0.012 0.006 *0.00 *0.00
0.4 0.008 0.003 *0.00 *0.000.5 0.005 0.002 *0.00 *0.00
0.7 0.003 0.001 *0.00 *0.00
1 0.001 *0.00 *0.00 *0.00
2 *0.00 *0.00 *0.00 *0.00
3 *0.00 *0.00 *0.00 *0.00
560 Nat Hazards (2012) 60:541–565
1 3
8/16/2019 Shukla 2012
http://slidepdf.com/reader/full/shukla-2012 21/25
T a b l e 7
C o m p u t e d h o r i z o n t a l c o m p o n e n t o f s p e c t r a l a c c e l e r a t i o n f o r 5 % d a m p i n g f o r f
e w r e f e r e n c e t i m e p e r i o d s
T i m e
p e r i o d
( s )
S p e c t r a l a c c e l e r a t i o n ( g )
K a n d l a p o r t s i t e
M u n d r a p o r t s i t e
H a z i r a p o r t s i t e
D a h e j p o r t s i t e
L e v e l 3
( 2 , 4
7 5 - y e
a r
r e t u r n
p e r i o d )
L e v e l 2
( 4 7 5 - y e a r
r e t u r n
p e r i o d )
L e v e l 1
( 7 2 - y e a r
r e t u r n
p e r i o d )
L e v e l 3
( 2 , 4
7 5 - y e a r
r e t u r n
p e r i o d )
L e v e l 2
( 4 7 5 - y e a r
r e t u r n
p e r i o d )
L e v e l 1
( 7 2 - y e a r
r e t u r n
p e r i o d )
L e v e l 3
( 2 , 4
7 5 - y e a r
r e t u r n
p e r i o d )
L e v e l 2
( 4 7 5 - y e a r
r e t u r n
p e r i o d )
L e
v e l 1
( 7 2 - y e a r
r e t u r n
p e
r i o d )
L e v e l 3
( 2 , 4
7 5 - y e a r
r e t u r n
p e r i o d )
L e v e l 2
( 4 7 5 - y e a r
r e t u r n
P e r i o d )
L e v e l 1
( 7 2 - y e a r
r e t u r n
p e r i o d )
0 . 0 ( P G A )
0 . 9
1 8
0 . 4
8 2
0 . 1
9 0
1 . 5
2 5
0 . 7
9 3
0 . 2
6 1
0 . 3
0 3
0 . 1
7 1
0 . 0 6 9
0 . 2
0 0
0 . 1
1 1
0 . 0
4 6
0 . 0
5
2 . 4
4 0
1 . 1
9 6
0 . 4
1 8
3 . 9
9 9
1 . 8
2 6
0 . 5
1 3
0 . 8
0 4
0 . 4
4 2
0 . 1 4 0
0 . 5
1 8
0 . 2
7 4
0 . 0
9 9
0 . 1
1 . 8
8 5
0 . 9
7 5
0 . 3
7 7
3 . 2
6 5
1 . 6
0 7
0 . 5
2 3
0 . 6
3 7
0 . 3
6 0
0 . 1 2 9
0 . 4
1 6
0 . 2
2 8
0 . 0
8 9
0 . 2
1 . 4
8 6
0 . 8
2 2
0 . 3
2 8
2 . 6
4 9
1 . 3
4 6
0 . 4
2 9
0 . 5
0 1
0 . 2
7 7
0 . 1 0 7
0 . 3
3 5
0 . 1
8 3
0 . 0
7 6
0 . 5
0 . 9
6 7
0 . 4
7 5
0 . 1
5 6
1 . 4
9 1
0 . 6
4 9
0 . 1
6 7
0 . 2
1 9
0 . 1
1 3
0 . 0 4 3
0 . 1
5 6
0 . 0
8 5
0 . 0
3 5
1
0 . 5
8 6
0 . 2
6 0
0 . 0
7 6
0 . 7
9 6
0 . 3
0 5
0 . 0
7 1
0 . 1
0 3
0 . 0
5 2
0 . 0 1 9
0 . 0
8 9
0 . 0
4 6
0 . 0
1 7
Nat Hazards (2012) 60:541–565 561
1 3

8/16/2019 Shukla 2012
http://slidepdf.com/reader/full/shukla-2012 22/25
for free-field ground motion (Layer 1) has higher value compared with other layers. For
Mundra port site, amplification factors are found to be from 1.94 to 1.74 for free-field
ground motions, for the frequency range between 1.0 and 2.5 Hz. For Level 1 ground
motion, layer 1 has greater amplification factor, whereas for Level 2 and Level 3 ground
motions, layer 2 observed to be amplified more compared with other layers. For Haziraport site, the amplification factors are from 1.86 to 1.91 for the frequency range between
2.2 and 2.74 Hz. For level 2 and level 3 ground motions, amplification factors for layer 2
are greater than layer 1. For Dahej port site, the amplification factors are from 1.59 to 1.61
for the frequency range between 2 and 1.6 Hz for three levels of ground motions. The
amplification of the layer 2 is observed to be more compared with other layers of soil
profile. Statistical analyses of ground amplification records have shown that PGA is most
likely to amplify when fundamental resonant frequency of site exceeds 2–3 Hz (Pitilakis
2004) and the same has been observed in the present study. This behavior of amplification
of the spectral acceleration may be attributed to the soft soil deposits subjected to strong
dynamic loading which makes the ground weaker (decrease in shear strength), and hence
peak acceleration becomes smaller and the predominant period of soil profile is shifted to
higher value due to non-linear behavior (Pitilakis 2004). Consequently, amplification
occurs under small ground shaking with decrease in absolute value as the ground shaking
level is increased.
The frequency dependence of the site amplification has shown common properties at all
sites for all design ground motions. The increase in amplification factor is quite clear as
level of ground shaking increased for all port sites. The ground response analysis has
shown clearly that effective amplification by a factor above 1.3–2.0 occurs in the frequency
band of 1–3 Hz. Although the port sites were located on different sedimentary units,significant variation in the amplification characteristics was not detected except for Mundra
and Hazira port sites where free-field ground motions are less compared with the internal
layers. Considerable damage to cargo berth of Kandla port site due to ground amplification
and liquefactions is well within the observed response obtained in the present study.
The results of the present study demonstrate that integrated approach for evaluating
‘‘site-specific’’ seismic hazard in terms of ground motion parameters and site amplification
study provides an accurate prediction of ‘‘site and region-dependent’’ ground motion
parameters for the port sites of Gujarat. The amplitudes of the uniform hazard spectra
strictly depend on the local soil conditions, and one single design code, i.e., IS: 1893-Part 1
(2002), is not adequate for port structures and the structures within the port area of Gujarat.The proposed study describes the methodology which can be used as basis for estimation
of probabilistic (return period-dependent) site-specific ground motions in terms of engi-
neering ground motion parameters for performance-based designs which are consistent
with recommendation given by PIANC (2001) and Werner (1998). For design of water-
front structures in port sites under seismic conditions as was mentioned by various
researchers like Choudhury and Ahmad (2007a, b, 2008), Ahmad and Choudhury (2008)
etc., such input values will be helpful to recommend future direction for improving the
current state of seismic risk reduction practice for ports in India. The outcome of the results
is in form of site-specific Uniform Hazard Spectra (UHS) which may serve as resourcedocument for engineers, planners, and administrators of port authorities, government,
consulting engineering firms.
It is important to note that no liquefaction studies have been carried out in the present
study and separate study should be attempted to make more robust recommendations for
such topic as was done by Mhaske and Choudhury (2010) for Mumbai city. It is also
imperative to note that the geotechnical characterization is based on the available
562 Nat Hazards (2012) 60:541–565
1 3

8/16/2019 Shukla 2012
http://slidepdf.com/reader/full/shukla-2012 23/25
information and representative soil profiles are adopted in the present study. However, to
estimate more precisely, evaluation of fresh, structure-specific soil profile and actual
dynamic properties are recommended as future scope of study.
References
Abrahamson NA (1998) Non-stationary spectral matching program RSPMATCH. Pacific Gas & Electric
Company, Internal Report
Abrahamson NA, Silva WJ (1997) Empirical response spectral attenuation relations for shallow crustal
earthquakes. Seismol Res Lett 68:94–127
Ahmad SM, Choudhury D (2008) Pseudo-dynamic approach of seismic design for waterfront reinforced soil
wall. Geotext Geomembr 26:291–301. doi:10.1016/j.geotexmem.2007.12.004
Anbazhagan P, Vinod JS, Sitharam TG (2009) Probabilistic seismic hazard analysis for Bangalore. Nat
Hazards 48:145–166
Bilham R, Gaur VK, Molnar P (2001) Himalayan seismic risk. Science 293:1442–1444
Biswas SK (2005) A review of structure and tectonics of Kutch basin, western India, with special referenceto earthquakes. Curr Sci 88:1592–1600
Bonilla MG, Mark RK, Lienkaemper JJ (1984) Statistical relations among earthquake magnitude, surface
rupture length and surface fault displacement. Bull Seismol Soc Am 74:2379–2411
Boore DM, Joyner WB, Fumal TE (1997) Equations from estimating horizontal response spectra and peak
acceleration from Western North American earthquakes: a summary of recent work. Seismol Res Lett
68:128–153
Campbell KW (1997) Empirical near-source attenuation relationships for horizontal and vertical compo-
nents of peak ground acceleration, peak ground velocity, and pseudo-absolute acceleration response
spectra. Seismol Res Lett 68:154–179
Choudhury D, Ahmad SM (2007a) Stability of waterfront retaining wall subjected to pseudo-static earth-
quake forces. Ocean Eng 34:1947–1954. doi:10.1016/j.oceaneng.2007.03.005
Choudhury D, Ahmad SM (2007b) Design of waterfront retaining wall for the passive case under earthquakeand tsunami. Appl Ocean Res 29:37–44. doi:10.1016/j.apor.2007.08.001
Choudhury D, Ahmad SM (2008) Stability of waterfront retaining wall subjected to pseudo-dynamic
earthquake forces. J Waterw Port Coast Ocean Eng ASCE 134:252–260. doi:10.1061/(ASCE)0733-
95OX(2008)134:4(252)
Choudhury D, Savoikar P (2009) Equivalent-linear seismic analyses of MSW landfills using DEEPSOIL.
Eng Geol 107:98–108
Choudhury D, Shukla J (2011) Probability of occurrence and study of earthquake recurrence models for
Gujarat state in India. Disaster Adv 4:47–59
Choudhury D, Subba Rao KS (2002) Seismic passive resistance in soils for negative wall friction. Can
Geotech J 39:971–981. doi:10.1139/T02-023
Choudhury D, Sitharam TG, Subba Rao KS (2004) Seismic design of earth retaining structures and foun-
dations. Curr Sci 87:1417–1425Cornell CA (1968) Engineering seismic risk analysis. Bull Seismol Soc Am 58:1583–1606
Dash SR, Govindraju L, Bhattacharya S (2008) A case study of damages of the Kandla port and customs
office tower supported on a mat-pile foundation in liquefied soils under the 2001 Bhuj earthquake. Soil
Dyn Earthq Eng 29:333–346
Dikmen U (2009) Statistical correlations of shear wave velocity and penetration resistance for soils.
J Geophys Eng 6:61
Frankel A, Mueller C, Barnhard T, Perkins D, Leyendecker EV, Dickman N, Hanson S, Hopper M (1996)
National seismic hazard maps: documentation June 1996. Open-File Report, United States Geological
Survey, 96-532, 41
GSI (2000) Seismotectonic Atlas of India and its environs. Geological Survey of India, Spec. Publ. No. 59,
Kolkatta
Gupta ID (2006) Delineation of probable seismic sources in India and neighborhood by a comprehensiveanalysis of seismotectonic characteristics of the region. Soil Dyn Earthq Eng 26:766–790
Gutenberg B, Richter CF (1944) Frequency of earthquakes in California. Bull Seismol Soc Am 34:185–188
Idriss IM (1990) Response of soft soil site during earthquakes. In: Duncan JM (ed) Proceedings of H. Bolton
seed memorial symposium, vol 2. University of California, Berkeley, pp 273–289
Idriss IM, Sun JI (1992) User’s manual for SHAKE91: a computer program for conducting equivalent linear
seismic response analyses of horizontally layered soil deposits. Center for Geotechnical Modeling,
Dept. of Civil & Environmental Engineering, University of California, Davis
Nat Hazards (2012) 60:541–565 563
1 3

8/16/2019 Shukla 2012
http://slidepdf.com/reader/full/shukla-2012 24/25
Imai T (1977) P and S wave velocities of the ground in Japan. In: Proceeding of IX international conference
on soil mechanics and foundation engineering, vol 2, pp 257–260
Imai T, Tonouchi K (1982) Correlation of N-value with S-wave velocity and shear modulus. In: Proceedings
of the 2nd European symposium of penetration testing, Amsterdam, pp 57–72
Imai T, Yoshimura Y (1970) Elastic wave velocity and soil properties in soft soil (in Japanese). Tsuchito-
Kiso 18(1):17–22IS:1893 (Part-1) (2002) Criteria for earthquake resistant design of structures—general provisions and
buildings. Bureau of Indian Standard, New Delhi
Iyisan R (1996) Correlations between shear wave velocity and in situ penetration test results (in Turkish)
Chamber of Civil Engineers of Turkey. Teknik Dergi 7(2):1187–1199
Jafari MK, Asghari A, Rahmani I (1997) Empirical correlation between shear wave velocity (Vs) and SPT-N
value for south of Tehran soils. In: Proceedings of the 4th international conference on civil engi-
neering, Tehran (in Persian)
Madabushi SPG, Haigh SK (2005) The Bhuj, India earthquake of 26th January 2001. A field report by
EEFIT. Institution of Structural Engineers, London
Malik JN, Sohoni PS, Karanth RV, Merh SS (1999) Modern and historic seismicity of Kachchh Peninsula,
Western India. J Geol Soc India 54:545–550
McGuire RK (1976) FORTRAN computer program for seismic risk analysis. USGeological Survey, Open-File Report, 76-67
Mhaske SY, Choudhury D (2010) GIS-based soil liquefection susceptibility map of Mumbai city for
earthquake events. J Appl Geophys 70:216–225. doi:10.1016/j.jappgeo.2010.01.001
Mhaske SY, Choudhury D (2011) Geospatial contour mapping of shear wave velocity for Mumbai city. Nat
Hazards 59:317–327. doi:10.1007/s11069-011-9758-z
Nowroozi AA (1985) Empirical relations between magnitudes and fault parameters for earthquakes in Iran.
Bull Seismol Soc Am 75:1327–1338
Petersen MD, Rastogi BK, Schweig GES, Harmsen SC, Gomberg JS (2004) Sensitivity analysis of seismic
hazard for the northwestern portion of the state of Gujarat, India. Tectonophysics 390:105–115
Phanikanth VS, Choudhury D, Reddy GR (2011) Equivalent-linear seismic ground response analysis of
some typical sites in Mumbai. Geotech Geol Eng 29:1109–1126. doi:10.1007/s10706-011-9443-8
PIANC/MarCom WG34 (2001) Seismic design guidelines for port structures. International NavigationAssociation. A.A. Balkema, Lisse
Pitilakis K (2004) Site effects. In: Ansal A (ed) Recent advances in earthquake geotechnical engineering and
microzonation. Kluwer, Dordrecht
Raghu Kanth STG, Iyengar RN (2006) Seismic hazard estimation for Mumbai city. Curr Sci 11:1486–1494
Raghu Kanth STG, Iyengar RN (2007) Estimation of seismic spectral acceleration in peninsular India.
J Earth Syst Sci 3:199–214
Rastogi BK (2004) Damage due to the M w 7.7 Kutch, India earthquake of 2001. Tectonophysics 390:85–103
Roblee C, Chiou B (2004) A proposed Geoindex model for design selection of non-linear properties for site
response analysis. In: International workshop on uncertainties in nonlinear soil properties and their
impact on modeling dynamic soil response. PEER Headquarters, UC Berkeley, 18–19 March
Sadigh K, Chang CY, Egan JA, Makdisi F, Youngs RR (1997) Attenuation relations for shallow crustal
earthquakes based on California strong motion data. Seismol Res Lett 68:180–189Seed HB, Idriss IM (1970) Soil moduli and damping factors for dynamic response analysis. Report No
EERC 70-10, Earthquake Engineering Research Center, University of California, Berkeley
Seed HB, Idriss IM (1981) Evaluation of liquefaction potential sand deposits based on observation of
performance in previous earthquakes. ASCE National Convention, (MO), 81–544
Seed HB, Wong RT, Idriss IM, Tokimastu K (1986) Moduli and damping factors for dynamic analysis of
cohesionless soils. J Geotech Eng ASCE 112(11):1016–1032
Shukla J, Choudhury D (2011) Estimation of seismic ground motions using deterministic approach for major
cities of Gujarat. Natural Hazards and Earth System Sciences, Germany (accepted, in press for
publication)
Slemmon DB (1989) Determination of earthquake size from surface faulting events. In: Proceedings of
international seminar on Seismic Zoning, China
Sokolov VY (2000) Site & region-specific response spectra: a probabilistic approach. Soil Dyn Earthq Eng20:273–281
Subba Rao KS, Choudhury D (2005) Seismic passive earth pressures in soils. J Geotech Geoenviron Eng
ASCE 131:131–135. doi:10.1061/(ASCE)1090-0241(2005)131:1(131)
Sun JI, Golesorkhi R, Seed HB (1988) Dynamic moduli and damping ratios for cohesive soils. EERC Report
No. UCB/EERC-88/15
564 Nat Hazards (2012) 60:541–565
1 3
8/16/2019 Shukla 2012
http://slidepdf.com/reader/full/shukla-2012 25/25
Takahashi A, Takemura J (2005) Liquefaction induced large displacement of pile supported wharf. Soil Dyn
Earthq Eng 25:811–825
Toro GR, Abrahamson NA, Schneider JF (1997) Model of strong ground motions from earthquakes in
central and eastern North America: best estimates and uncertainties. Seismol Res Lett 68:41–58
Tripathi JN (2006) Probabilistic assessment of earthquake recurrence in the January 26, 2001 earthquake
region of Gujarat. India J Seismol 10:119–130Vucetic M, Dobry R (1991) Effect of soil plasticity on cyclic response. J Geotech Eng ASCE 117:89–107
Wells DL, Coppersmith KJ (1994) Updated empirical relationships among magnitude, rupture length,
rupture area and surface displacement. Bull Seismol Soc Am 84:4–43
Werner SD (ed) (1998) Seismic guidelines for ports. Technical Council on Lifeline Earthquake Engineering
Monograph No. 12, ASCE
Yadav RBS, Tripathi JN, Rastogi BK, Chopra S (2008) Probabilistic assessment of earthquake hazard in
Gujarat and adjoining regions of India. Pure Appl Geophys 165:1813–1833
Yadav RBS, Papadimitriou EE, Karakostas VG, Shanker D, Rastogi BK, Chopra S, Singh AP, Kumar S
(2010) The 2007 Talala, Saurashtra, western India earthquake sequence: Tectonic implications and
seismicity triggering. J Asian Earth Sci 40:303–314
Nat Hazards (2012) 60:541–565 565