Shrm survey findings_strategic-benefits-communicating-benefits
25
March 17, 2015 SHRM Survey Findings: 2014 Strategic Benefits— Communicating Benefits
-
Upload
shrm -
Category
Recruiting & HR
-
view
862 -
download
0
Transcript of Shrm survey findings_strategic-benefits-communicating-benefits
March 17, 2015
SHRM Survey Findings: 2014 Strategic Benefits—
Communicating Benefits
2
The 2014 Strategic Benefits Survey, administered annually since 2012 by the Society for
Human Resource Management (SHRM), is used to determine whether various employee
benefits are leveraged to recruit and retain top talent. This research study, split into a six-
part series, features the following topics:
Part 1: Wellness Initiatives
Part 2: Flexible Work Arrangements
Part 3: Health Care
Part 4: Leveraging Benefits to Retain Employees
Part 5: Leveraging Benefits to Recruit Employees
Part 6: Communicating Benefits
2014 Strategic Benefits Survey—Communicating Benefits ©SHRM 2015
Introduction
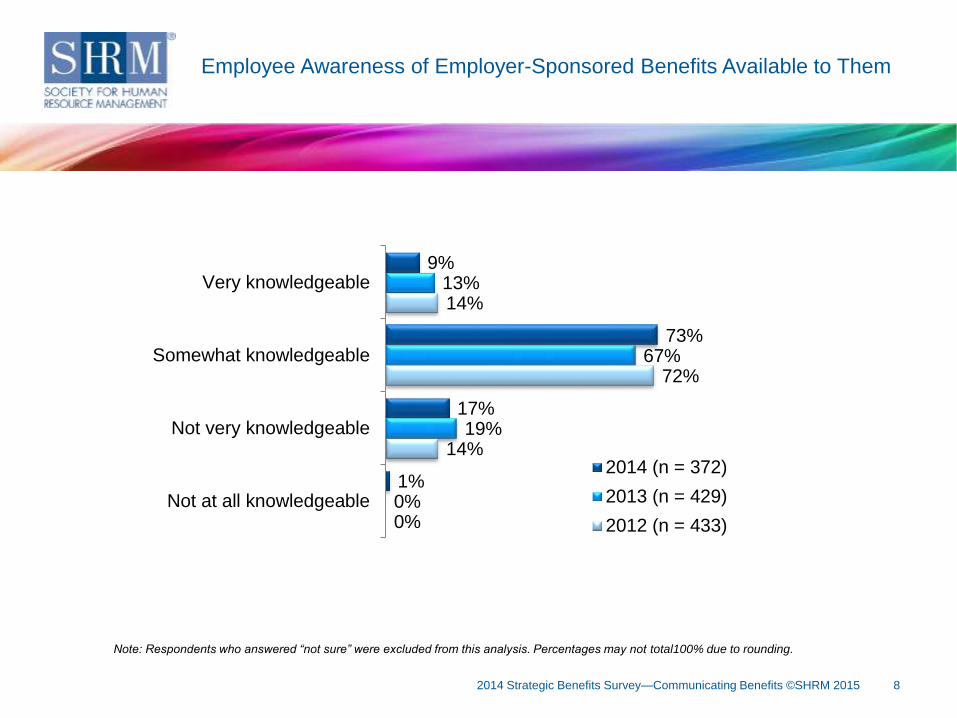
• Employee awareness of employer-sponsored benefits available to them: Nine percent
of respondents indicated their organization’s employees were “very knowledgeable” about
the employer-sponsored benefits available to them; about three-quarters (73%) indicated
their employees were “somewhat knowledgeable.”
• Effectiveness of organization’s employee benefits communications efforts: Just over
one-fifth (22%) of HR professionals indicated they “strongly agree” that their organization’s
employee benefits communications efforts are very effective in informing employees about
their benefits; about three-fifths (58%) indicated they “somewhat agree.”
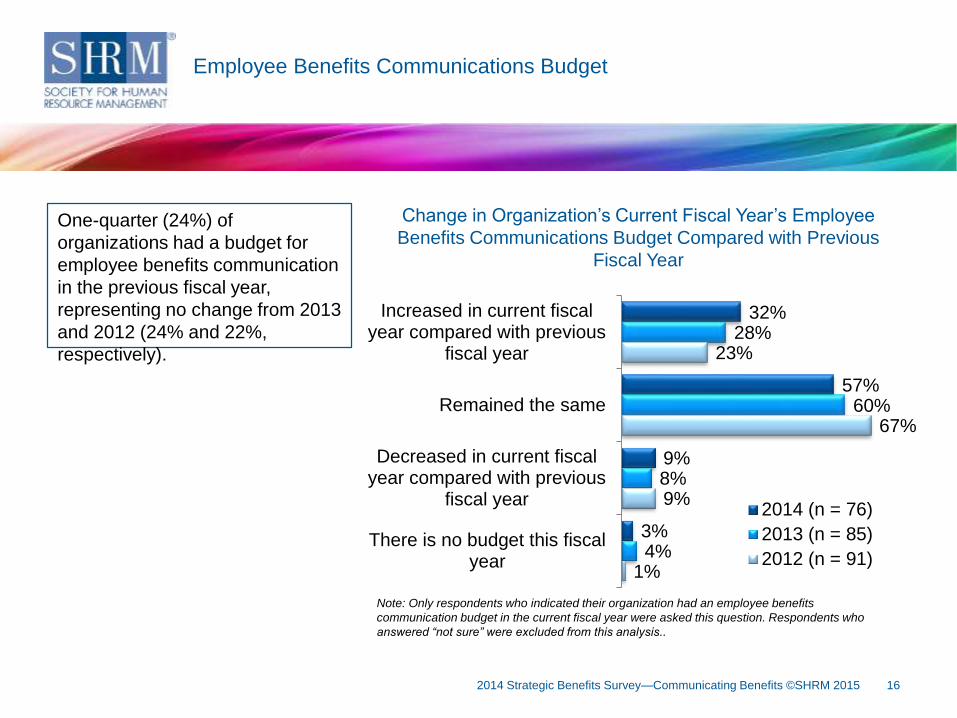
• Employee benefits communication budget: One-quarter (24%) of respondents indicated
their organization had an employee benefits communication budget in fiscal year 2013.
• Changes to employee benefits communication materials in the last 12 months: Over
three-fifths (63%) of respondents indicated changes were made to their organization’s
employee benefits communication materials in the last 12 months. In 2014, there was a
pattern of increased use of group employee benefits communications with an organizational
representative compared with 2013 (70% vs. 62%); the same was observed for the use of
online or paper newsletters (41% vs. 34%).
3
Key Findings
2014 Strategic Benefits Survey—Communicating Benefits ©SHRM 2015
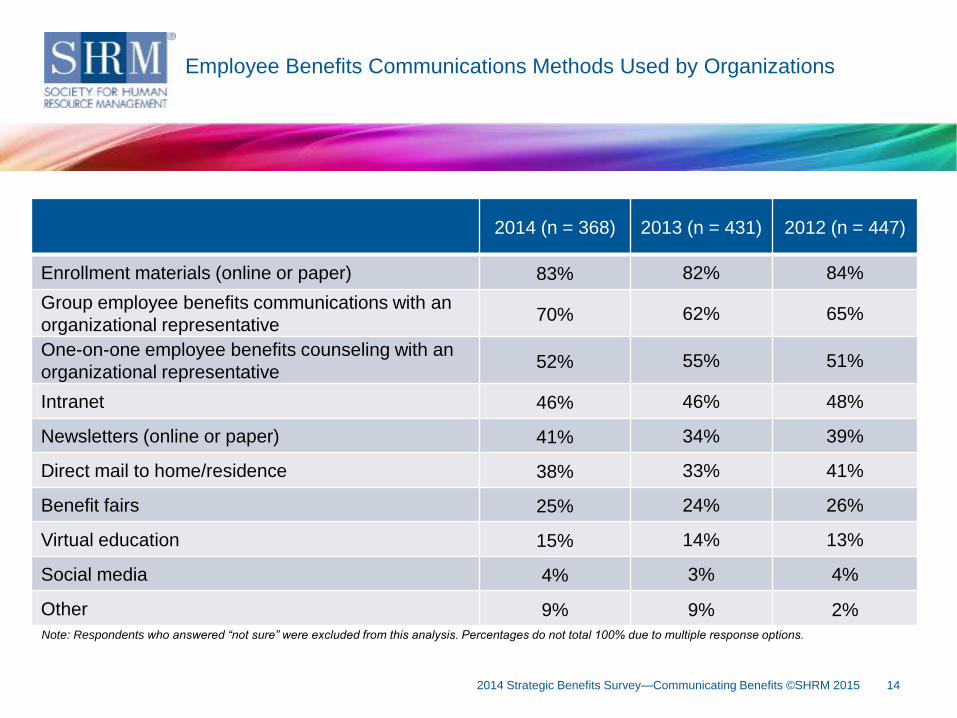
• Employee benefits communications methods used by organizations: The top two
benefits communications methods used by organizations were providing online or paper
enrollment materials to employees (83%) and/or group employee benefits
communications with an organizational representative (70%); about one-half indicated
their organization offers one-on-one employee benefits counseling with an organizational
representative (52%) and/or posts information on the company’s intranet (46%).
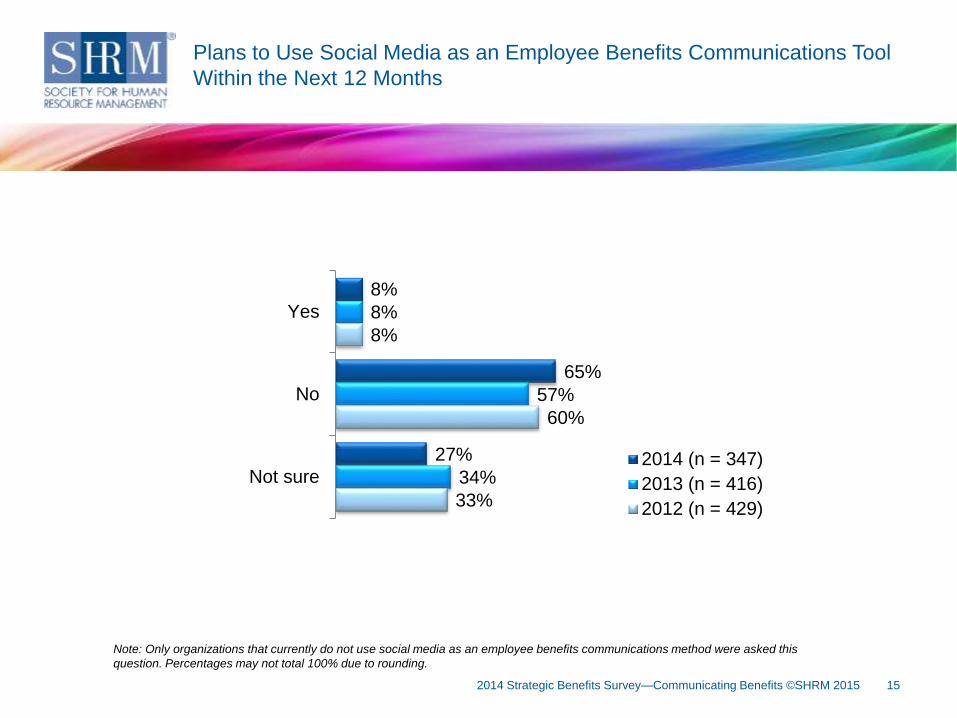
• Use of social media as an employee benefits communications tool: Very few
respondents (4%) indicated their organization used social media as an employee benefits
communications tool. Among respondents who indicated their organization was not using
social media in their employee benefits communications efforts, 8% indicated they plan to
start using social media within the next 12 months; about two-thirds (65%) indicated they
did not plan to use social media for this purpose.
4
Key Findings (Continued)
2014 Strategic Benefits Survey—Communicating Benefits ©SHRM 2015
• Improving employee’s knowledge of the benefits available to them may be an
opportunity to help improve employee job satisfaction and engagement. A recent
SHRM Employee Job Satisfaction and Engagement Survey found that 53% of
employees rated their benefits package as “very important” to their overall job
satisfaction. This finding suggests that improving the effectiveness of employee
benefits communications and making more employees aware of the employee-
sponsored benefits available to them may also raise employee job satisfaction.
• HR professionals may want to consider setting aside funds for an employee
benefits communication program. Because a better understanding of employee
benefits may also improve employee satisfaction, creating a budget for communicating
the value of available benefits could be a wise investment.
52014 Strategic Benefits Survey—Communicating Benefits ©SHRM 2015
What Do These Findings Mean for the HR Profession?
• Most employers need to constantly revisit their benefits communications efforts.
The benefits landscape is in constant flux due to changes in laws, costs and benefits
strategies. As a result, most organizations need to routinely review their benefits
communications and strategies, something most organizations already appear to be
doing with over three-fifths (63%) of respondents indicating changes were made to
their organization’s employee benefits communication materials in the last 12 months.
• Traditional employee benefits communications methods appear poised to
continue to dominate for the foreseeable future. The top two benefit
communications methods used by organizations were providing online or paper
enrollment materials to employees (83%) and/or group employee benefits
communications with an organizational representative (70%); very few (4%) said they
plan to disseminate communications via social media. However, social media is often a
good way to reach employees, and organizations should consider adding as many
avenues of communication as possible to increase their reach and boost employee
awareness.
62014 Strategic Benefits Survey—Communicating Benefits ©SHRM 2015
What Do These Findings Mean for the HR Profession?
(Continued)
7
Key Findings
Awareness and Importance of Benefits
8
What do these findings mean for the HR profession?Employee Awareness of Employer-Sponsored Benefits Available to Them
2014 Strategic Benefits Survey—Communicating Benefits ©SHRM 2015
9%
73%
17%
1%
13%
67%
19%
0%
14%
72%
14%
0%
Very knowledgeable
Somewhat knowledgeable
Not very knowledgeable
Not at all knowledgeable
2014 (n = 372)
2013 (n = 429)
2012 (n = 433)
Note: Respondents who answered “not sure” were excluded from this analysis. Percentages may not total100% due to rounding.
9
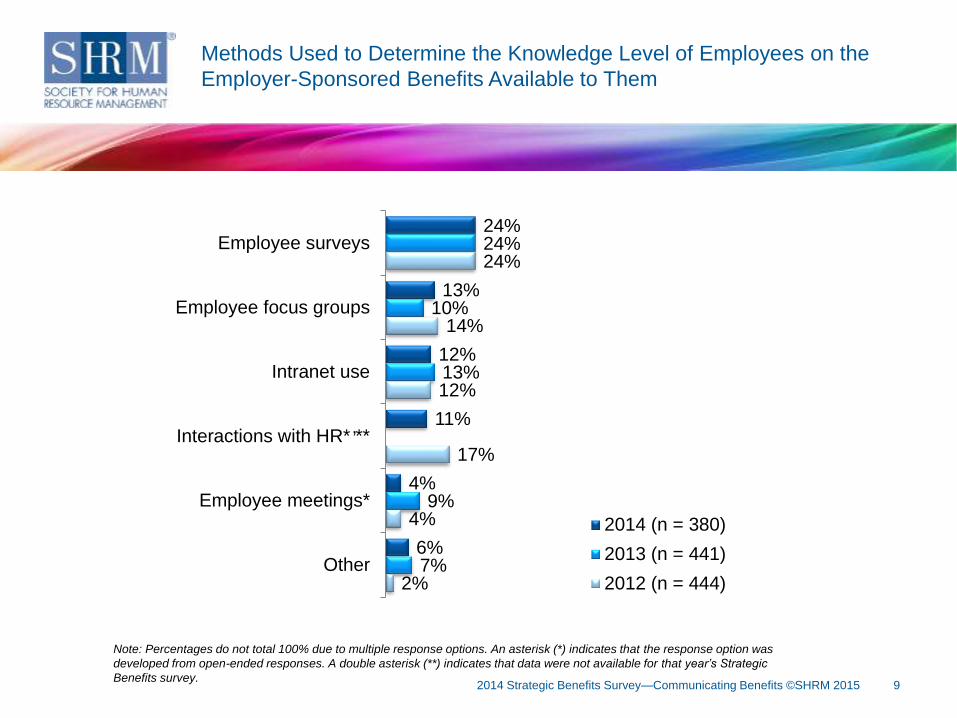
What do these findings mean for the HR profession?Methods Used to Determine the Knowledge Level of Employees on the
Employer-Sponsored Benefits Available to Them
2014 Strategic Benefits Survey—Communicating Benefits ©SHRM 2015
24%
13%
12%
11%
4%
6%
24%
10%
13%
9%
7%
24%
14%
12%
17%
4%
2%
Employee surveys
Employee focus groups
Intranet use
Interactions with HR* **
Employee meetings*
Other
2014 (n = 380)
2013 (n = 441)
2012 (n = 444)
Note: Percentages do not total 100% due to multiple response options. An asterisk (*) indicates that the response option was
developed from open-ended responses. A double asterisk (**) indicates that data were not available for that year’s Strategic
Benefits survey.
,
102014 Strategic Benefits Survey—Communicating Benefits ©SHRM 2015
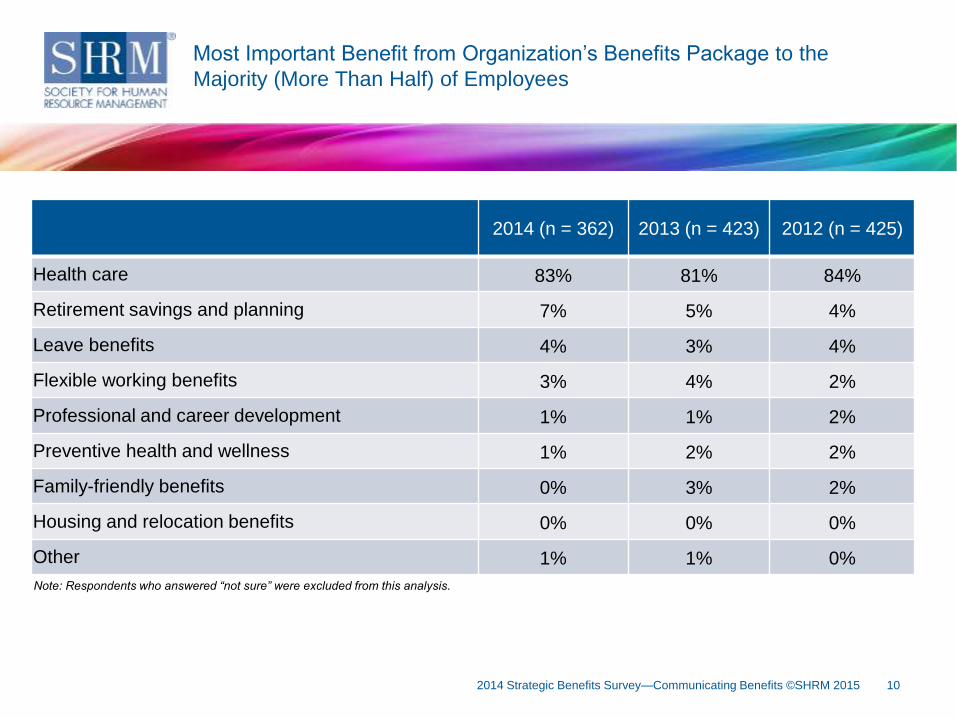
2014 (n = 362) 2013 (n = 423) 2012 (n = 425)
Health care 83% 81% 84%
Retirement savings and planning 7% 5% 4%
Leave benefits 4% 3% 4%
Flexible working benefits 3% 4% 2%
Professional and career development 1% 1% 2%
Preventive health and wellness 1% 2% 2%
Family-friendly benefits 0% 3% 2%
Housing and relocation benefits 0% 0% 0%
Other 1% 1% 0%
Most Important Benefit from Organization’s Benefits Package to the
Majority (More Than Half) of Employees
Note: Respondents who answered “not sure” were excluded from this analysis.
11
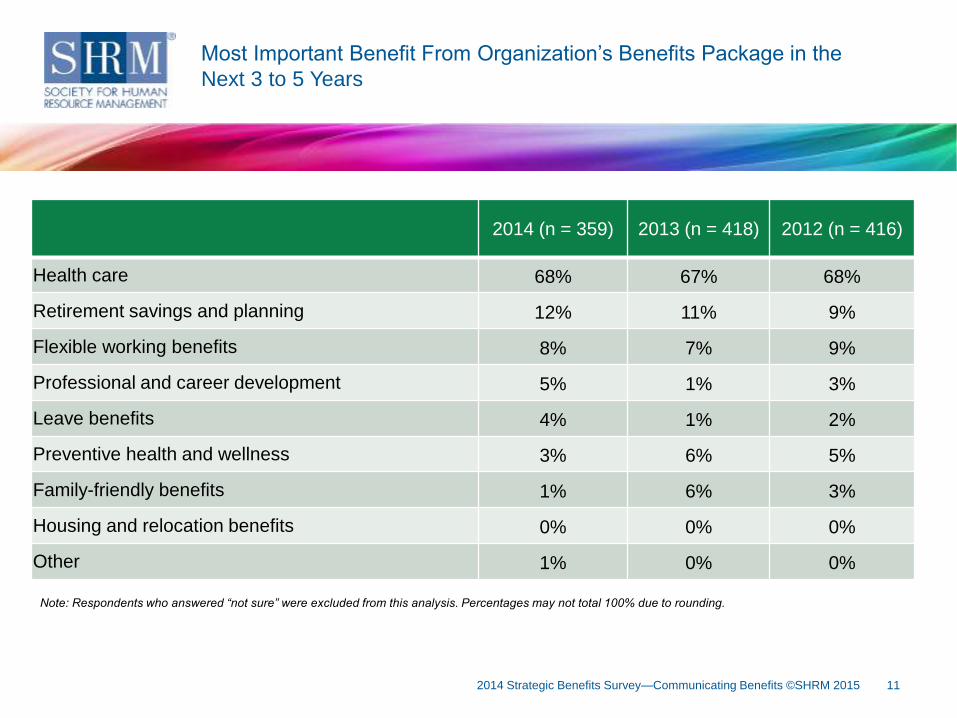
What do these findings mean for the HR profession?Most Important Benefit From Organization’s Benefits Package in the
Next 3 to 5 Years
2014 Strategic Benefits Survey—Communicating Benefits ©SHRM 2015
Note: Respondents who answered “not sure” were excluded from this analysis. Percentages may not total 100% due to rounding.
2014 (n = 359) 2013 (n = 418) 2012 (n = 416)
Health care 68% 67% 68%
Retirement savings and planning 12% 11% 9%
Flexible working benefits 8% 7% 9%
Professional and career development 5% 1% 3%
Leave benefits 4% 1% 2%
Preventive health and wellness 3% 6% 5%
Family-friendly benefits 1% 6% 3%
Housing and relocation benefits 0% 0% 0%
Other 1% 0% 0%
12
Key Findings
Communicating Benefits
13
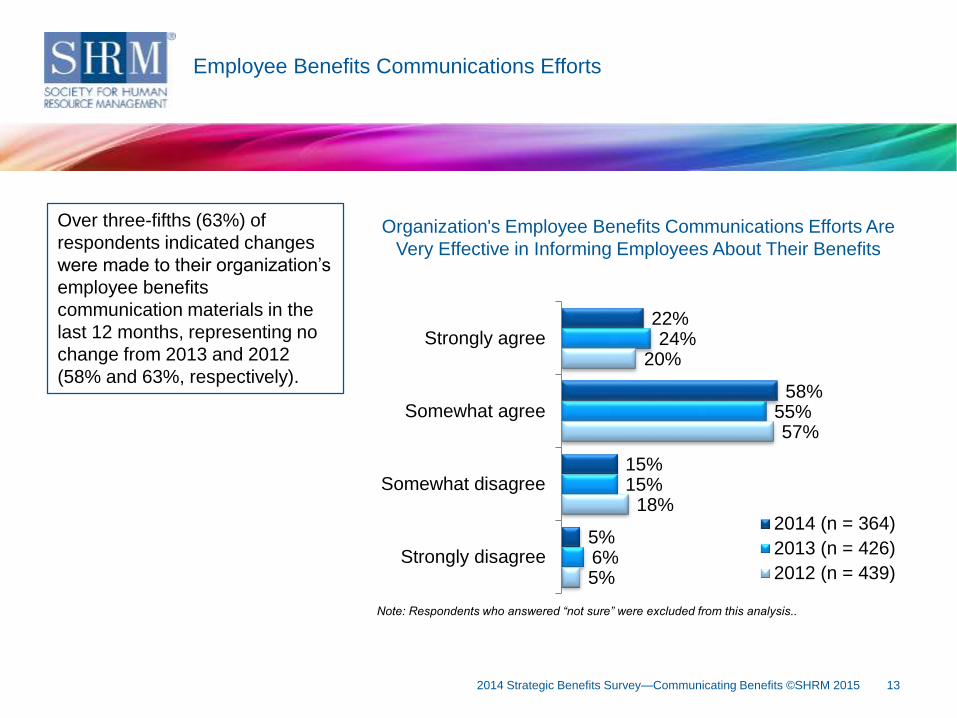
What do these findings mean for the HR profession?Employee Benefits Communications Efforts
2014 Strategic Benefits Survey—Communicating Benefits ©SHRM 2015
22%
58%
15%
5%
24%
55%
15%
6%
20%
57%
18%
5%
Strongly agree
Somewhat agree
Somewhat disagree
Strongly disagree
2014 (n = 364)
2013 (n = 426)
2012 (n = 439)
Over three-fifths (63%) of
respondents indicated changes
were made to their organization’s
employee benefits
communication materials in the
last 12 months, representing no
change from 2013 and 2012
(58% and 63%, respectively).
Organization's Employee Benefits Communications Efforts Are
Very Effective in Informing Employees About Their Benefits
Note: Respondents who answered “not sure” were excluded from this analysis..
142014 Strategic Benefits Survey—Communicating Benefits ©SHRM 2015
Note: Respondents who answered “not sure” were excluded from this analysis. Percentages do not total 100% due to multiple response options.
2014 (n = 368) 2013 (n = 431) 2012 (n = 447)
Enrollment materials (online or paper) 83% 82% 84%
Group employee benefits communications with an
organizational representative70% 62% 65%
One-on-one employee benefits counseling with an
organizational representative52% 55% 51%
Intranet 46% 46% 48%
Newsletters (online or paper) 41% 34% 39%
Direct mail to home/residence 38% 33% 41%
Benefit fairs 25% 24% 26%
Virtual education 15% 14% 13%
Social media 4% 3% 4%
Other 9% 9% 2%
Employee Benefits Communications Methods Used by Organizations
15
What do these findings mean for the HR profession?Plans to Use Social Media as an Employee Benefits Communications Tool
Within the Next 12 Months
2014 Strategic Benefits Survey—Communicating Benefits ©SHRM 2015
8%
65%
27%
8%
57%
34%
8%
60%
33%
Yes
No
Not sure2014 (n = 347)
2013 (n = 416)
2012 (n = 429)
Note: Only organizations that currently do not use social media as an employee benefits communications method were asked this
question. Percentages may not total 100% due to rounding.
16
What do these findings mean for the HR profession?Employee Benefits Communications Budget
2014 Strategic Benefits Survey—Communicating Benefits ©SHRM 2015
Note: Only respondents who indicated their organization had an employee benefits
communication budget in the current fiscal year were asked this question. Respondents who
answered “not sure” were excluded from this analysis..
32%
57%
9%
3%
28%
60%
8%
4%
23%
67%
9%
1%
Increased in current fiscalyear compared with previous
fiscal year
Remained the same
Decreased in current fiscalyear compared with previous
fiscal year
There is no budget this fiscalyear
2014 (n = 76)
2013 (n = 85)
2012 (n = 91)
Change in Organization’s Current Fiscal Year’s Employee
Benefits Communications Budget Compared with Previous
Fiscal Year
One-quarter (24%) of
organizations had a budget for
employee benefits communication
in the previous fiscal year,
representing no change from 2013
and 2012 (24% and 22%,
respectively).
2014 Strategic Benefits Survey—Leveraging Benefits to Retain Employees ©SHRM 2015 17
Key Findings
Demographics
18
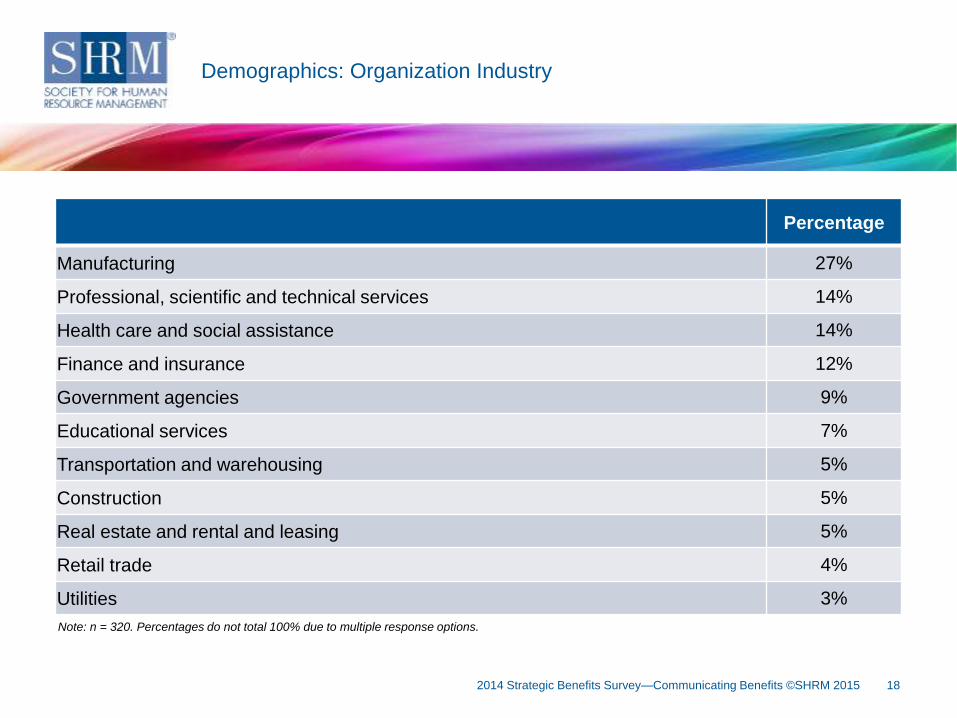
Note: n = 320. Percentages do not total 100% due to multiple response options.
Percentage
Manufacturing 27%
Professional, scientific and technical services 14%
Health care and social assistance 14%
Finance and insurance 12%
Government agencies 9%
Educational services 7%
Transportation and warehousing 5%
Construction 5%
Real estate and rental and leasing 5%
Retail trade 4%
Utilities 3%
Demographics: Organization Industry
2014 Strategic Benefits Survey—Communicating Benefits ©SHRM 2015
19
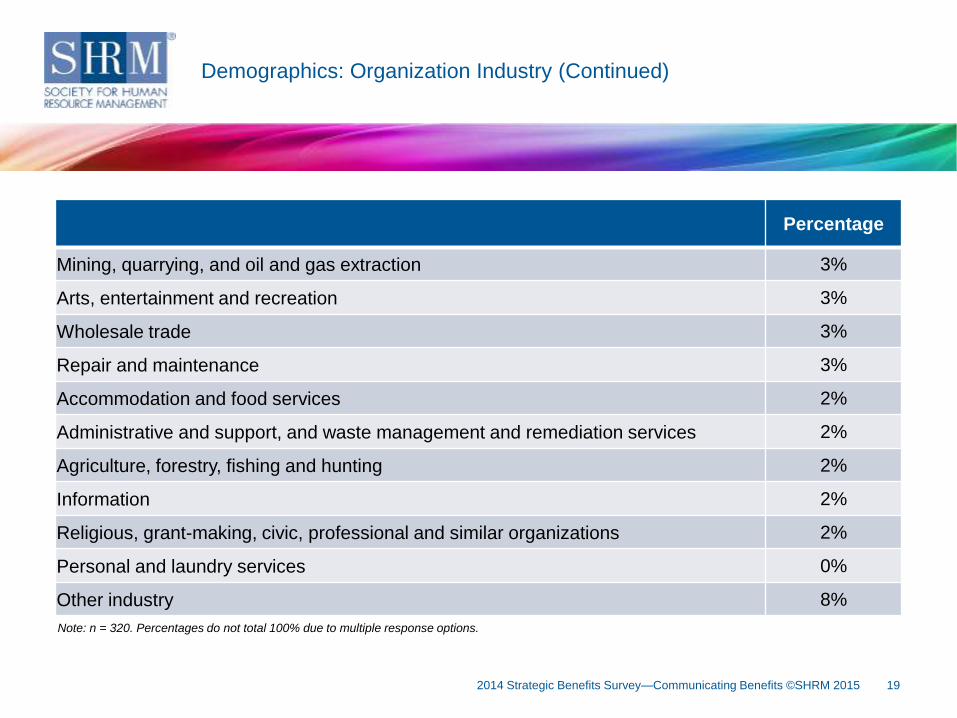
Key FinDemographics: Organization Industry (Continued)
Note: n = 320. Percentages do not total 100% due to multiple response options.
Percentage
Mining, quarrying, and oil and gas extraction 3%
Arts, entertainment and recreation 3%
Wholesale trade 3%
Repair and maintenance 3%
Accommodation and food services 2%
Administrative and support, and waste management and remediation services 2%
Agriculture, forestry, fishing and hunting 2%
Information 2%
Religious, grant-making, civic, professional and similar organizations 2%
Personal and laundry services 0%
Other industry 8%
2014 Strategic Benefits Survey—Communicating Benefits ©SHRM 2015
20
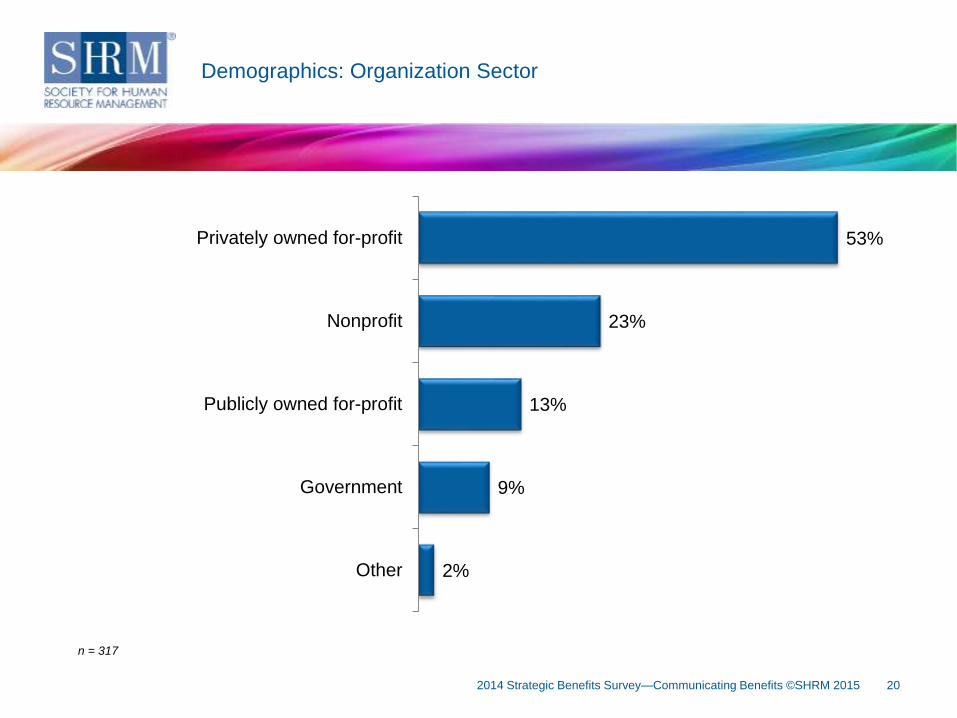
Key FinDemographics: Organization Sector
53%
23%
13%
9%
2%
Privately owned for-profit
Nonprofit
Publicly owned for-profit
Government
Other
n = 317
2014 Strategic Benefits Survey—Communicating Benefits ©SHRM 2015
21
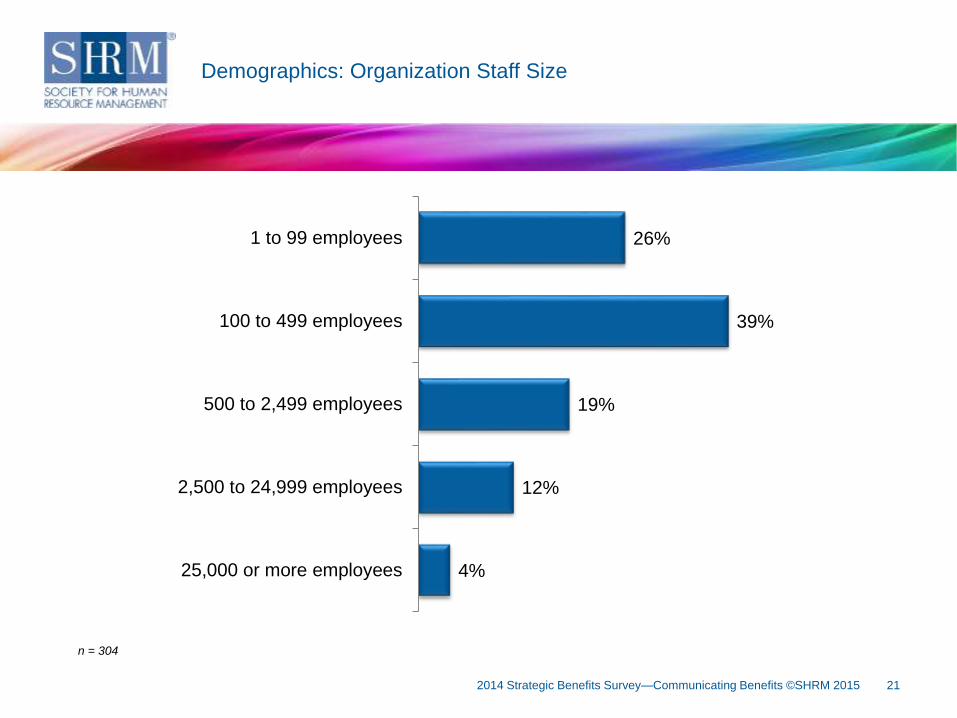
Key FinDemographics: Organization Staff Size
n = 304
2014 Strategic Benefits Survey—Communicating Benefits ©SHRM 2015
26%
39%
19%
12%
4%
1 to 99 employees
100 to 499 employees
500 to 2,499 employees
2,500 to 24,999 employees
25,000 or more employees
22
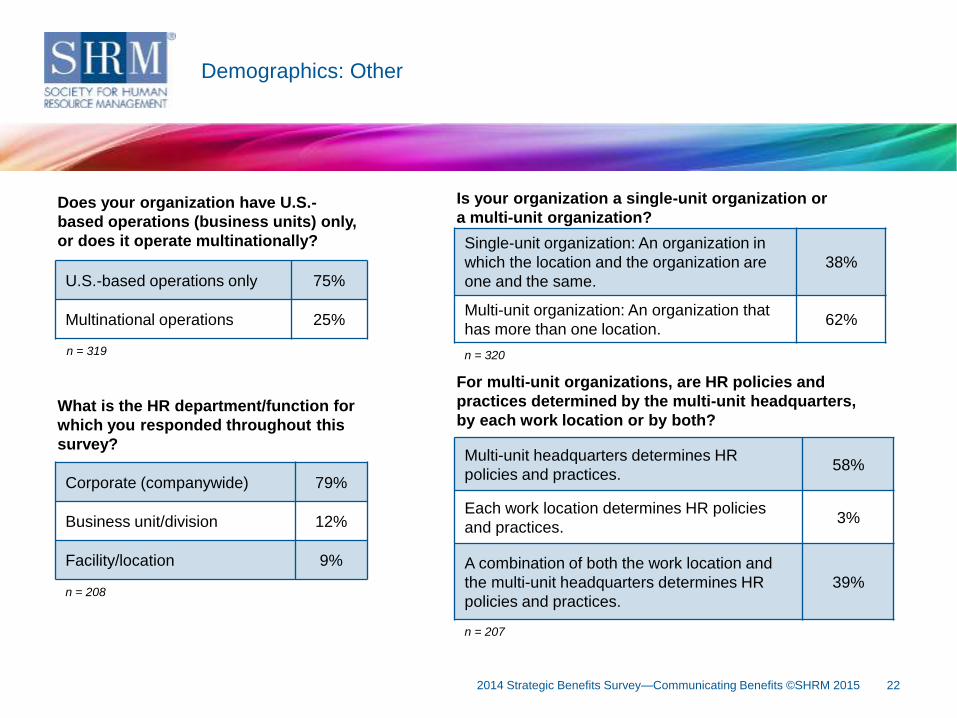
Key FinDemographics: Other
2014 Strategic Benefits Survey—Communicating Benefits ©SHRM 2015
n = 319
U.S.-based operations only 75%
Multinational operations 25%
Does your organization have U.S.-
based operations (business units) only,
or does it operate multinationally?
n = 320
n = 207
n = 208
Single-unit organization: An organization in
which the location and the organization are
one and the same.
38%
Multi-unit organization: An organization that
has more than one location.62%
Is your organization a single-unit organization or
a multi-unit organization?
For multi-unit organizations, are HR policies and
practices determined by the multi-unit headquarters,
by each work location or by both?
Multi-unit headquarters determines HR
policies and practices.58%
Each work location determines HR policies
and practices.3%
A combination of both the work location and
the multi-unit headquarters determines HR
policies and practices.
39%
Corporate (companywide) 79%
Business unit/division 12%
Facility/location 9%
What is the HR department/function for
which you responded throughout this
survey?
23
SHRM Survey Findings:
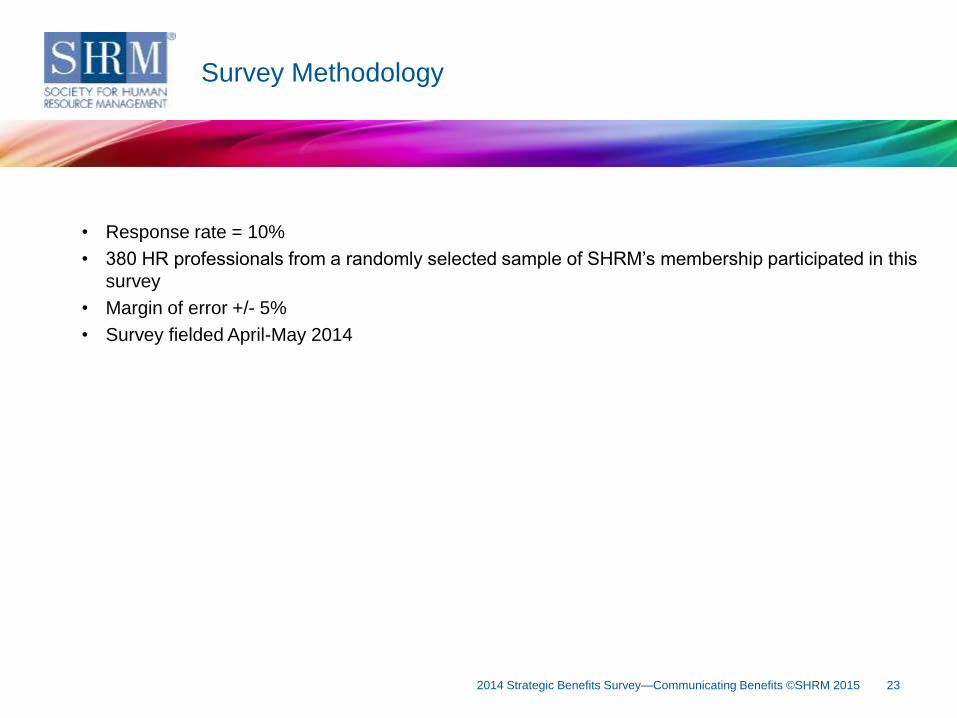
Survey Methodology
• Response rate = 10%
• 380 HR professionals from a randomly selected sample of SHRM’s membership participated in this
survey
• Margin of error +/- 5%
• Survey fielded April-May 2014
Survey Methodology
2014 Strategic Benefits Survey—Communicating Benefits ©SHRM 2015
24
For more survey/poll findings, visit shrm.org/surveys
For more information about SHRM’s Customized Research Services, visit
shrm.org/customizedresearch
Follow us on Twitter @SHRM_Research
2014 Strategic Benefits Survey—Communicating Benefits ©SHRM 2015
About SHRM Research
Project lead:
Karen Wessels, researcher, SHRM Research
Project contributors:
Evren Esen, director, SHRM-SCP, Survey Programs, SHRM Research
Alexander Alonso, Ph.D., SHRM-SCP, vice president, SHRM Research
Jennifer Schramm, manager, SHRM-SCP, Workforce Trends and Forecasting, SHRM Research
25
Founded in 1948, the Society for Human Resource Management (SHRM) is the
world’s largest HR membership organization devoted to human resource management.
Representing more than 275,000 members in over 160 countries, the Society is the
leading provider of resources to serve the needs of HR professionals and advance the
professional practice of human resource management. SHRM has more than 575
affiliated chapters within the United States and subsidiary offices in China, India and
United Arab Emirates. Visit us at shrm.org.
2014 Strategic Benefits Survey—Communicating Benefits ©SHRM 2015
About SHRM