
December 16, 2011 SHRM Poll: Personality Tests for the Hiring and Promotion of Employees.

SHRM Survey Findings: 2014 Economic Conditions—Overall Financial Health and Hiring
October 30, 2014

Economic Conditions—Overall Financial Health and Hiring ©SHRM 2014 2
• This is Part 1 of a series of SHRM survey results about the state of jobs and skills in the current economic condition, which relates to a SHRM survey series about the ongoing impact of the U.S. and global recession from 2007 to 2012. Overall results will be reported separately in three different topic areas:
» Overall financial health and hiring.» Recruiting and skills gaps.» Global competition and hiring strategies.
• Overall results for 2013 will also be reported separately for California.
• Industry-specific results for the nine industries that were included in the sample will also be reported for each question throughout the report. The nine industries are:
» Accommodation and food services, retail/wholesale trade.» Construction, mining, quarrying, and oil and gas extraction.» Educational services.» Finance, insurance, real estate and rental and leasing.» Government agencies. » Health care and social assistance.» High-tech.» Manufacturing.» Professional, scientific, and technical services.
Introduction

Economic Conditions—Overall Financial Health and Hiring ©SHRM 2014 3
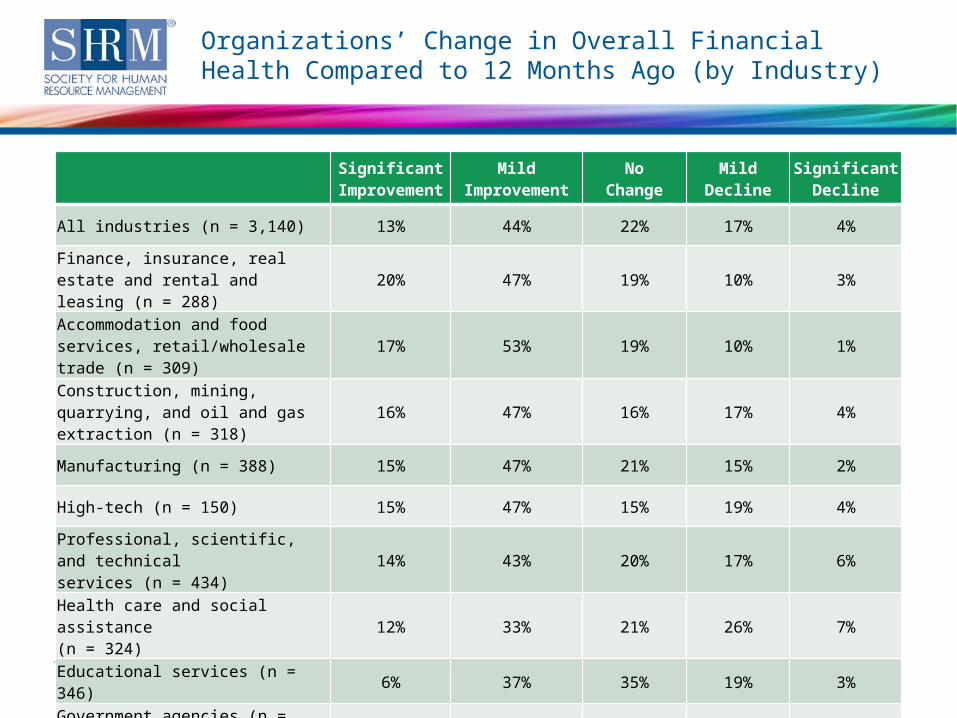
• How is the overall financial health of organizations? The majority (80%) of organizations reported their financial health as being “excellent” or “good.” When asked about the change in overall financial health compared to 12 months ago, more than one-half (57%) of organizations reported having significant or mild improvement, an increase from 51% in 2012 and 42% in 2011.
» Larger organizations (with 25,000 or more employees) reported better overall financial health compared to smaller organizations (with 1 to 24,999 employees).
» More than two-fifths (44%) of organizations in the accommodation and food services, retail/wholesale trade industry; and the finance, insurance, real estates and rental and leasing industry reported excellent overall financial health, whereas less than one-fifths (17%) of organizations in the educational services industry and government agencies reported excellent overall financial health.
• What percentage of regular full-time staff have organizations lost in the last 12 months? Close to one-third (31%) of organizations had not lost any staff in the past year, and two-fifths (40%) reported having lost up to 5% of employees.
» Smaller organizations were more likely to have no staff losses compared with larger organizations.
» All industries fared better than the high-tech industry (15%) in terms of losing no employees in the last 12 months.
Key Findings

Economic Conditions—Overall Financial Health and Hiring ©SHRM 2014 4
• Regardless of the status of their current financial health, what actions have organizations taken as a result of financial challenges in the last 12 months? About one-quarter of organizations have implemented budget cuts (27%) and laid off employees (25%). However, two-fifths (40%) of organizations reported they have taken no cost-saving measures in the past year.
» Organizations in the educational services and government agencies industries were more likely to have implemented budget cuts in the past year (37% and 35%, respectively).
• Regardless of the status of their current financial health, what actions have organizations taken as a result of financial stability or growth in the last 12 months? Two-fifths (39%) of organizations have increased salaries, and one-third (33%) have provided bonuses in the past year. One-third (32%) of organizations have taken no actions that would increase costs to the organization.
» The professional, scientific and technical services industry was more likely than other industries to have increased salaries (47%) or provided bonuses (48%) in the past year.
Key Findings (continued)
Economic Conditions—Overall Financial Health and Hiring ©SHRM 2014 5
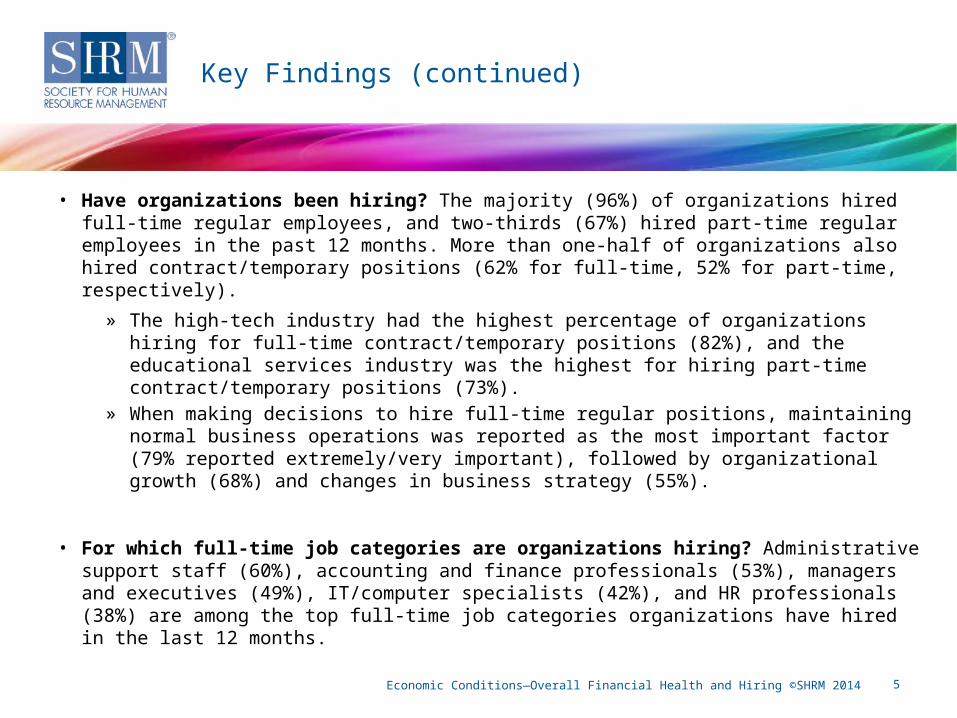
• Have organizations been hiring? The majority (96%) of organizations hired full-time regular employees, and two-thirds (67%) hired part-time regular employees in the past 12 months. More than one-half of organizations also hired contract/temporary positions (62% for full-time, 52% for part-time, respectively).
» The high-tech industry had the highest percentage of organizations hiring for full-time contract/temporary positions (82%), and the educational services industry was the highest for hiring part-time contract/temporary positions (73%).
» When making decisions to hire full-time regular positions, maintaining normal business operations was reported as the most important factor (79% reported extremely/very important), followed by organizational growth (68%) and changes in business strategy (55%).
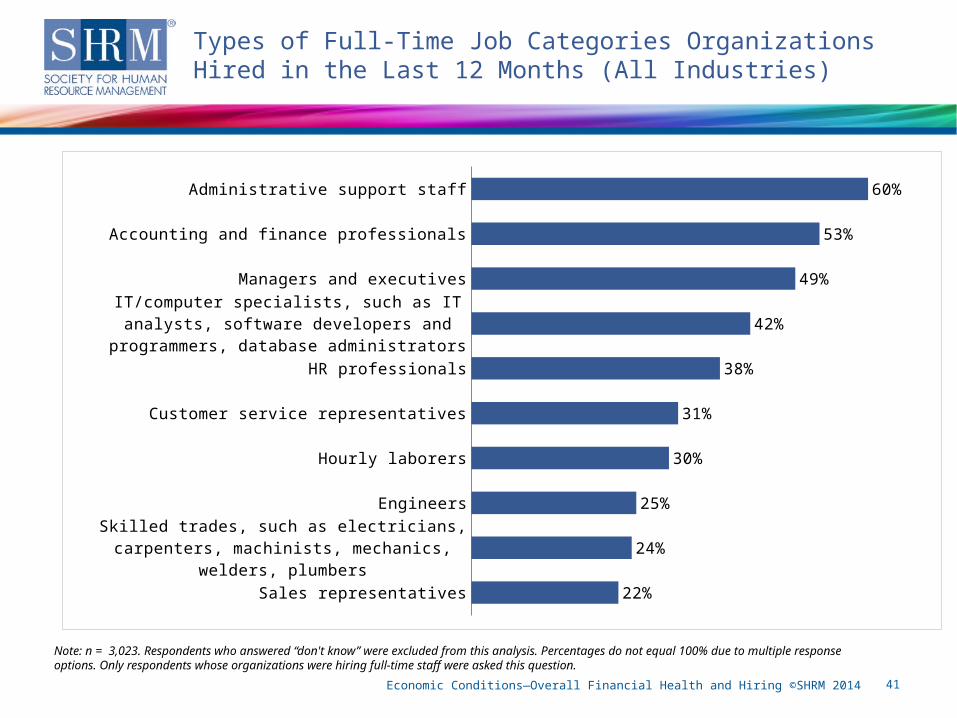
• For which full-time job categories are organizations hiring? Administrative support staff (60%), accounting and finance professionals (53%), managers and executives (49%), IT/computer specialists (42%), and HR professionals (38%) are among the top full-time job categories organizations have hired in the last 12 months.
Key Findings (continued)
Economic Conditions—Overall Financial Health and Hiring ©SHRM 2014 6
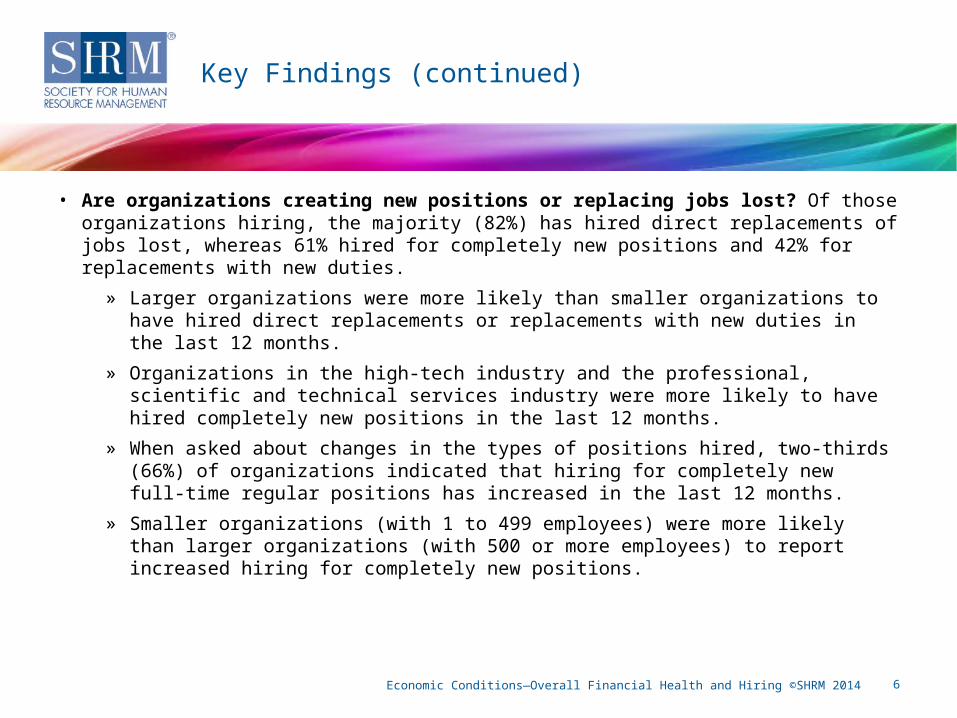
• Are organizations creating new positions or replacing jobs lost? Of those organizations hiring, the majority (82%) has hired direct replacements of jobs lost, whereas 61% hired for completely new positions and 42% for replacements with new duties.
» Larger organizations were more likely than smaller organizations to have hired direct replacements or replacements with new duties in the last 12 months.
» Organizations in the high-tech industry and the professional, scientific and technical services industry were more likely to have hired completely new positions in the last 12 months.
» When asked about changes in the types of positions hired, two-thirds (66%) of organizations indicated that hiring for completely new full-time regular positions has increased in the last 12 months.
» Smaller organizations (with 1 to 499 employees) were more likely than larger organizations (with 500 or more employees) to report increased hiring for completely new positions.
Key Findings (continued)
Economic Conditions—Overall Financial Health and Hiring ©SHRM 2014 7
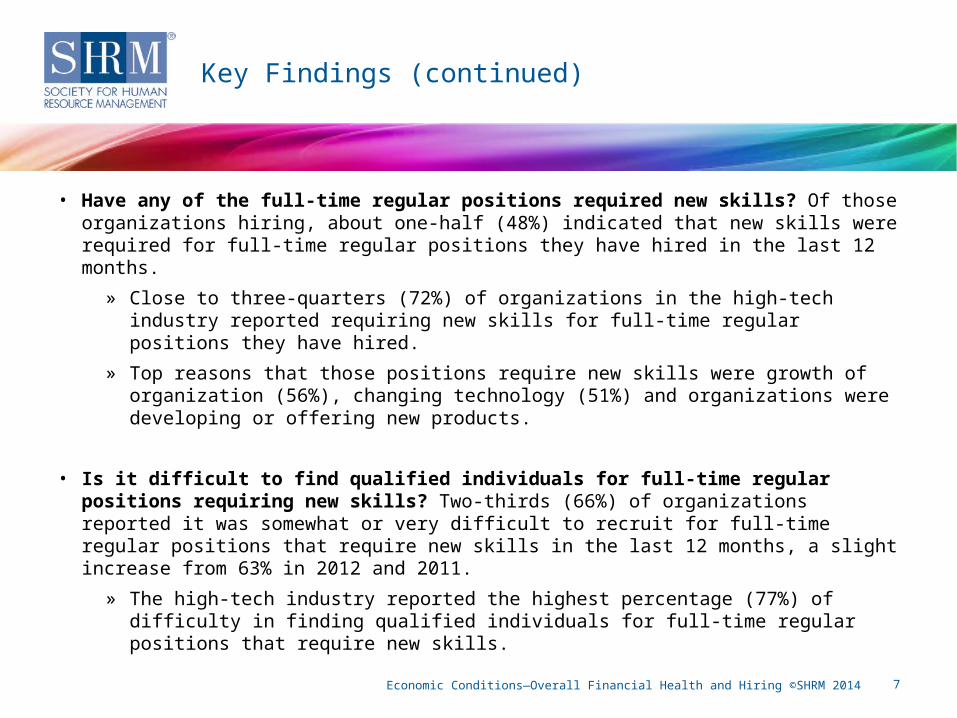
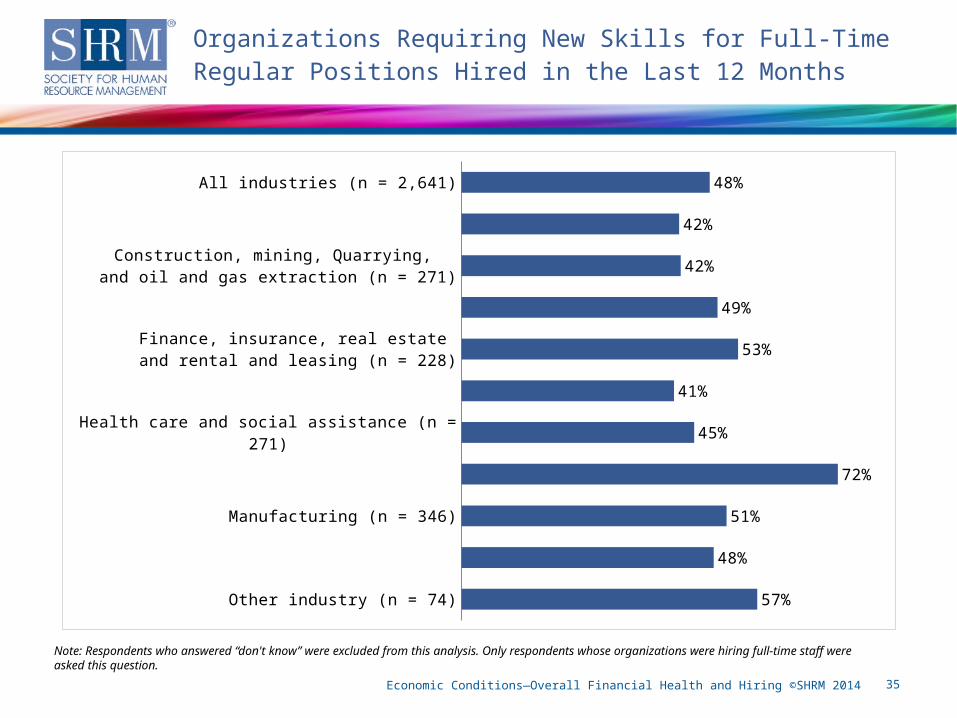
• Have any of the full-time regular positions required new skills? Of those organizations hiring, about one-half (48%) indicated that new skills were required for full-time regular positions they have hired in the last 12 months.
» Close to three-quarters (72%) of organizations in the high-tech industry reported requiring new skills for full-time regular positions they have hired.
» Top reasons that those positions require new skills were growth of organization (56%), changing technology (51%) and organizations were developing or offering new products.
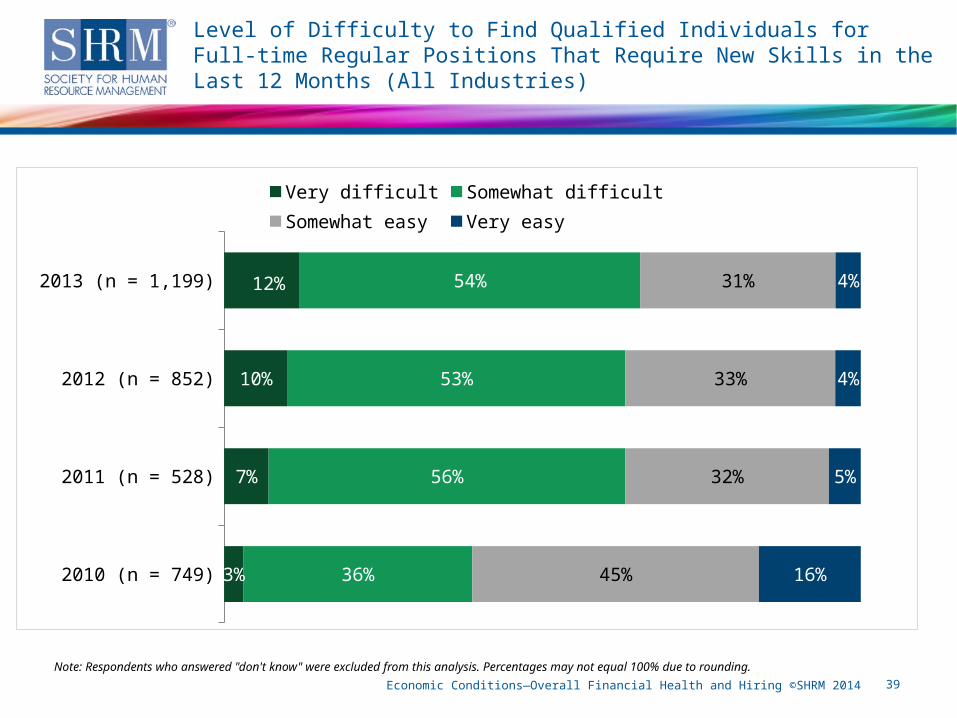
• Is it difficult to find qualified individuals for full-time regular positions requiring new skills? Two-thirds (66%) of organizations reported it was somewhat or very difficult to recruit for full-time regular positions that require new skills in the last 12 months, a slight increase from 63% in 2012 and 2011.
» The high-tech industry reported the highest percentage (77%) of difficulty in finding qualified individuals for full-time regular positions that require new skills.
Key Findings (continued)

Economic Conditions—Overall Financial Health and Hiring ©SHRM 2014 8
• After a lengthy recession that saw the loss of more than eight million jobs, the U.S. economy is clearly in recovery, albeit in a tempered period of growth. Four-fifths of respondents to this survey reported that their organization is either in “excellent” or “good” financial health, an extremely positive indicator for the economy’s current expansion.
• Despite improved conditions, many employers and sectors of the economy are still struggling. Certain industries, such as high-tech, are seeing increased demand for their services, but others—particularly government entities—continue to face budget deficits. And although hiring has improved in the U.S. labor market overall, some employers have still been forced to cut staff to make ends meet. One quarter of respondents to this survey laid off workers in response to financial difficulties during the past 12 months.
• Despite recent job gains, millions of positions are still going unfilled and, consequently, impeding the growth of some employers. In July 2014, there were 4.7 million job openings in the United States, up nearly 800,000 from the beginning of 2014, according to federal data. With millions of people seeking work, it is clear that many jobs are not being filled due to a skills mismatch between job seekers and open positions. Two-thirds of respondents to this survey indicated that they were having difficulty hiring for their full-time openings.
What Do These Findings Mean for the HR Profession?

Economic Conditions—Overall Financial Health and Hiring ©SHRM 2014 9
Organizations’ Overall Financial Health
Note: Respondents who answered "don't know" were excluded from this analysis. Percentages may not equal 100% due to rounding.
All industries (n = 3,255)
Finance, insurance, real estate and rentaland leasing (n = 302)
Construction, mining, quarrying, and oil and
gas extraction (n = 331)
High-tech (n = 153)
Educational services (n = 357)
30%
44%
44%
37%
34%
34%
27%
19%
17%
17%
50%
45%
43%
48%
50%
49%
52%
59%
53%
50%
16%
10%
9%
13%
13%
13%
16%
17%
25%
27%
4%
2%
4%
2%
3%
4%
5%
6%
5%
6%
Excellent Good Fair Poor

Economic Conditions—Overall Financial Health and Hiring ©SHRM 2014 10
Organizations’ Overall Financial Health—Excellent
Note: Only statistically significant differences are shown.
Comparison by organization staff size
• Organizations with 25,000 or more employees were more likely than organizations with 1 to 24,999 employees to rate their current overall financial health as “excellent.”
1 to 99 100 to 499 500 to 2,499 2,500 to 24,999 25,000 or more
26%30%
28%30%
44%

Economic Conditions—Overall Financial Health and Hiring ©SHRM 2014 11
Organizations’ Change in Overall Financial Health Compared to 12 Months Ago (All Industries)
Note: Respondents who answered "don't know" were excluded from this analysis. Percentages may not equal 100% due to rounding.
2013 (n = 3,140)
2012 (n = 3,362)
2011 (n = 2,277)
2010 (n = 2,333)
13%
13%
9%
7%
44%
38%
33%
35%
22%
22%
24%
25%
17%
20%
26%
24%
4%
7%
8%
9%
Significantimprovement
Mildimprovement
Nochange
Milddecline
Significantdecline
Economic Conditions—Overall Financial Health and Hiring ©SHRM 2014 12
Organizations’ Change in Overall Financial Health Compared to 12 Months Ago (by Industry)
Note: Respondents who answered "don't know" were excluded from this analysis. Percentages may not equal 100% due to rounding.
SignificantImprovemen
t
MildImprovement
NoChange
MildDecline
SignificantDecline
All industries (n = 3,140) 13% 44% 22% 17% 4%
Finance, insurance, real estate and rental and leasing (n = 288)
20% 47% 19% 10% 3%
Accommodation and food services, retail/wholesale trade (n = 309)
17% 53% 19% 10% 1%
Construction, mining, quarrying, and oil and gas extraction (n = 318)
16% 47% 16% 17% 4%
Manufacturing (n = 388) 15% 47% 21% 15% 2%
High-tech (n = 150) 15% 47% 15% 19% 4%
Professional, scientific, and technicalservices (n = 434)
14% 43% 20% 17% 6%
Health care and social assistance (n = 324)
12% 33% 21% 26% 7%
Educational services (n = 346) 6% 37% 35% 19% 3%
Government agencies (n = 500) 6% 44% 30% 16% 5%

Economic Conditions—Overall Financial Health and Hiring ©SHRM 2014 13
Organizations’ Loss of Regular Full-Time Workforce in the Last 12 Months due to Layoffs, Attrition, Restructuring, etc. (All Industries)
Note: Respondents who answered "don't know" were excluded from this analysis. Percentages may not equal 100% due to rounding.
0% of staff
1% to 5% of staff
6% to 10% of staff
11% to 20% of staff
21% to 50% of staff
More than 50% of staff
31%
40%
16%
9%
4%
1%
49%
33%
10%
5%
2%
1%
2012 (n = 3,277)2013 (n = 3,141)

Economic Conditions—Overall Financial Health and Hiring ©SHRM 2014 14
Organizations’ Loss of Regular Full-Time Workforce in the Last 12 Months due to Layoffs, Attrition, Restructuring, etc. (All Industries)
Note: Only statistically significant differences are shown.
Comparison by organization staff size
• Organizations with 1 to 99 employees were more likely than organizations with 100 or more employees to have encountered 0% staff loss in the last 12 months. Organizations with 100 to 2,499 employees were more likely than organizations with 2,500 or more employees to have encountered 0% staff loss in the last 12 months.
1 to 99 100 to 499 500 to 2,499 2,500 to 24,999 25,000 or more
45%
34%28%
20%15%
Number of employees

Economic Conditions—Overall Financial Health and Hiring ©SHRM 2014 15
Organizations’ Loss of Regular Full-Time Workforce in the Last 12 Months due to Layoffs, Attrition, Restructuring, etc. (by Industry)
Note: Respondents who answered "don't know" were excluded from this analysis. Percentages may not equal 100% due to rounding.
0%of Staff
1% to 5%of Staff
6% to 10%of Staff
11% to 20%
of Staff
21% to 50%
of Staff
More Than 50% of Staff
All industries (n = 3,141) 31% 40% 16% 9% 4% 1%
Accommodation and food services, retail/wholesale trade (n = 302)
33% 39% 12% 9% 6% 1%
Construction, mining, quarrying, and oil and gas extraction (n = 322)
22% 38% 22% 13% 4% 1%
Educational services (n = 337) 34% 47% 11% 5% 2% 1%
Finance, insurance, real estate and rental and leasing (n = 284)
33% 38% 15% 9% 4% 1%
Government agencies (n = 505) 35% 39% 15% 9% 1% <1%
Health care and social assistance (n = 321)
31% 48% 11% 6% 4% 1%
High-tech (n = 150) 15% 37% 27% 16% 5% 1%
Manufacturing (n = 392) 32% 42% 14% 8% 4% 1%
Professional, scientific, and technical services (n = 440)
31% 31% 19% 11% 7% 1%

Economic Conditions—Overall Financial Health and Hiring ©SHRM 2014 16
Actions Organizations Have Taken as a Result of Financial Challenges in the Last 12 Months (All Industries)
Note: n = 3,211. Respondents who answered "don't know" were excluded from this analysis. Percentages do not equal 100% due to multiple response options.
None
Laid off employees
Eliminated or reduced overtime
Cut temporary staff
Reduced employee hours
Furloughed employees because of the government shutdown
Other cuts
40%
27%
25%
19%
16%
15%
13%
11%
11%
6%
4%
3%
4%

Economic Conditions—Overall Financial Health and Hiring ©SHRM 2014 17
Actions Organizations Have Taken as a Result of Financial Challenges in the Last 12 Months (All Industries)
Note: Only statistically significant differences are shown.
Comparison by organization staff size
• Organizations with 1 to 499 employees were more likely than organizations with 500 or more employees to have taken NO actions as a result of financial challenges. Organizations with 500 to 2,499 employees were more likely than organizations with 2,500 or more employees to have taken NO actions as a result of financial challenges.
1 to 99 100 to 499 500 to 2,499 2,500 to 24,999 25,000 or more
52%48%
37%
27%19%
Number of employees

Economic Conditions—Overall Financial Health and Hiring ©SHRM 2014 18
Actions Organizations Have Taken as a Result of Financial Challenges in the Last 12 Months (by Industry)
Note: Respondents who answered "don't know" were excluded from this analysis. Percentages do not equal 100% due to multiple response options.
NoneImplemented Budget
Cuts
Laid Off Employee
s
Had a Hiring Freeze
Eliminated or
Reduced Overtime
Frozen/Reduced Salaries, Raises or Bonuses
Cut Temporary Staff
All industries (n = 3,211) 40% 27% 25% 19% 16% 15% 13%
Accommodation and food services, retail/wholesale trade (n = 318)
44% 21% 16% 15% 21% 8% 12%
Construction, mining, quarrying, and oil and gas extraction (n = 324)
43% 20% 37% 19% 11% 11% 14%
Educational services (n = 345) 31% 37% 22% 17% 13% 18% 12%
Finance, insurance, real estate and rental and leasing (n = 290) 53% 20% 21% 11% 9% 9% 9%
Government agencies (n = 520) 33% 35% 13% 24% 17% 27% 13%
Health care and social assistance (n = 337) 30% 33% 29% 20% 29% 19% 14%
High-tech (n = 152) 40% 28% 38% 32% 11% 11% 19%
Manufacturing (n = 396) 44% 22% 28% 21% 20% 8% 19%
Professional, scientific, and technical services (n = 438) 45% 23% 31% 17% 8% 13% 12%

Economic Conditions—Overall Financial Health and Hiring ©SHRM 2014 19
Actions Organizations Have Taken as a Result of Financial Challenges in the Last 12 Months (by Industry, continued)
Note: Respondents who answered "don't know" were excluded from this analysis. Percentages do not equal 100% due to multiple response options.
Reduced Benefits or Increased Employee
Contribution
Reduced Employee
Hours
Offered Early
Retirement or
Retirement Incentive
Furloughed Employees Because of
the Government Shutdown
Furloughed Employees, Unrelated
to the Government Shutdown
Other Cuts
All industries (n = 3,211) 11% 11% 6% 4% 3% 4%
Accommodation and food services, retail/wholesale trade (n = 318)
9% 22% 2% 1% 1% 4%
Construction, mining, quarrying, and oil and gas extraction (n = 324)
9% 9% 6% 3% 5% 3%
Educational services (n = 345) 12% 13% 12% 3% 4% 4%
Finance, insurance, real estate and rental and leasing (n = 290)
11% 3% 3% 0% <1% 3%
Government agencies (n = 520) 11% 7% 11% 9% 5% 5%
Health care and social assistance (n = 337)
16% 24% 5% 1% 2% 4%
High-tech (n = 152) 8% 6% 6% 3% 5% 2%
Manufacturing (n = 396) 9% 7% 5% 1% 4% 4%
Professional, scientific, and technical services (n = 438)
14% 7% 4% 8% 4% 4%

Economic Conditions—Overall Financial Health and Hiring ©SHRM 2014 20
Actions Organizations Have Taken as a Result of Financial Stability or Growth in the Last 12 Months (All Industries)
Note: n = 3,095. Respondents who answered "don't know" were excluded from this analysis. Percentages do not equal 100% due to multiple response options.
None
Increased salaries
Provided bonuses
Filled positions that were lost(e.g., due to layoffs, attrition, restructuring)
Improved benefits package
Increased budgets
Allowed for increased employee hours(e.g., back to normal hours or allowing overtime)
Ended hiring freeze
Ended furlough
Provided back-pay for furloughed employees
Other improvements
32%
39%
33%
23%
11%
10%
10%
9%
3%
1%
3%

Economic Conditions—Overall Financial Health and Hiring ©SHRM 2014 21
Actions Organizations Have Taken as a Result of Financial Stability or Growth in the Last 12 Months(by Industry)
Note: Respondents who answered "don't know" were excluded from this analysis. Percentages do not equal 100% due to multiple response options.
NoneIncreased Salaries
Provided Bonuses
Filled Positions That Were
Lost
Improved Benefits Package
Increased Budgets
All industries (n = 3,095) 32% 39% 33% 23% 11% 10%
Accommodation and food services, retail/wholesale trade (n = 305)
34% 38% 39% 20% 16% 14%
Construction, mining, quarrying, and oil and gas extraction (n = 323)
30% 36% 42% 27% 13% 11%
Educational services (n = 337) 39% 38% 13% 21% 8% 9%
Finance, insurance, real estate and rental and leasing (n = 283)
29% 41% 46% 19% 15% 11%
Government agencies (n = 489)
33% 36% 9% 27% 4% 8%
Health care and social assistance(n = 321)
40% 33% 26% 15% 9% 7%
High-tech (n = 147) 28% 43% 43% 33% 13% 15%
Manufacturing (n = 383) 28% 44% 43% 23% 10% 9%
Professional, scientific, and technical services (n = 423)
26% 47% 48% 24% 13% 12%
Economic Conditions—Overall Financial Health and Hiring ©SHRM 2014 22
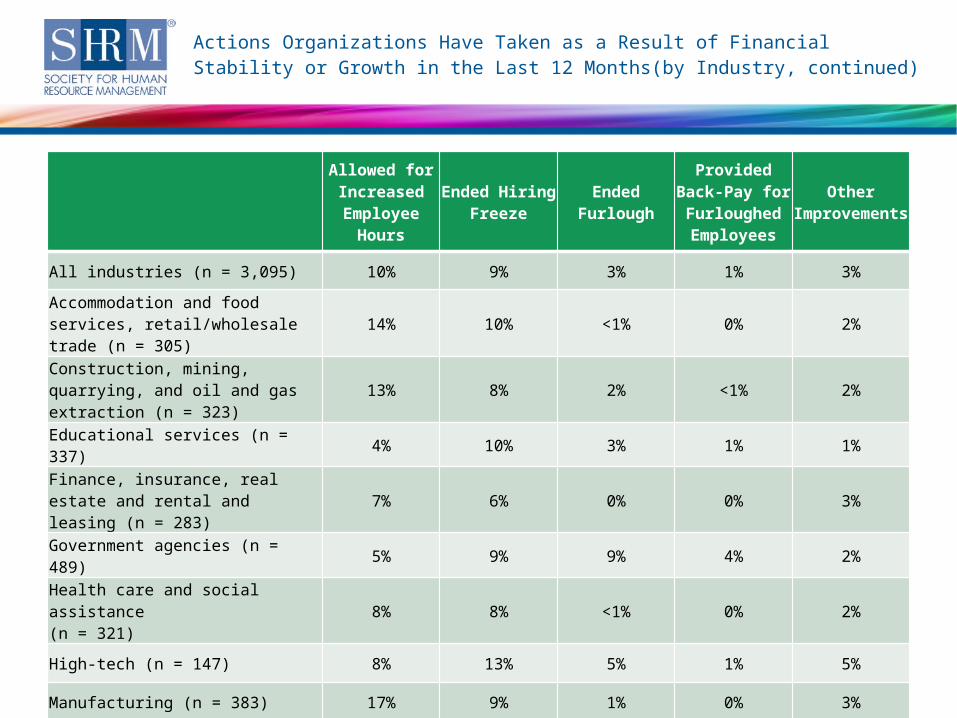
Actions Organizations Have Taken as a Result of Financial Stability or Growth in the Last 12 Months(by Industry, continued)
Note: Respondents who answered "don't know" were excluded from this analysis. Percentages do not equal 100% due to multiple response options.
Allowed for Increased Employee
Hours
Ended Hiring Freeze
EndedFurlough
Provided Back-Pay for Furloughed Employees
Other Improvemen
ts
All industries (n = 3,095) 10% 9% 3% 1% 3%
Accommodation and food services, retail/wholesale trade (n = 305)
14% 10% <1% 0% 2%
Construction, mining, quarrying, and oil and gas extraction (n = 323)
13% 8% 2% <1% 2%
Educational services (n = 337) 4% 10% 3% 1% 1%
Finance, insurance, real estate and rental and leasing (n = 283)
7% 6% 0% 0% 3%
Government agencies (n = 489) 5% 9% 9% 4% 2%
Health care and social assistance(n = 321)
8% 8% <1% 0% 2%
High-tech (n = 147) 8% 13% 5% 1% 5%
Manufacturing (n = 383) 17% 9% 1% 0% 3%
Professional, scientific, and technical services (n = 423)
10% 6% 5% 1% 6%

Economic Conditions—Overall Financial Health and Hiring ©SHRM 2014 23
Organizations Hiring Full- and Part-Time Regular Staff in the Last 12 Months
Note: Respondents who answered "don't know" were excluded from this analysis.
All industries (n = 3,236 - 3,330)
Accommodation and food services, retail/wholesale trade (n = 323 - 329)
Construction, mining, quarrying, and oil and gas extraction (n = 319 - 335)
Educational services (n = 359 - 367)
Finance, insurance, real estate and rental and leasing (n = 299 - 307)
Government agencies (n = 523 - 534)
Health care and social assistance(n = 345 - 349)
High-tech (n = 149 - 156)
Manufacturing (n = 388 - 404)
Professional, scientific, and technical services (n = 442 - 458)
96%
98%
97%
96%
95%
96%
97%
99%
97%
91%
67%
85%
47%
87%
67%
73%
89%
56%
41%
60%
Regular Part-Time
Regular Full-Time

Economic Conditions—Overall Financial Health and Hiring ©SHRM 2014 24
Organizations Hiring Full- and Part-Time Contract/Temporary Staff in the Last 12 Months
Note: Respondents who answered "don't know" were excluded from this analysis.
All industries (n = 3,082 - 3,172)
Accommodation and food services, retail/wholesale trade (n = 294 - 303)
Construction, mining, quarrying, and oil and gas extraction (n = 312 - 327)
Educational services (n = 337 - 339)
Finance, insurance, real estate and rental and leasing (n = 284 - 298)
Government agencies (n = 493 - 498)
Health care and social assistance(n = 315 - 324)
High-tech (n = 144 - 153)
Manufacturing (n = 382 - 398)
Professional, scientific, and technical services (n = 430 - 446)
62%
57%
57%
62%
57%
62%
57%
82%
73%
63%
52%
53%
37%
73%
46%
62%
57%
62%
35%
50%
Contract/tem-porary Part-Time Contract/tem-porary Full-Time

Economic Conditions—Overall Financial Health and Hiring ©SHRM 2014 25
Importance of Factors in Organizations’ Decision to Hire for Full-Time Regular Positions (All Industries)
Note: n = 2,873 - 3,055. Respondents who answered "don't know" were excluded from this analysis. Only respondents whose organizations were hiring full-time staff were asked this question. Percentages may not equal 100% due to rounding.
Maintain normal business operations
Organizational growth
Changes in business strategy
Improved economy
33%
26%
17%
10%
46%
42%
38%
25%
17%
16%
24%
33%
3%
8%
11%
18%
2%
8%
9%
13%
Extremelyimportant
Veryimportant
Somewhatimportant
Not veryimportant
Not importantat all
Economic Conditions—Overall Financial Health and Hiring ©SHRM 2014 26
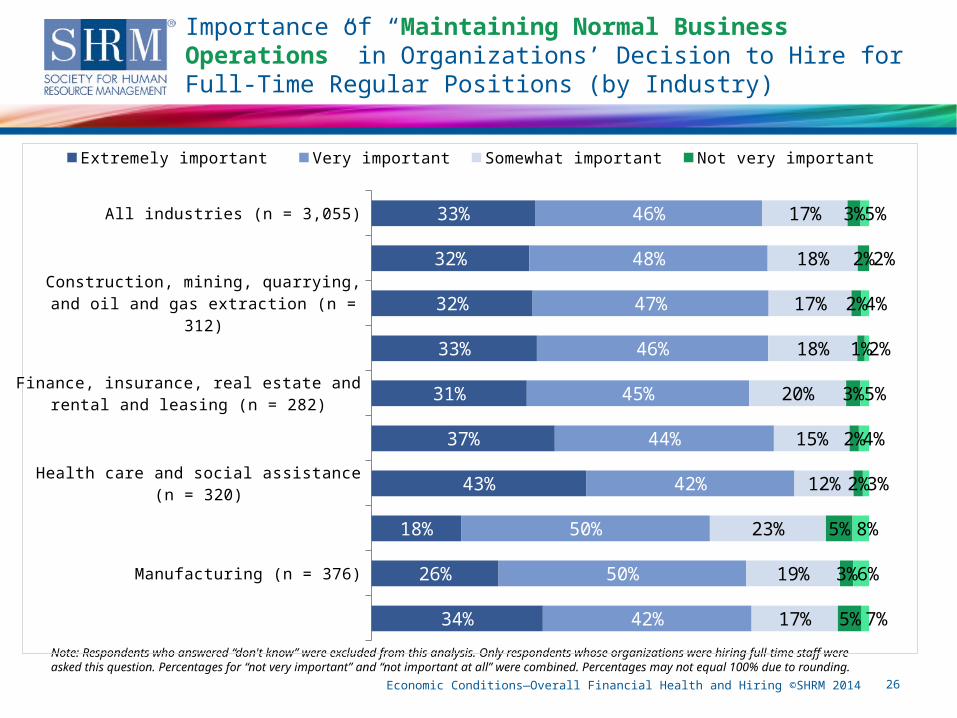
Importance of “Maintaining Normal Business Operations” in Organizations’ Decision to Hire for Full-Time Regular Positions (by Industry)
Note: Respondents who answered “don't know” were excluded from this analysis. Only respondents whose organizations were hiring full-time staff were asked this question. Percentages for “not very important” and “not important at all” were combined. Percentages may not equal 100% due to rounding.
All industries (n = 3,055)
Accommodation and food services, retail/wholesale trade (n = 309)
Construction, mining, quarrying, and oil and gas extraction (n = 312)
Educational services (n = 340)
Finance, insurance, real estate and rental and leasing (n = 282)
Government agencies (n = 486)
Health care and social assistance (n = 320)
High-tech (n = 150)
Manufacturing (n = 376)
Professional, scientific, and technical services (n = 398)
33%
32%
32%
33%
31%
37%
43%
18%
26%
34%
46%
48%
47%
46%
45%
44%
42%
50%
50%
42%
17%
18%
17%
18%
20%
15%
12%
23%
19%
17%
3%
2%
2%
1%
3%
2%
2%
5%
3%
5%
5%
2%
4%
2%
5%
4%
3%
8%
6%
7%
Extremely important Very important Somewhat important Not very important Not important at all

Economic Conditions—Overall Financial Health and Hiring ©SHRM 2014 27
Importance of “Organizational Growth” in Organizations’ Decision to Hire for Full-Time Regular Positions (by Industry)
Note: Respondents who answered "don't know" were excluded from this analysis. Only respondents whose organizations were hiring full-time staff were asked this question. Percentages may not equal 100% due to rounding.
All industries (n = 2,984)
Accommodation and food services, retail/wholesale trade (n = 306)
Construction, mining, quarrying, and oil and gas extraction (n = 304)
Educational services (n = 324)
Finance, insurance, real estate and rental and leasing (n = 279)
Government agencies (n = 462)
Health care and social assistance (n = 313)
High-tech (n = 149)
Manufacturing (n = 376)
Professional, scientific, and technical services (n = 390)
26%
28%
29%
18%
33%
12%
26%
40%
24%
35%
42%
47%
44%
43%
46%
29%
43%
40%
47%
39%
16%
13%
17%
18%
11%
24%
13%
13%
17%
15%
8%
8%
5%
13%
5%
15%
10%
5%
5%
5%
8%
4%
4%
9%
4%
20%
7%
2%
6%
5%
Extremely important Very important Somewhat important Not very important Not important at all
Economic Conditions—Overall Financial Health and Hiring ©SHRM 2014 28
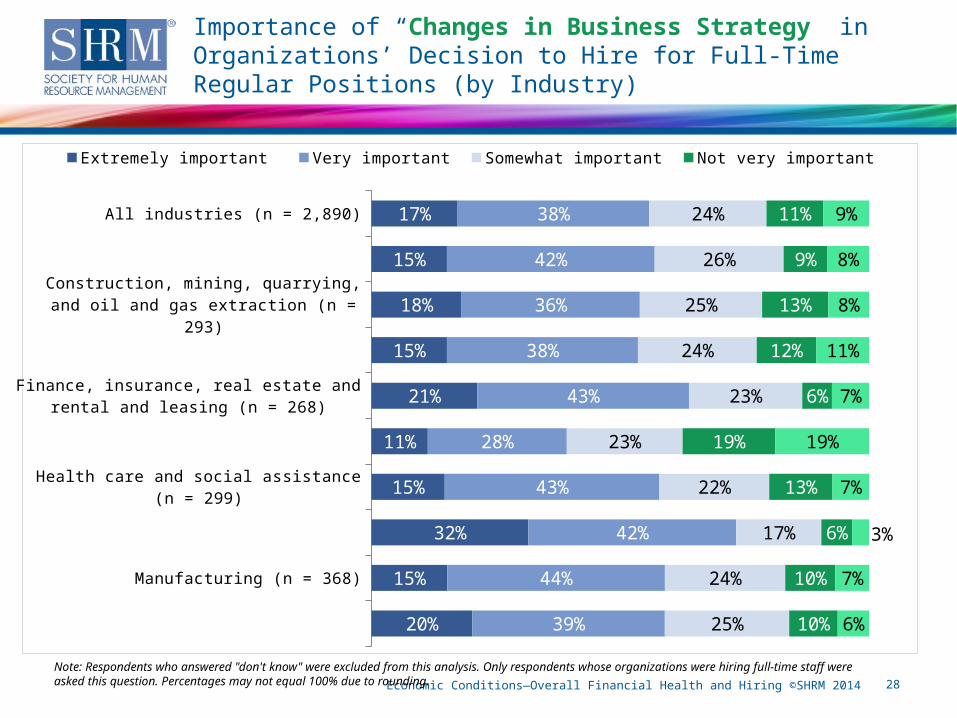
Importance of “Changes in Business Strategy” in Organizations’ Decision to Hire for Full-Time Regular Positions (by Industry)
Note: Respondents who answered "don't know" were excluded from this analysis. Only respondents whose organizations were hiring full-time staff were asked this question. Percentages may not equal 100% due to rounding.
All industries (n = 2,890)
Accommodation and food services, retail/wholesale trade (n = 297)
Construction, mining, quarrying, and oil and gas extraction (n = 293)
Educational services (n = 310)
Finance, insurance, real estate and rental and leasing (n = 268)
Government agencies (n = 451)
Health care and social assistance (n = 299)
High-tech (n = 146)
Manufacturing (n = 368)
Professional, scientific, and technical services (n = 380)
17%
15%
18%
15%
21%
11%
15%
32%
15%
20%
38%
42%
36%
38%
43%
28%
43%
42%
44%
39%
24%
26%
25%
24%
23%
23%
22%
17%
24%
25%
11%
9%
13%
12%
6%
19%
13%
6%
10%
10%
9%
8%
8%
11%
7%
19%
7%
3%
7%
6%
Extremely important Very important Somewhat important Not very important Not important at all

Economic Conditions—Overall Financial Health and Hiring ©SHRM 2014 29
Importance of “Improved Economy” in Organizations’ Decision to Hire for Full-Time Regular Positions (by Industry)
Note: Respondents who answered "don't know" were excluded from this analysis. Only respondents whose organizations were hiring full-time staff were asked this question. Percentages may not equal 100% due to rounding.
All industries (n = 2,873)
Accommodation and food services, retail/wholesale trade (n = 294)
Construction, mining, quarrying, and oil and gas extraction (n = 292)
Educational services (n = 312)
Finance, insurance, real estate and rental and leasing (n = 259)
Government agencies (n = 451)
Health care and social assistance (n = 294)
High-tech (n = 144)
Manufacturing (n = 371)
Professional, scientific, and technical tervices (n = 377)
10%
14%
13%
8%
8%
12%
7%
6%
10%
11%
25%
30%
30%
21%
31%
22%
20%
22%
27%
25%
33%
29%
34%
36%
32%
28%
33%
39%
34%
34%
18%
16%
13%
19%
21%
17%
27%
22%
18%
17%
13%
11%
10%
16%
9%
20%
13%
11%
12%
13%
Extremely important Very important Somewhat important Not very important Not important at all

Economic Conditions—Overall Financial Health and Hiring ©SHRM 2014 30
Types of Full-Time Regular Positions That Organizations Hired in the Last 12 Months
Note: Respondents who answered "don't know" were excluded from this analysis. Only respondents whose organizations were hiring full-time staff were asked this question. Percentages do not equal 100% due to multiple response options.
All industries (n = 2,870)
Accommodation and food services, retail/wholesale trade (n = 285)
Construction, mining, quarrying, and oil and gas extraction (n = 301)
Educational services (n = 326)
Finance, insurance, real estate and rental and leasing (n = 258)
Government agencies (n = 458)
Health care and social assistance (n = 302)
High-tech (n = 135)
Manufacturing (n = 356)
Professional, scientific, and technical services (n = 374)
82%
81%
78%
82%
80%
86%
87%
76%
80%
79%
61%
56%
64%
62%
68%
40%
55%
81%
62%
74%
42%
37%
39%
50%
42%
41%
44%
64%
43%
35%
Replacements, but with new duties
Completely new positions
Replacements

Economic Conditions—Overall Financial Health and Hiring ©SHRM 2014 31
Types of Full-Time Regular Positions That Organizations Hired in the Last 12 Months
Note: Only statistically significant differences are shown.
Comparison by organization staff size
• Organizations with 100 or more employees were more likely than organizations with 1 to 99 employees to have hired replacements in the last 12 months.
1 to 99 100 to 499 500 to 2,499 2,500 to 24,999 25,000 or more
70%81% 83% 86% 89%
Number of employees
• Organizations with 500 to 24,999 employees were more likely than organizations with 1 to 499 employees to have hired replacements but with new duties in the last 12 months.
1 to 99 100 to 499 500 to 2,499 2,500 to 24,999 25,000 or more
30% 36%49% 51%
40%
Number of employees
Economic Conditions—Overall Financial Health and Hiring ©SHRM 2014 32
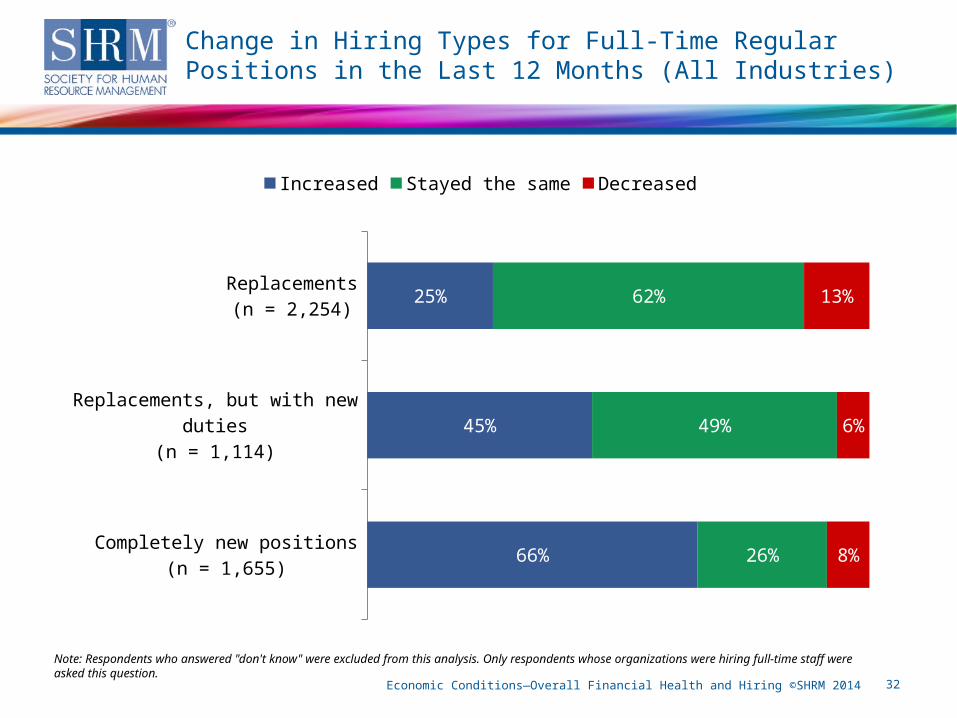
Change in Hiring Types for Full-Time Regular Positions in the Last 12 Months (All Industries)
Note: Respondents who answered "don't know" were excluded from this analysis. Only respondents whose organizations were hiring full-time staff were asked this question.
Replacements(n = 2,254)
Replacements, but with new duties
(n = 1,114)
Completely new positions(n = 1,655)
25%
45%
66%
62%
49%
26%
13%
6%
8%
Increased Stayed the same Decreased

Economic Conditions—Overall Financial Health and Hiring ©SHRM 2014 33
Increased Hiring for Completely New Full-Time Regular Positions in the Last 12 Months (All Industries)
Note: Only statistically significant differences are shown.
Comparison by organization staff size
• Organizations with 1 to 499 employees were more likely than organizations with 500 or more employees to report increased hiring for completely new full-time regular positions in the last 12 months.
1 to 99 em-ployees
100 to 499 employees
500 to 2,499 employees
2,500 to 24,999 employees
25,000 or more employees
76% 74%
60% 58%51%

Economic Conditions—Overall Financial Health and Hiring ©SHRM 2014 34
Change in Hiring Types for Full-Time Regular Positions in the Last 12 Months (by Industry)
Note: Respondents who answered "don't know" were excluded from this analysis. Only respondents whose organizations were hiring full-time staff were asked this question.
Replacements Replacements, but with
New DutiesCompletely New Positions
IncreasedStayed
the SameDecrease
dIncreased
Stayed the Same
Decreased
IncreasedStayed
the sameDecrease
d
All industries (n = 1,114 - 2,254) 25% 62% 13% 45% 49% 6% 66% 26% 8%
Accommodation and food services, retail/wholesale trade (n = 96 - 222)
23% 64% 12% 47% 47% 6% 66% 28% 6%
Construction, mining, quarrying, and oil and gas extraction (n = 109 - 229)
31% 55% 14% 48% 48% 5% 79% 16% 5%
Educational services (n = 151 - 258)
18% 69% 13% 45% 50% 5% 54% 36% 9%
Finance, insurance, real estate and rental and leasing (n = 100 - 196)
24% 66% 10% 48% 48% 4% 74% 23% 4%
Government agencies (n = 176 - 380)
27% 58% 15% 49% 44% 6% 65% 26% 8%
Health care and social assistance (n = 119 - 252)
22% 63% 15% 42% 50% 8% 56% 25% 19%
High-tech (n = 82 - 105) 26% 58% 16% 34% 54% 12% 63% 24% 13%
Manufacturing (n = 140 - 276) 25% 64% 11% 44% 51% 5% 66% 27% 6%
Professional, scientific, and technical services (n = 120 - 282)
28% 61% 11% 41% 48% 11% 66% 24% 9%
Economic Conditions—Overall Financial Health and Hiring ©SHRM 2014 35
Organizations Requiring New Skills for Full-Time Regular Positions Hired in the Last 12 Months
Note: Respondents who answered “don't know” were excluded from this analysis. Only respondents whose organizations were hiring full-time staff were asked this question.
All industries (n = 2,641)
Accommodation and food services, retail/wholesale trade (n = 261)
Construction, mining, Quarrying, and oil and gas extraction (n = 271)
Educational services (n = 287)
Finance, insurance, real estate and rental and leasing (n = 228)
Government agencies (n = 434)
Health care and social assistance (n = 271)
High-tech (n = 126)
Manufacturing (n = 346)
Professional, scientific, and technical Services (n = 343)
Other industry (n = 74)
48%
42%
42%
49%
53%
41%
45%
72%
51%
48%
57%

Economic Conditions—Overall Financial Health and Hiring ©SHRM 2014 36
Reasons That Those Positions Require New Skills (All Industries)
Note: n = 1,221. Respondents who answered “don't know” were excluded from this analysis. Percentages do not equal 100% due to multiple response options. Only respondents whose organizations were hiring full-time positions that required new skills were asked this question.
Growth of organization
Changing technology
Developing or offering new products/services
Expanding business into new markets
Reorganization
Merger or acquisition
Replacing temporary workers, part-time employees, contractors or freelancers with
full-time positions
Other
56%
51%
44%
39%
33%
10%
9%
7%
Economic Conditions—Overall Financial Health and Hiring ©SHRM 2014 37
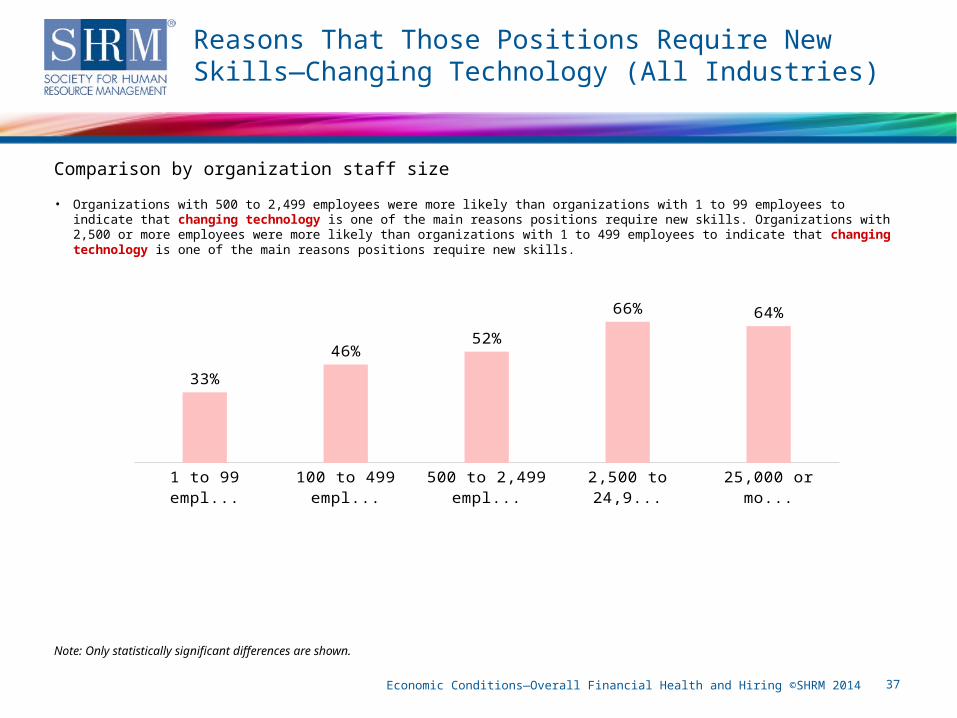
Reasons That Those Positions Require New Skills—Changing Technology (All Industries)
Note: Only statistically significant differences are shown.
Comparison by organization staff size
• Organizations with 500 to 2,499 employees were more likely than organizations with 1 to 99 employees to indicate that changing technology is one of the main reasons positions require new skills. Organizations with 2,500 or more employees were more likely than organizations with 1 to 499 employees to indicate that changing technology is one of the main reasons positions require new skills.
1 to 99 em-ployees
100 to 499 employees
500 to 2,499 employees
2,500 to 24,999 employees
25,000 or more employees
33%
46%52%
66% 64%

Economic Conditions—Overall Financial Health and Hiring ©SHRM 2014 38
Reasons That Those Positions Require New Skills (by Industry)
Note: Respondents who answered “don't know” were excluded from this analysis. Percentages do not equal 100% due to multiple response options. Only respondents whose organizations were hiring full-time positions that required new skills were asked this question.
Growth of
Organization
Changing Technolo
gy
Developing or
Offering New
Products/Services
Expanding
Business into New Markets
Reorganizatio
n
Merger or
Acquisition
Replacing Temporary Workers,
Part-time Employees,
Contractors or Freelancers with
Full-Time Positions
Other
All industries (n = 1,221) 56% 51% 44% 39% 33% 10% 9% 7%
Accommodation and food services, retail/wholesale trade (n = 102)
61% 51% 49% 45% 26% 15% 10% 5%
Construction, mining, quarrying, and oil and gas extraction (n = 110)
65% 37% 32% 46% 25% 14% 5% 6%
Educational services (n = 137)
45% 53% 40% 31% 38% 1% 9% 12%
Finance, insurance, real estate and rental and leasing (n = 116)
64% 47% 47% 41% 33% 12% 9% 11%
Government agencies (n = 171)
33% 57% 28% 11% 54% 4% 16% 9%
Health care and social assistance (n = 118)
53% 50% 43% 29% 32% 8% 3% 12%
High-tech (n = 90) 70% 59% 63% 61% 28% 18% 6% 3%
Manufacturing (n = 174) 60% 52% 48% 48% 25% 10% 9% 4%
Professional, scientific, and technical services (n = 162)
63% 49% 50% 49% 30% 12% 5% 4%
Economic Conditions—Overall Financial Health and Hiring ©SHRM 2014 39
Level of Difficulty to Find Qualified Individuals for Full-time Regular Positions That Require New Skills in the Last 12 Months (All Industries)
Note: Respondents who answered "don't know" were excluded from this analysis. Percentages may not equal 100% due to rounding.
2013 (n = 1,199)
2012 (n = 852)
2011 (n = 528)
2010 (n = 749)
12%
10%
7%
3%
54%
53%
56%
36%
31%
33%
32%
45%
4%
4%
5%
16%
Very difficult Somewhat difficult Somewhat easy Very easy

Economic Conditions—Overall Financial Health and Hiring ©SHRM 2014 40
Level of Difficulty to Find Qualified Individuals for Full-time Regular Positions That Require New Skills in the Last 12 Months (by Industry)
Note: Respondents who answered “don't know” were excluded from this analysis. Only respondents whose organizations were hiring full-time positions that required new skills were asked this question. Percentages may not equal 100% due to rounding.
All industries (n = 1,199)
Accommodation and food services, retail/wholesale trade (n = 101)
Construction, mining, quarrying, and oil and gas extraction (n = 109)
Educational services (n = 131)
Finance, insurance, real estate and rental and leasing (n = 117)
Government agencies (n = 168)
Health care and social assistance (n = 114)
High-tech (n = 89)
Manufacturing (n = 171)
Professional, scientific, and technical services (n = 161)
12%
10%
11%
8%
12%
7%
15%
12%
20%
12%
54%
54%
52%
50%
56%
49%
54%
65%
48%
58%
31%
33%
34%
34%
30%
36%
27%
21%
30%
27%
4%
3%
3%
8%
2%
7%
4%
1%
2%
2%
Very difficult Somewhat difficult Somewhat easy Very easy
Economic Conditions—Overall Financial Health and Hiring ©SHRM 2014 41
Types of Full-Time Job Categories Organizations Hired in the Last 12 Months (All Industries)
Note: n = 3,023. Respondents who answered “don't know” were excluded from this analysis. Percentages do not equal 100% due to multiple response options. Only respondents whose organizations were hiring full-time staff were asked this question.
Administrative support staff
Accounting and finance professionals
Managers and executives
IT/computer specialists, such as IT analysts, software developers and programmers, database administrators
HR professionals
Customer service representatives
Hourly laborers
Engineers
Skilled trades, such as electricians, carpenters, machinists, mechanics, welders, plumbers
Sales representatives
60%
53%
49%
42%
38%
31%
30%
25%
24%
22%
Economic Conditions—Overall Financial Health and Hiring ©SHRM 2014 42
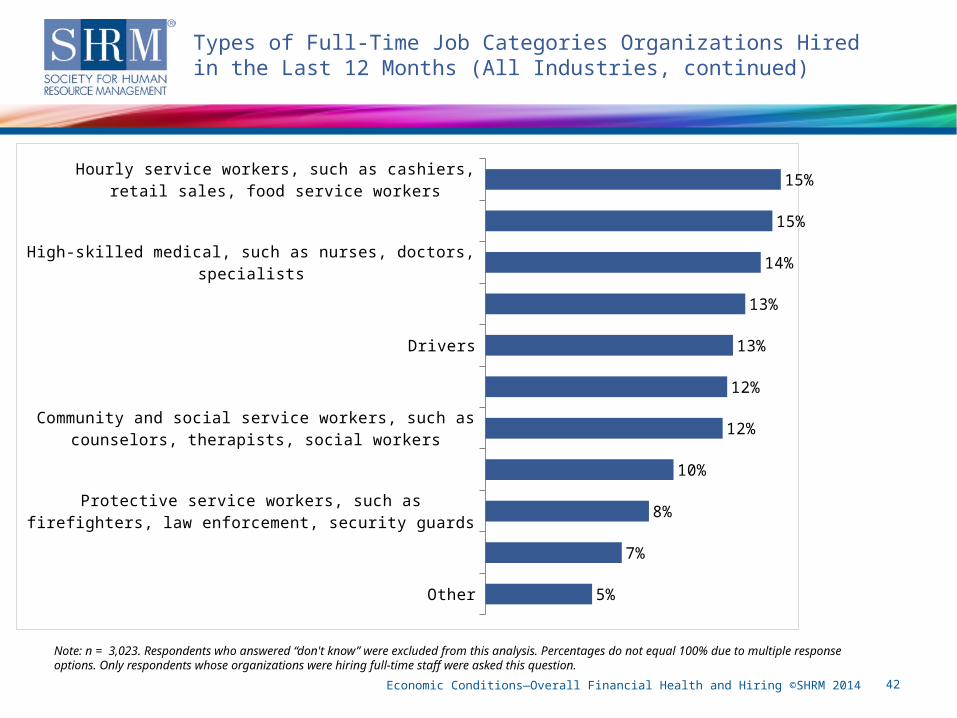
Types of Full-Time Job Categories Organizations Hired in the Last 12 Months (All Industries, continued)
Note: n = 3,023. Respondents who answered “don't know” were excluded from this analysis. Percentages do not equal 100% due to multiple response options. Only respondents whose organizations were hiring full-time staff were asked this question.
Hourly service workers, such as cashiers, retail sales, food service workers
High-skilled technicians, such as health, telecommunications and environmental technicians
High-skilled medical, such as nurses, doctors, specialists
Production operators
Drivers
Educators, such as teachers, professors
Community and social service workers, such as counselors, therapists, social workers
Lawyers, judges and legal support workers
Protective service workers, such as firefighters, law enforcement, security guards
Scientists
Other
15%
15%
14%
13%
13%
12%
12%
10%
8%
7%
5%
Economic Conditions—Overall Financial Health and Hiring ©SHRM 2014 43
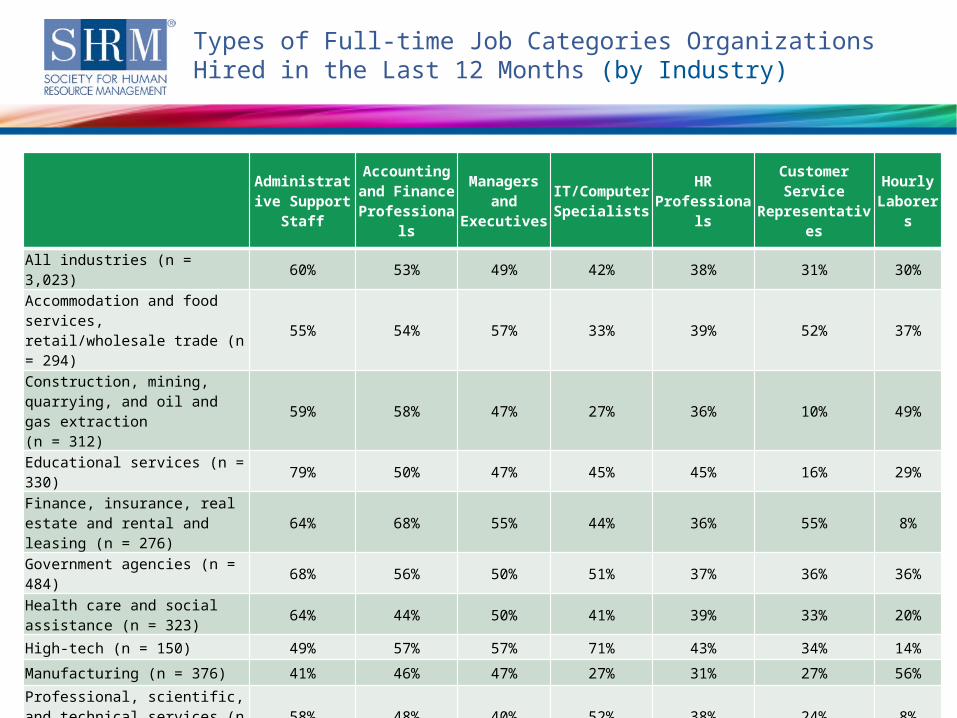
Types of Full-time Job Categories Organizations Hired in the Last 12 Months (by Industry)
Note: Respondents who answered “don't know” were excluded from this analysis. Percentages do not equal 100% due to multiple response options. Only respondents whose organizations were hiring full-time staff were asked this question.
Administrative Support
Staff
Accounting and
Finance Professiona
ls
Managers and
Executives
IT/Computer Specialists
HR Professiona
ls
Customer Service
Representatives
Hourly Laborer
s
All industries (n = 3,023) 60% 53% 49% 42% 38% 31% 30%Accommodation and food services, retail/wholesale trade (n = 294)
55% 54% 57% 33% 39% 52% 37%
Construction, mining, quarrying, and oil and gas extraction (n = 312)
59% 58% 47% 27% 36% 10% 49%
Educational services (n = 330)
79% 50% 47% 45% 45% 16% 29%
Finance, insurance, real estate and rental and leasing (n = 276)
64% 68% 55% 44% 36% 55% 8%
Government agencies (n = 484)
68% 56% 50% 51% 37% 36% 36%
Health care and social assistance (n = 323)
64% 44% 50% 41% 39% 33% 20%
High-tech (n = 150) 49% 57% 57% 71% 43% 34% 14%
Manufacturing (n = 376) 41% 46% 47% 27% 31% 27% 56%
Professional, scientific, and technical services (n = 398)
58% 48% 40% 52% 38% 24% 8%
Economic Conditions—Overall Financial Health and Hiring ©SHRM 2014 44
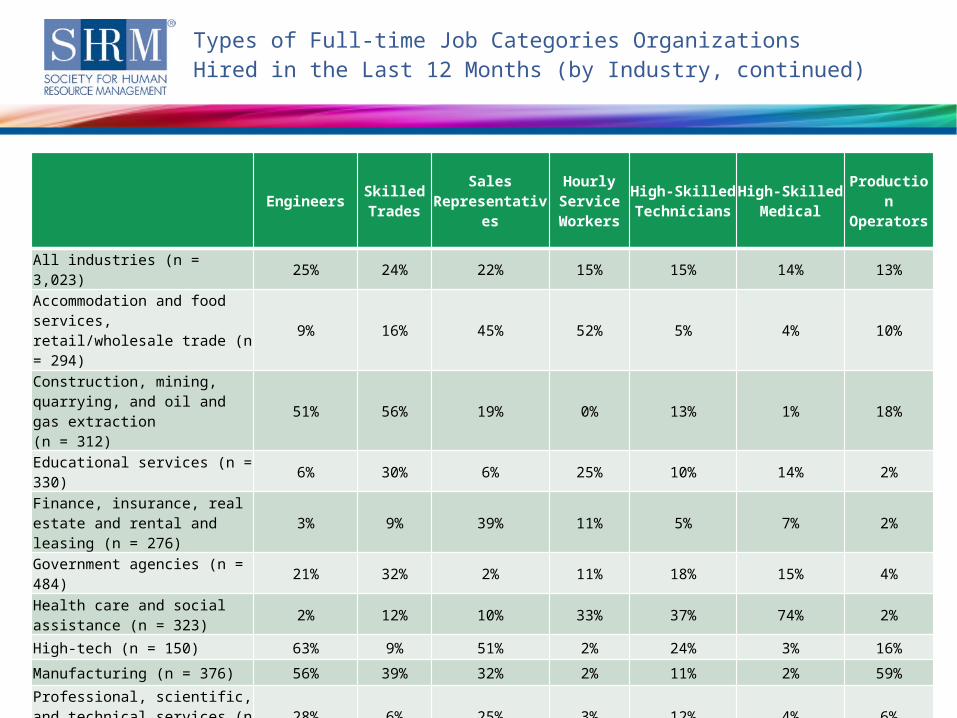
Types of Full-time Job Categories Organizations Hired in the Last 12 Months (by Industry, continued)
Note: Respondents who answered “don't know” were excluded from this analysis. Percentages do not equal 100% due to multiple response options. Only respondents whose organizations were hiring full-time staff were asked this question.
EngineersSkilled Trades
Sales Representati
ves
Hourly Service Workers
High-Skilled Technicians
High-Skilled Medical
Production
Operators
All industries (n = 3,023) 25% 24% 22% 15% 15% 14% 13%Accommodation and food services, retail/wholesale trade (n = 294)
9% 16% 45% 52% 5% 4% 10%
Construction, mining, quarrying, and oil and gas extraction (n = 312)
51% 56% 19% 0% 13% 1% 18%
Educational services (n = 330)
6% 30% 6% 25% 10% 14% 2%
Finance, insurance, real estate and rental and leasing (n = 276)
3% 9% 39% 11% 5% 7% 2%
Government agencies (n = 484)
21% 32% 2% 11% 18% 15% 4%
Health care and social assistance (n = 323)
2% 12% 10% 33% 37% 74% 2%
High-tech (n = 150) 63% 9% 51% 2% 24% 3% 16%
Manufacturing (n = 376) 56% 39% 32% 2% 11% 2% 59%
Professional, scientific, and technical services (n = 398)
28% 6% 25% 3% 12% 4% 6%

Economic Conditions—Overall Financial Health and Hiring ©SHRM 2014 45
Types of Full-time Job Categories Organizations Hired in the Last 12 Months (by Industry, continued)
Note: Respondents who answered “don't know” were excluded from this analysis. Percentages do not equal 100% due to multiple response options. Only respondents whose organizations were hiring full-time staff were asked this question.
DriversEducator
s
Community and Social
Service Workers
Lawyers, Judges and
Legal Support Workers
Protective Service Workers
Scientists Other
All industries (n = 3,023) 13% 12% 12% 10% 8% 7% 5%Accommodation and food services, retail/wholesale trade (n = 294)
28% 2% 1% 5% 1% 1% 2%
Construction, mining, quarrying, and oil and gas extraction (n = 312)
17% 0% 0% 6% 2% 6% 6%
Educational services (n = 330)
12% 83% 22% 5% 12% 9% 4%
Finance, insurance, real estate and rental and leasing (n = 276)
1% 0% 2% 12% 0% 0% 6%
Government agencies (n = 484)
19% 12% 27% 17% 35% 6% 6%
Health care and social assistance (n = 323)
14% 9% 46% 4% 6% 2% 5%
High-tech (n = 150) 3% 3% 1% 17% 1% 15% 0%
Manufacturing (n = 376) 10% 0% 0% 5% 1% 10% 4%
Professional, scientific, and technical services (n = 398)
3% 1% 1% 17% 1% 16% 10%

Economic Conditions—Overall Financial Health and Hiring ©SHRM 2014 46
Demographics

Economic Conditions—Overall Financial Health and Hiring ©SHRM 2014 47
Demographics: Organization Industry
Note: n = 3,335. Percentages do not equal 100% due to rounding.
Percentage
Accommodation and food services, retail/wholesale trade 10%
Construction, mining, quarrying, and oil and gas extraction 10%
Educational services 11%
Finance, insurance, real estate and rental and leasing 9%
Government agencies 16%
Health care and social assistance 10%
High-tech 5%
Manufacturing 12%
Professional, scientific, and technical services 14%
Other industry 3%

Economic Conditions—Overall Financial Health and Hiring ©SHRM 2014 48
Demographics: Organization Sector (All Industries)
n = 3,335
Publicly owned for-profit
Government
Privately owned for-profit
Nonprofit
45%
20%
20%
15%

Economic Conditions—Overall Financial Health and Hiring ©SHRM 2014 49
Demographics: Organization Sector (by Industry)
Note: Percentages may not equal 100% due to rounding.
Privately Owned
For-ProfitGovernment
Publicly Owned
For-ProfitNonprofit
All industries (n = 3,335) 45% 20% 20% 15%
Accommodation and food services, retail/wholesale trade (n = 330)
63% 0% 36% 2%
Construction, mining, quarrying, and oil and gas extraction (n = 336)
71% 0% 28% 1%
Educational services (n = 367) 9% 39% 4% 48%
Finance, insurance, real estate and rental and leasing (n = 307)
56% 0% 24% 19%
Government agencies (n = 537) 0% 100% 0% 0%
Health care and social assistance (n = 349)
32% 0% 9% 59%
High-tech (n = 156) 54% 0% 44% 2%
Manufacturing (n = 404) 63% 0% 36% 1%
Professional, scientific, and technical services (n = 458)
76% 0% 19% 5%
Other industry (n = 91) 57% 0% 22% 21%
Economic Conditions—Overall Financial Health and Hiring ©SHRM 2014 50
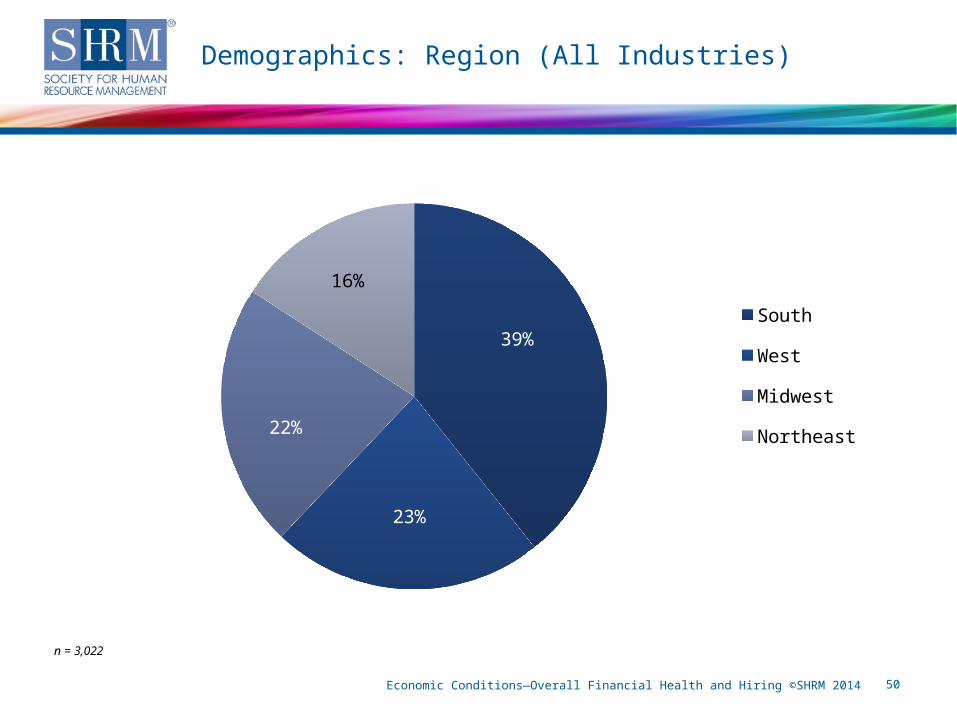
Demographics: Region (All Industries)
n = 3,022
39%
23%
22%
16%
South
West
Midwest
Northeast

Economic Conditions—Overall Financial Health and Hiring ©SHRM 2014 51
Demographics: Region (by Industry)
Note: Percentages may not equal 100% due to rounding.
South West Midwest Northeast
All industries (n = 3,022) 39% 23% 22% 16%
Accommodation and food services, retail/wholesale trade (n = 287)
37% 29% 20% 14%
Construction, mining, quarrying, and oil and gas extraction (n = 304)
44% 25% 18% 13%
Educational services (n = 330) 36% 18% 26% 20%
Finance, insurance, real estate and rental and leasing (n = 279)
33% 19% 25% 23%
Government agencies (n = 494) 48% 24% 21% 6%
Health care and social assistance (n = 323)
37% 22% 23% 18%
High-tech (n = 142) 30% 36% 12% 23%
Manufacturing (n = 365) 36% 16% 33% 16%
Professional, scientific, and technical services (n = 418)
42% 24% 17% 17%
Other industry (n = 80) 39% 23% 16% 23%
Economic Conditions—Overall Financial Health and Hiring ©SHRM 2014 52
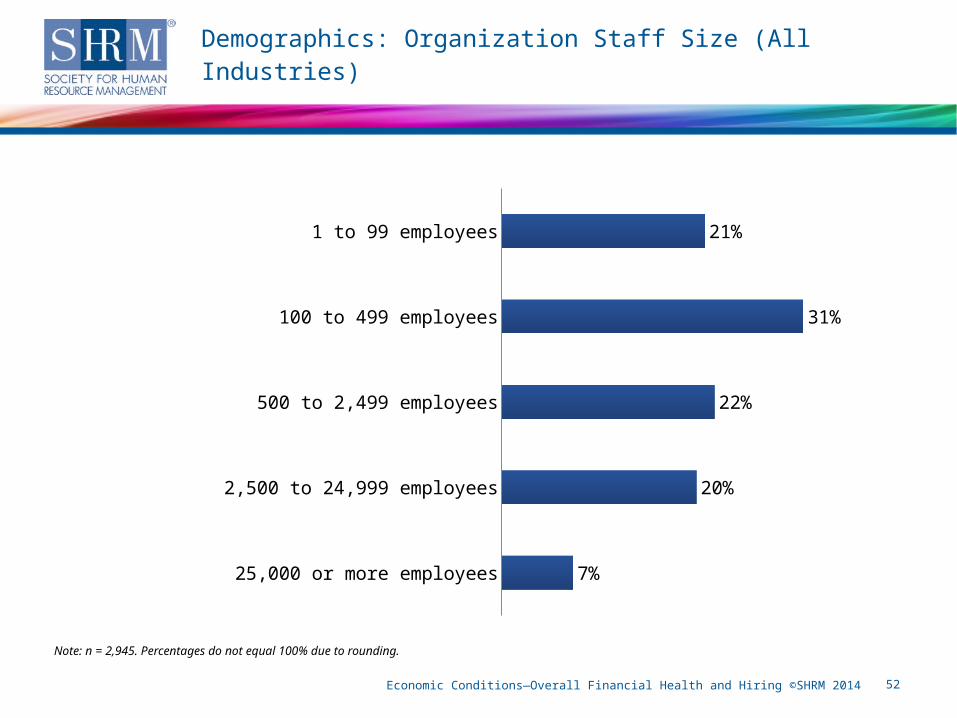
Demographics: Organization Staff Size (All Industries)
Note: n = 2,945. Percentages do not equal 100% due to rounding.
1 to 99 employees
100 to 499 employees
500 to 2,499 employees
2,500 to 24,999 employees
25,000 or more employees
21%
31%
22%
20%
7%
Economic Conditions—Overall Financial Health and Hiring ©SHRM 2014 53
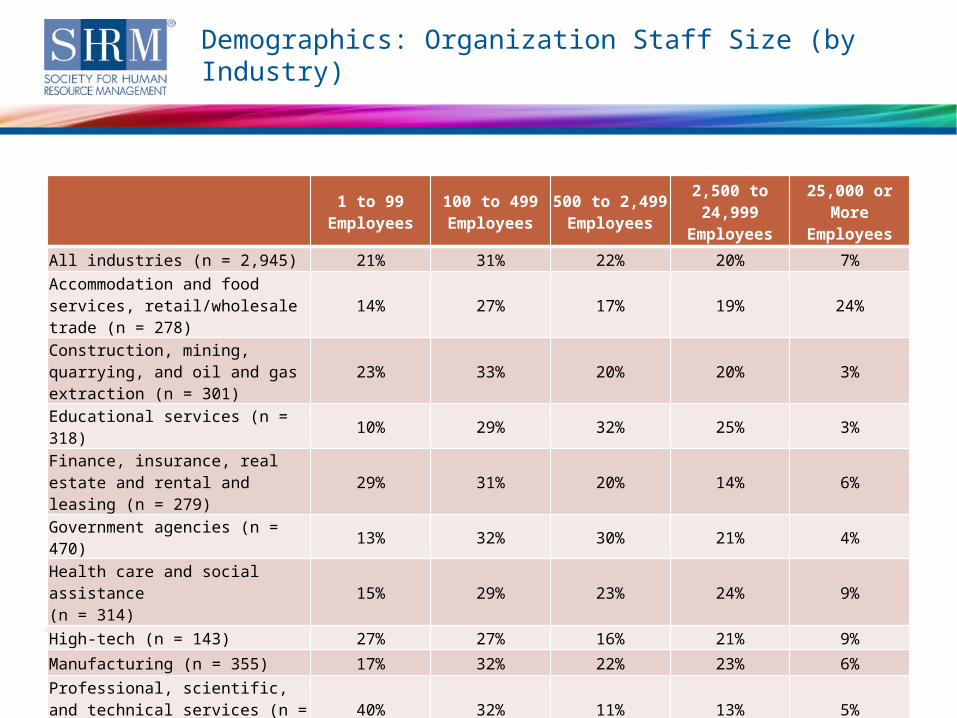
Demographics: Organization Staff Size (by Industry)
Note: Percentages may not equal 100% due to rounding.
1 to 99
Employees100 to 499 Employees
500 to 2,499 Employees
2,500 to 24,999
Employees
25,000 or More
Employees
All industries (n = 2,945) 21% 31% 22% 20% 7%Accommodation and food services, retail/wholesale trade (n = 278)
14% 27% 17% 19% 24%
Construction, mining, quarrying, and oil and gas extraction (n = 301)
23% 33% 20% 20% 3%
Educational services (n = 318) 10% 29% 32% 25% 3%
Finance, insurance, real estate and rental and leasing (n = 279)
29% 31% 20% 14% 6%
Government agencies (n = 470) 13% 32% 30% 21% 4%
Health care and social assistance (n = 314)
15% 29% 23% 24% 9%
High-tech (n = 143) 27% 27% 16% 21% 9%
Manufacturing (n = 355) 17% 32% 22% 23% 6%
Professional, scientific, and technical services (n = 409)
40% 32% 11% 13% 5%
Other industry (n = 78) 23% 36% 17% 17% 8%

Economic Conditions—Overall Financial Health and Hiring ©SHRM 2014 54
n = 3,092
Demographics: Other (All Industries)
U.S.-based operations only 71%
Multinational operations 29%
Single-unit organization: An organization in which the location and the organization are one and the same.
31%
Multi-unit organization: An organization that has more than one location.
69%
Multi-unit headquarters determines HR policies and practices
48%
Each work location determines HR policies and practices
3%
A combination of both the work location and the multi-unit headquarters determines HR policies and practices
49%
Is your organization a single-unit organization or a multi-unit organization?
For multi-unit organizations, are HR policies and practices determined by the multi-unit headquarters, by each work location or by both?
Does your organization have U.S.-based operations (business units) only, or does it operate multinationally?
n = 3,116
n = 2,223

Economic Conditions—Overall Financial Health and Hiring ©SHRM 2014 55
SHRM Survey Findings
• Response rate = 13%• 3,335 HR professionals participated in this survey from a randomly selected sample of
SHRM’s membership from nine different industries:» Accommodation and food services, retail/wholesale trade.» Construction, mining, quarrying, and oil and gas extraction.» Educational services.» Finance, insurance, real estate and rental and leasing.» Government agencies.» Health care and social assistance.» High-tech.» Manufacturing.» Professional, scientific, and technical services.
• Margin of error +/-2%• Survey fielded December 16, 2013 - January 16, 2014
Survey Methodology

Economic Conditions—Overall Financial Health and Hiring ©SHRM 2014 56
• SHRM Leading Indicators of National Employment (LINE)» http://www.shrm.org/research/monthlyemploymentindices/line/pages/default.aspx
• SHRM Jobs Outlook Survey (JOS)» http://www.shrm.org/research/monthlyemploymentindices/lmo/pages/default.aspx
• SHRM Metro Economic Outlooks» http://www.shrm.org/research/monthlyemploymentindices/pages/metroeconomicou
tlooks.aspx
• SHRM’s Workforce Readiness Resource Page» http://www.shrm.org/hrdisciplines/staffingmanagement/articles/pages/workforcerea
diness.aspx
• SHRM Foundation: What’s Next: Future Global Trends Affecting Your Organization, Evolution of Work and the Worker
» http://www.shrm.org/about/foundation/shapingthefuture/documents/2-14%20theme%201%20paper-final%20for%20web.pdf
Additional SHRM Resources
57
For more survey/poll findings, visit shrm.org/surveys
For more information about SHRM’s Customized Research Services, visit shrm.org/customizedresearch
Follow us on Twitter @SHRM_Research
Economic Conditions—Overall Financial Health and Hiring ©SHRM 2014
About SHRM Research
Project lead:Tanya Mulvey, researcher, SHRM Research
Project contributors:Alexander Alonso, Ph.D., SPHR, vice president, SHRM ResearchEvren Esen, director, Survey Programs, SHRM ResearchYan Dong, Survey Research Center, SHRM ResearchChristina Lee, researcher, SHRM ResearchQikun Niu, intern, SHRM ResearchJennifer Schramm, manager, Workplace Trends and Forecasting, SHRM ResearchJoseph Coombs, senior analyst, Workforce Trends, SHRM Research
Copy editor:Katya Scanlan, SHRM Knowledge Center
Economic Conditions—Overall Financial Health and Hiring ©SHRM 2014 58
Founded in 1948, the Society for Human Resource Management (SHRM) is the world’s largest HR membership organization devoted to human resource management. Representing more than 275,000 members in over 160 countries, the Society is the leading provider of resources to serve the needs of HR professionals and advance the professional practice of human resource management. SHRM has more than 575 affiliated chapters within the United States and subsidiary offices in China, India and United Arab Emirates. Visit us at shrm.org.
About SHRM