![INDEX [enviscecb.org]enviscecb.org/223/English.pdf · M/s. Shree Cement Ltd. 1 1.0 PROJECT DESCRIPTION 1.1 Introduction Shree Cement Limited (SCL) is the largest producer of cement](https://static.fdocuments.net/doc/165x107/5e781cc7ba951d34db1de7e9/index-ms-shree-cement-ltd-1-10-project-description-11-introduction-shree.jpg)
Shree Cement Ltd - Q4FY11_Result Update
3
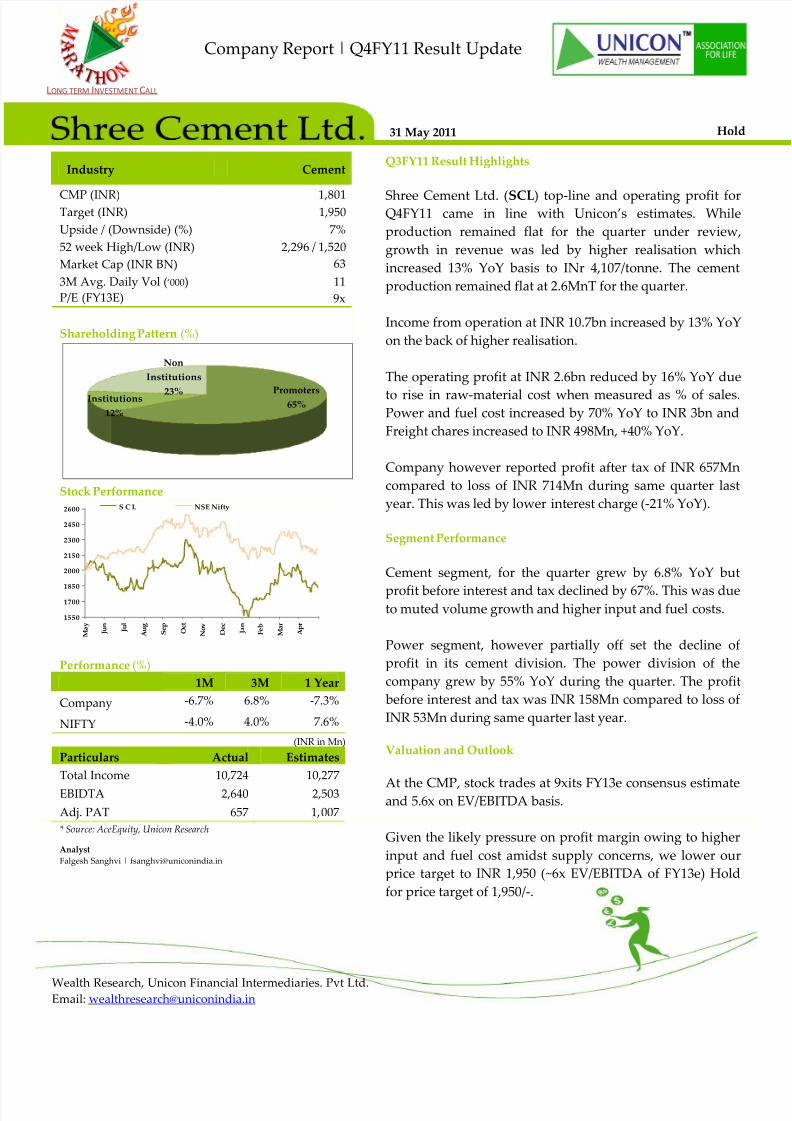
Wealth Research, Unicon Financial Intermediaries. Pvt Ltd. Email: [email protected] LONG TERM INVESTMENT CALL Hold 31 May 2011 Company Report | Q4FY11 Result Update Q3FY11 Result Highlights Shree Cement Ltd. (SCL) top-line and operating profit for Q4FY11 came in line with Unicon’s estimates. While production remained flat for the quarter under review, growth in revenue was led by higher realisation which increased 13% YoY basis to INr 4,107/tonne. The cement production remained flat at 2.6MnT for the quarter. Income from operation at INR 10.7bn increased by 13% YoY on the back of higher realisation. The operating profit at INR 2.6bn reduced by 16% YoY due to rise in raw-material cost when measured as % of sales. Power and fuel cost increased by 70% YoY to INR 3bn and Freight chares increased to INR 498Mn, +40% YoY. Company however reported profit after tax of INR 657Mn compared to loss of INR 714Mn during same quarter last year. This was led by lower interest charge (-21% YoY). Segment Performance Cement segment, for the quarter grew by 6.8% YoY but profit before interest and tax declined by 67%. This was due to muted volume growth and higher input and fuel costs. Power segment, however partially off set the decline of profit in its cement division. The power division of the company grew by 55% YoY during the quarter. The profit before interest and tax was INR 158Mn compared to loss of INR 53Mn during same quarter last year. Valuation and Outlook At the CMP, stock trades at 9xits FY13e consensus estimate and 5.6x on EV/EBITDA basis. Given the likely pressure on profit margin owing to higher input and fuel cost amidst supply concerns, we lower our price target to INR 1,950 (~6x EV/EBITDA of FY13e) Hold for price target of 1,950/-. Industry Cement CMP (INR) 1,801 Target (INR) 1,950 Upside / (Downside) (%) 7% 52 week High/Low (INR) 2,296 / 1,520 Market Cap (INR BN) 63 3M Avg. Daily Vol (‘000) 11 P/E (FY13E) 9x Shareholding Pattern (%) Non Institutions 23% Institutions 12% Promoters 65% Stock Performance 1550 1700 1850 2000 2150 2300 2450 2600 M a y J u n J u l A u g S e p O c t N o v D e c J a n F e b M a r A p r S C L NSE Nifty Performance (%) 1M 3M 1 Year Company -6.7% 6.8% -7.3% NIFTY -4.0% 4.0% 7.6% (INR in Mn) Particulars Actual Estimates Total Income 10,724 10,277 EBIDTA 2,640 2,503 Adj. PAT 657 1, 007 * Source: AceEquity, Unicon Research Analyst Falgesh Sanghvi | [email protected]
-
Upload
seema-gusain -
Category
Documents
-
view
227 -
download
0
Transcript of Shree Cement Ltd - Q4FY11_Result Update
8/6/2019 Shree Cement Ltd - Q4FY11_Result Update
http://slidepdf.com/reader/full/shree-cement-ltd-q4fy11result-update 1/3

8/6/2019 Shree Cement Ltd - Q4FY11_Result Update
http://slidepdf.com/reader/full/shree-cement-ltd-q4fy11result-update 2/3
Wealth Research, Unicon Financial Intermediaries. Pvt Ltd.Email: [email protected]
Financials (INR in mn)
Particulars Q4FY11 Q4FY10 YoY FY11 FY10 YoY (%)
Income from Operation 10,724 9,451 13.5 35,141 36,432 (3.5)Operating Exp. 8,085 6,297 28.4 26,747 21,494 24.4
Change in Stock (175) (29) (336) (197)
RM Consumption 1,121 842 16.3 3,723 3,238 11.4
% of Sales 8.82 8.61 21 bps 0 bps
Purchase of Traded Goods 15 22 (33.7) 625 92 580.7
% of Sales 0.1 0.2 -10 bps 0 bps
Staff Costs 537 499 7.6 1,985 1,586 25.2
% of Sales 5.0 5.3 -27 bps 0 bps
Power and Fuel 3,020 1,779 69.8 9,123 6,105 49.4
% of Sales 28.2 18.8 934 bps 0 bps
Freight on Inter-unit Clinker
Trf.
498 355 40.4 1,610 1,327 21.3
% of Sales 4.6 3.8 89 bps 0 bpsFreight & Selling Exp 1,815 1,911 (5.0) 6,141 6,298 (2.5)
% of Sales 16.9 20.2 -329 bps 0 bps
Other Expenses 912 807 13.0 3,390 2,847 19.1
% of Sales 8.5 8.5 -3 bps 0 bps
Assets Cons. & Prem. W. OFF 343 112 206.1 485 198 145.4
% of Sales 3.2 1.2 201 bps 0 bps
EBITDA 2,640 3,154 (16.3) 8,394 14,939 (43.8)
EBITDA (%) 24.6 33.4 -876 bps 0 bps
Depreciation 2,650 2,786 (4.9) 6,758 5,704 18.5
EBIT (10) 368 (102.8) 1,637 9,234 (82.3)
EBIT (%) (0.1) 3.9 -399 bps 0 bps
Interest (Net) 519 662 (21.6) 1,753 1,291 35.8
Other Income 186 201 (7.8) 1,220 1,172 4.1
Statutory Liab. (Exceptional) - (437) - (437)
PBT (344) (529) (35.0) 1,103 8,679 (87.3)
Tax Provision (1,001) 185 (994) 1,918
PAT 657 (714) 2,097 6,761
PAT (%) 6 (8) 6 19Source: Company, Unicon Research
8/6/2019 Shree Cement Ltd - Q4FY11_Result Update
http://slidepdf.com/reader/full/shree-cement-ltd-q4fy11result-update 3/3
Wealth Research, Unicon Financial Intermediaries. Pvt Ltd.Email: [email protected]
Unicon Investment Ranking Methodology
Rating Buy Accumulate Hold Reduce Sell
Return Range >= 20% 10% to 20% -10% to 10% -10% to -20% <= -20%
Disclaimer
This document has been issued by Unicon Financial Intermediaries Pvt. Ltd. (“UNICON”) for the information of its customers only. UNICON is governed by
the Securities and Exchange Board of India. This document is not for public distribution and has been furnished to you solely for your information and must
not be reproduced or redistributed to any other person. Persons into whose possession this document may come are required to observe these restrictions. The
information and opinions contained herein have been compiled or arrived at based upon information obtained in good faith from public sources believed to
be reliable. Such information has not been independently verified and no guarantee, representation or warranty, express or implied is made as to its accuracy,
completeness or correctness. All such information and opinions are subject to change without notice. This document has been produced independently of any
company or companies mentioned herein, and forward looking statements; opinions and expectations contained herein are subject to change without notice.
This document is for information purposes only and is provided on an “as is” basis. Descriptions of any company or companies or their securities mentioned
herein are not intended to be complete and this document is not, and should not be construed as an offer, or solicitation of an offer, to buy or sell or subscribe
to any securities or other financial instruments. We are not soliciting any action based on this document. UNICON, its associate and group companies its
directors or employees do not take any responsibility, financial or otherwise, of the losses or the damages sustained due to the investments made or any action
taken on basis of this document, including but not restricted to, fluctuation in the prices of the shares and bonds, reduction in the dividend or income, etc.
This document is not directed to or intended for display, downloading, printing, reproducing or for distribution to or use by any person or entity who is a
citizen or resident or located in any locality, state, country or other jurisdiction where such distribution, publication, reproduction, availability or use would
be contrary to law or regulation or would subject UNICON or its associates or group companies to any registration or licensing requirement within such
jurisdiction. If this document is inadvertently sent or has reached any individual in such country, the same may be ignored and brought to the attention of the
sender. This document may not be reproduced, distributed or published for any purpose without prior written approval of UNICON. This document is for
the general information and does not take into account the particular investment objectives, financial situation or needs of any individual customer, and it
does not constitute a personalised recommendation of any particular security or investment strategy. Before acting on any advice or recommendation in thisdocument, a customer should consider whether it is suitable given the customer’s particular circumstances and, if necessary, seek professional advice. Certain
transactions, including those involving futures, options, and high yield securities, give r ise to substantial risk and are not suitable for all investors. UNICON,
its associates or group companies do not represent or endorse the accuracy or reliability of any of the information or content of the document and reliance
upon it is at your own risk.
UNICON, its associates or group companies, expressly disclaims any and all warranties, express or implied, including without limitation warranties of
merchantability and fitness for a particular purpose with respect to the document and any information in it. UNICON, its associates or group companies, shall
not be liable for any direct, indirect, incidental, punitive or consequential damages of any kind with respect to the document. No part of this publication may
be reproduced, stored in a retrieval system, or transmitted, on any form or by any means, electronic, mechanical, photocopying, recording, or otherwise,
without the prior written permission of Unicon Financial Intermediaries Pvt. Ltd.
Address:
Wealth Management
Unicon Financial Intermediaries. Pvt. Ltd.
VILCO Centre, A-Wing, 3rd Floor, Opp. Garware House, 8 Subhash Road,
Vile Parle (E), Mumbai – 400 057
Ph: 022-3390 1234Email: [email protected]
Visit us at www.uniconindia.in