SHREE CEMENT LIMITED Cement Presentation Jun 2010.… · India was growing at about 7% and the...
39
1 June 2010 SHREE CEMENT LIMITED
Transcript of SHREE CEMENT LIMITED Cement Presentation Jun 2010.… · India was growing at about 7% and the...
1
June 2010
SHREE CEMENT LIMITED

2
Indian Cement Industry
3
Overview
� India was growing at about 7% and the national policy makers are
targeting GDP growth at 8-9%. Such high GDP growth should translate
into cement demand growth rate of double digits annually
� Government of India has fixed an infrastructure spend target of 10% of
GDP which translates to around USD 300 billion annually
� The basic needs of the urban populace is almost satiated. Savings are
flowing into housing and related amenities.
� The social benefit schemes like National Rural Employment Guarantee
Act is also making the development process an inclusive one cascading
into overall prosperity
� Cement demand is at an inflexion point today in India
4
Economic Super Cycle
� As per McKinsey Global Institute, April 2010, the key drivers of India’s
urbanization till 2030 are:
� GDP will grow by 5 times from present
� 590 million people will live in cities (twice the population of
present US)
� 270 million people net increase in working age population
� 70% of net new employment will be generated in cities
� 91 million urban households will be middle class, up from 22 million
today
� 68 cities will have population of 1 million plus, up from 42 today
� 700-900 million square meters of commercial & residential space needs
to be built
� 7,400 kilometers of metros and subways will need to be constructed
(20 times the capacity added in past decade)
5
Economic Super Cycle
� In 2008-09 the Indian Cement industry growth was at around 8%
and the housing infrastructure boon has increased it to around
11% for the year ended March 31, 2010
� The cement demand over last decade has grown at 1.2 to 1.3x
GDP growth rate
� Urbanization is increasing and urban population is set to grow
� The infrastructure boom coupled with faster urbanization
should increase GDP to cement CAGR to 1.4 to 1.5x
� The cement demand for next 5 years is expected to grow
between 11-12% CAGR
6
New Capacities under Implementation
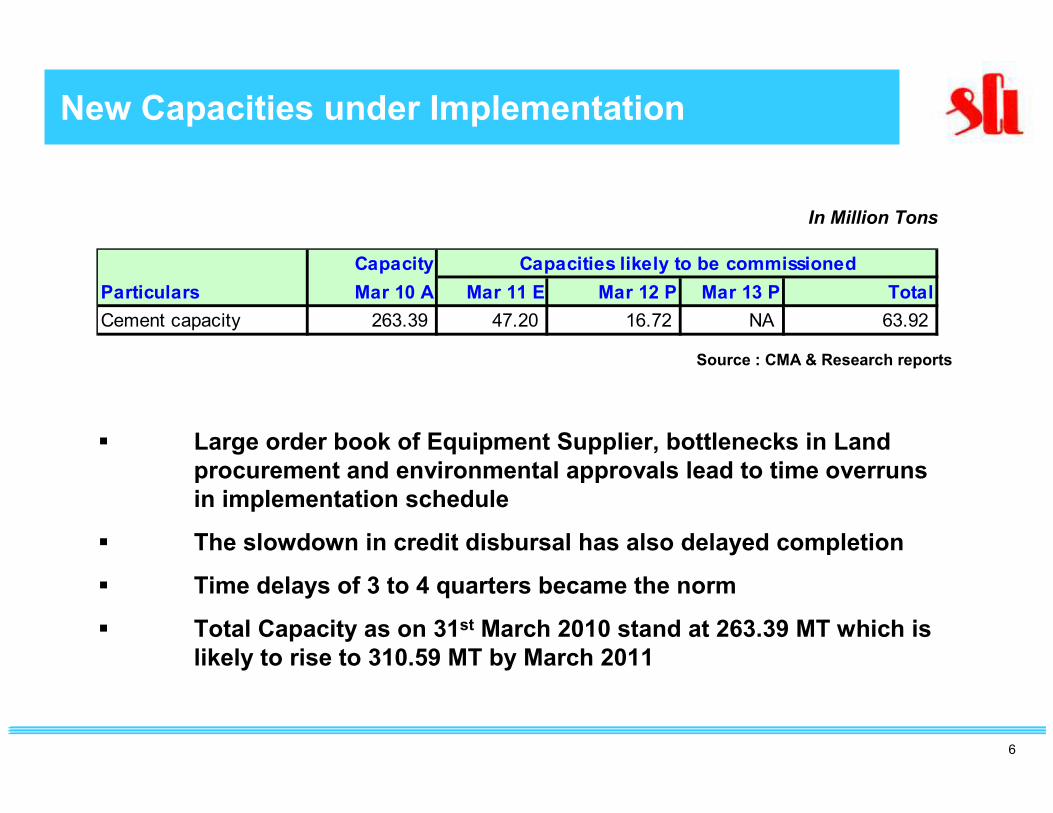
� Large order book of Equipment Supplier, bottlenecks in Land
procurement and environmental approvals lead to time overruns
in implementation schedule
� The slowdown in credit disbursal has also delayed completion
� Time delays of 3 to 4 quarters became the norm
� Total Capacity as on 31st March 2010 stand at 263.39 MT which is
likely to rise to 310.59 MT by March 2011
In Million Tons
Capacity
Particulars Mar 10 A Mar 11 E Mar 12 P Mar 13 P Total
Cement capacity 263.39 47.20 16.72 NA 63.92
Capacities likely to be commissioned
Source : CMA & Research reports
7
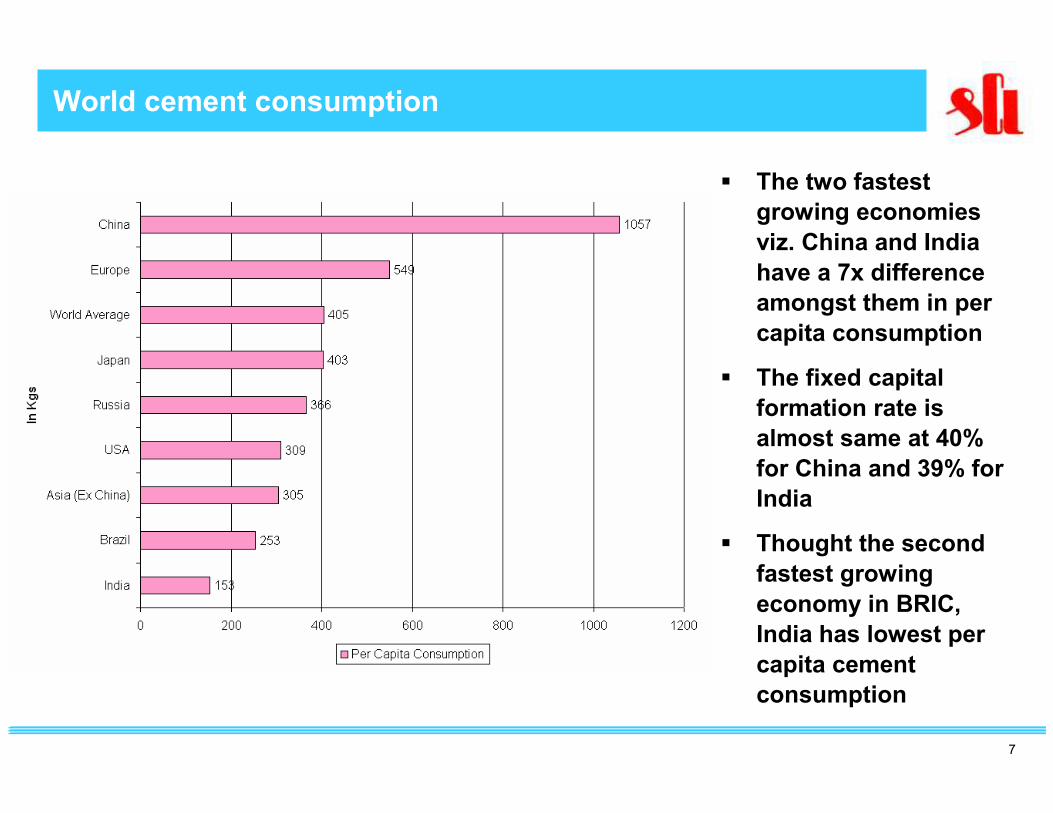
World cement consumption
Sorce : Indepensdent Economic survey reports
� The two fastest
growing economies
viz. China and India
have a 7x difference
amongst them in per
capita consumption
� The fixed capital
formation rate is
almost same at 40%
for China and 39% for
India
� Thought the second
fastest growing
economy in BRIC,
India has lowest per
capita cement
consumption
8
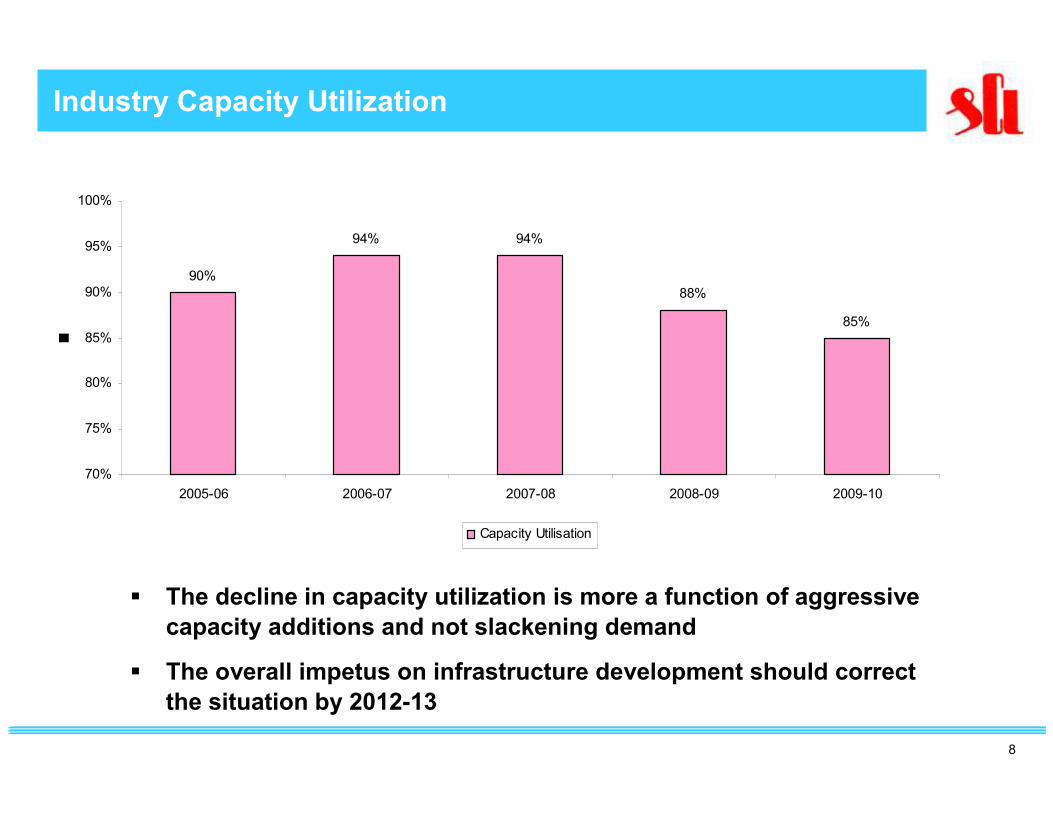
Industry Capacity Utilization
90%
94% 94%
88%
85%
70%
75%
80%
85%
90%
95%
100%
2005-06 2006-07 2007-08 2008-09 2009-10
Capacity Utilisation
� The decline in capacity utilization is more a function of aggressive
capacity additions and not slackening demand
� The overall impetus on infrastructure development should correct
the situation by 2012-13
9
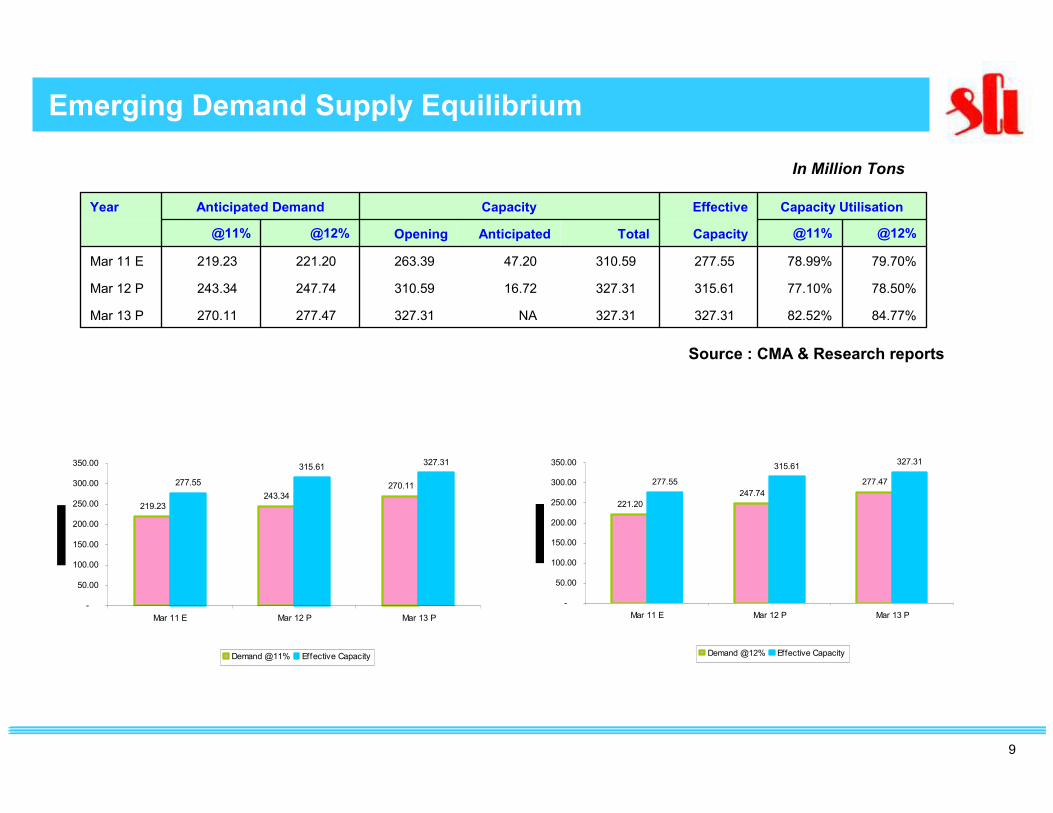
Emerging Demand Supply Equilibrium
In Million Tons
Source : CMA & Research reports
84.77%82.52%327.31 327.31 NA 327.31 277.47 270.11 Mar 13 P
78.50%77.10%315.61 327.31 16.72 310.59 247.74 243.34 Mar 12 P
79.70%78.99%277.55 310.59 47.20 263.39 221.20 219.23 Mar 11 E
@12%@11%CapacityTotalAnticipatedOpening@12%@11%
Capacity UtilisationEffective CapacityAnticipated DemandYear
221.20
247.74
277.47277.55
315.61327.31
-
50.00
100.00
150.00
200.00
250.00
300.00
350.00
Mar 11 E Mar 12 P Mar 13 P
Demand @12% Effective Capacity
219.23
243.34
270.11277.55
315.61327.31
-
50.00
100.00
150.00
200.00
250.00
300.00
350.00
Mar 11 E Mar 12 P Mar 13 P
Demand @11% Effective Capacity
10
Emerging Demand Supply Equilibrium
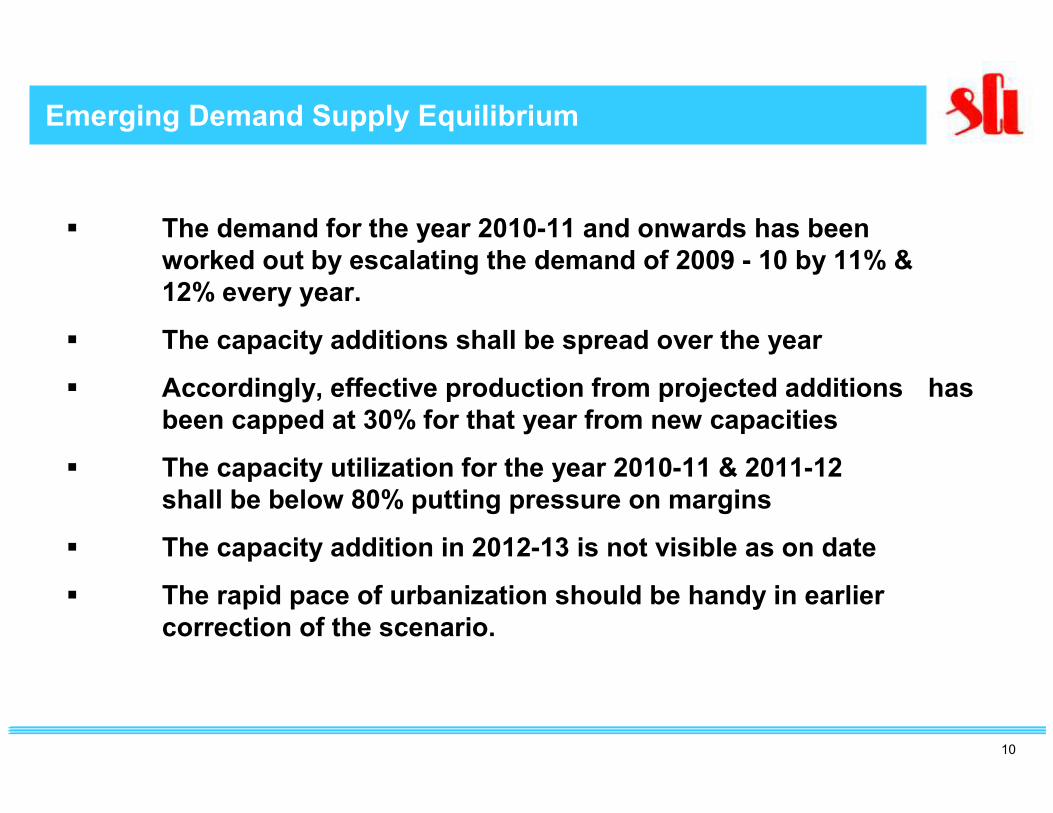
� The demand for the year 2010-11 and onwards has been
worked out by escalating the demand of 2009 - 10 by 11% &
12% every year.
� The capacity additions shall be spread over the year
� Accordingly, effective production from projected additions has
been capped at 30% for that year from new capacities
� The capacity utilization for the year 2010-11 & 2011-12
shall be below 80% putting pressure on margins
� The capacity addition in 2012-13 is not visible as on date
� The rapid pace of urbanization should be handy in earlier
correction of the scenario.
11
Shree Cement Limited
12
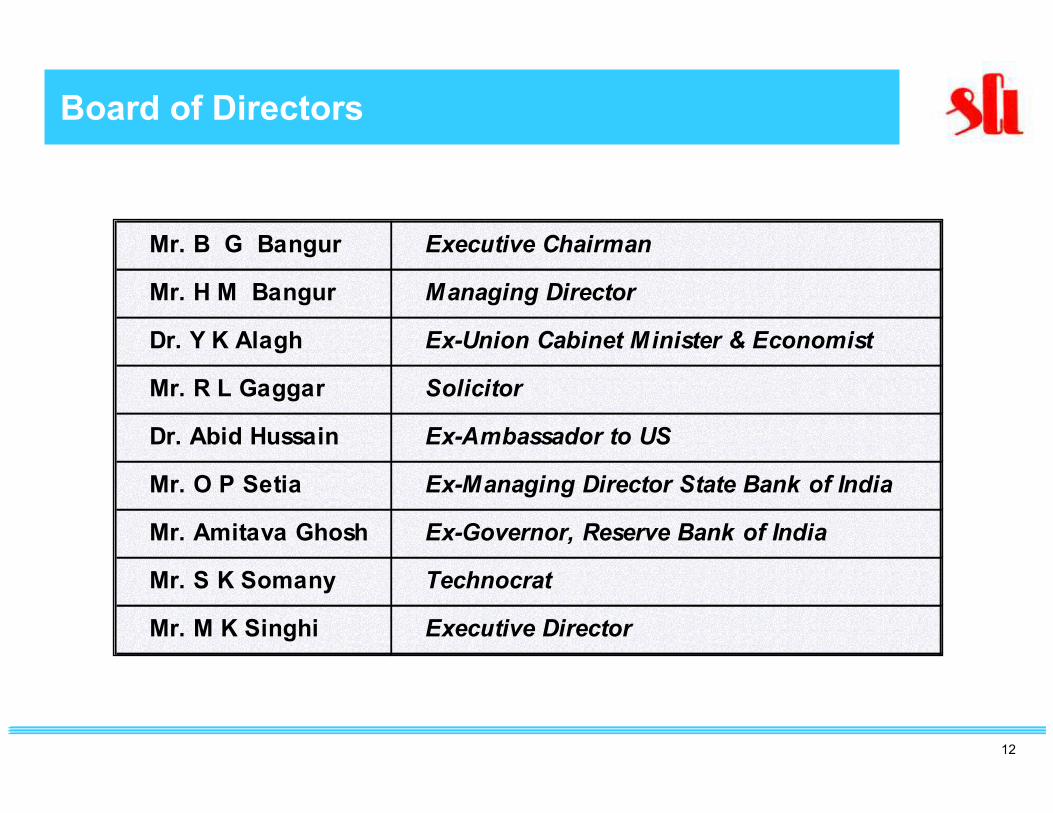
Mr. B G Bangur Executive Chairman
Mr. H M Bangur Managing Director
Dr. Y K Alagh Ex-Union Cabinet Minister & Economist
Mr. R L Gaggar Solicitor
Dr. Abid Hussain Ex-Ambassador to US
Mr. O P Setia Ex-Managing Director State Bank of India
Mr. Amitava Ghosh Ex-Governor, Reserve Bank of India
Mr. S K Somany Technocrat
Mr. M K Singhi Executive Director
Shree – Professionally ManagedBoard of Directors
13
Shree - Awards & Recognition received in 2009-10
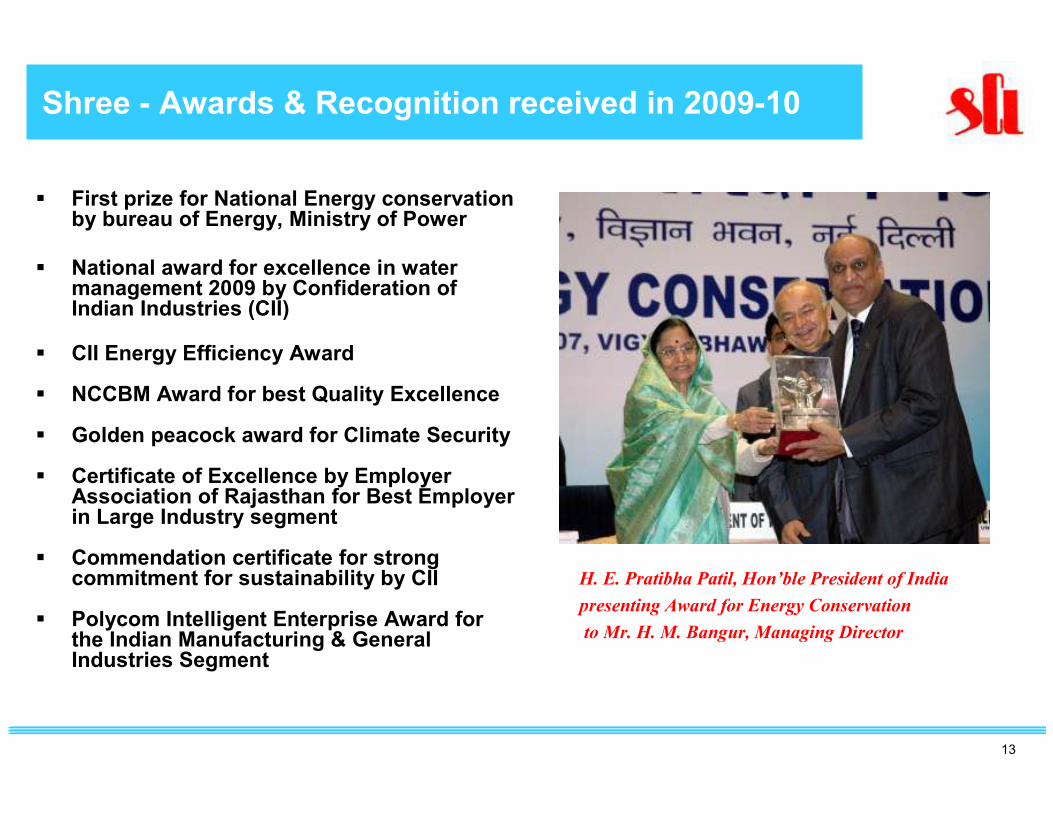
� First prize for National Energy conservation by bureau of Energy, Ministry of Power
� National award for excellence in water management 2009 by Confideration of Indian Industries (CII)
� CII Energy Efficiency Award
� NCCBM Award for best Quality Excellence
� Golden peacock award for Climate Security
� Certificate of Excellence by Employer Association of Rajasthan for Best Employer in Large Industry segment
� Commendation certificate for strong commitment for sustainability by CII
� Polycom Intelligent Enterprise Award for the Indian Manufacturing & General Industries Segment
H. E. Pratibha Patil, Hon’ble President of India
presenting Award for Energy Conservation
to Mr. H. M. Bangur, Managing Director
14
Shree - IRR to ShareholdersShree – International Accredition
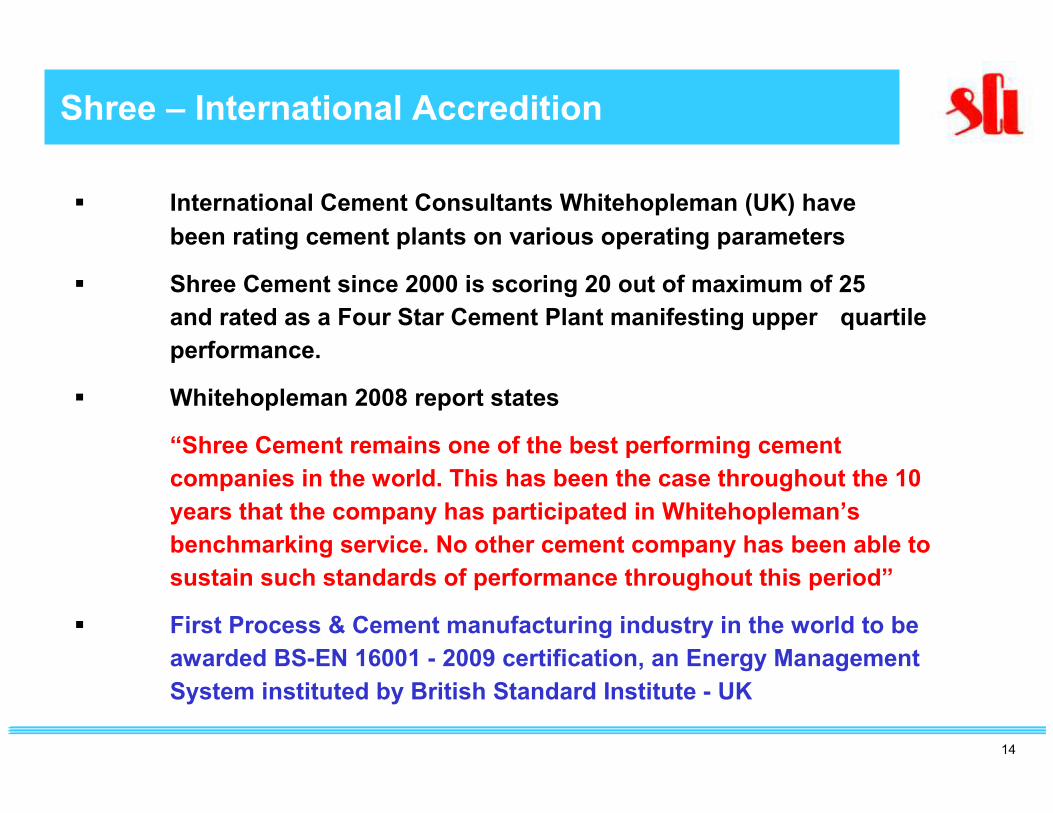
� International Cement Consultants Whitehopleman (UK) have
been rating cement plants on various operating parameters
� Shree Cement since 2000 is scoring 20 out of maximum of 25
and rated as a Four Star Cement Plant manifesting upper quartile
performance.
� Whitehopleman 2008 report states
“Shree Cement remains one of the best performing cement
companies in the world. This has been the case throughout the 10
years that the company has participated in Whitehopleman’s
benchmarking service. No other cement company has been able to
sustain such standards of performance throughout this period”
� First Process & Cement manufacturing industry in the world to be
awarded BS-EN 16001 - 2009 certification, an Energy Management
System instituted by British Standard Institute - UK
15
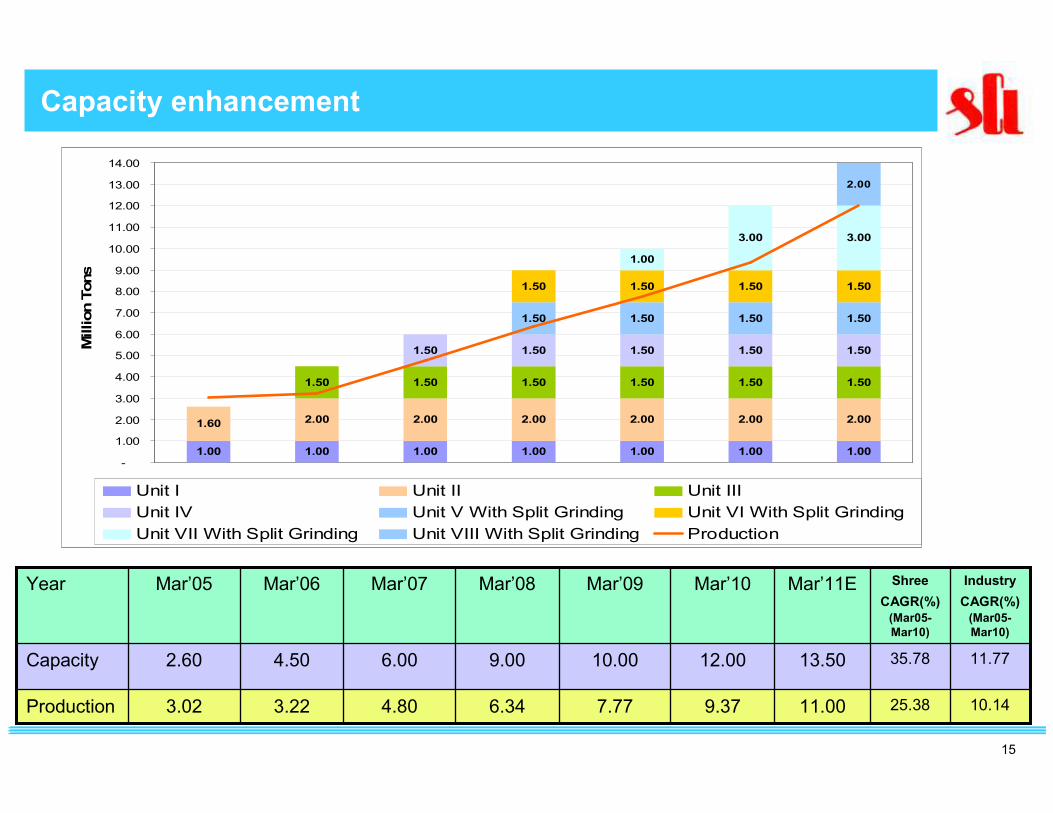
Capacity enhancement
25.38
35.78
Shree
CAGR(%)
(Mar05-
Mar10)
10.14
11.77
Industry
CAGR(%)
(Mar05-
Mar10)
3.02
2.60
Mar’05
3.22
4.50
Mar’06
4.80
6.00
Mar’07
6.34
9.00
Mar’08
7.77
10.00
Mar’09
9.37
12.00
Mar’10
11.00
13.50
Mar’11E
Production
Capacity
Year
1.00 1.00 1.00 1.00 1.00 1.00 1.00
1.60 2.00 2.00 2.00 2.00 2.00 2.00
1.50 1.50 1.50 1.50 1.50 1.50
1.50 1.50 1.50 1.50 1.50
1.50 1.50 1.50 1.50
1.50 1.50 1.50 1.50
1.00
3.00 3.00
2.00
-
1.00
2.00
3.00
4.00
5.00
6.00
7.00
8.00
9.00
10.00
11.00
12.00
13.00
14.00
Million Tons
Unit I Unit II Unit III
Unit IV Unit V With Split Grinding Unit VI With Split Grinding
Unit VII With Split Grinding Unit VIII With Split Grinding Production
16
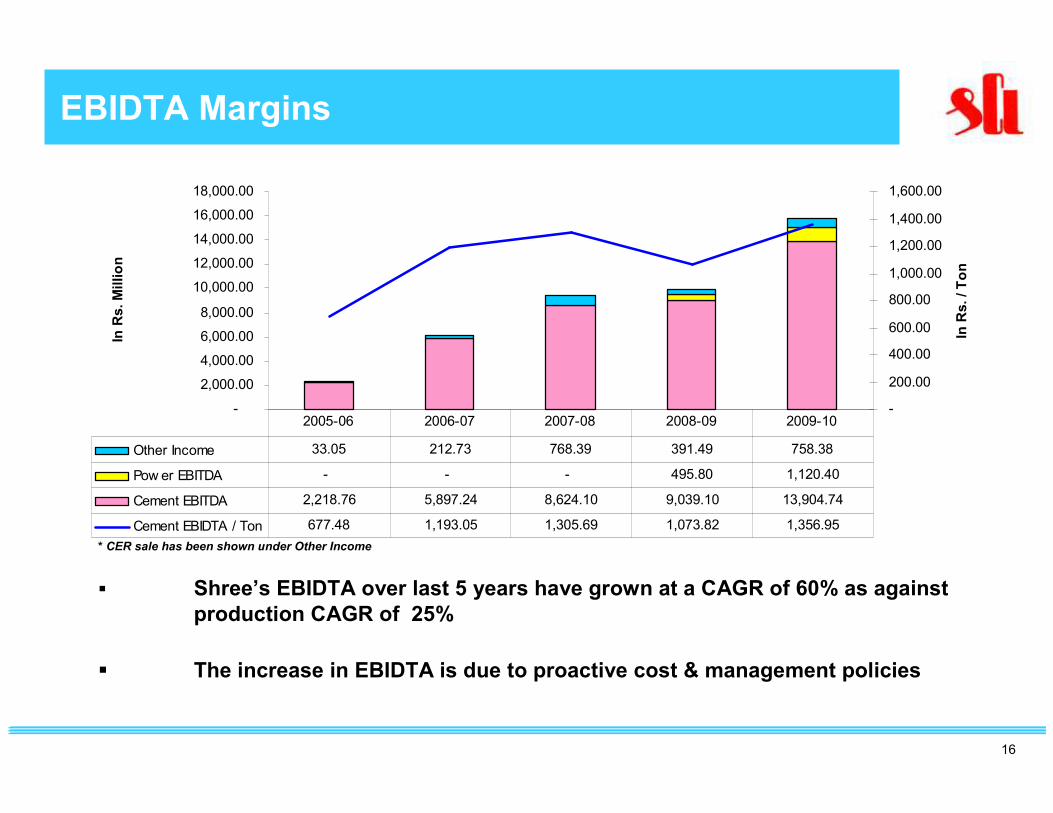
EBIDTA Margins
� Shree’s EBIDTA over last 5 years have grown at a CAGR of 60% as against
production CAGR of 25%
� The increase in EBIDTA is due to proactive cost & management policies
-
2,000.00
4,000.00
6,000.00
8,000.00
10,000.00
12,000.00
14,000.00
16,000.00
18,000.00
In Rs. Million
-
200.00
400.00
600.00
800.00
1,000.00
1,200.00
1,400.00
1,600.00
In Rs. / Ton
Other Income 33.05 212.73 768.39 391.49 758.38
Pow er EBITDA - - - 495.80 1,120.40
Cement EBITDA 2,218.76 5,897.24 8,624.10 9,039.10 13,904.74
Cement EBIDTA / Ton 677.48 1,193.05 1,305.69 1,073.82 1,356.95
2005-06 2006-07 2007-08 2008-09 2009-10
* CER sale has been shown under Other Income
17
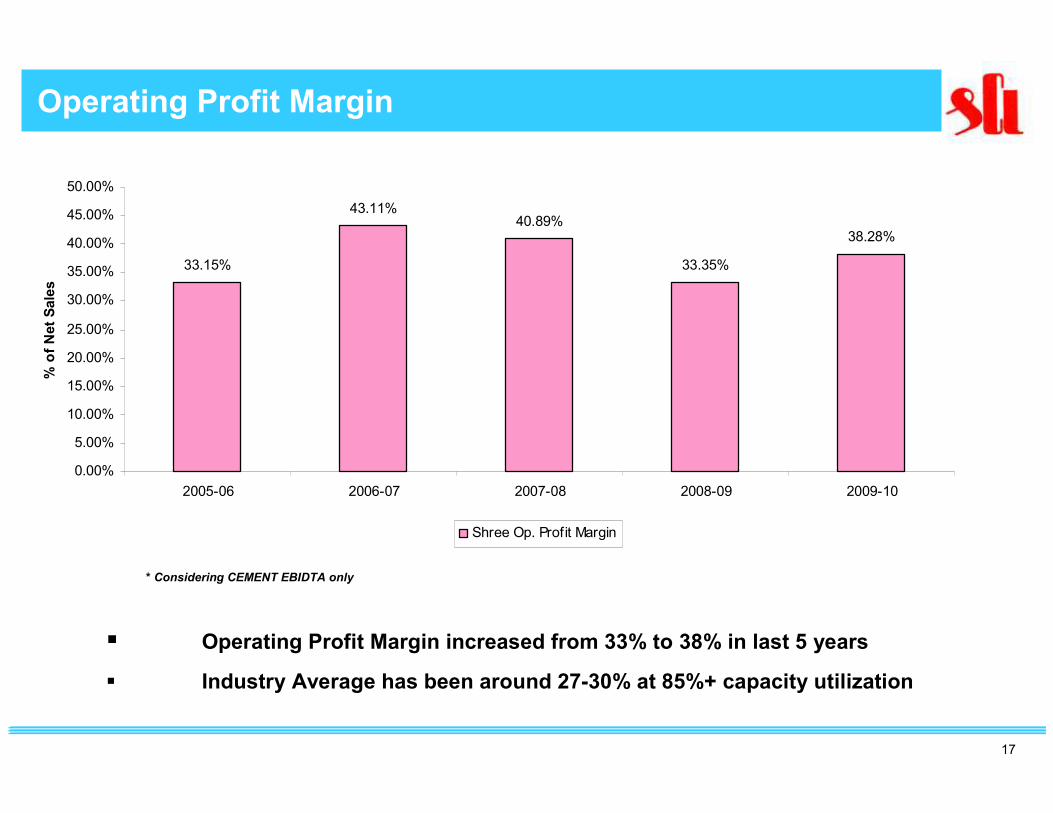
Operating Profit Margin
� Operating Profit Margin increased from 33% to 38% in last 5 years
� Industry Average has been around 27-30% at 85%+ capacity utilization
* Considering CEMENT EBIDTA only
33.15%
43.11%40.89%
33.35%
38.28%
0.00%
5.00%
10.00%
15.00%
20.00%
25.00%
30.00%
35.00%
40.00%
45.00%
50.00%
2005-06 2006-07 2007-08 2008-09 2009-10
% of Net Sales
Shree Op. Profit Margin
18
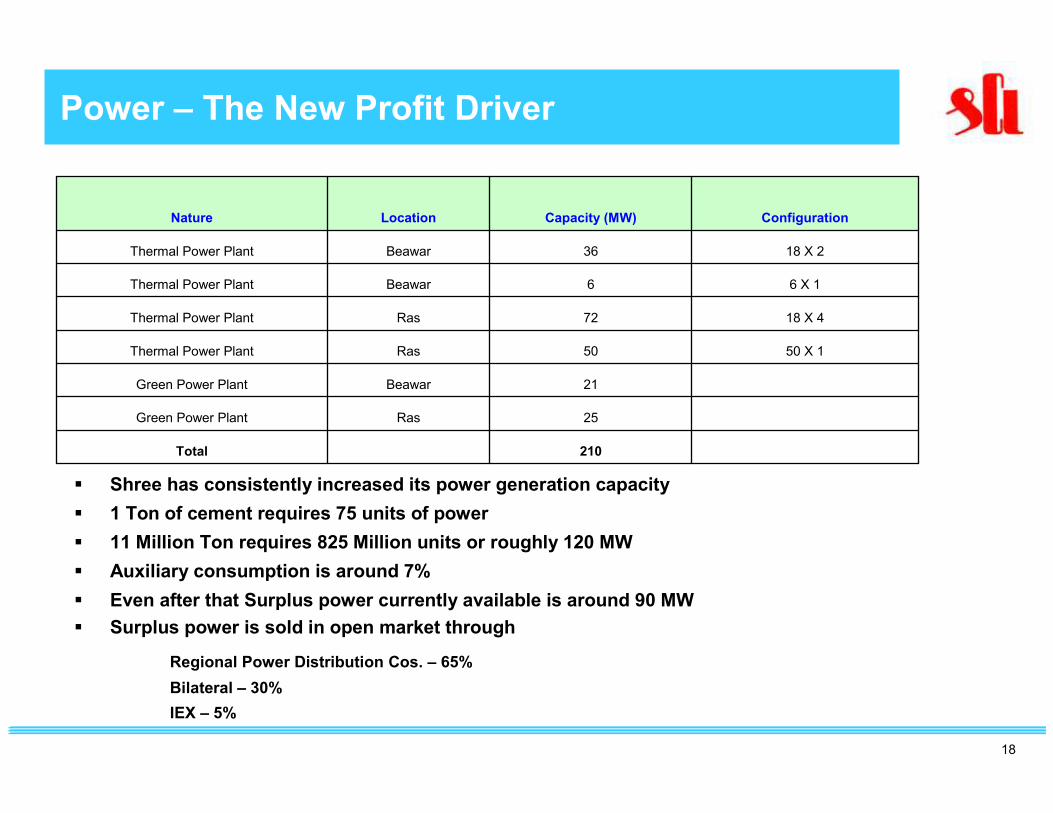
Power – The New Profit Driver
� Shree has consistently increased its power generation capacity
� 1 Ton of cement requires 75 units of power
� 11 Million Ton requires 825 Million units or roughly 120 MW
� Auxiliary consumption is around 7%
� Even after that Surplus power currently available is around 90 MW
� Surplus power is sold in open market through
Regional Power Distribution Cos. – 65%
Bilateral – 30%
IEX – 5%
210Total
25RasGreen Power Plant
21BeawarGreen Power Plant
50 X 150RasThermal Power Plant
18 X 472RasThermal Power Plant
6 X 16BeawarThermal Power Plant
18 X 236BeawarThermal Power Plant
ConfigurationCapacity (MW)LocationNature
19
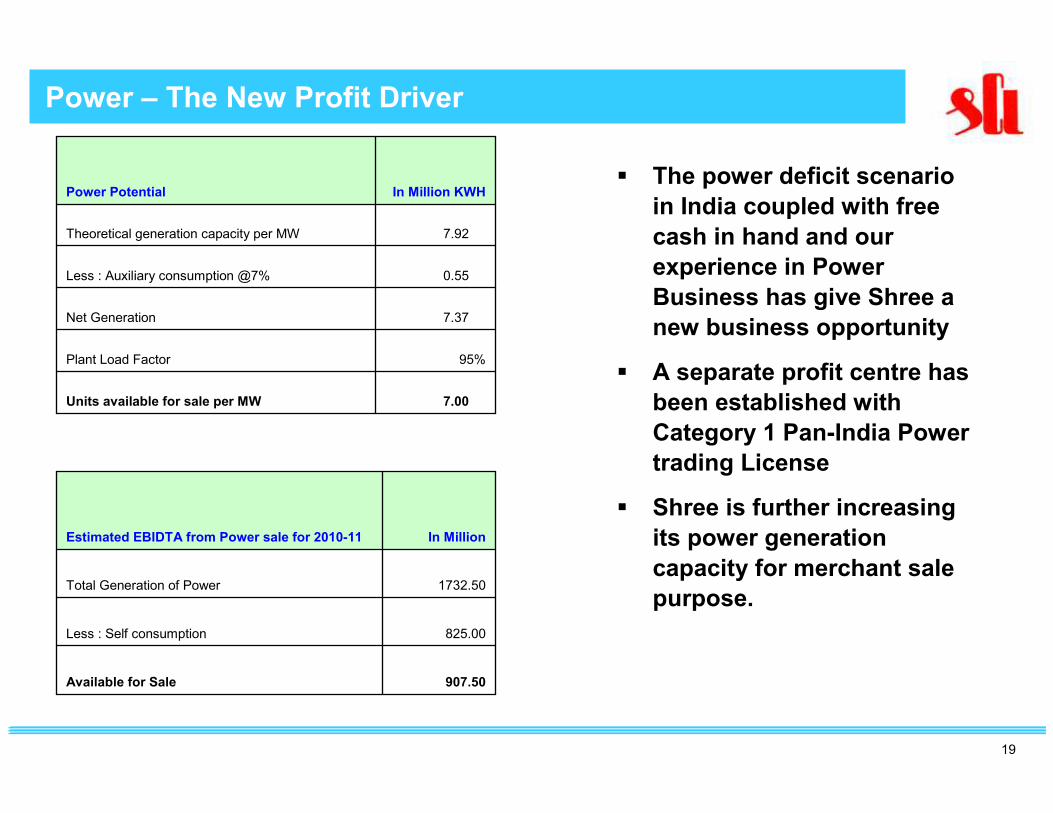
Power – The New Profit Driver
7.00 Units available for sale per MW
95%Plant Load Factor
7.37 Net Generation
0.55 Less : Auxiliary consumption @7%
7.92 Theoretical generation capacity per MW
In Million KWHPower Potential
907.50Available for Sale
825.00Less : Self consumption
1732.50Total Generation of Power
In MillionEstimated EBIDTA from Power sale for 2010-11
� The power deficit scenario
in India coupled with free
cash in hand and our
experience in Power
Business has give Shree a
new business opportunity
� A separate profit centre has
been established with
Category 1 Pan-India Power
trading License
� Shree is further increasing
its power generation
capacity for merchant sale
purpose.
20
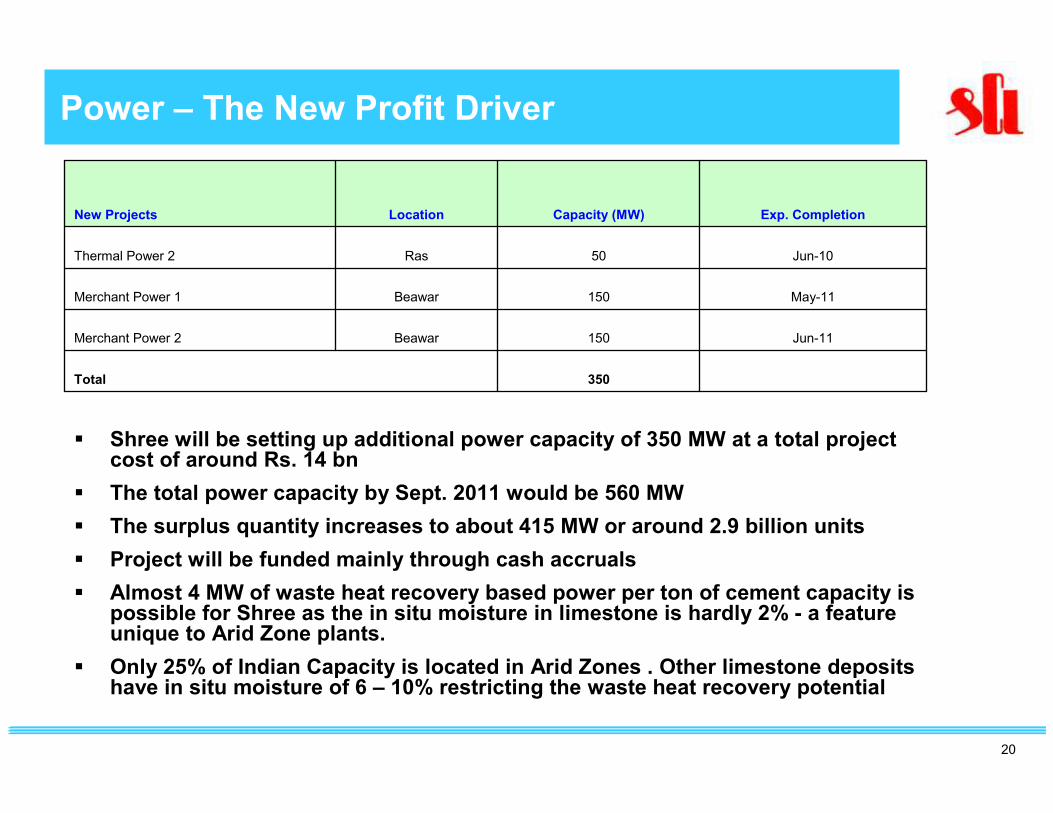
Power – The New Profit Driver
� Shree will be setting up additional power capacity of 350 MW at a total project cost of around Rs. 14 bn
� The total power capacity by Sept. 2011 would be 560 MW
� The surplus quantity increases to about 415 MW or around 2.9 billion units
� Project will be funded mainly through cash accruals
� Almost 4 MW of waste heat recovery based power per ton of cement capacity is possible for Shree as the in situ moisture in limestone is hardly 2% - a feature unique to Arid Zone plants.
� Only 25% of Indian Capacity is located in Arid Zones . Other limestone deposits have in situ moisture of 6 – 10% restricting the waste heat recovery potential
350Total
Jun-11150BeawarMerchant Power 2
May-11150BeawarMerchant Power 1
Jun-1050RasThermal Power 2
Exp. CompletionCapacity (MW)LocationNew Projects
21
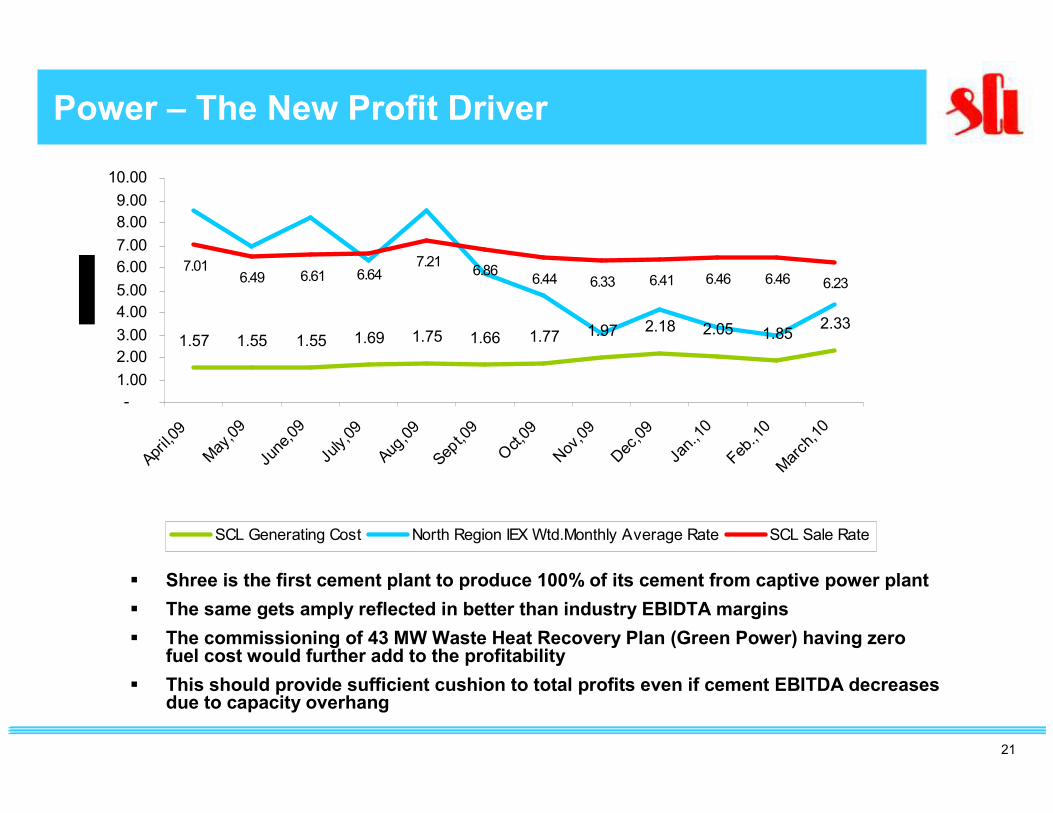
Power – The New Profit Driver
� Shree is the first cement plant to produce 100% of its cement from captive power plant
� The same gets amply reflected in better than industry EBIDTA margins
� The commissioning of 43 MW Waste Heat Recovery Plan (Green Power) having zero fuel cost would further add to the profitability
� This should provide sufficient cushion to total profits even if cement EBITDA decreases due to capacity overhang
1.57 1.55 1.55 1.69 1.75 1.66 1.77 1.97 2.18 2.05 1.852.33
7.016.49 6.61 6.64
7.216.86
6.44 6.33 6.41 6.46 6.46 6.23
-
1.00
2.00
3.00
4.00
5.00
6.00
7.00
8.00
9.00
10.00
April
,09
May
,09
June
,09
July
,09
Aug,
09
Sept
,09
Oct
,09
Nov
,09
Dec
,09
Jan.
,10
Feb.
,10
Mar
ch,1
0
SCL Generating Cost North Region IEX Wtd.Monthly Average Rate SCL Sale Rate
22
Power – The New Profit Driver
� Low efficiency boilers have been chosen by Shree to:
� Reduce the capital cost of the power plants
� To recover full fuel content of the fuel by using its ash in the cement
kilns
� High efficiency boilers leave 8 – 10% un - burnt carbon whereas low
efficiency boiler leave around 30%
� Low un-burnt carbon ash cannot be used in the cement kiln and go
waste
� Seven boilers have already been commissioned. The eighth and ninth
boiler along with boilers for the two 150 MW shall all be AFBC & CFBC
type to have flexibility of using all kinds of fuel including agri / tyre
wastes - an emerging trend in India.
23
Higher Profitability due to :
A Use of Alternate Fuel (Pet Coke)
B Market Strategy
C Logistic Advantage
D Split Grinding Location
E Own Railway Siding
F Human Resources
24
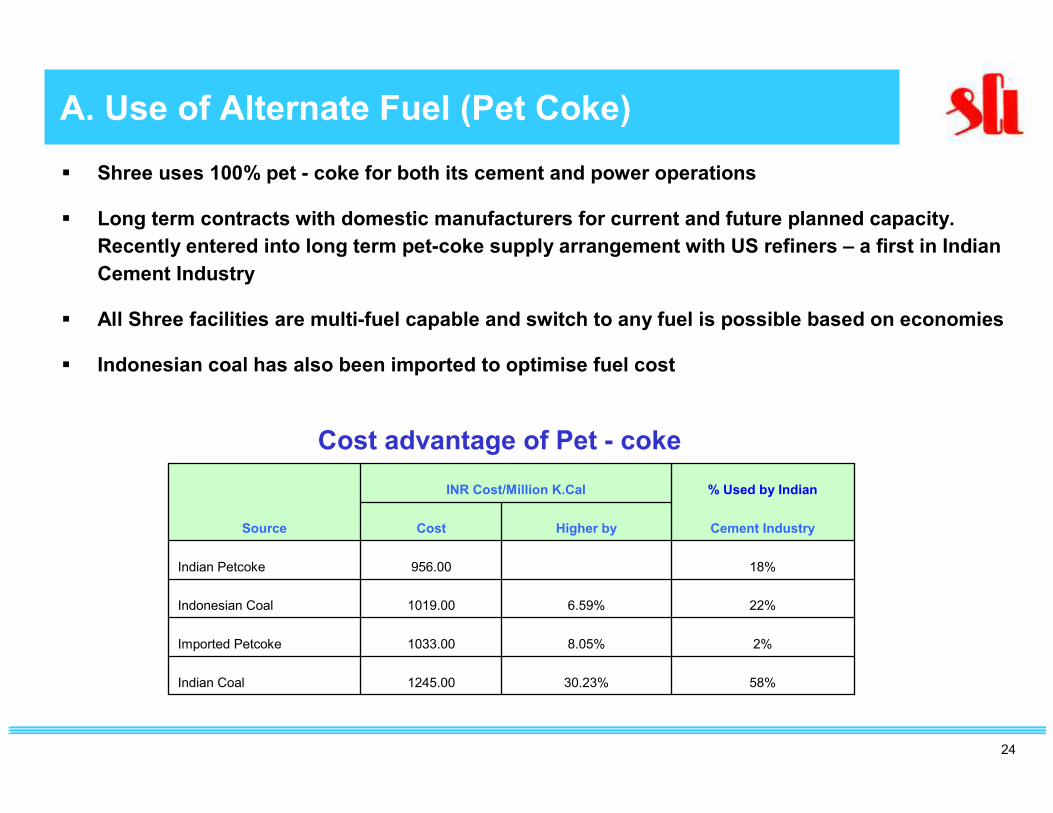
A. Use of Alternate Fuel (Pet Coke)
� Shree uses 100% pet - coke for both its cement and power operations
� Long term contracts with domestic manufacturers for current and future planned capacity.
Recently entered into long term pet-coke supply arrangement with US refiners – a first in Indian
Cement Industry
� All Shree facilities are multi-fuel capable and switch to any fuel is possible based on economies
� Indonesian coal has also been imported to optimise fuel cost
Cost advantage of Pet - coke
58%30.23%1245.00Indian Coal
2%8.05%1033.00Imported Petcoke
22%6.59%1019.00Indonesian Coal
18%956.00Indian Petcoke
Cement IndustryHigher byCostSource
% Used by IndianINR Cost/Million K.Cal
25
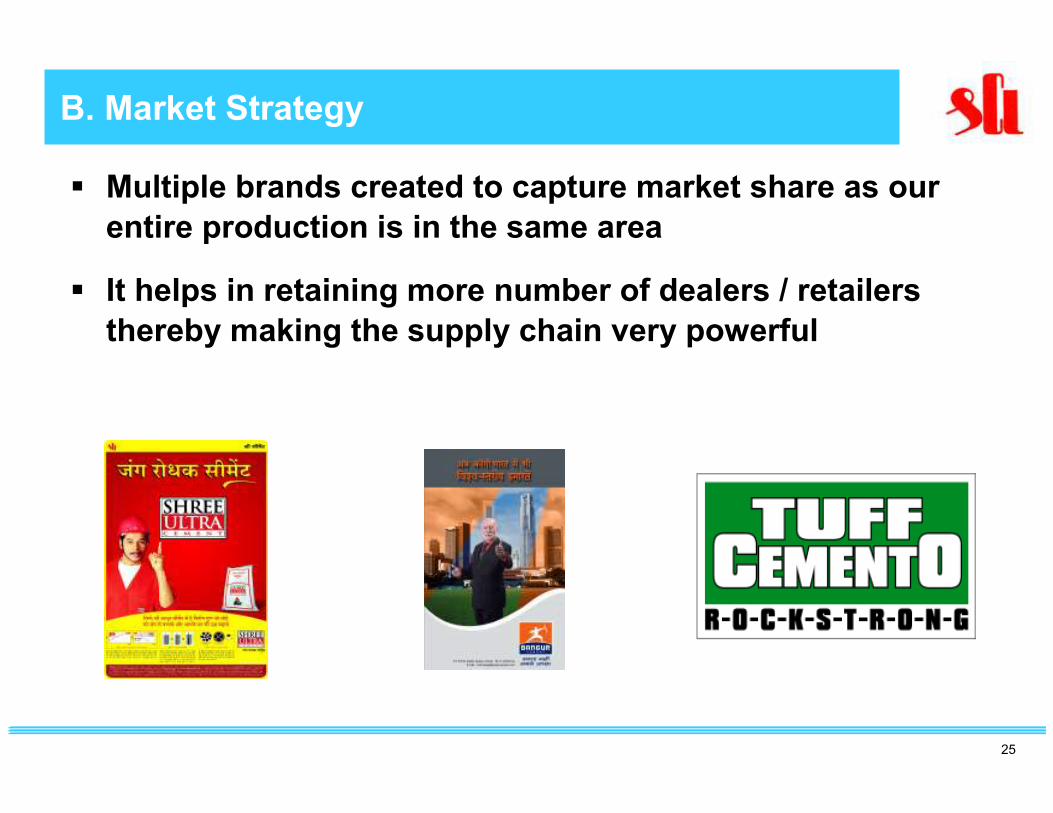
E. Branding Strategy
� Multiple brands created to capture market share as our
entire production is in the same area
� It helps in retaining more number of dealers / retailers
thereby making the supply chain very powerful
B. Market Strategy
26
F. Logistic Advantage
Shree Plants
Other Cement Plants
Cement Grinding Plants
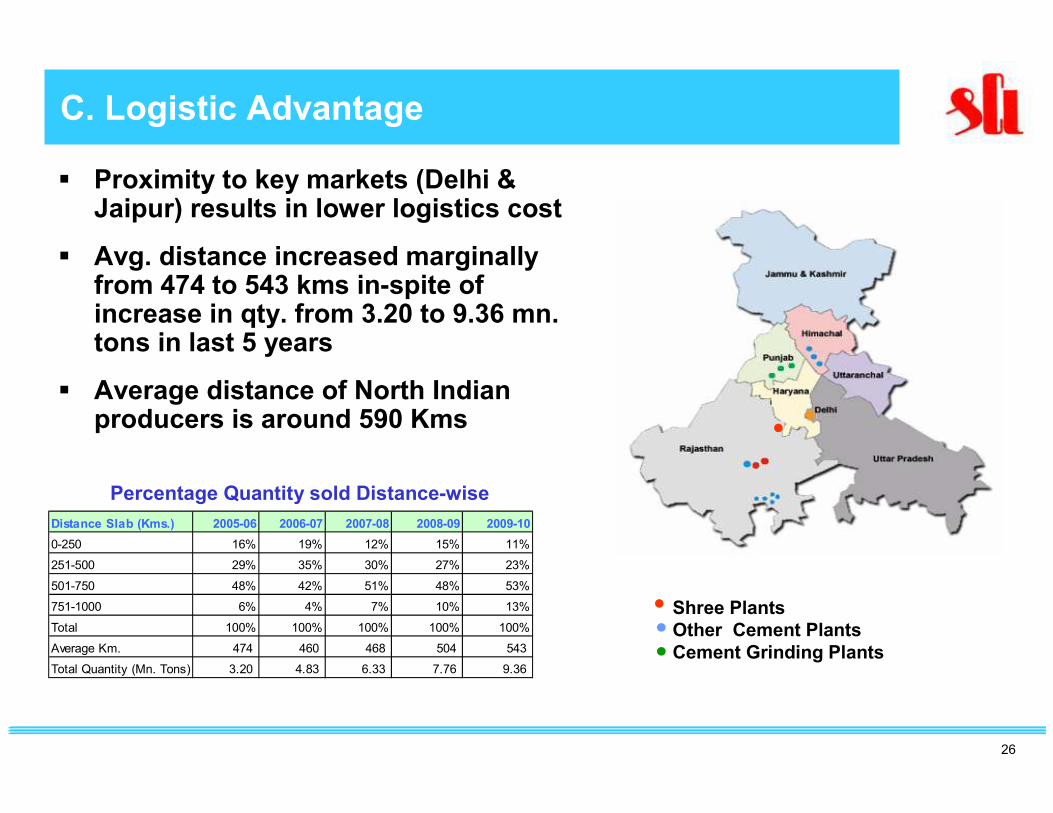
C. Logistic Advantage
� Proximity to key markets (Delhi & Jaipur) results in lower logistics cost
� Avg. distance increased marginally from 474 to 543 kms in-spite of increase in qty. from 3.20 to 9.36 mn. tons in last 5 years
� Average distance of North Indian producers is around 590 Kms
Percentage Quantity sold Distance-wise
Distance Slab (Kms.) 2005-06 2006-07 2007-08 2008-09 2009-10
0-250 16% 19% 12% 15% 11%
251-500 29% 35% 30% 27% 23%
501-750 48% 42% 51% 48% 53%
751-1000 6% 4% 7% 10% 13%
Total 100% 100% 100% 100% 100%
Average Km. 474 460 468 504 543
Total Quantity (Mn. Tons) 3.20 4.83 6.33 7.76 9.36
27
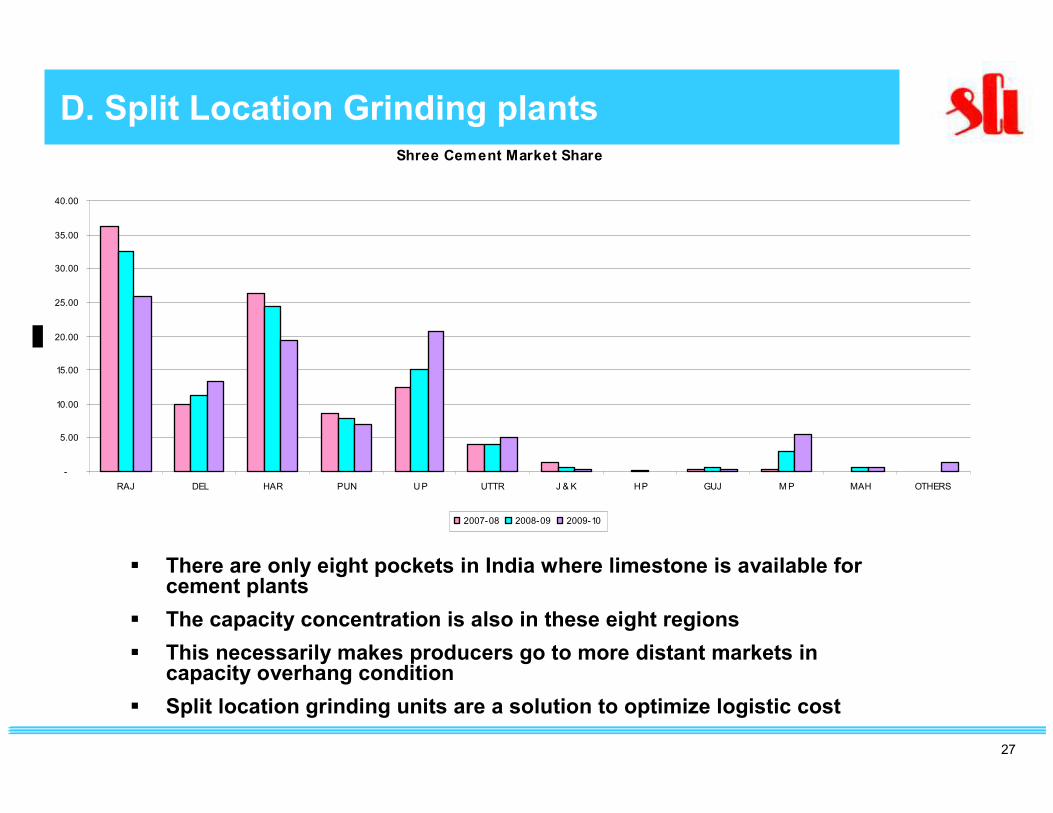
F. Logistic AdvantageD. Split Location Grinding plantsShree Cement Market Share
-
5.00
10.00
15.00
20.00
25.00
30.00
35.00
40.00
RAJ DEL HAR PUN U P UTTR J & K H P GUJ M P MAH OTHERS
2007-08 2008-09 2009-10
� There are only eight pockets in India where limestone is available for cement plants
� The capacity concentration is also in these eight regions
� This necessarily makes producers go to more distant markets in capacity overhang condition
� Split location grinding units are a solution to optimize logistic cost
28
4
6
12
3
5
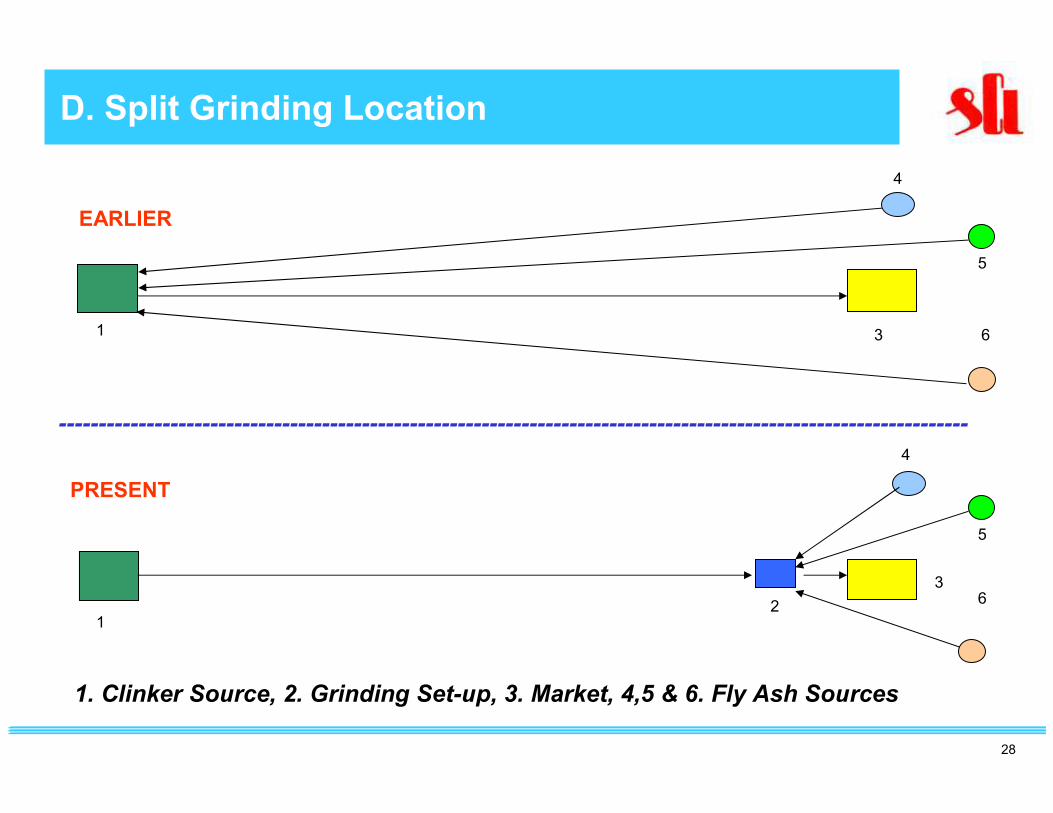
PRESENT
6
D. Split Grinding Location
4
4
3
5
1
EARLIER
6
------------------------------------------------------------------------------------------------------------------
1. Clinker Source, 2. Grinding Set-up, 3. Market, 4,5 & 6. Fly Ash Sources
29
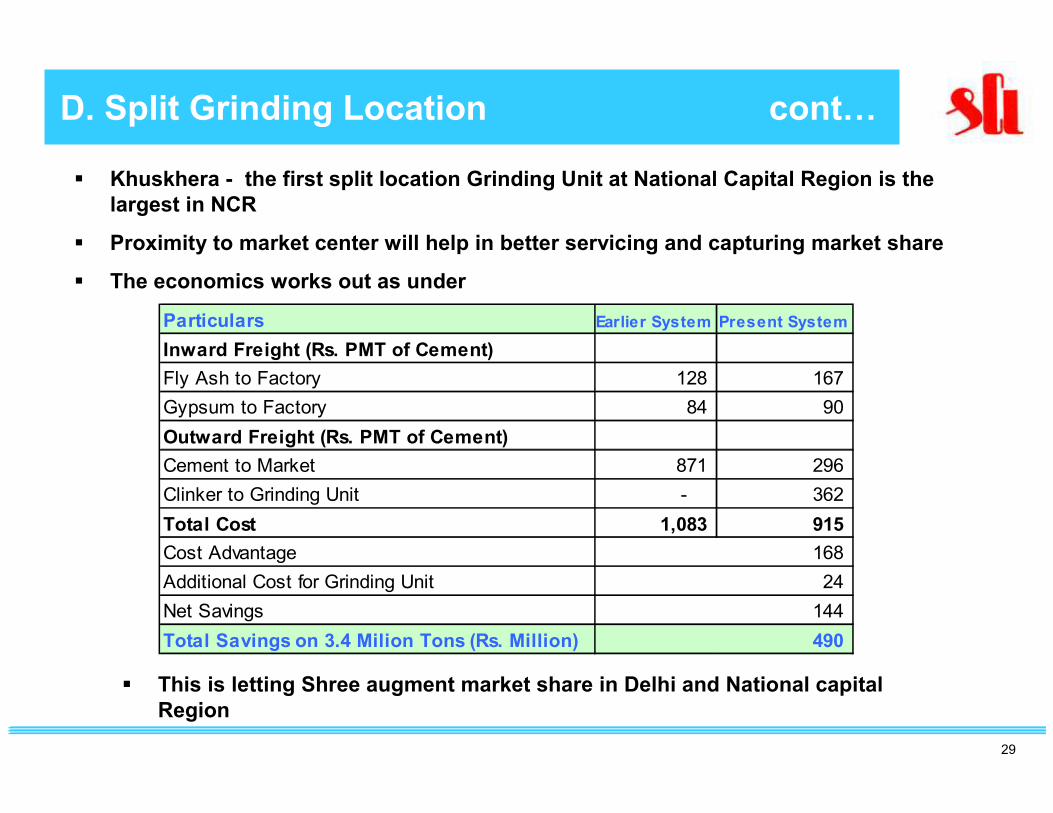
D. Split Grinding Location cont…
� Khuskhera - the first split location Grinding Unit at National Capital Region is the
largest in NCR
� Proximity to market center will help in better servicing and capturing market share
� The economics works out as under
Particulars Earlier System Present System
Inward Freight (Rs. PMT of Cement)
Fly Ash to Factory 128 167
Gypsum to Factory 84 90
Outward Freight (Rs. PMT of Cement)
Cement to Market 871 296
Clinker to Grinding Unit - 362
Total Cost 1,083 915
Cost Advantage
Additional Cost for Grinding Unit
Net Savings
Total Savings on 3.4 Milion Tons (Rs. Million)
168
24
144
490
� This is letting Shree augment market share in Delhi and National capital
Region
30
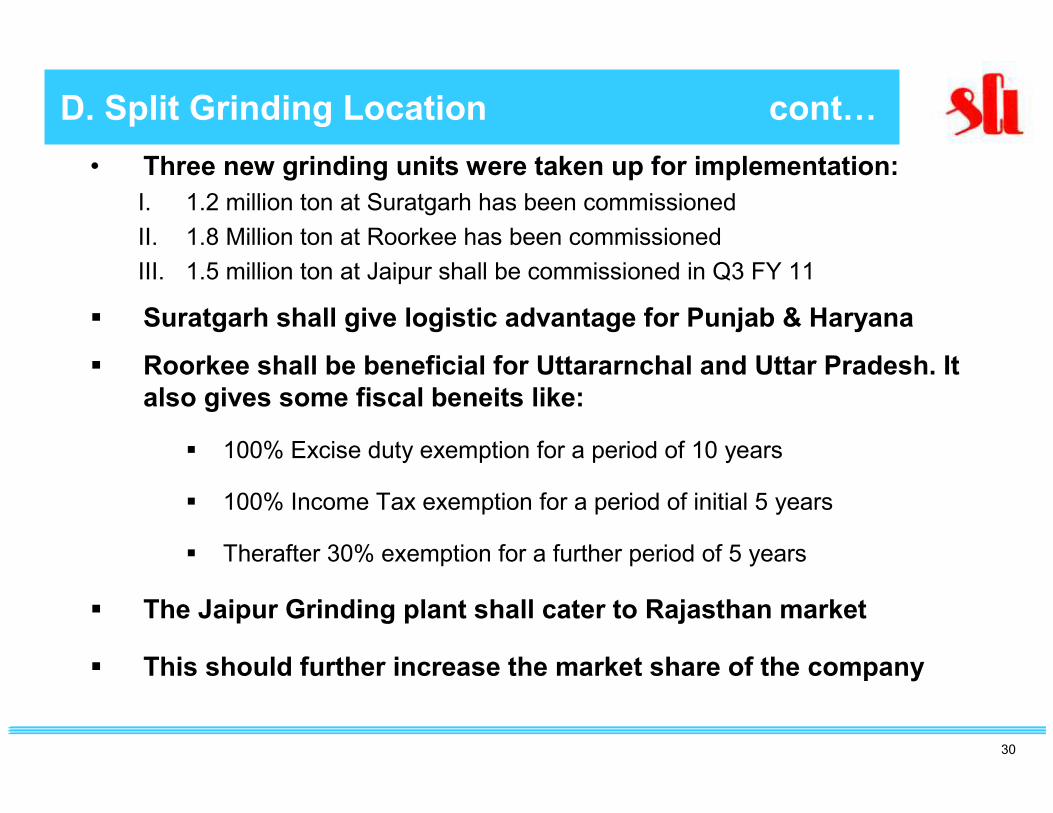
D. Split Grinding Location cont…
• Three new grinding units were taken up for implementation:
I. 1.2 million ton at Suratgarh has been commissioned
II. 1.8 Million ton at Roorkee has been commissioned
III. 1.5 million ton at Jaipur shall be commissioned in Q3 FY 11
� Suratgarh shall give logistic advantage for Punjab & Haryana
� Roorkee shall be beneficial for Uttararnchal and Uttar Pradesh. It
also gives some fiscal beneits like:
� 100% Excise duty exemption for a period of 10 years
� 100% Income Tax exemption for a period of initial 5 years
� Therafter 30% exemption for a further period of 5 years
� The Jaipur Grinding plant shall cater to Rajasthan market
� This should further increase the market share of the company
31
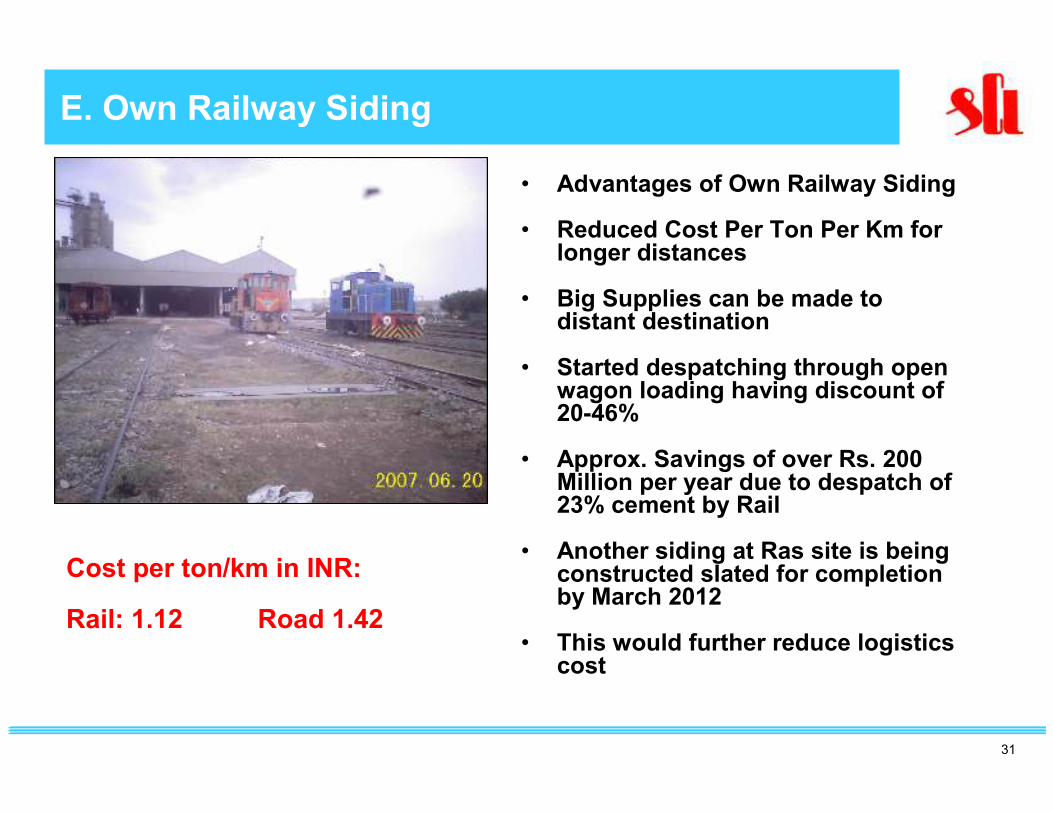
E. Own Railway Siding
• Advantages of Own Railway Siding
• Reduced Cost Per Ton Per Km for longer distances
• Big Supplies can be made to distant destination
• Started despatching through open wagon loading having discount of 20-46%
• Approx. Savings of over Rs. 200 Million per year due to despatch of 23% cement by Rail
• Another siding at Ras site is being constructed slated for completion by March 2012
• This would further reduce logistics cost
Cost per ton/km in INR:
Rail: 1.12 Road 1.42
32
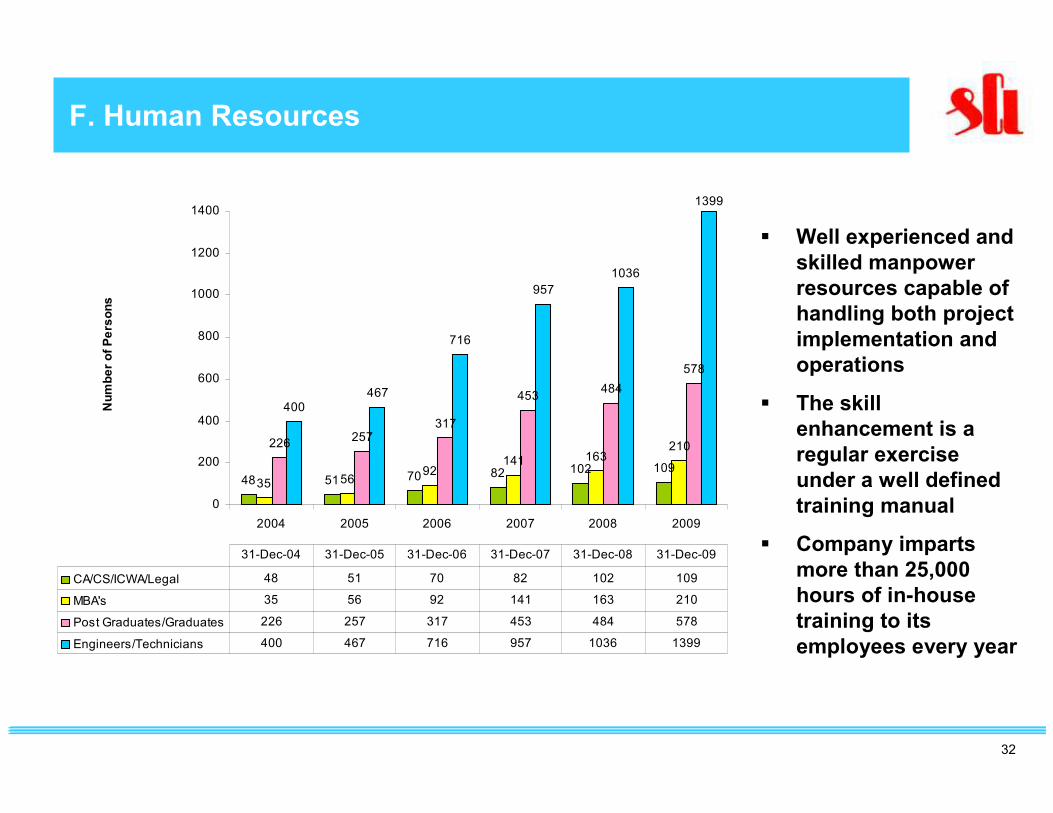
F. Human Resources
� Well experienced and
skilled manpower
resources capable of
handling both project
implementation and
operations
� The skill
enhancement is a
regular exercise
under a well defined
training manual
� Company imparts
more than 25,000
hours of in-house
training to its
employees every year
48 51 70 82 102 109
35 5692
141 163210226
257317
453484
578
400467
716
957
1036
1399
0
200
400
600
800
1000
1200
1400
2004 2005 2006 2007 2008 2009
Number of Persons
CA/CS/ICWA/Legal 48 51 70 82 102 109
MBA's 35 56 92 141 163 210
Post Graduates/Graduates 226 257 317 453 484 578
Engineers/Technicians 400 467 716 957 1036 1399
31-Dec-04 31-Dec-05 31-Dec-06 31-Dec-07 31-Dec-08 31-Dec-09
33
Shree Cement – Financial Section
34
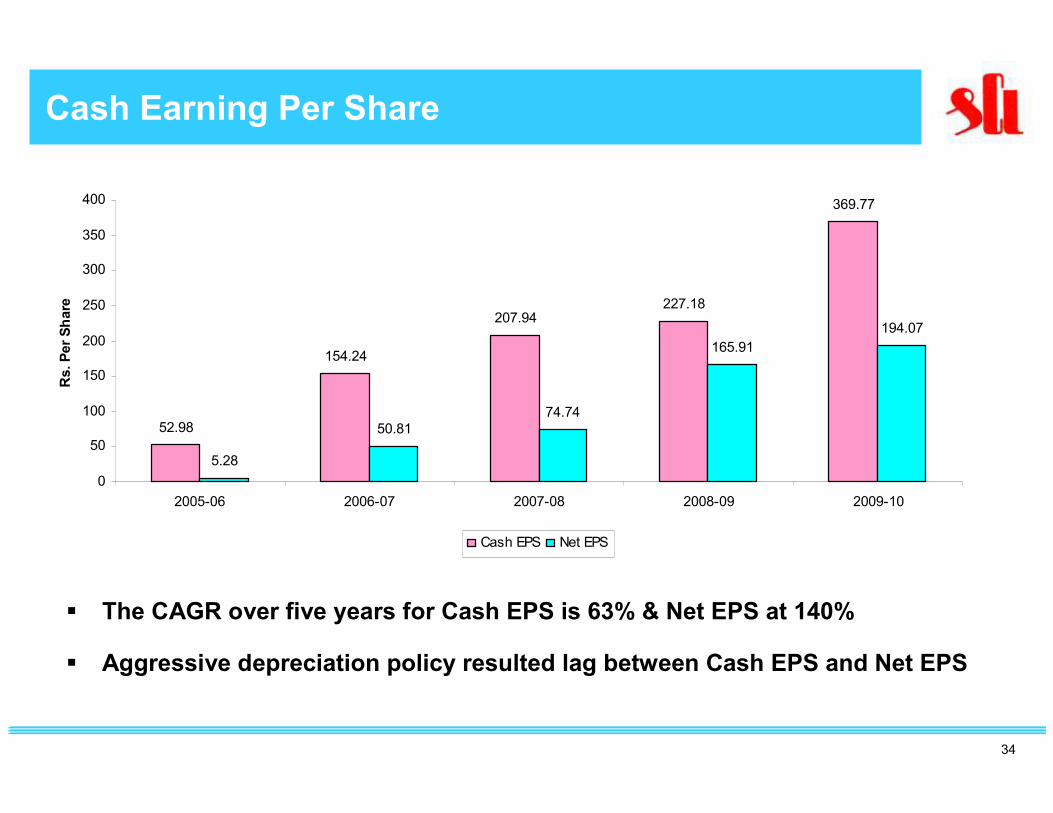
Cash Earning Per Share
� The CAGR over five years for Cash EPS is 63% & Net EPS at 140%
� Aggressive depreciation policy resulted lag between Cash EPS and Net EPS
52.98
154.24
207.94227.18
369.77
5.28
50.81
74.74
165.91
194.07
0
50
100
150
200
250
300
350
400
2005-06 2006-07 2007-08 2008-09 2009-10
Rs. Per Share
Cash EPS Net EPS
35
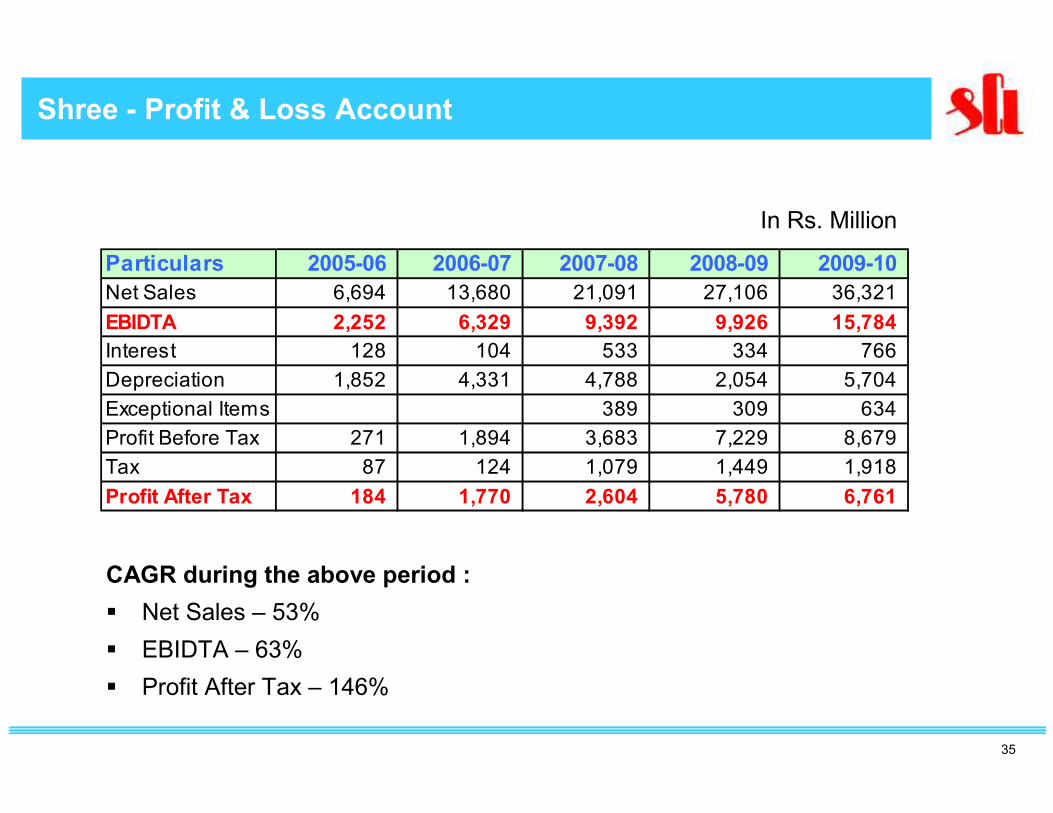
Shree - Profit & Loss Account
In Rs. Million
Particulars 2005-06 2006-07 2007-08 2008-09 2009-10
Net Sales 6,694 13,680 21,091 27,106 36,321
EBIDTA 2,252 6,329 9,392 9,926 15,784
Interest 128 104 533 334 766
Depreciation 1,852 4,331 4,788 2,054 5,704
Exceptional Items 389 309 634
Profit Before Tax 271 1,894 3,683 7,229 8,679
Tax 87 124 1,079 1,449 1,918
Profit After Tax 184 1,770 2,604 5,780 6,761
CAGR during the above period :
� Net Sales – 53%
� EBIDTA – 63%
� Profit After Tax – 146%
36
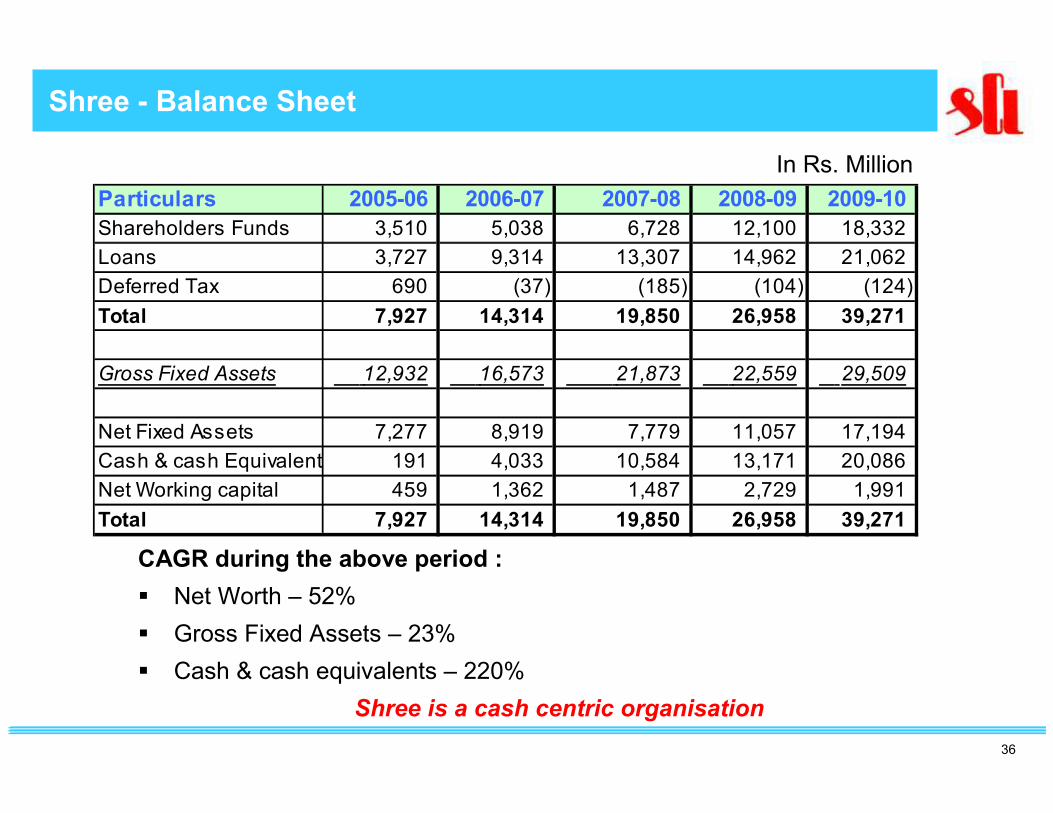
Shree - Balance Sheet
In Rs. Million
Particulars 2005-06 2006-07 2007-08 2008-09 2009-10
Shareholders Funds 3,510 5,038 6,728 12,100 18,332
Loans 3,727 9,314 13,307 14,962 21,062
Deferred Tax 690 (37) (185) (104) (124)
Total 7,927 14,314 19,850 26,958 39,271
Gross Fixed Assets 12,932 16,573 21,873 22,559 29,509
Net Fixed Assets 7,277 8,919 7,779 11,057 17,194
Cash & cash Equivalents 191 4,033 10,584 13,171 20,086
Net Working capital 459 1,362 1,487 2,729 1,991
Total 7,927 14,314 19,850 26,958 39,271
CAGR during the above period :
� Net Worth – 52%
� Gross Fixed Assets – 23%
� Cash & cash equivalents – 220%
Shree is a cash centric organisation
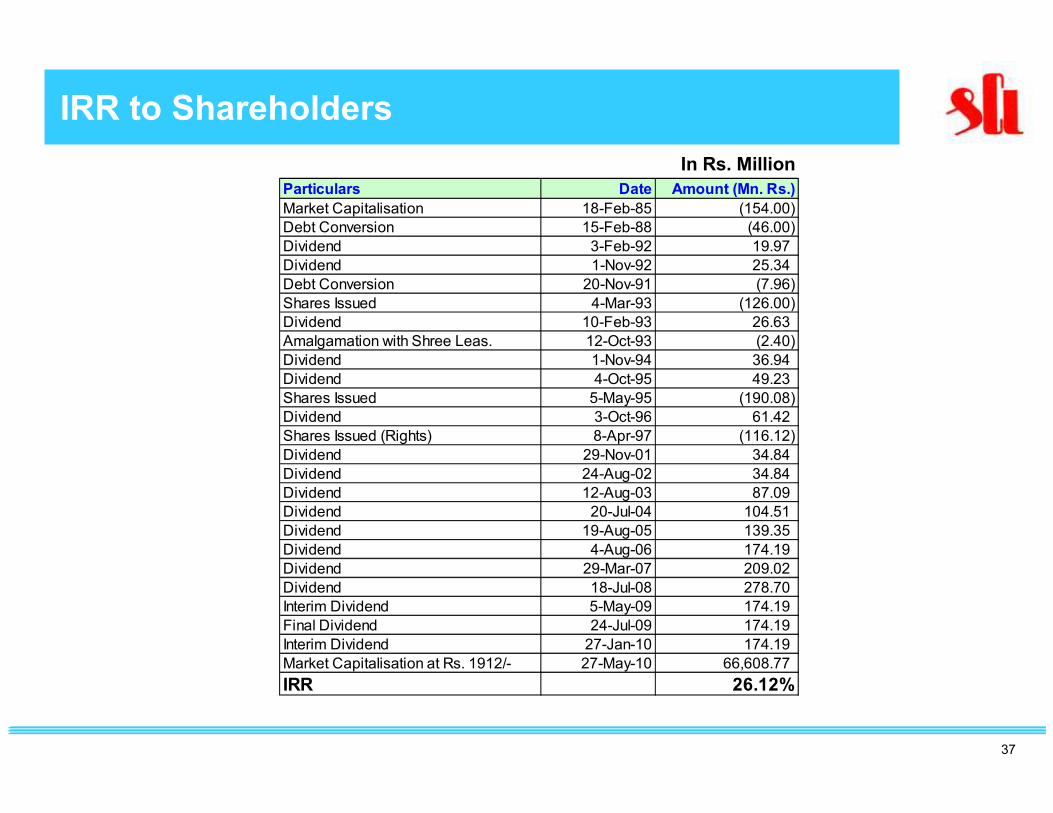
37
In Rs. Million
Particulars Date Amount (Mn. Rs.)
Market Capitalisation 18-Feb-85 (154.00)
Debt Conversion 15-Feb-88 (46.00)
Dividend 3-Feb-92 19.97
Dividend 1-Nov-92 25.34
Debt Conversion 20-Nov-91 (7.96)
Shares Issued 4-Mar-93 (126.00)
Dividend 10-Feb-93 26.63
Amalgamation with Shree Leas. 12-Oct-93 (2.40)
Dividend 1-Nov-94 36.94
Dividend 4-Oct-95 49.23
Shares Issued 5-May-95 (190.08)
Dividend 3-Oct-96 61.42
Shares Issued (Rights) 8-Apr-97 (116.12)
Dividend 29-Nov-01 34.84
Dividend 24-Aug-02 34.84
Dividend 12-Aug-03 87.09
Dividend 20-Jul-04 104.51
Dividend 19-Aug-05 139.35
Dividend 4-Aug-06 174.19
Dividend 29-Mar-07 209.02
Dividend 18-Jul-08 278.70
Interim Dividend 5-May-09 174.19
Final Dividend 24-Jul-09 174.19
Interim Dividend 27-Jan-10 174.19
Market Capitalisation at Rs. 1912/- 27-May-10 66,608.77
IRR 26.12%
Shree - IRR to ShareholdersIRR to Shareholders
38
Disclaimer
� This presentation contains forward-looking statements which may be identified by their use of words like “plans”, “expects”, “will”, “anticipates”, “believes”, “intends”, “projects”, “estimates” or other words of similar meaning. All statements that address expectations or projections about the future, including, but not limited to, statements about the strategy for growth, product development, market position, expenditures and financial results are forward-looking statements.
� Forward-looking statements are based on certain assumptions and expectations of future events. The company does not guarantee that these assumptions and expectations are accurate or will be realised, The actual results, performance or achievements could thus differ materially form those projected in any such forward-looking statements. The company assumes no responsibility to publicly amend, modify or revise any forward-looking statements, on the basis of any subsequent developments, information or events, or otherwise.
39
Thank You
SHREE CEMENT LIMITED