SHORTROOT-Mediated Intercellular Signals Coordinate Phloem … · SHORTROOT-Mediated Intercellular...
35
1 RESEARCH ARTICLE SHORTROOT-Mediated Intercellular Signals Coordinate Phloem Development in Arabidopsis Roots Hyoujin Kim 1§ , Jing Zhou 1,2,3§ , Deepak Kumar 1 , Geupil Jang 1,4 , Kook Hui Ryu 1 , Jose Sebastian 1,2,5 , Shunsuke Miyashima 6 , Ykä Helariutta 6,7 , Ji-Young Lee 1,8 * 1 School of Biological Sciences, College of Natural Science, Seoul National University, 1 Gwanak-ro, Gwanak-gu, Seoul 08826, Korea 2 Boyce Thompson Institute, Cornell University, Ithaca NY 14853 USA 3 Elo Life Systems, 3054 E Cornwallis Rd, Durham NC 27709 USA 4 School of Biological Sciences and Technology, Chonnam National University, Gwangju 61186, Korea 5 Department of Biological Sciences, Indian Institute of Science Education and Research, Berhampur (IISER BPR), India 6 Institute of Biotechnology, Department of Biological and Environmental Sciences, University of Helsinki, FIN-00014, Finland 7 Sainsbury Laboratory, Cambridge University, Bateman Street, Cambridge CB2 1LR, UK 8 Plant Genomics and Breeding Institute, Seoul National University, 1 Gwanak-ro, Gwanak-gu, Seoul 08826, Korea § These authors contributed equally. * Author for correspondence; E-mail: [email protected] Short title: SHORTROOT-mediated phloem development One-sentence summary: Companion cells and sieve elements, two key cell types of sugar-conducting phloem, develop as a functional unit in the root via intercellular signals triggered by the SHORTROOT transcription factor. The author responsible for the distribution of materials integral to the findings presented in this article in accordance with the policy described in the Instructions for Authors (www.plantcell.org) is Ji-Young Lee ([email protected]). Abstract Asymmetric cell division (ACD) and positional signals play critical roles in the tissue patterning process. In the Arabidopsis root meristem, two major phloem cell types arise via ACDs of distinct origins: one for companion cells (CCs) and the other for proto- and metaphloem sieve elements (SEs). The molecular mechanisms underlying each of these processes have been reported; however, how these are coordinated has remained elusive. Here, we report a novel phloem development process coordinated via the SHORTROOT (SHR) transcription factor in Arabidopsis thaliana. The movement of SHR into the endodermis regulates the ACD for CC formation by activating microRNA165/6, while SHR moving into the phloem regulates the ACD generating the two phloem SEs. In the phloem, SHR sequentially activates NAC- REGULATED SEED MORPHOLOGY 1 (NARS1) and SECONDARY WALL-ASSOCIATED NAC DOMAIN PROTEIN 2 (SND2), and these three together form a positive feedforward loop. Under this regulatory scheme, NARS1, generated in the CCs of the root differentiation zone, establishes a top-down signal that drives the ACD for phloem SEs in the meristem. SND2 appears to function downstream to amplify NARS1 via positive feedback. This novel regulatory mechanism expands our understanding of the sophisticated vascular tissue patterning processes occurring during postembryonic root development. Plant Cell Advance Publication. Published on February 28, 2020, doi:10.1105/tpc.19.00455 ©2020 American Society of Plant Biologists. All Rights Reserved
Transcript of SHORTROOT-Mediated Intercellular Signals Coordinate Phloem … · SHORTROOT-Mediated Intercellular...

1
RESEARCH ARTICLE
SHORTROOT-Mediated Intercellular Signals Coordinate Phloem Development in Arabidopsis Roots Hyoujin Kim1§, Jing Zhou1,2,3§, Deepak Kumar1, Geupil Jang1,4, Kook Hui Ryu1, Jose Sebastian1,2,5, Shunsuke Miyashima6, Ykä Helariutta6,7, Ji-Young Lee1,8* 1 School of Biological Sciences, College of Natural Science, Seoul National University, 1 Gwanak-ro, Gwanak-gu, Seoul 08826, Korea 2 Boyce Thompson Institute, Cornell University, Ithaca NY 14853 USA 3 Elo Life Systems, 3054 E Cornwallis Rd, Durham NC 27709 USA 4 School of Biological Sciences and Technology, Chonnam National University, Gwangju 61186, Korea 5 Department of Biological Sciences, Indian Institute of Science Education and Research, Berhampur (IISER BPR), India 6 Institute of Biotechnology, Department of Biological and Environmental Sciences, University of Helsinki, FIN-00014, Finland 7 Sainsbury Laboratory, Cambridge University, Bateman Street, Cambridge CB2 1LR, UK 8 Plant Genomics and Breeding Institute, Seoul National University, 1 Gwanak-ro, Gwanak-gu, Seoul 08826, Korea § These authors contributed equally.
* Author for correspondence; E-mail: [email protected]
Short title: SHORTROOT-mediated phloem development
One-sentence summary: Companion cells and sieve elements, two key cell types of sugar-conducting phloem, develop as a functional unit in the root via intercellular signals triggered by the SHORTROOT transcription factor.
The author responsible for the distribution of materials integral to the findings presented in this article in accordance with the policy described in the Instructions for Authors (www.plantcell.org) is Ji-Young Lee ([email protected]).
Abstract
Asymmetric cell division (ACD) and positional signals play critical roles in the tissue patterning process. In the Arabidopsis root meristem, two major phloem cell types arise via ACDs of distinct origins: one for companion cells (CCs) and the other for proto- and metaphloem sieve elements (SEs). The molecular mechanisms underlying each of these processes have been reported; however, how these are coordinated has remained elusive. Here, we report a novel phloem development process coordinated via the SHORTROOT (SHR) transcription factor in Arabidopsis thaliana. The movement of SHR into the endodermis regulates the ACD for CC formation by activating microRNA165/6, while SHR moving into the phloem regulates the ACD generating the two phloem SEs. In the phloem, SHR sequentially activates NAC-REGULATED SEED MORPHOLOGY 1 (NARS1) and SECONDARY WALL-ASSOCIATED NAC DOMAIN PROTEIN 2 (SND2), and these three together form a positive feedforward loop. Under this regulatory scheme, NARS1, generated in the CCs of the root differentiation zone, establishes a top-down signal that drives the ACD for phloem SEs in the meristem. SND2 appears to function downstream to amplify NARS1 via positive feedback. This novel regulatory mechanism expands our understanding of the sophisticated vascular tissue patterning processes occurring during postembryonic root development.
Plant Cell Advance Publication. Published on February 28, 2020, doi:10.1105/tpc.19.00455
©2020 American Society of Plant Biologists. All Rights Reserved
2
Introduction
The evolutionary success of multicellular organisms raises the key developmental question of how their
complex morphogenesis is regulated. Studies have shown that asymmetric cell division (ACD) and positional
information play critical roles in the temporal and spatial regulation of tissue patterning during morphogenesis
(Berger et al., 1998; Kerszberg and Wolpert, 2007; Abrash and Bergmann, 2009; De Smet and Beeckman, 2011;
Kajala et al., 2014). Plant cells, caged in the rigid cell wall, largely rely on direct cell-to-cell communication
through plasmodesmata to exchange positional information.
Phloem is a tissue evolved to facilitate long-distance nutrient transport from source to sink. Sieve elements
(SEs) and companion cells (CCs) form a functional unit for phloem (reviewed in (Oparka and Turgeon, 1999)).
SEs, enucleated living cells, form tubular networks and serve as a conduit for transporting carbohydrates, amino
acids and minerals as well as RNAs, proteins, and diverse signaling molecules throughout the plant body (Sjolund,
1997; Knoblauch and van Bel, 1998; Hayashi et al., 2000). CCs that develop adjacent to SEs are responsible for
the loading of sugars to the SEs through the plasmodesmata (Lohaus et al., 1995). In the Arabidopsis root, phloem
is organized in a relatively simple manner and thus serves as a good system for a precise analysis of tissue
patterning. Two phloem poles develop perpendicular to the xylem axis in the Arabidopsis root, generating a
bisymmetric structure. In each pole, proto- and metaphloem SEs are generated by the ACD of a SE precursor cell
and two CCs are generated by ACDs of procambial cells neighboring both the SE precursor and pericycle cells
(Figures 1A, B) (Mahonen et al., 2000).
Recent studies have revealed the molecular components that regulate phloem development (Blob et al.,
2018). OCTOPUS (OPS), BREVIS RADIX (BRX), CLAVATA3/ESR-RELATED 45 (CLE45), and SMAX1-
LIKE 3-5 (SMXL3-5) are important for both the ACD of phloem SE precursor cells and the differentiation of
protophloem SEs (Truernit et al., 2012; Rodriguez-Villalon et al., 2014; Wallner et al., 2017). When these genes
are mutated, SE does not differentiate properly, and the ACD of the phloem SE precursor is often missing. This
ACD defect was proposed to stem from perturbations in rootward signals that are transmitted through
differentiated phloem SE (Rodriguez-Villalon et al., 2014). Among these signals, one is thought to be auxin
transported by PIN proteins through the phloem SE. Proper PIN localization on the SE membrane was shown to
be controlled by BRX and PROTEIN KINASE ASSOCIATED WITH BRX (PAX) (Marhava et al., 2018).
Several transcription factors (TFs) are also involved in the phloem development process. ALTERED PHLOEM
DEVELOPMENT (APL) encoding a MYB TF regulates the differentiation of phloem and xylem vessels.
PHLOEM EARLY DOF (PEAR) TFs act as short-distance mobile signals that control ACD in the phloem pole
through antagonistic interactions with Homeobox-leucine zipper (HD-ZIP) III TFs in the xylem and procambium
(Bonke et al., 2003; Miyashima et al., 2019). In addition, multiple NAC-domain TFs were found to regulate the
3
specifications and differentiation of protophloem SE (Furuta et al., 2014; Kondo et al., 2016). These findings
indicate that phloem development is achieved via complex regulatory programs that involve local and long-
distance signals. However, it is unclear how ACDs for SE and CC development are coordinated in space and time.
Here, we report that the SHORTROOT (SHR) coordinates ACDs for CC and SE development. SHR
mRNA is transcribed in parts of the stele i.e., the xylem, procambium and pericycle cells neighboring the xylem
and procambium. Subsequently, SHR proteins actively move into the phloem pole, the remaining pericycle cells,
the endodermis and the QC (Helariutta et al., 2000; Nakajima et al., 2001; Sena et al., 2004) (Supplemental Figure
1F, G). From the endodermis, SHR controls the ACD for CC; from the phloem, it directs the ACD for SE
development by directly regulating NARS1, a NAC-domain TF.
Results
SHR is required for phloem development
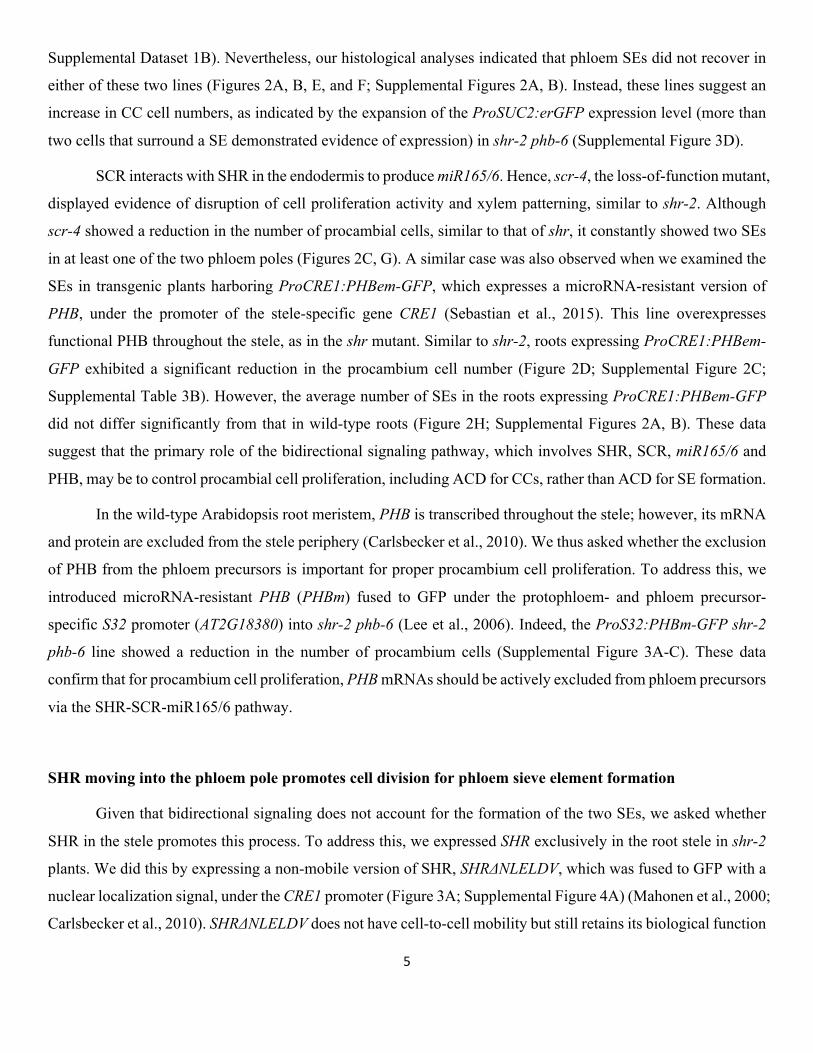
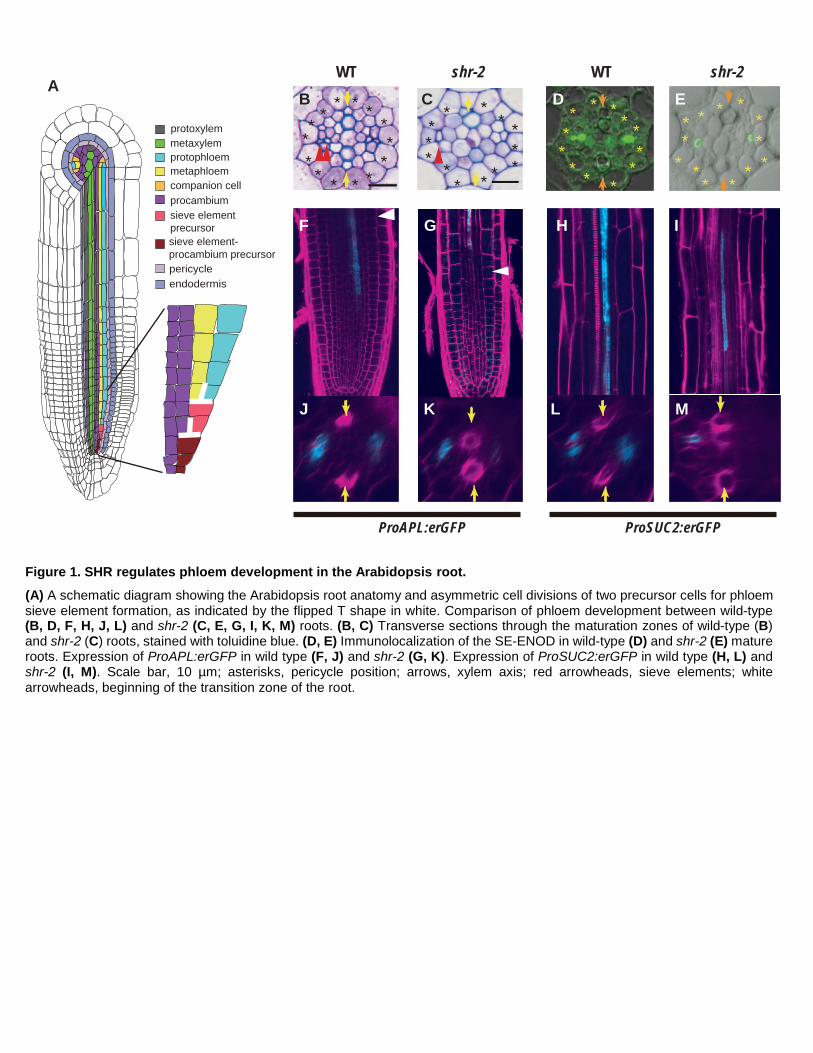
To determine whether SHR is involved in phloem development, we examined the phloem morphology in
shr-2 roots. In addition to the xylem patterning defects reported previously (Carlsbecker et al., 2010), we found
severe disruption in the phloem development process. In the wild-type Arabidopsis root, the xylem axis is
composed of a row of cells made of protoxylem and metaxylem (Figure 1A). Perpendicular to the xylem axis,
two poles of phloem tissues are established. In contrast to the wild type, where two SEs develop, in shr-2 roots,
we observed one SE-like cell in a phloem pole (Figure 1B, C). To examine SEs more accurately, we performed
two experiments. First, we visualized callose localized onto sieve plates on phloem SEs by staining with aniline
blue. In the wild type, two sieve plates on neighboring strands were observed (Supplemental Figure 1A). However,
in shr-2, only one sieve plate was detected (Supplemental Figure 1B). Second, we used immunohistochemistry
to locate early SE nodulin-like proteins (SE-ENOD) that specifically accumulate in differentiating SE (Khan et
al., 2007). This experiment allowed a quantitative analysis of the distribution of SEs in each root. Consistent with
the aniline blue staining results, we detected SE-ENOD in both proto- and metaphloem SEs in the maturation
zone of wild-type roots (Figure 1D; Supplemental Figure 2A). However, in shr-2 roots, we observed variations
in the SE development process and therefore classified them into the following six groups: class 1 as a group
without any SE, class 2 with SE found only in one phloem pole, class 3 with one SE in each of the two phloem
poles, class 4 with more than one SE in one pole and one SE in the other, class 5 with two SEs in each of the two
phloem poles, and class 6 with more than two SEs in one phloem pole and two SEs in the other. SEs belonging
to class 5 in shr roots were aligned laterally neighboring the pericycle, whereas those in wild-type roots were
always aligned perpendicular to the xylem axis. Approximately 75% of shr-2 roots developed SEs belonging to
classes 1 to 4, further supporting a reduction in SEs (Figure 1E; Supplemental Figure 2A). We also simplified
this classification by simply counting the number of phloem SEs (Supplemental Figure 2B; Supplemental Dataset
4
1A). This analysis further supports the significant reduction of phloem SEs in shr-2 in comparison to the wild
type (p ≤ 0.0001; one-way ANOVA followed by Dunnett's multiple comparisons test (α = 0.05))
We then examined the expression patterns of phloem markers in the wild-type and shr-2 roots. A previous
lineage analysis of vascular cells in the Arabidopsis root showed that proto- and metaphloem SEs in one phloem
pole are generated from sequential ACDs of a SE procambium precursor and a SE precursor and that two CCs
are generated by ACDs of two procambium cells neighboring both a SE precursor and the pericycle (Mahonen et
al., 2000; Bonke et al., 2003). ProAPL:erGFP (endoplasmic reticulum-localized GFP) expression starts in the
developing protophloem SEs in the meristem (Figure 1F) and then switches to the developing CCs and
metaphloem SEs when the protophloem SEs mature (Figure 1J) (Bonke et al., 2003). Expression of
ProAPL:erGFP in shr-2 starts not in the meristem but in the elongation zone, suggesting a delay in phloem
differentiation in comparison to neighboring cell types (Figure 1G) (Carlsbecker et al., 2010). In shr-2, GFP
expression of ProAPL:erGFP was first observed in a single SE-like cell, after which the expression expanded
asymmetrically to only one of its neighboring cells, which becomes CC (Figure 1K). We also examined the status
of CC by analyzing the expression of ProSUC2:erGFP, which is specifically expressed in CCs in the mature part
of the root (Figure 1H, L) (Stadler and Sauer, 1996). Unlike in wild-type roots, ProSUC2:erGFP in shr-2 was
expressed sporadically only in one cell next to the SE (Figure 1I, M), consistent with the expansion of
ProAPL:erGFP to only one cell neighboring a SE. Taken together, our data suggest that when the SHR function
is lost, the cell division activities required for the formation of both CCs and SEs are compromised.
The SHR-SCR-miR165/6 pathway regulates procambial cell division
SHR in the endodermis and quiescent center (QC) activates and interacts with SCARECROW (SCR),
another GRAS-family TF, and together they activate the expression of microRNA165/166 (miR165/6) to pattern
xylem vessels. MiR165/6, produced in the endodermis, helps to establish the HD-ZIP III gradient in the stele,
which subsequently specifies metaxylem in the center and protoxylem in the periphery of the stele in a dosage-
dependent manner (Carlsbecker et al., 2010; Miyashima et al., 2011).
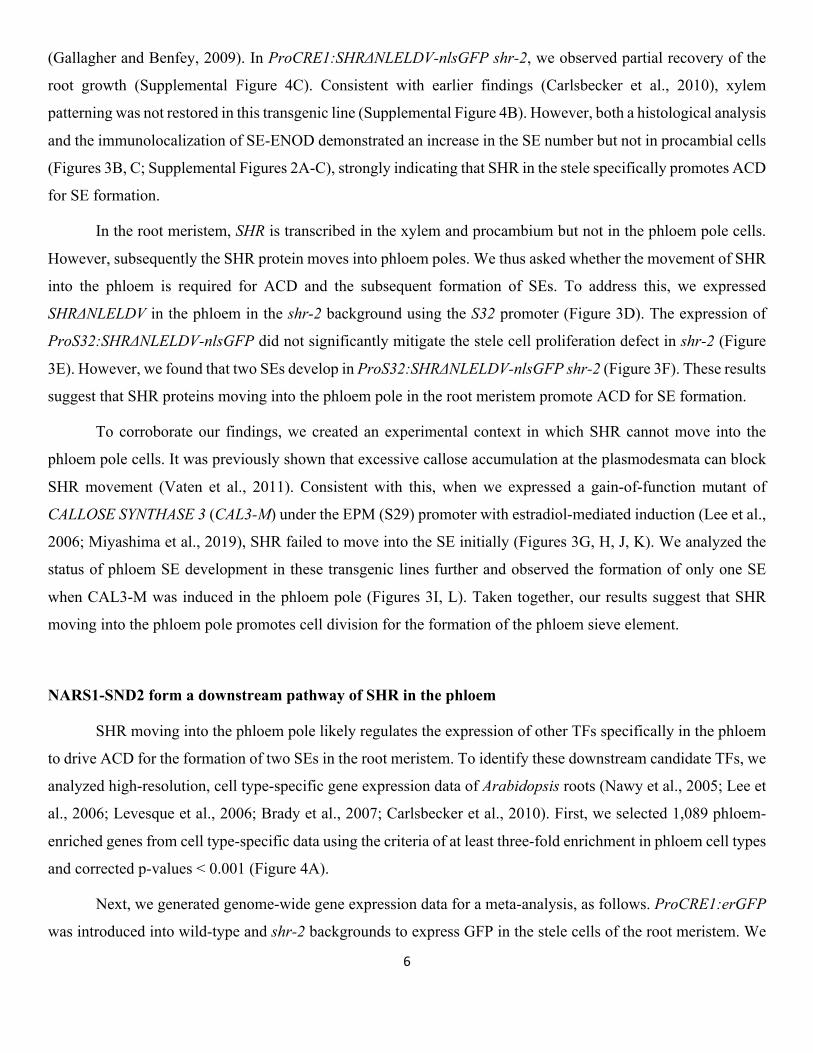
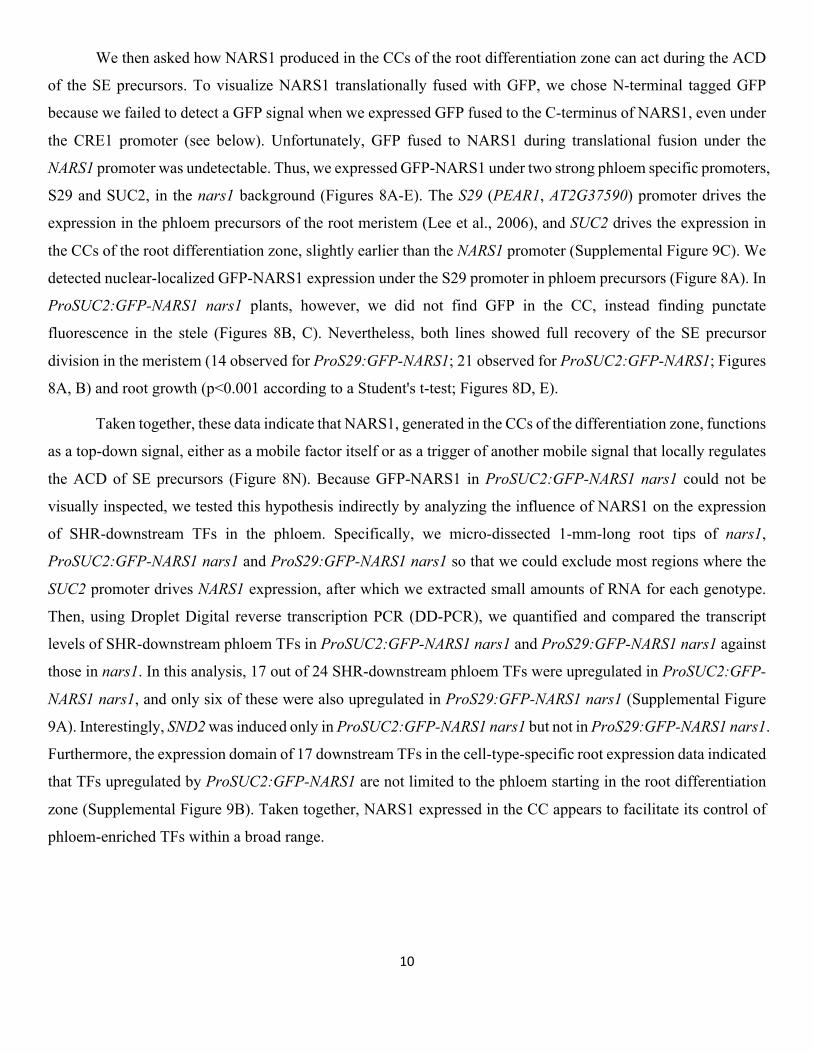
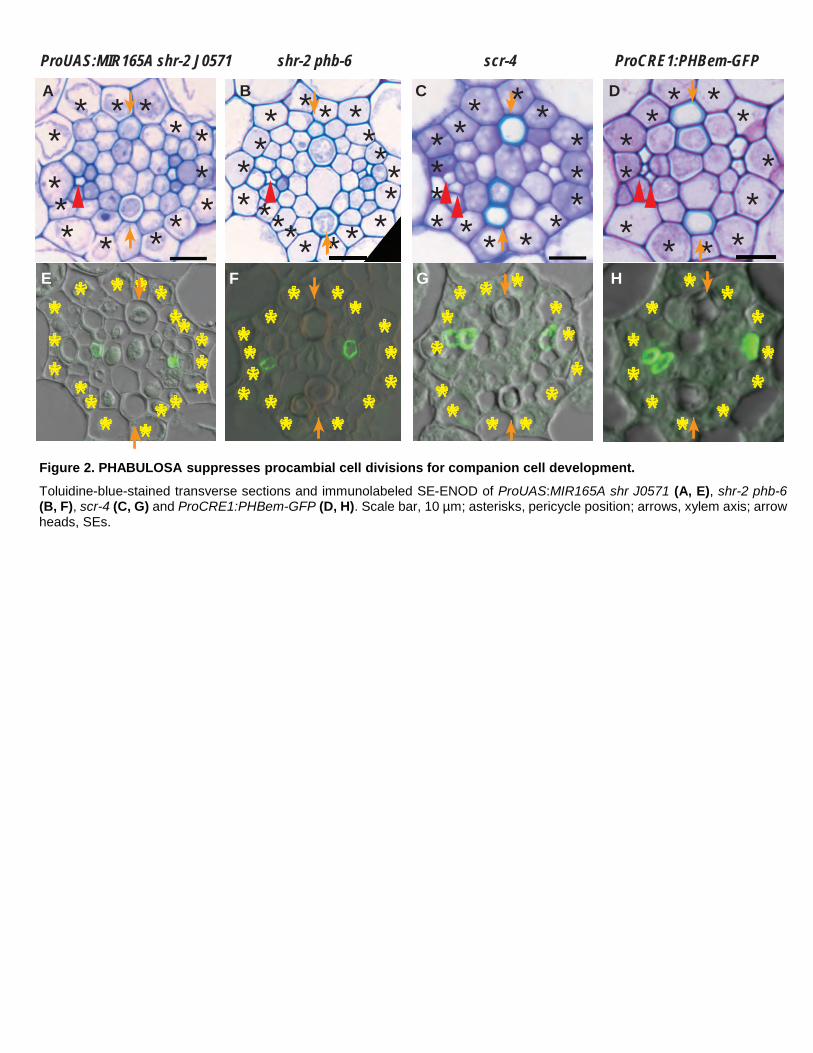
To test whether the SHR-SCR-miR165/6 pathway also influences other aspects in the stele besides
xylem development, we examined the stele cell organization and phloem development characteristics in the
ProUAS:MIR165A shr-2 J0571 line that drives miR165 expression in the ground tissue of the shr mutant
(Carlsbecker et al., 2010). In this line, we observed a stochastic recovery of stele cell numbers in some individuals
(Figure 2A; Supplemental Figure 2C). These recovered cells appeared to be mostly procambial cells between
xylem and phloem poles. Consistent with this, shr-2 phb-6, a double mutant between SHR and PHABULOSA
(PHB), showed a significant recovery of the procambial cell number (Figure 2B; Supplemental Figure 2C;
5
Supplemental Dataset 1B). Nevertheless, our histological analyses indicated that phloem SEs did not recover in
either of these two lines (Figures 2A, B, E, and F; Supplemental Figures 2A, B). Instead, these lines suggest an
increase in CC cell numbers, as indicated by the expansion of the ProSUC2:erGFP expression level (more than
two cells that surround a SE demonstrated evidence of expression) in shr-2 phb-6 (Supplemental Figure 3D).
SCR interacts with SHR in the endodermis to produce miR165/6. Hence, scr-4, the loss-of-function mutant,
displayed evidence of disruption of cell proliferation activity and xylem patterning, similar to shr-2. Although
scr-4 showed a reduction in the number of procambial cells, similar to that of shr, it constantly showed two SEs
in at least one of the two phloem poles (Figures 2C, G). A similar case was also observed when we examined the
SEs in transgenic plants harboring ProCRE1:PHBem-GFP, which expresses a microRNA-resistant version of
PHB, under the promoter of the stele-specific gene CRE1 (Sebastian et al., 2015). This line overexpresses
functional PHB throughout the stele, as in the shr mutant. Similar to shr-2, roots expressing ProCRE1:PHBem-
GFP exhibited a significant reduction in the procambium cell number (Figure 2D; Supplemental Figure 2C;
Supplemental Table 3B). However, the average number of SEs in the roots expressing ProCRE1:PHBem-GFP
did not differ significantly from that in wild-type roots (Figure 2H; Supplemental Figures 2A, B). These data
suggest that the primary role of the bidirectional signaling pathway, which involves SHR, SCR, miR165/6 and
PHB, may be to control procambial cell proliferation, including ACD for CCs, rather than ACD for SE formation.
In the wild-type Arabidopsis root meristem, PHB is transcribed throughout the stele; however, its mRNA
and protein are excluded from the stele periphery (Carlsbecker et al., 2010). We thus asked whether the exclusion
of PHB from the phloem precursors is important for proper procambium cell proliferation. To address this, we
introduced microRNA-resistant PHB (PHBm) fused to GFP under the protophloem- and phloem precursor-
specific S32 promoter (AT2G18380) into shr-2 phb-6 (Lee et al., 2006). Indeed, the ProS32:PHBm-GFP shr-2
phb-6 line showed a reduction in the number of procambium cells (Supplemental Figure 3A-C). These data
confirm that for procambium cell proliferation, PHB mRNAs should be actively excluded from phloem precursors
via the SHR-SCR-miR165/6 pathway.
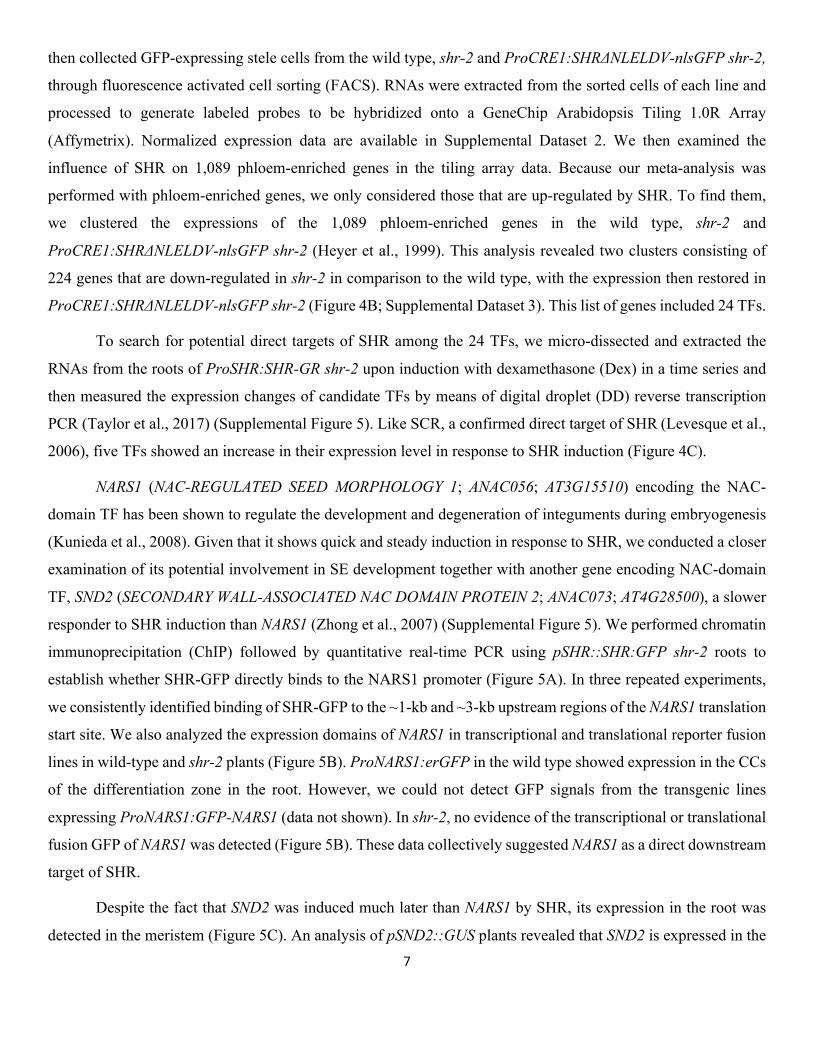
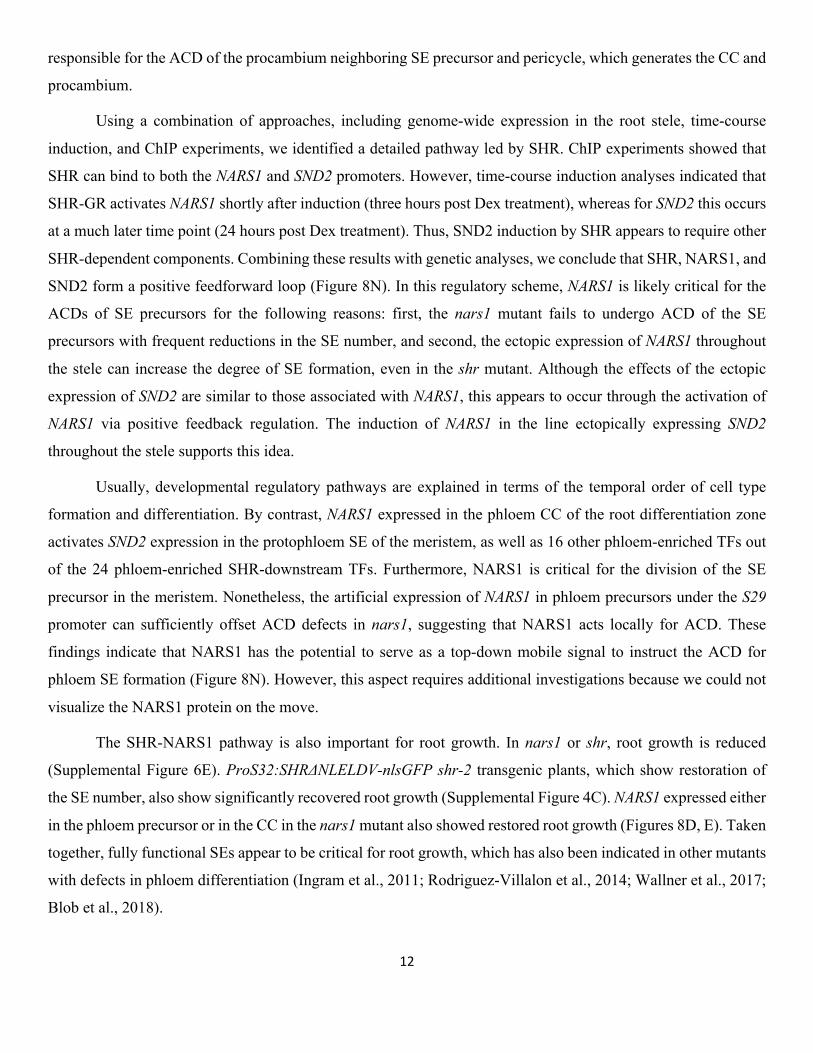
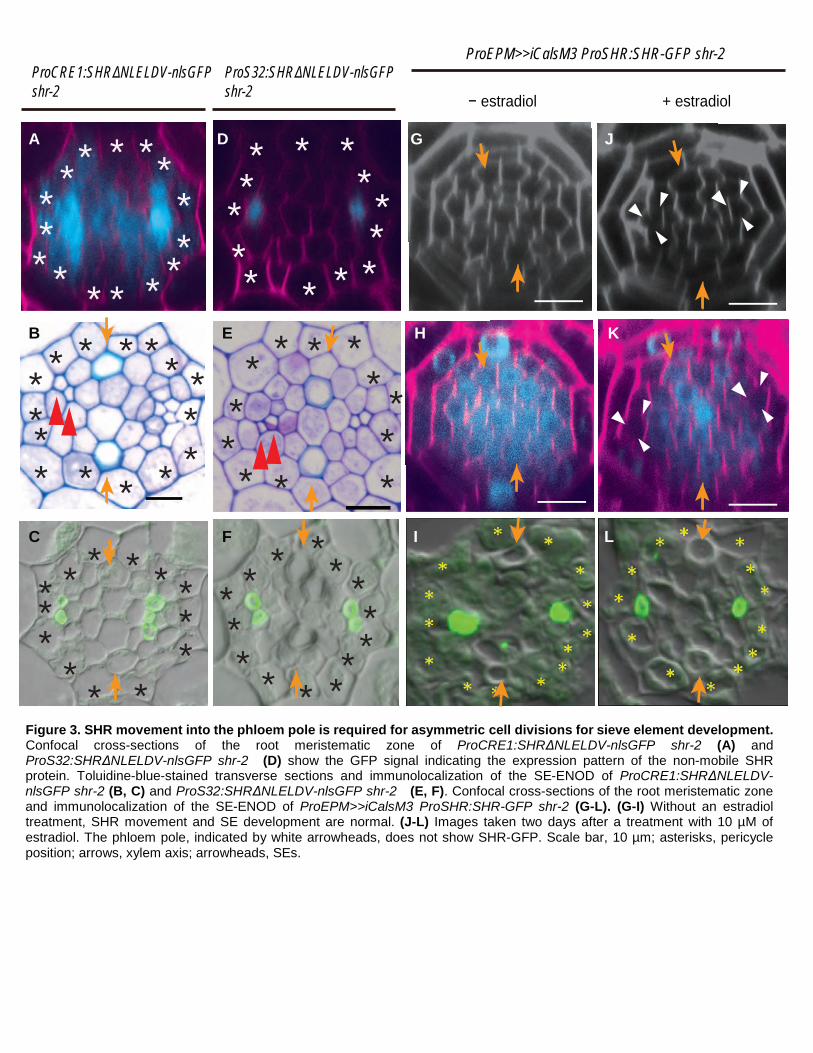
SHR moving into the phloem pole promotes cell division for phloem sieve element formation
Given that bidirectional signaling does not account for the formation of the two SEs, we asked whether
SHR in the stele promotes this process. To address this, we expressed SHR exclusively in the root stele in shr-2
plants. We did this by expressing a non-mobile version of SHR, SHRΔNLELDV, which was fused to GFP with a
nuclear localization signal, under the CRE1 promoter (Figure 3A; Supplemental Figure 4A) (Mahonen et al., 2000;
Carlsbecker et al., 2010). SHRΔNLELDV does not have cell-to-cell mobility but still retains its biological function
6
(Gallagher and Benfey, 2009). In ProCRE1:SHRΔNLELDV-nlsGFP shr-2, we observed partial recovery of the
root growth (Supplemental Figure 4C). Consistent with earlier findings (Carlsbecker et al., 2010), xylem
patterning was not restored in this transgenic line (Supplemental Figure 4B). However, both a histological analysis
and the immunolocalization of SE-ENOD demonstrated an increase in the SE number but not in procambial cells
(Figures 3B, C; Supplemental Figures 2A-C), strongly indicating that SHR in the stele specifically promotes ACD
for SE formation.
In the root meristem, SHR is transcribed in the xylem and procambium but not in the phloem pole cells.
However, subsequently the SHR protein moves into phloem poles. We thus asked whether the movement of SHR
into the phloem is required for ACD and the subsequent formation of SEs. To address this, we expressed
SHRΔNLELDV in the phloem in the shr-2 background using the S32 promoter (Figure 3D). The expression of
ProS32:SHRΔNLELDV-nlsGFP did not significantly mitigate the stele cell proliferation defect in shr-2 (Figure
3E). However, we found that two SEs develop in ProS32:SHRΔNLELDV-nlsGFP shr-2 (Figure 3F). These results
suggest that SHR proteins moving into the phloem pole in the root meristem promote ACD for SE formation.
To corroborate our findings, we created an experimental context in which SHR cannot move into the
phloem pole cells. It was previously shown that excessive callose accumulation at the plasmodesmata can block
SHR movement (Vaten et al., 2011). Consistent with this, when we expressed a gain-of-function mutant of
CALLOSE SYNTHASE 3 (CAL3-M) under the EPM (S29) promoter with estradiol-mediated induction (Lee et al.,
2006; Miyashima et al., 2019), SHR failed to move into the SE initially (Figures 3G, H, J, K). We analyzed the
status of phloem SE development in these transgenic lines further and observed the formation of only one SE
when CAL3-M was induced in the phloem pole (Figures 3I, L). Taken together, our results suggest that SHR
moving into the phloem pole promotes cell division for the formation of the phloem sieve element.
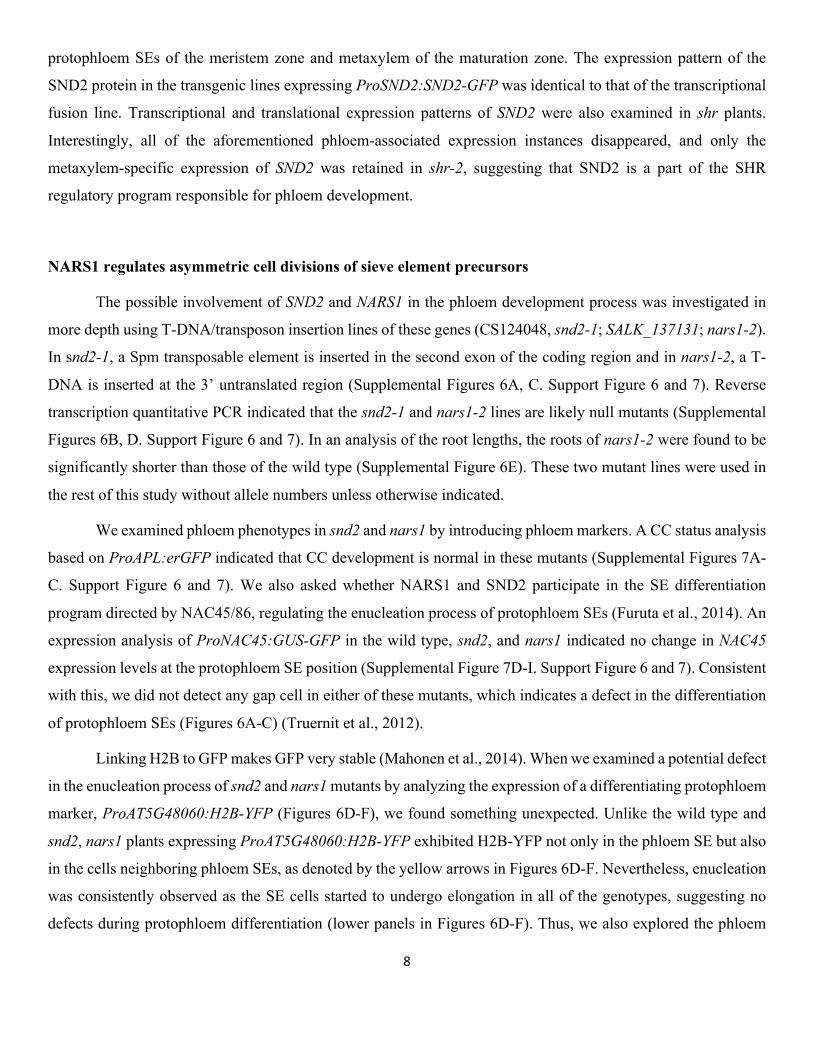
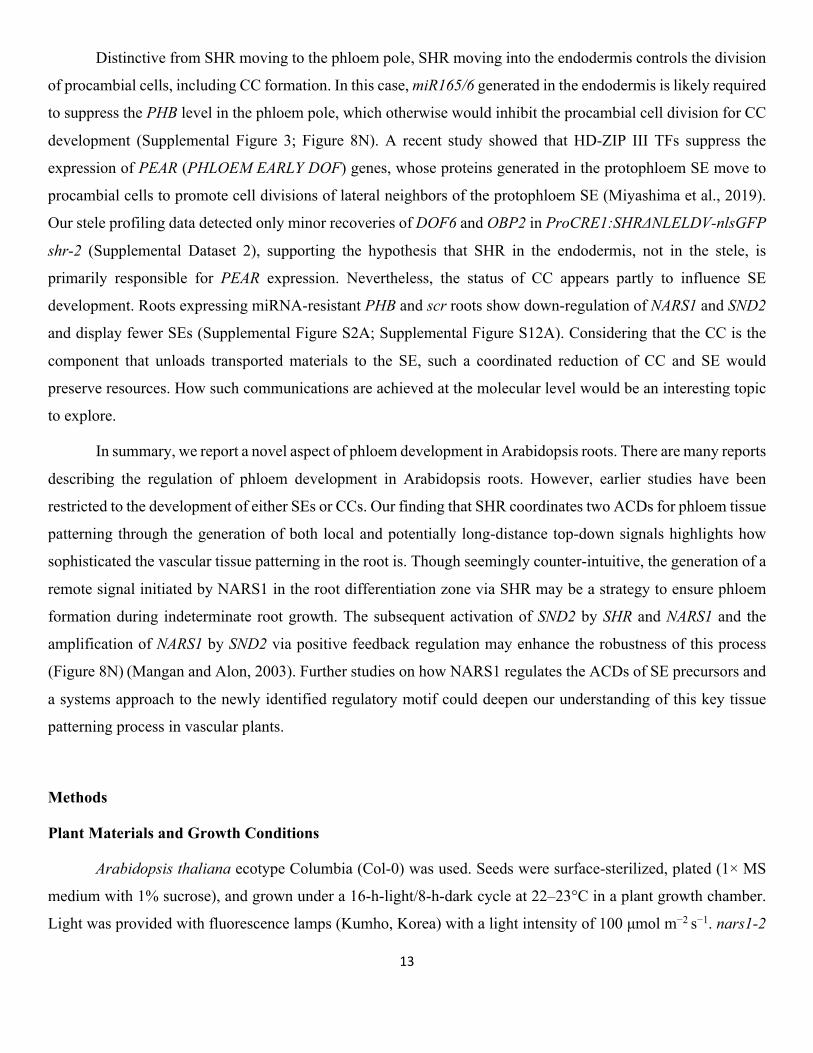
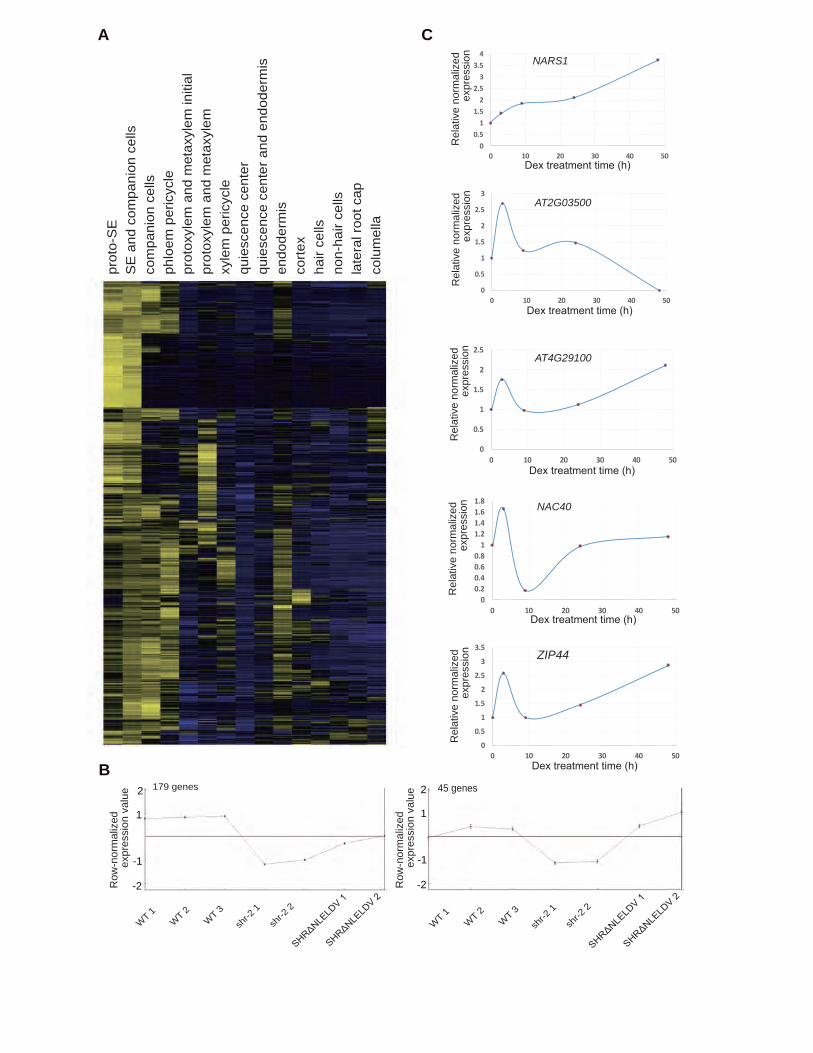
NARS1-SND2 form a downstream pathway of SHR in the phloem
SHR moving into the phloem pole likely regulates the expression of other TFs specifically in the phloem
to drive ACD for the formation of two SEs in the root meristem. To identify these downstream candidate TFs, we
analyzed high-resolution, cell type-specific gene expression data of Arabidopsis roots (Nawy et al., 2005; Lee et
al., 2006; Levesque et al., 2006; Brady et al., 2007; Carlsbecker et al., 2010). First, we selected 1,089 phloem-
enriched genes from cell type-specific data using the criteria of at least three-fold enrichment in phloem cell types
and corrected p-values < 0.001 (Figure 4A).
Next, we generated genome-wide gene expression data for a meta-analysis, as follows. ProCRE1:erGFP
was introduced into wild-type and shr-2 backgrounds to express GFP in the stele cells of the root meristem. We
7
then collected GFP-expressing stele cells from the wild type, shr-2 and ProCRE1:SHRΔNLELDV-nlsGFP shr-2,
through fluorescence activated cell sorting (FACS). RNAs were extracted from the sorted cells of each line and
processed to generate labeled probes to be hybridized onto a GeneChip Arabidopsis Tiling 1.0R Array
(Affymetrix). Normalized expression data are available in Supplemental Dataset 2. We then examined the
influence of SHR on 1,089 phloem-enriched genes in the tiling array data. Because our meta-analysis was
performed with phloem-enriched genes, we only considered those that are up-regulated by SHR. To find them,
we clustered the expressions of the 1,089 phloem-enriched genes in the wild type, shr-2 and
ProCRE1:SHRΔNLELDV-nlsGFP shr-2 (Heyer et al., 1999). This analysis revealed two clusters consisting of
224 genes that are down-regulated in shr-2 in comparison to the wild type, with the expression then restored in
ProCRE1:SHRΔNLELDV-nlsGFP shr-2 (Figure 4B; Supplemental Dataset 3). This list of genes included 24 TFs.
To search for potential direct targets of SHR among the 24 TFs, we micro-dissected and extracted the
RNAs from the roots of ProSHR:SHR-GR shr-2 upon induction with dexamethasone (Dex) in a time series and
then measured the expression changes of candidate TFs by means of digital droplet (DD) reverse transcription
PCR (Taylor et al., 2017) (Supplemental Figure 5). Like SCR, a confirmed direct target of SHR (Levesque et al.,
2006), five TFs showed an increase in their expression level in response to SHR induction (Figure 4C).
NARS1 (NAC-REGULATED SEED MORPHOLOGY 1; ANAC056; AT3G15510) encoding the NAC-
domain TF has been shown to regulate the development and degeneration of integuments during embryogenesis
(Kunieda et al., 2008). Given that it shows quick and steady induction in response to SHR, we conducted a closer
examination of its potential involvement in SE development together with another gene encoding NAC-domain
TF, SND2 (SECONDARY WALL-ASSOCIATED NAC DOMAIN PROTEIN 2; ANAC073; AT4G28500), a slower
responder to SHR induction than NARS1 (Zhong et al., 2007) (Supplemental Figure 5). We performed chromatin
immunoprecipitation (ChIP) followed by quantitative real-time PCR using pSHR::SHR:GFP shr-2 roots to
establish whether SHR-GFP directly binds to the NARS1 promoter (Figure 5A). In three repeated experiments,
we consistently identified binding of SHR-GFP to the ~1-kb and ~3-kb upstream regions of the NARS1 translation
start site. We also analyzed the expression domains of NARS1 in transcriptional and translational reporter fusion
lines in wild-type and shr-2 plants (Figure 5B). ProNARS1:erGFP in the wild type showed expression in the CCs
of the differentiation zone in the root. However, we could not detect GFP signals from the transgenic lines
expressing ProNARS1:GFP-NARS1 (data not shown). In shr-2, no evidence of the transcriptional or translational
fusion GFP of NARS1 was detected (Figure 5B). These data collectively suggested NARS1 as a direct downstream
target of SHR.
Despite the fact that SND2 was induced much later than NARS1 by SHR, its expression in the root was
detected in the meristem (Figure 5C). An analysis of pSND2::GUS plants revealed that SND2 is expressed in the
8
protophloem SEs of the meristem zone and metaxylem of the maturation zone. The expression pattern of the
SND2 protein in the transgenic lines expressing ProSND2:SND2-GFP was identical to that of the transcriptional
fusion line. Transcriptional and translational expression patterns of SND2 were also examined in shr plants.
Interestingly, all of the aforementioned phloem-associated expression instances disappeared, and only the
metaxylem-specific expression of SND2 was retained in shr-2, suggesting that SND2 is a part of the SHR
regulatory program responsible for phloem development.
NARS1 regulates asymmetric cell divisions of sieve element precursors
The possible involvement of SND2 and NARS1 in the phloem development process was investigated in
more depth using T-DNA/transposon insertion lines of these genes (CS124048, snd2-1; SALK_137131; nars1-2).
In snd2-1, a Spm transposable element is inserted in the second exon of the coding region and in nars1-2, a T-
DNA is inserted at the 3’ untranslated region (Supplemental Figures 6A, C. Support Figure 6 and 7). Reverse
transcription quantitative PCR indicated that the snd2-1 and nars1-2 lines are likely null mutants (Supplemental
Figures 6B, D. Support Figure 6 and 7). In an analysis of the root lengths, the roots of nars1-2 were found to be
significantly shorter than those of the wild type (Supplemental Figure 6E). These two mutant lines were used in
the rest of this study without allele numbers unless otherwise indicated.
We examined phloem phenotypes in snd2 and nars1 by introducing phloem markers. A CC status analysis
based on ProAPL:erGFP indicated that CC development is normal in these mutants (Supplemental Figures 7A-
C. Support Figure 6 and 7). We also asked whether NARS1 and SND2 participate in the SE differentiation
program directed by NAC45/86, regulating the enucleation process of protophloem SEs (Furuta et al., 2014). An
expression analysis of ProNAC45:GUS-GFP in the wild type, snd2, and nars1 indicated no change in NAC45
expression levels at the protophloem SE position (Supplemental Figure 7D-I. Support Figure 6 and 7). Consistent
with this, we did not detect any gap cell in either of these mutants, which indicates a defect in the differentiation
of protophloem SEs (Figures 6A-C) (Truernit et al., 2012).
Linking H2B to GFP makes GFP very stable (Mahonen et al., 2014). When we examined a potential defect
in the enucleation process of snd2 and nars1 mutants by analyzing the expression of a differentiating protophloem
marker, ProAT5G48060:H2B-YFP (Figures 6D-F), we found something unexpected. Unlike the wild type and
snd2, nars1 plants expressing ProAT5G48060:H2B-YFP exhibited H2B-YFP not only in the phloem SE but also
in the cells neighboring phloem SEs, as denoted by the yellow arrows in Figures 6D-F. Nevertheless, enucleation
was consistently observed as the SE cells started to undergo elongation in all of the genotypes, suggesting no
defects during protophloem differentiation (lower panels in Figures 6D-F). Thus, we also explored the phloem
9
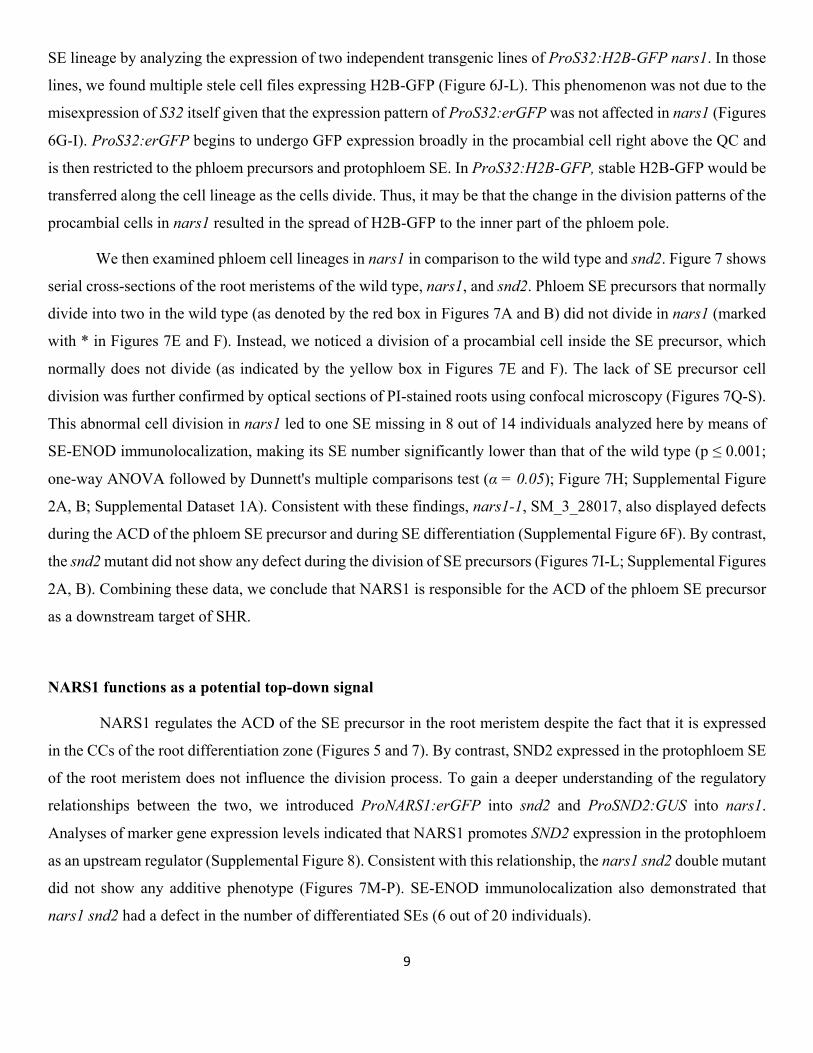
SE lineage by analyzing the expression of two independent transgenic lines of ProS32:H2B-GFP nars1. In those
lines, we found multiple stele cell files expressing H2B-GFP (Figure 6J-L). This phenomenon was not due to the
misexpression of S32 itself given that the expression pattern of ProS32:erGFP was not affected in nars1 (Figures
6G-I). ProS32:erGFP begins to undergo GFP expression broadly in the procambial cell right above the QC and
is then restricted to the phloem precursors and protophloem SE. In ProS32:H2B-GFP, stable H2B-GFP would be
transferred along the cell lineage as the cells divide. Thus, it may be that the change in the division patterns of the
procambial cells in nars1 resulted in the spread of H2B-GFP to the inner part of the phloem pole.
We then examined phloem cell lineages in nars1 in comparison to the wild type and snd2. Figure 7 shows
serial cross-sections of the root meristems of the wild type, nars1, and snd2. Phloem SE precursors that normally
divide into two in the wild type (as denoted by the red box in Figures 7A and B) did not divide in nars1 (marked
with * in Figures 7E and F). Instead, we noticed a division of a procambial cell inside the SE precursor, which
normally does not divide (as indicated by the yellow box in Figures 7E and F). The lack of SE precursor cell
division was further confirmed by optical sections of PI-stained roots using confocal microscopy (Figures 7Q-S).
This abnormal cell division in nars1 led to one SE missing in 8 out of 14 individuals analyzed here by means of
SE-ENOD immunolocalization, making its SE number significantly lower than that of the wild type (p ≤ 0.001;
one-way ANOVA followed by Dunnett's multiple comparisons test (α = 0.05); Figure 7H; Supplemental Figure
2A, B; Supplemental Dataset 1A). Consistent with these findings, nars1-1, SM_3_28017, also displayed defects
during the ACD of the phloem SE precursor and during SE differentiation (Supplemental Figure 6F). By contrast,
the snd2 mutant did not show any defect during the division of SE precursors (Figures 7I-L; Supplemental Figures
2A, B). Combining these data, we conclude that NARS1 is responsible for the ACD of the phloem SE precursor
as a downstream target of SHR.
NARS1 functions as a potential top-down signal
NARS1 regulates the ACD of the SE precursor in the root meristem despite the fact that it is expressed
in the CCs of the root differentiation zone (Figures 5 and 7). By contrast, SND2 expressed in the protophloem SE
of the root meristem does not influence the division process. To gain a deeper understanding of the regulatory
relationships between the two, we introduced ProNARS1:erGFP into snd2 and ProSND2:GUS into nars1.
Analyses of marker gene expression levels indicated that NARS1 promotes SND2 expression in the protophloem
as an upstream regulator (Supplemental Figure 8). Consistent with this relationship, the nars1 snd2 double mutant
did not show any additive phenotype (Figures 7M-P). SE-ENOD immunolocalization also demonstrated that
nars1 snd2 had a defect in the number of differentiated SEs (6 out of 20 individuals).
10
We then asked how NARS1 produced in the CCs of the root differentiation zone can act during the ACD
of the SE precursors. To visualize NARS1 translationally fused with GFP, we chose N-terminal tagged GFP
because we failed to detect a GFP signal when we expressed GFP fused to the C-terminus of NARS1, even under
the CRE1 promoter (see below). Unfortunately, GFP fused to NARS1 during translational fusion under the
NARS1 promoter was undetectable. Thus, we expressed GFP-NARS1 under two strong phloem specific promoters,
S29 and SUC2, in the nars1 background (Figures 8A-E). The S29 (PEAR1, AT2G37590) promoter drives the
expression in the phloem precursors of the root meristem (Lee et al., 2006), and SUC2 drives the expression in
the CCs of the root differentiation zone, slightly earlier than the NARS1 promoter (Supplemental Figure 9C). We
detected nuclear-localized GFP-NARS1 expression under the S29 promoter in phloem precursors (Figure 8A). In
ProSUC2:GFP-NARS1 nars1 plants, however, we did not find GFP in the CC, instead finding punctate
fluorescence in the stele (Figures 8B, C). Nevertheless, both lines showed full recovery of the SE precursor
division in the meristem (14 observed for ProS29:GFP-NARS1; 21 observed for ProSUC2:GFP-NARS1; Figures
8A, B) and root growth (p<0.001 according to a Student's t-test; Figures 8D, E).
Taken together, these data indicate that NARS1, generated in the CCs of the differentiation zone, functions
as a top-down signal, either as a mobile factor itself or as a trigger of another mobile signal that locally regulates
the ACD of SE precursors (Figure 8N). Because GFP-NARS1 in ProSUC2:GFP-NARS1 nars1 could not be
visually inspected, we tested this hypothesis indirectly by analyzing the influence of NARS1 on the expression
of SHR-downstream TFs in the phloem. Specifically, we micro-dissected 1-mm-long root tips of nars1,
ProSUC2:GFP-NARS1 nars1 and ProS29:GFP-NARS1 nars1 so that we could exclude most regions where the
SUC2 promoter drives NARS1 expression, after which we extracted small amounts of RNA for each genotype.
Then, using Droplet Digital reverse transcription PCR (DD-PCR), we quantified and compared the transcript
levels of SHR-downstream phloem TFs in ProSUC2:GFP-NARS1 nars1 and ProS29:GFP-NARS1 nars1 against
those in nars1. In this analysis, 17 out of 24 SHR-downstream phloem TFs were upregulated in ProSUC2:GFP-
NARS1 nars1, and only six of these were also upregulated in ProS29:GFP-NARS1 nars1 (Supplemental Figure
9A). Interestingly, SND2 was induced only in ProSUC2:GFP-NARS1 nars1 but not in ProS29:GFP-NARS1 nars1.
Furthermore, the expression domain of 17 downstream TFs in the cell-type-specific root expression data indicated
that TFs upregulated by ProSUC2:GFP-NARS1 are not limited to the phloem starting in the root differentiation
zone (Supplemental Figure 9B). Taken together, NARS1 expressed in the CC appears to facilitate its control of
phloem-enriched TFs within a broad range.

11
Positive feedforward loop in action for phloem sieve element development
The significance of NARS1 with regard to SE development was further addressed by analyzing the SE
status using SE-ENOD immunolocalization in transgenic roots expressing NARS1 throughout the stele under the
CRE1 promoter. Five out of 22 transgenic plants with ProCRE1:GFP-NARS1 showed more than two SEs in each
phloem pole (Figures 8F-H). Furthermore, ProCRE1:GFP-NARS1 in shr-2 resulted in the significant restoration
of the SE number (Figures 8L, M; Supplemental Figures S2A, B). Interestingly, SND2 expressed under the CRE1
promoter also showed an increase in phloem SEs (6 out of 27; Figures 8I-K). Consistent with the SE-ENOD
immunolocalization outcome, we observed the expansion of the ProAPL:erGFP domain in roots expressing
ProCRE1:SND2 and ProCRE1:NARS1 (Supplemental Figure 10). However, ProSUC2:erGFP was not affected
by ectopic SND2 or NARS1 expression (Supplemental Figure 11).
The snd2 mutant does not affect the SE number despite the fact that ectopically expressed SND2 can do
so. Thus, we asked whether such a phenomenon occurs because SND2 can amplify NARS1 expression via positive
feedback regulation. Indeed, we found upregulation of NARS1 transcript by three-fold in roots expressing
ProCRE1:SND2-GFP in comparison to non-transgenic Col-0 roots (Supplemental Figure 12B). In addition, ChIP
followed by quantitative real-time PCR of ProSHR:SHR-GFP roots against the upstream intergenic region of
SND2 indicated the binding of SHR to the SND2 promoter (Supplemental Figure 12C). Our time-course analysis
of ProSHR:SHR-GR demonstrated the induction of SND2 at a time point much later than that of NARS1. Thus,
this result indicates that SHR directly regulates SND2 expression in the presence of other SHR-dependent
component(s).
Lastly, we asked whether the NARS1 pathway is affected when CC development is perturbed via the SHR-
SCR-miR165/6 pathway. We examined this by measuring NARS1 and SND2 in scr-4 and ProCRE1:PHBem-GFP
roots (Supplemental Figure 12A). Indeed, their expression levels were significantly reduced in both of these
genetic backgrounds. Together, these results indicate that while the ACD of a SE precursor is primarily via the
direct regulation of NARS1 by SHR in the root stele, it partly depends on proper CC development as mediated via
SHR in the endodermis.
Discussion
In the Arabidopsis root, phloem SEs and CCs are generated by the ACDs of different precursors rather
than a single precursor (Baum et al., 2002; Bonke et al., 2003). However, their development is highly coordinated.
In this study, we report how such coordination is achieved via SHR movements. SHR that moves into the phloem
pole is primarily responsible for the ACD of the SE precursor, while SHR moving into the endodermis is
12
responsible for the ACD of the procambium neighboring SE precursor and pericycle, which generates the CC and
procambium.
Using a combination of approaches, including genome-wide expression in the root stele, time-course
induction, and ChIP experiments, we identified a detailed pathway led by SHR. ChIP experiments showed that
SHR can bind to both the NARS1 and SND2 promoters. However, time-course induction analyses indicated that
SHR-GR activates NARS1 shortly after induction (three hours post Dex treatment), whereas for SND2 this occurs
at a much later time point (24 hours post Dex treatment). Thus, SND2 induction by SHR appears to require other
SHR-dependent components. Combining these results with genetic analyses, we conclude that SHR, NARS1, and
SND2 form a positive feedforward loop (Figure 8N). In this regulatory scheme, NARS1 is likely critical for the
ACDs of SE precursors for the following reasons: first, the nars1 mutant fails to undergo ACD of the SE
precursors with frequent reductions in the SE number, and second, the ectopic expression of NARS1 throughout
the stele can increase the degree of SE formation, even in the shr mutant. Although the effects of the ectopic
expression of SND2 are similar to those associated with NARS1, this appears to occur through the activation of
NARS1 via positive feedback regulation. The induction of NARS1 in the line ectopically expressing SND2
throughout the stele supports this idea.
Usually, developmental regulatory pathways are explained in terms of the temporal order of cell type
formation and differentiation. By contrast, NARS1 expressed in the phloem CC of the root differentiation zone
activates SND2 expression in the protophloem SE of the meristem, as well as 16 other phloem-enriched TFs out
of the 24 phloem-enriched SHR-downstream TFs. Furthermore, NARS1 is critical for the division of the SE
precursor in the meristem. Nonetheless, the artificial expression of NARS1 in phloem precursors under the S29
promoter can sufficiently offset ACD defects in nars1, suggesting that NARS1 acts locally for ACD. These
findings indicate that NARS1 has the potential to serve as a top-down mobile signal to instruct the ACD for
phloem SE formation (Figure 8N). However, this aspect requires additional investigations because we could not
visualize the NARS1 protein on the move.
The SHR-NARS1 pathway is also important for root growth. In nars1 or shr, root growth is reduced
(Supplemental Figure 6E). ProS32:SHRΔNLELDV-nlsGFP shr-2 transgenic plants, which show restoration of
the SE number, also show significantly recovered root growth (Supplemental Figure 4C). NARS1 expressed either
in the phloem precursor or in the CC in the nars1 mutant also showed restored root growth (Figures 8D, E). Taken
together, fully functional SEs appear to be critical for root growth, which has also been indicated in other mutants
with defects in phloem differentiation (Ingram et al., 2011; Rodriguez-Villalon et al., 2014; Wallner et al., 2017;
Blob et al., 2018).
13
Distinctive from SHR moving to the phloem pole, SHR moving into the endodermis controls the division
of procambial cells, including CC formation. In this case, miR165/6 generated in the endodermis is likely required
to suppress the PHB level in the phloem pole, which otherwise would inhibit the procambial cell division for CC
development (Supplemental Figure 3; Figure 8N). A recent study showed that HD-ZIP III TFs suppress the
expression of PEAR (PHLOEM EARLY DOF) genes, whose proteins generated in the protophloem SE move to
procambial cells to promote cell divisions of lateral neighbors of the protophloem SE (Miyashima et al., 2019).
Our stele profiling data detected only minor recoveries of DOF6 and OBP2 in ProCRE1:SHRΔNLELDV-nlsGFP
shr-2 (Supplemental Dataset 2), supporting the hypothesis that SHR in the endodermis, not in the stele, is
primarily responsible for PEAR expression. Nevertheless, the status of CC appears partly to influence SE
development. Roots expressing miRNA-resistant PHB and scr roots show down-regulation of NARS1 and SND2
and display fewer SEs (Supplemental Figure S2A; Supplemental Figure S12A). Considering that the CC is the
component that unloads transported materials to the SE, such a coordinated reduction of CC and SE would
preserve resources. How such communications are achieved at the molecular level would be an interesting topic
to explore.
In summary, we report a novel aspect of phloem development in Arabidopsis roots. There are many reports
describing the regulation of phloem development in Arabidopsis roots. However, earlier studies have been
restricted to the development of either SEs or CCs. Our finding that SHR coordinates two ACDs for phloem tissue
patterning through the generation of both local and potentially long-distance top-down signals highlights how
sophisticated the vascular tissue patterning in the root is. Though seemingly counter-intuitive, the generation of a
remote signal initiated by NARS1 in the root differentiation zone via SHR may be a strategy to ensure phloem
formation during indeterminate root growth. The subsequent activation of SND2 by SHR and NARS1 and the
amplification of NARS1 by SND2 via positive feedback regulation may enhance the robustness of this process
(Figure 8N) (Mangan and Alon, 2003). Further studies on how NARS1 regulates the ACDs of SE precursors and
a systems approach to the newly identified regulatory motif could deepen our understanding of this key tissue
patterning process in vascular plants.
Methods
Plant Materials and Growth Conditions
Arabidopsis thaliana ecotype Columbia (Col-0) was used. Seeds were surface-sterilized, plated (1× MS
medium with 1% sucrose), and grown under a 16-h-light/8-h-dark cycle at 22–23°C in a plant growth chamber.
Light was provided with fluorescence lamps (Kumho, Korea) with a light intensity of 100 μmol m−2 s−1. nars1-2
14
(SALK_137131) and snd2-1 (CS124048) were obtained from the Arabidopsis Biological Resources Center
(ABRC). Primers used for PCR-based genotyping are listed in Supplemental Table 4. The following marker lines
were described previously: ProNAC45:GUS-GFP (Furuta et al., 2014), ProAPL:erGFP (Bonke et al., 2003), and
ProSUC2:erGFP (Stadler and Sauer, 1996).
Plasmid Construction
Gateway cloning technology (Invitrogen) was used for DNA manipulations. The methods used for the
generation of the S29, S32 and CRE1 promoters in pDONR P4_P1R was previously described (Lee et al., 2006;
Carlsbecker et al., 2010). PHB cDNA was cloned into pDONR221 and mutagenized to PHBm as previously
described (Carlsbecker et al., 2010). SHRΔNLELDV was amplified from the plasmid containing SHRΔNLELDV
and cloned into pDONR221 (Gallagher and Benfey, 2009). GFP:nosT and nlsGFP for C-terminus translational
fusion were cloned into pDONR P2R_P3 by means of BP recombination. ProS32:PHBm-GFP was constructed
into dpGreen-Bar by Multisite Gateway LR recombination. pCRE1::SHRΔNLELDV:nlsGFP and
ProS32:SHRΔNLELDV-nlsGFP were constructed into dpGreen-BarT, which is the dpGreen-Bar vector with the
terminator attached.
The NARS1 and SND2 promoter regions were amplified from Arabidopsis Col-0 genomic DNA by PCR
and inserted into pDONR P4_P1R via a BP reaction. SND2 cDNA was amplified by reverse transcription PCR
and then cloned into pDONR221 and NARS1 cDNA was cloned into both pDONR221 and pDONR P2R_P3 by
a BP reaction. Other components, in this case GFP, GUS and erGFP were cloned into pDONR221 and pDONR
P2R_P3 by a BP reaction. ProSND2:SND2-erGFP and ProSND2:GUS were constructed into dpGreen-KanT,
and ProCRE1:SND2, ProCRE1:SND2-GFP, ProCRE1:NARS1, ProCRE1:GFP-NARS1, ProS29:GFP-NARS1
ProNARS1:erGFP, and ProNARS1:GFP-NARS1 were constructed into dpGreen-BarT by means of Multisite
Gateway LR recombination. All clones in the binary vector were transformed into Agrobacterium GV3101 with
pSOUP for Arabidopsis transformation by floral dipping (Clough and Bent, 1998).
Confocal microscopy
All seedling samples were collected at 5–6 days after transfer to the growth chamber (DAT). Confocal images
were obtained using a Zeiss laser scanning confocal microscope (LSM700), a Leica TCS SP5 laser scanning
confocal microscope, and a Leica TCS SP8 with preset emission/excitation wavelengths of 488 nm/505 to 530
nm for GFP or Alexa Fluor® 488, and 561 nm/591 to 635 nm for propidium iodide (PI).
15
GUS staining analysis, embedding and sectioning
6-DAT seedlings were incubated in GUS staining solution [100 mM NaPO4 (pH 7.0), 1 mM 5-bromo-4-chloro-
3-indolyl-glucuronide, 0.5 mM potassium ferricyanide and 0.2% Triton X-100] at 37°C for 8 hrs. The samples
were then washed with 100 mM NaPO4 (pH 7.0) and incubated in 70% EtOH for one day at 4°C. For transverse
sectioning, Arabidopsis roots were fixed in PBS buffer containing 4% paraformaldehyde for 2 h at room
temperature. The samples were then dehydrated in a graded series of ethanol (25, 50, 75 and 100% (v/v) in PBS
buffer) for 1 h. The dehydrated samples were sequentially incubated in a series of Technovit 8100 cold-
polymerizing resin [33, 66 and 100% (v/v) in EtOH] for 3 h each. Sections (3 μm) were taken from the solidified
samples with a sectioning machine (RM2255, Leica). For toluidine blue staining, sections were stained with 0.05 %
toluidine blue (pH 4.4). Images were imaged with an Axioimager M1 (Zeiss).
Immunostaining of sieve-element-specific SE-ENOD
Two approaches for tissue preparation were utilized in these experiments. One tissue preparation method was
performed as described previously using seedlings collected at 5 or 6 DAT (Paciorek et al., 2006). The primary
antibody SE-ENOD (Khan et al., 2007) was diluted at a ratio of 1:100 into a blocking solution and incubated for
1.5 h at 37 °C. The secondary antibody Alexa Fluor® 488 F(ab')2 Fragment of Goat Anti-Mouse IgG, IgM (H+L)
(cat# A-11001, Thermo Fisher) was diluted at a ratio of 1:200 in a blocking solution and incubated for 1 h at room
temperature. The microscope slides were mounted with antifadent AF1 (Citifluor Ltd.) and examined under a
laser scanning confocal microscope with an emission/excitation wavelength of 488 nm/505 to 530 nm.
The other tissue preparation method involved sectioning 5- to 6-DAT seedling roots using a vibratome (Leica
VT1000S). Seedlings were sectioned after fixing them for 20 min in 4% paraformaldehyde dissolved in 1x PBS.
The root sections were incubated for 30 min at room temperature in a blocking solution (2% of bovine serum
albumin (Sigma-Aldrich) dissolved in 1x PBS). The primary antibody SE-ENOD (early nodulin (ENOD)-like
protein 9 (AT3G20570; Anti-Phloem Sieve Element [RS6] antibody, cat# EIW201, Kerafast) was diluted at a
ratio of 1:100 into a blocking solution and incubated overnight at 4°C. The secondary antibody Alexa Fluor® 488
F(ab')2 Fragment of Goat Anti-Mouse IgG, IgM (H+L) (cat# A-11001, Life Technologies) was diluted at a ratio
of 1:200 in a blocking solution and incubated for 1 h at room temperature. The root sections were placed on slide
glasses, stained with Calcofluor white 2MR (Sigma-Aldrich), and imaged under a laser scanning confocal
microscope (Zeiss LSM700) with emission/excitation wavelengths of 488 nm/505 to 530 nm for Alexa Fluor®
488 and 349 nm/420nm for Calcofluor white 2MR.
16
For estradiol-induced callose synthesis, seedlings were grown for three days on regular MS media and then
transferred to MS supplemented with 10 μM of estradiol. Immunolocalization and confocal imaging were
performed in two days after the estradiol treatment.
Microarray Experiments
All seedling samples were collected at 6 DAT and the bottom halves of the roots were cut and harvested.
Protoplast preparation and FACS facilitated cell sorting were done as described (Birnbaum et al., 2005). Total
RNA was isolated using the RNeasy Plant Mini Kit (Qiagen). RNA integrity was determined on a bioanalyzer
(Agilent BioAnalyzer 2100). Probe preparation was carried out according to the manufacturer’s instructions
(GeneChip Whole Transcript Double-Stranded Target Assay Manual from Affymetrix Inc.), after which
biotinylated double-stranded DNA probes were hybridized to Arabidopsis Tiling 1.0R arrays (Affymetrix Inc.).
Two to three biological replicates were generated.
Microarray Analysis
To isolate the genes involved in the phloem regulatory networks, we compared gene expression data among
phloem SE (S32), SE and companion cells (APL), companion cells (SUC2), the phloem pole pericycle (S17),
protoxylem and metaxylem initials (S4), the protoxylem and metaxylem (S18), the xylem pericycle (J0121), the
quiescence center (AGL42), the quiescence center and endodermis (scr5), the endodermis (E30), the cortex
(CORTEX), hair cells (COBL9), non-hair cells (gl2), the lateral root cap (LRC), and columella (pet111) (Nawy
et al., 2005; Lee et al., 2006; Levesque et al., 2006; Brady et al., 2007; Carlsbecker et al., 2010) using the LIMMA
package (Smyth, 2004). We identified 1,089 genes that are enriched in S32 and/or the APL cell file (fold
enrichment >3; corrected p-value < 0.001).
Microarray data from the tiling 1.0R array CDF that contains gene-specific single-copy exonic probe sets were
normalized using the RMA algorithm in BIOCONDUCTOR (Irizarry et al., 2003; Naouar et al., 2009). High-
correlation coefficients were confirmed within biological replicate data. The aforementioned 1,089 phloem-
enriched genes were then examined with regard to their expression levels in the wild type, shr-2, and
ProCRE1:SHRΔNLELDV-nlsGFP shr-2. Quality threshold (QT) clustering of differentially expressed genes was
performed and the results were visualized using MultiExperiment Viewer (Saeed AI, 2006).
17
Reverse transcription quantitative PCR analysis
To analyze the expression level of SND2 in snd2 mutant plants, reverse transcription quantitative PCR analyses
were carried out using total RNAs extracted from 7-DAT root tissues in Col-0, snd2, nars1 plants. Total RNA
extraction was performed with an RNeasy plant mini-prep kit according to the manufacturer’s instructions
(Qiagen). A 20-µL reverse-transcript reaction was conducted for the first cDNA strand synthesis using 1µg of
total RNAs and Superscript III reverse transcriptase (Invitrogen). After the completion of the reverse-transcription
reaction, the cDNA template was diluted fivefold by adding 80 µL of ddH2O, and 1 µL of cDNA template was
used for a 10-µL quantitative PCR reaction. For the quantitative PCR reactions, a master mix was prepared using
iQTM SYBR Green Supermix (Bio-Rad) and a PCR reaction and fluorescence detection were performed using a
CFX96 real-time PCR machine (Bio-Rad). GAPDH was used as an internal control gene for this analysis. Primer
sequences are provided in Supplemental Dataset 4.
Droplet digital reverse transcription PCR (DD-PCR) analysis
To quantify the expression changes of the 24 TFs downstream of SHR in the NARS1 complementation lines, seeds
of nars1, ProSUC2:GFP-NARS1 nars1, and ProS29:GFP-NARS1 nars1 were germinated and grown on MS agar
media with 1% sucrose for five days. Segments of root tips approximately 1 mm long were dissected and collected
from each genotype and the total RNA was then isolated from these using RNeasy Plant Mini Kits (QIAGEN).
Here, 0.3 μg of total RNA was used for reverse transcription with SuperScript III reverse transcriptase (Invitrogen),
as described above.
To quantify the expression of the phloem-enriched SHR-regulated TFs in response to the active form of SHR,
four-day-old seedlings of SHR:SHR-GR shr-2 were treated with 10 µM of dexamethasone. Total RNA was
isolated from different root samples treated with dexamethasone for 0 h, 3 h, 9 h, 24 h and 48 h. DD-PCR was
performed as per the method described below. The GR gene was used as a loading control.
Each 20-µl DD-PCR reaction mixture contained 1× EvaGreen ddPCR Supermix (Bio-Rad), gene-specific primers
(Supplemental Dataset 4), and 2.5 μl of the cDNA sample (4 ng). 70 μl of Droplet Generation Oil (Bio-Rad) was
mixed into each reaction mixture so that 20 µl of the DD-PCR reaction mixture could be segregated into 14,000
~ 17,000 droplets using a QX200 droplet generator (Bio-Rad). All droplets, at approximately 40 µl, were
transferred to 96-well plates (Bio-Rad). The PCR steps were performed in a T100 thermal cycler (Bio-Rad) with
the following cycling conditions: one cycle at 94°C for 3 min, 40 cycles of 94°C for 30 s, 61°C for 45 s, and 72°C
for 60 s, and followed by one cycle of 4°C for 5 min and 90°C for 5 min. The ramping rate was set to 2°C/s
18
throughout the cycles. After PCR was complete, the fluorescence intensity of the droplets was measured with a
QX200 droplet reader (Bio-Rad). With QuantaSoft droplet reader software (Bio-Rad), both positive and negative
droplet populations were detected and a data analysis was conducted. Via the Poisson statistics, the target mRNA
concentrations were determined, with background-correction performed based on non-template control data. The
absolute transcript levels were calculated in copies/μl of the PCR reaction mixture.
Chromatin immunoprecipitation analysis
Amounts of 1.3 mg of root samples were collected from 5-DAT ProSHR:SHR-GFP shr-2 plants for a ChIP
analysis. These samples were fixed in PBS buffer containing 1% formaldehyde and 5 mM EDTA for 10 min at
room temperature. After fixation and upon the addition of 2.5 M glycine solution and then washing twice with
PBS containing 5 mM EDTA, the samples were ground in liquid nitrogen and resuspended in an extraction
solution [50mM Tris-HCl, pH7.5, 150 mM NaCl, 1% Triton X-100, 0.1% Na deoxycholate, 2.5 mM EDTA, 10%
glycerol, supplemented with a 1X protease inhibitor cocktail (Sigma) and 1 mM PMSF (Sigma)]. Sonication was
performed eight times each for five seconds at 35-40% amplitude (Branson Sonifier 250D). GFP antibody (ab290,
Abcam) and Protein A agarose (Upstate) underwent precipitation at 4 °C overnight. After washing with a low-
salt washing buffer, a high-salt washing buffer, and a LiCl washing buffer (low-salt washing buffer; 150 mM
NaCl, 0.2% SDS, 0.5% Triton X-100, 2mM EDTA, and 20mM Tris-HCl pH 8, high-salt washing buffer; 500 mM
NaCl, 0.2% SDS, 0.5% Triton X-100, 2mM EDTA, and 20mM Tris-HCl pH 8, LiCl washing buffer; 0.25 M LiCl,
0.5% NP-40, 0.5% sodium deoxycholate, 1mM EDTA 10mM Tris-HCl pH 8), DNA was collected by ethanol
precipitation. The NARS1 and SND2 promoter enrichment outcome was analyzed by quantitative PCR using a
master mix which was prepared using iQTM SYBR Green Supermix (Bio-Rad). PCR reaction and fluorescence
detection were performed using a CFX96 real-time PCR machine (Bio-Rad) with the following conditions: one
cycle at 94°C for 3 min, 39 cycles of 94°C for 30 s, 57°C for 45 s, and 72°C for 60 s followed by one melt curve
cycle of 65°C to 95°C with a temperature increment of 0.5°C for 5 s. The ramping rate was set to 2°C/s throughout
the cycles with three technical replicates. Details of the primer sequence are described in Supplemental Dataset
4.
Statistical analysis
The statistical analysis was performed using one-way ANOVA, followed by Dunnett's multiple comparisons test
(α = 0.05), to compare each sample against the WT control (Col-0). Data were expressed as Mean ± SEM.
19
Statistical significance was expressed as follows: ****p ≤ 0.0001, ***p ≤ 0.001, **p ≤ 0.01, *p ≤ 0.05 and non-
significant (ns, p > 0.05). n denotes the number of samples. All analyses were done using GraphPad PRISM
v.8.3.1.
Accession Numbers
Microarray data are available in the GEO database under accession number GSE130061.
Supplemental Data
Supplemental Figure 1. Aniline blue staining for sieve plates in the phloem SEs and SHR expression.
Supplemental Figure 2. Quantification and classification of phloem SE development and stele cell counting.
Supplemental Figure 3. PHB expression in the phloem pole suppresses the stele cell proliferation activity in shr-
2 phb-6.
Supplemental Figure 4. SHR expression in the stele affects root growth.
Supplemental Figure 5. Expression dynamics of SHR-dependent phloem-enriched transcription factors in
response to SHR induction.
Supplemental Figure 6. Characterization of snd2 and nars1 mutants.
Supplemental Figure 7. Comparisons of phloem development among the wild type, snd2 and nars1.
Supplemental Figure 8. Expression patterns of NARS1 and its effect on SND2.
Supplemental Figure 9. NARS1 regulates the most phloem-enriched TFs that are downstream of SHR.
Supplemental Figure 10. Promotion of cell divisions for phloem sieve element formation by NARS1 and SND2.
Supplemental Figure 11. Analysis of companion cell development in transgenic plants ectopically expressing
NARS1 and SND2.
Supplemental Figure 12. Dissection of the SHR-NARS1-SND2 pathway.
Supplemental Dataset 1. ANOVA of the numbers of phloem SEs and stele cells scored in selected genotypes

20
Supplemental Dataset 2. Normalized expression data in the root stele of wild type (wt), shr-2, and
ProCRE1:SHRΔNLELDV-nlsGFP shr-2 (SHRΔNLELDV)
Supplemental Dataset 3. Phloem-enriched genes upregulated by SHR in the stele
Supplemental Dataset 4. List of primers used in this study
Acknowledgements
We thank Dr. Nam Hoang for the proofreading of the manuscript and for assisting with the statistics, Dr.
Muhammad Kamran for the proofreading of the manuscript and Dr. Chulmin Park for assisting with the imaging
steps. This work was supported by funding from the National Research Foundation of Korea (NRF-
2016R1A2B2015258 and 2018R1A5A1023599) to J-Y. Lee. H.K. and K.H.R. were supported by the Brain Korea
21 Plus Program, and H.K. was supported by the WooDuk Foundation.
Author contributions
J.Z. and J.-Y.L. conceptualized, investigated, and analyzed data pertaining to the involvement of SHR in the
phloem development process; H.K. and J.-Y.L. conceptualized, investigated, and analyzed data related to the
involvement of NARS1 and SND2; D.K., G.J., K.H.R., and J.S. contributed to the compilation of the data; S.M.
and Y.H. contributed unpublished plant materials and data; J.Z., H.K., G.J., J.S., D.K., S.M., Y.H. and J.-Y.L.
contributed to the writing of the manuscript. All authors read and approved of the final manuscript.
References
Abrash, E.B., and Bergmann, D.C. (2009). Asymmetric Cell Divisions: A View from Plant Development. Dev. Cell 16, 783-796.
Baum, S.F., Dubrovsky, J.G., and Rost, T.L. (2002). Apical organization and maturation of the cortex and vascular cylinder in Arabidopsis thaliana (Brassicaceae) roots. Am. J. Bot. 89, 908-920.
Berger, F., Haseloff, J., Schiefelbein, J., and Dolan, L. (1998). Positional information in root epidermis is defined during embryogenesis and acts in domains with strict boundaries. Curr. Biol. 8, 421-430.
Birnbaum, K., Jung, J.W., Wang, J.Y., Lambert, G.M., Hirst, J.A., Galbraith, D.W., and Benfey, P.N. (2005). Cell type-specific expression profiling in plants via cell sorting of protoplasts from fluorescent reporter lines. Nat. Methods 2, 615-619.

21
Blob, B., Heo, J.O., and Helariutta, Y. (2018). Phloem differentiation: an integrative model for cell specification. J. Plant Res. 131, 31-36.
Bonke, M., Thitamadee, S., Mahonen, A.P., Hauser, M.-T., and Helariutta, Y. (2003). APL regulates vascular tissue identity in Arabidopsis. Nature 426, 181-186.
Brady, S.M., Orlando, D.A., Lee, J.Y., Wang, J.Y., Koch, J., Dinneny, J.R., Mace, D., Ohler, U., and Benfey, P.N. (2007). A high-resolution root spatiotemporal map reveals dominant expression patterns. Science 318, 801-806.
Carlsbecker, A., Lee, J.-Y., Roberts, C.J., Dettmer, J., Lehesranta, S., Zhou, J., Lindgren, O., Moreno-Risueno, M.A., Vatén, A., Thitamadee, S., Campilho, A., Sebastian, J., Bowman, J.L., Helariutta, Y., and Benfey, P.N. (2010). Cell signalling by microRNA165/6 directs gene dose-dependent root cell fate. Nature 465, 316-321.
Clough, S.J., and Andrew F. Bent. (1998). Floral dip: a simplified method for Agrobacterium-mediated transformation of Arabidopsis thaliana. Plant J. 16, 735-743.
De Smet, I., and Beeckman, T. (2011). Asymmetric cell division in land plants and algae: the driving force for differentiation. Nat. Rev. Mol. Cell Biol. 12, 177-188.
Furuta, K.M., Yadav, S.R., Lehesranta, S., Belevich, I., Miyashima, S., Heo, J.O., Vaten, A., Lindgren, O., De Rybel, B., Van Isterdael, G., Somervuo, P., Lichtenberger, R., Rocha, R., Thitamadee, S., Tahtiharju, S., Auvinen, P., Beeckman, T., Jokitalo, E., and Helariutta, Y. (2014). Arabidopsis NAC45/86 direct sieve element morphogenesis culminating in enucleation. Science 345, 933-937.
Gallagher, K.L., and Benfey, P.N. (2009). Both the conserved GRAS domain and nuclear localization are required for SHORT-ROOT movement. Plant J. 57, 785-797.
Hayashi, H., Fukuda, A., Suzui, N., and Fujimaki, S. (2000). Proteins in the sieve element-companion cell complexes: their detection, localization and possible functions. Aust. J. Plant Physiol. 27, 489-496.
Helariutta, Y., Fukaki, H., Wysocka-Diller, J., Nakajima, K., Jung, J., Sena, G., Hauser, M.-T., and Benfey, P.N. (2000). The SHORT-ROOT Gene Controls Radial Patterning of the Arabidopsis Root through Radial Signaling. Cell 101, 555-567.
Heyer, L.J., Kruglyak, S., and Yooseph, S. (1999). Exploring Expression Data: Identification and Analysis of Coexpressed Genes. Genome Res. 9, 1106-1115.
Ingram, P., Dettmer, J., Helariutta, Y., and Malamy, J.E. (2011). Arabidopsis Lateral Root Development 3 is essential for early phloem development and function, and hence for normal root system development. Plant J. 68, 455-467.
Irizarry, R.A., Hobbs, B., Collin, F., Beazer-Barclay, Y.D., Antonellis, K.J., Scherf, U., and Speed, T.P. (2003). Exploration, normalization, and summaries of high density oligonucleotide array probe level data. Biostat 4, 249-264.
Kajala, K., Ramakrishna, P., Fisher, A., Bergmann, D.C., De Smet, I., Sozzani, R., Weijers, D., and Brady, S.M. (2014). Omics and modelling approaches for understanding regulation of asymmetric cell divisionsin arabidopsis and other angiosperm plants. Ann Bot 113, 1083-1105.
Kerszberg, M., and Wolpert, L. (2007). Specifying positional information in the embryo: Looking beyond morphogens. Cell 130, 205-209.
Khan, J.A., Wang, Q., Sjolund, R.D., Schulz, A., and Thompson, G.A. (2007). An early nodulin-like protein accumulates in the sieve element plasma membrane of Arabidopsis. Plant Physiol. 143, 1576-1589.
Knoblauch, M., and van Bel, A.J.E. (1998). Sieve tubes in action. Plant Cell 10, 35-50. Kondo, Y., Nurani, A.M., Saito, C., Ichihashi, Y., Saito, M., Yamazaki, K., Mitsuda, N., Ohme-Takagi, M.,
and Fukuda, H. (2016). Vascular Cell Induction Culture System Using Arabidopsis Leaves (VISUAL) Reveals the Sequential Differentiation of Sieve Element-Like Cells. Plant Cell 28, 1250-1262.
Kunieda, T., Mitsuda, N., Ohme-Takagi, M., Takeda, S., Aida, M., Tasaka, M., Kondo, M., Nishimura, M., and Hara-Nishimura, I. (2008). NAC Family Proteins NARS1/NAC2 and NARS2/NAM in the Outer Integument Regulate Embryogenesis in Arabidopsis. Plant Cell 20, 2631-2642.
22
Lee, J.-Y., Colinas, J., Wang, J.Y., Mace, D., Ohler, U., and Benfey, P.N. (2006). Transcriptional and posttranscriptional regulation of transcription factor expression in Arabidopsis roots. Proc. Natl Acad. Sci. USA 103, 6055-6060.
Levesque, M.P., Vernoux, T., Busch, W., Cui, H., Wang, J.Y., Blilou, I., Hassan, H., Nakajima, K., Matsumoto, N., Lohmann, J.U., Scheres, B., and Benfey, P.N. (2006). Whole-Genome Analysis of the SHORT-ROOT Developmental Pathway in Arabidopsis. PLoS Biol. 4, e143.
Lohaus, G., Winter, H., Riens, B., and Heldt, H.W. (1995). Further-Studies of the Phloem Loading Process in Leaves of Barley and Spinach - the Comparison of Metabolite Concentrations in the Apoplastic Compartment with Those in the Cytosolic Compartment and in the Sieve Tubes. Bot Acta 108, 270-275.
Mahonen, A.P., Bonke, M., Kauppinen, L., Riikonen, M., Benfey, P.N., and Helariutta, Y. (2000). A novel two-component hybrid molecule regulates vascular morphogenesis of the Arabidopsis root. Genes Dev. 14, 2938-2943.
Mahonen, A.P., Ten Tusscher, K., Siligato, R., Smetana, O., Diaz-Trivino, S., Salojarvi, J., Wachsman, G., Prasad, K., Heidstra, R., and Scheres, B. (2014). PLETHORA gradient formation mechanism separates auxin responses. Nature 515, 125-129.
Mangan, S., and Alon, U. (2003). Structure and function of the feedforward loop network motif. Proc Natl Acad Sci U S A 100, 11980-11985.
Marhava, P., Bassukas, A.E.L., Zourelidou, M., Kolb, M., Moret, B., Fastner, A., Schulze, W.X., Cattaneo, P., Hammes, U.Z., Schwechheimer, C., and Hardtke, C.S. (2018). A molecular rheostat adjusts auxin flux to promote root protophloem differentiation. Nature 558, 297-300.
Miyashima, S., Koi, S., Hashimoto, T., and Nakajima, K. (2011). Non-cell-autonomous microRNA165 acts in a dose-dependent manner to regulate multiple differentiation status in the Arabidopsis root. Development 138, 2303-2313.
Miyashima, S., Roszak, P., Sevilem, I., Toyokura, K., Blob, B., Heo, J.O., Mellor, N., Help-Rinta-Rahko, H., Otero, S., Smet, W., Boekschoten, M., Hooiveld, G., Hashimoto, K., Smetana, O., Siligato, R., Wallner, E.S., Mahonen, A.P., Kondo, Y., Melnyk, C.W., Greb, T., Nakajima, K., Sozzani, R., Bishopp, A., De Rybel, B., and Helariutta, Y. (2019). Mobile PEAR transcription factors integrate positional cues to prime cambial growth. Nature 565, 490-494.
Nakajima, K., Sena, G., Nawy, T., and Benfey, P.N. (2001). Intercellular movement of the putative transcription factor SHR in root patterning. Nature 413, 307-311.
Naouar, N., Vandepoele, K., Lammens, T., Casneuf, T., Zeller, G., Hummelen, P.v., Weigel, D., Rätsch, G., Inzé, D., Kuiper, M., Veylder, L.D., and Vuylsteke, M. (2009). Quantitative RNA expression analysis with Affymetrix Tiling 1.0R arrays identifies new E2F target genes. Plant J. 57, 184-194.
Nawy, T., Lee, J.-Y., Colinas, J., Wang, J.Y., Thongrod, S.C., Malamy, J.E., Birnbaum, K., and Benfey, P.N. (2005). Transcriptional Profile of the Arabidopsis Root Quiescent Center. Plant Cell 17, 1908-1925.
Oparka, K.J., and Turgeon, R. (1999). Sieve elements and companion cells-traffic control centers of the phloem. Plant Cell 11, 739-750.
Paciorek, T., Sauer, M., Balla, J., Wisniewska, J., and Friml, J. (2006). Immunocytochemical technique for protein localization in sections of plant tissues. Nat.. Protoc. 1, 104-107.
Rodriguez-Villalon, A., Gujas, B., Kang, Y.H., Breda, A.S., Cattaneo, P., Depuydt, S., and Hardtke, C.S. (2014). Molecular genetic framework for protophloem formation. Proc. Natl Acad. Sci. USA 111, 11551-11556.
Saeed AI, B.N., Braisted JC, Liang W, Sharov V, Howe EA, Li J, Thiagarajan M, White JA, Quackenbush J. (2006). TM4 microarray software suite. Methods Enzymol. 411, 134-193.
Sebastian, J., Ryu, K.H., Zhou, J., Tarkowska, D., Tarkowski, P., Cho, Y.H., Yoo, S.D., Kim, E.S., and Lee, J.Y. (2015). PHABULOSA Controls the Quiescent Center-Independent Root Meristem Activities in Arabidopsis thaliana. PLoS Genet. 11, e1004973.
Sena, G., Jung, J.W., and Benfey, P.N. (2004). A broad competence to respond to SHORT ROOT revealed by tissue-specific ectopic expression. Development 131, 2817-2826.
23
Sjolund, R.D. (1997). The phloem sieve element: A river runs through it. Plant Cell 9, 1137-1146. Smyth, G.K. (2004). Linear Models and Empirical Bayes Methods for Assessing Differential Expression in
Microarray Experiments. SAGMB 3, Article 3. Stadler, R., and Sauer, N. (1996). The Arabidopsis thaliana AtSUC2 gene is specifically expressed in companion
cells. Bot Acta 109, 299-306. Taylor, S.C., Laperriere, G., and Germain, H. (2017). Droplet Digital PCR versus qPCR for gene expression
analysis with low abundant targets: from variable nonsense to publication quality data. Sci. Rep. 7. Truernit, E., Bauby, H., Belcram, K., Barthélémy, J., and Palauqui, J.-C. (2012). OCTOPUS, a polarly
localised membrane-associated protein, regulates phloem differentiation entry in Arabidopsis thaliana. Development 139, 1306-1315.
Vaten, A., Dettmer, J., Wu, S., Stierhof, Y.D., Miyashima, S., Yadav, S.R., Roberts, C.J., Campilho, A., Bulone, V., Lichtenberger, R., Lehesranta, S., Mahonen, A.P., Kim, J.Y., Jokitalo, E., Sauer, N., Scheres, B., Nakajima, K., Carlsbecker, A., Gallagher, K.L., and Helariutta, Y. (2011). Callose Biosynthesis Regulates Symplastic Trafficking during Root Development. Dev. Cell 21, 1144-1155.
Wallner, E.S., Lopez-Salmeron, V., Belevich, I., Poschet, G., Jung, I., Grunwald, K., Sevilem, I., Jokitalo, E., Hell, R., Helariutta, Y., Agusti, J., Lebovka, I., and Greb, T. (2017). Strigolactone- and Karrikin-Independent SMXL Proteins Are Central Regulators of Phloem Formation. Curr. Biol. 27, 1241-1247.
Zhong, R., Richardson, E.A., and Ye, Z.-H. (2007). The MYB46 Transcription Factor Is a Direct Target of SND1 and Regulates Secondary Wall Biosynthesis in Arabidopsis. The Plant Cell 19, 2776-2792.
* ** *
**
******
metaxylemprotophloem
procambiumsieve element precursor
metaphloem
B C**
**
**
* * *
***
**
** *
****
**
***
*
companion cell
* *****
****
** *
sieve element-procambium precursor
WT shr-2 WT shr-2
ProAPL:erGFP ProSUC2:erGFP
AB C D E
F G H I
J K L M
pericycleendodermis
protoxylem
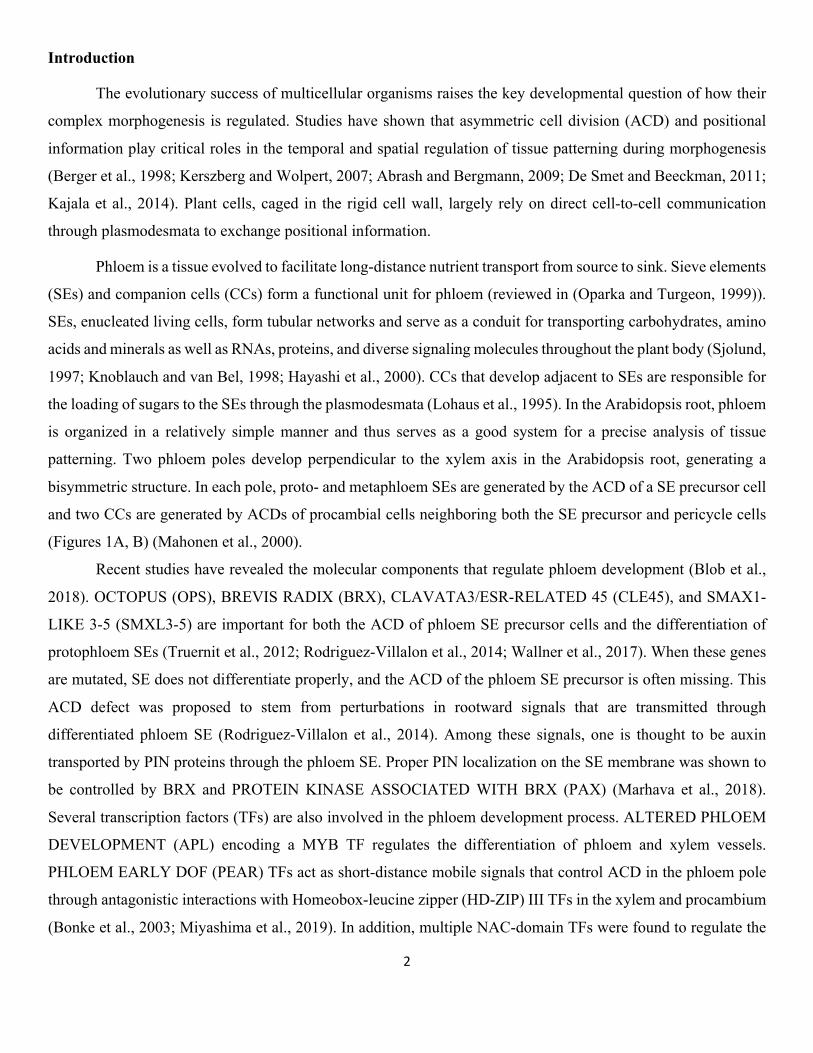
Figure 1. SHR regulates phloem development in the Arabidopsis root.
(A) A schematic diagram showing the Arabidopsis root anatomy and asymmetric cell divisions of two precursor cells for phloem sieve element formation, as indicated by the flipped T shape in white. Comparison of phloem development between wild-type (B, D, F, H, J, L) and shr-2 (C, E, G, I, K, M) roots. (B, C) Transverse sections through the maturation zones of wild-type (B) and shr-2 (C) roots, stained with toluidine blue. (D, E) Immunolocalization of the SE-ENOD in wild-type (D) and shr-2 (E) mature roots. Expression of ProAPL:erGFP in wild type (F, J) and shr-2 (G, K). Expression of ProSUC2:erGFP in wild type (H, L) and shr-2 (I, M). Scale bar, 10 µm; asterisks, pericycle position; arrows, xylem axis; red arrowheads, sieve elements; white arrowheads, beginning of the transition zone of the root.
* * * ** * * * * *
* ** * **
**
* *****
********* ***
*********
****
********
*
*
* * *** * **
** * * *
* * **
* ***
****
**
***
*****
**
*****
* ***
******
**** *
ProUAS:MIR165A shr-2 J0571 shr-2 phb-6 scr-4 ProCRE1:PHBem-GFP
A B C D
E F G H
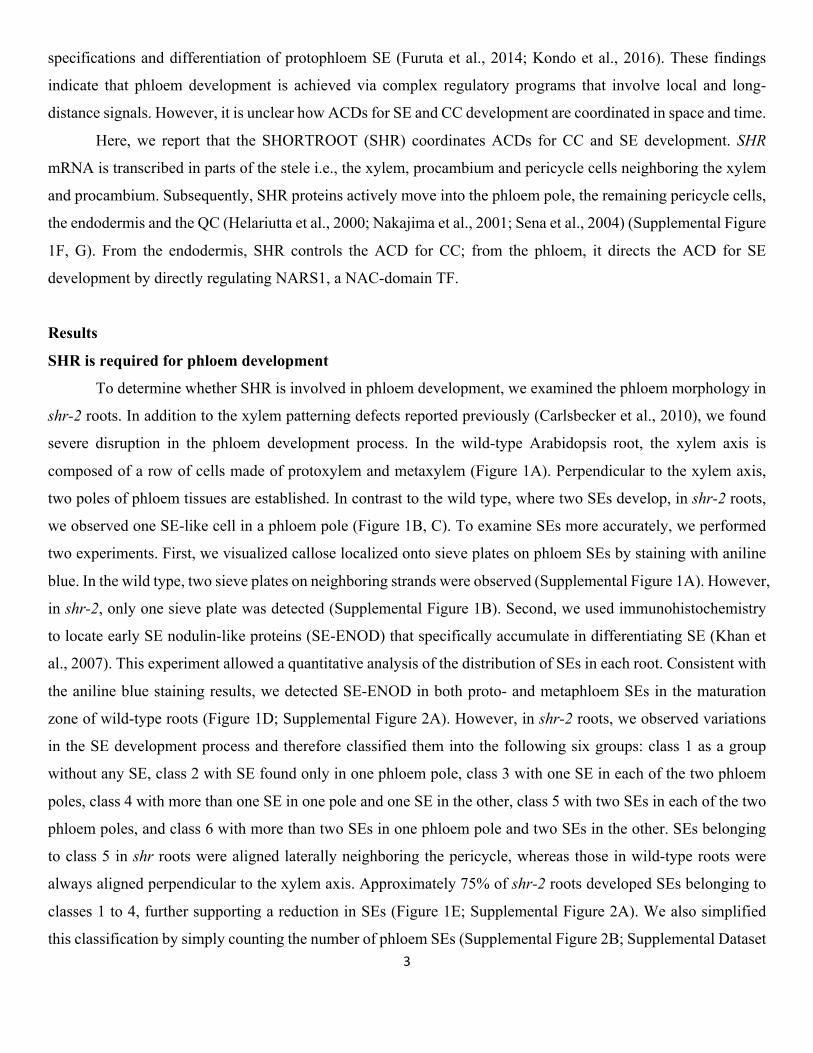
Figure 2. PHABULOSA suppresses procambial cell divisions for companion cell development. Toluidine-blue-stained transverse sections and immunolabeled SE-ENOD of ProUAS:MIR165A shr J0571 (A, E), shr-2 phb-6 (B, F), scr-4 (C, G) and ProCRE1:PHBem-GFP (D, H). Scale bar, 10 µm; asterisks, pericycle position; arrows, xylem axis; arrow heads, SEs.
*** * * *
****
* ***
** * *
*******
**
**** * * *
* ****
* * * ***
** ****
*
* * * *******
*** * *
* * **********
**
*
ProEPM>>iCalsM3 ProSHR:SHR-GFP shr-21ProCRE1:SHRΔNLELDV-nlsGFPshr-2
ProS32:SHRΔNLELDV-nlsGFPshr-2 − estradiol + estradiol
A D G J
B E H K
C F I L
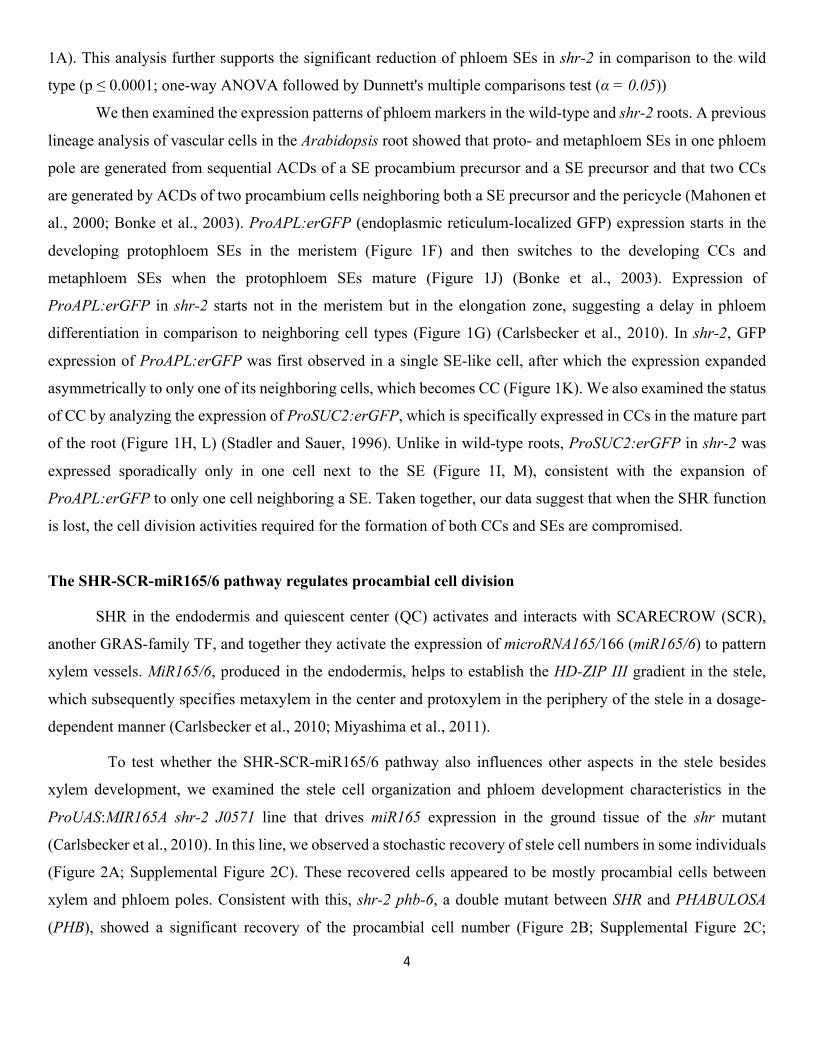
Figure 3. SHR movement into the phloem pole is required for asymmetric cell divisions for sieve element development. Confocal cross-sections of the root meristematic zone of ProCRE1:SHRΔNLELDV-nlsGFP shr-2 (A) and ProS32:SHRΔNLELDV-nlsGFP shr-2 (D) show the GFP signal indicating the expression pattern of the non-mobile SHR protein. Toluidine-blue-stained transverse sections and immunolocalization of the SE-ENOD of ProCRE1:SHRΔNLELDV-nlsGFP shr-2 (B, C) and ProS32:SHRΔNLELDV-nlsGFP shr-2 (E, F). Confocal cross-sections of the root meristematic zone and immunolocalization of the SE-ENOD of ProEPM>>iCalsM3 ProSHR:SHR-GFP shr-2 (G-L). (G-I) Without an estradiol treatment, SHR movement and SE development are normal. (J-L) Images taken two days after a treatment with 10 µM of estradiol. The phloem pole, indicated by white arrowheads, does not show SHR-GFP. Scale bar, 10 µm; asterisks, pericycle position; arrows, xylem axis; arrowheads, SEs.
quie
scen
ce c
ente
r
SE
and
com
pani
on c
ells
com
pani
on c
ells
prot
oxyl
em a
nd m
etax
ylem
initi
alph
loem
per
icyc
le
xyle
m p
eric
ycle
endo
derm
isco
rtex
hair
cells
non-
hair
cells
late
ral r
oot c
ap
prot
o-S
E
prot
oxyl
em a
nd m
etax
ylem
quie
scen
ce c
ente
r and
end
oder
mis
colu
mel
la
WT 1
WT 3
WT 2
shr-2
1
shr-2
2
SHRΔNLELD
V 1
SHRΔNLELD
V 2
179 genes 45 genes
A C
B
1
1
F G
K L
M N
Dex treatment time (h)
Rel
ativ
e no
rmal
ized
exp
ress
ion
Dex treatment time (h)
Dex treatment time (h)
NAC40
Dex treatment time (h)
Dex treatment time (h)
00.5
11.5
22.5
33.5
4
0 10 20 30 40 50
NARS1
AT2G03500
0
0.5
1
1.5
2
2.5
3
0 10 20 30 40 50
0
0.5
1
1.5
2
2.5
0 10 20 30 40 50
AT4G29100
00.20.40.60.8
11.21.41.61.8
0 10 20 30 40 50
0
0.5
1
1.5
2
2.5
3
3.5
0 10 20 30 40 50
ZIP44
Rel
ativ
e no
rmal
ized
exp
ress
ion
Rel
ativ
e no
rmal
ized
exp
ress
ion
Rel
ativ
e no
rmal
ized
exp
ress
ion
Rel
ativ
e no
rmal
ized
exp
ress
ion
-1
-2
1
2
Rel
ativ
e no
rmal
ized
expr
essi
onR
elat
ive
norm
aliz
ed
ex
pres
sion
Rel
ativ
e no
rmal
ized
expr
essi
onR
elat
ive
norm
aliz
ed
ex
pres
sion
Rel
ativ
e no
rmal
ized
expr
essi
on
Row
-nor
mal
ized
e
xpre
ssio
n va
lue
Row
-nor
mal
ized
e
xpre
ssio
n va
lue
-1
-2
1
2
WT 1
WT 3
WT 2
shr-2
1
shr-2
2
SHRΔNLELD
V 1
SHRΔNLELD
V 2

Figure 4. Genome-wide meta-analysis and time-course induction experiments identify phloem-enriched transcription factors downstream of SHR. (A) Root expression of genes that are enriched in the phloem cell types. (B) Centroid graphs of two QT clusters for which phloem-enriched genes under the regulation of SHR in the stele were identified. (C) Time-course expression changes of putative directtarget genes of SHR in the ProSHR:SHR-GR shr-2 line in response to different Dex treatment durations.
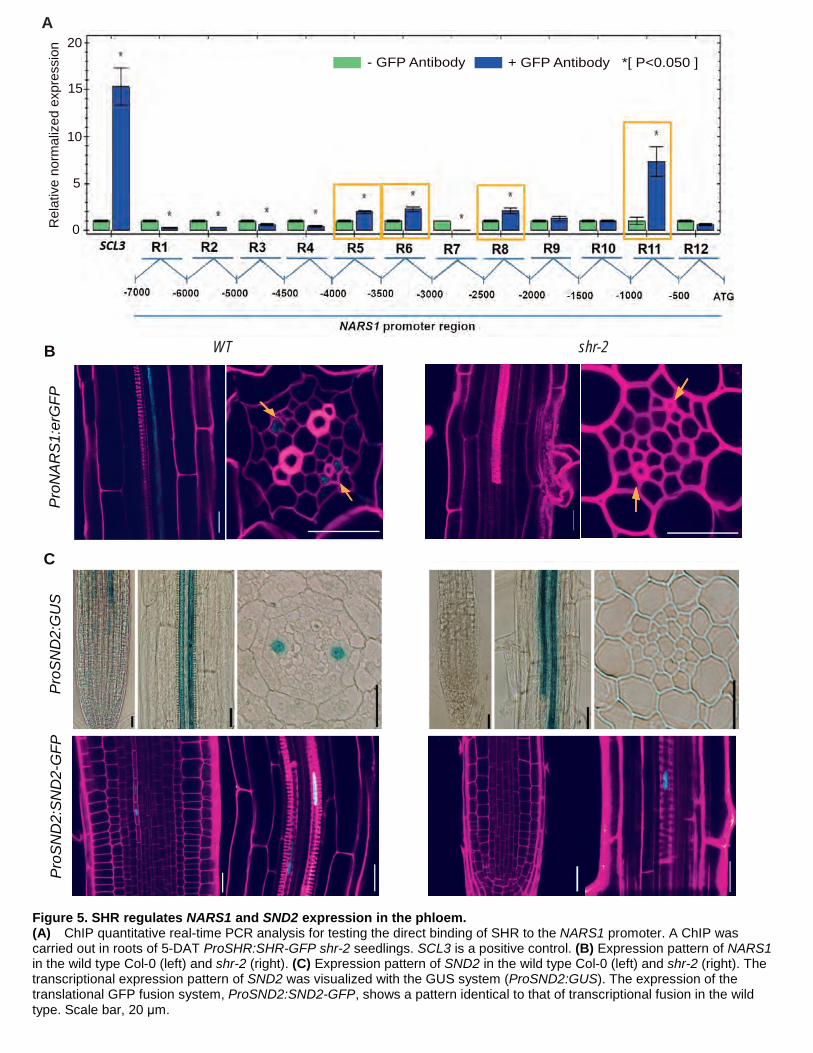
Pro
SN
D2:
SN
D2-
GFP
Pro
SN
D2:
GU
SP
roN
AR
S1:
erG
FP
WT shr-2 B
C
- GFP Antibody + GFP Antibody *[ P<0.050 ]R
elat
ive
norm
aliz
ed e
xpre
ssio
n
0
5
10
15
20A
Figure 5. SHR regulates NARS1 and SND2 expression in the phloem. (A) ChIP quantitative real-time PCR analysis for testing the direct binding of SHR to the NARS1 promoter. A ChIP wascarried out in roots of 5-DAT ProSHR:SHR-GFP shr-2 seedlings. SCL3 is a positive control. (B) Expression pattern of NARS1in the wild type Col-0 (left) and shr-2 (right). (C) Expression pattern of SND2 in the wild type Col-0 (left) and shr-2 (right). Thetranscriptional expression pattern of SND2 was visualized with the GUS system (ProSND2:GUS). The expression of thetranslational GFP fusion system, ProSND2:SND2-GFP, shows a pattern identical to that of transcriptional fusion in the wildtype. Scale bar, 20 μm.
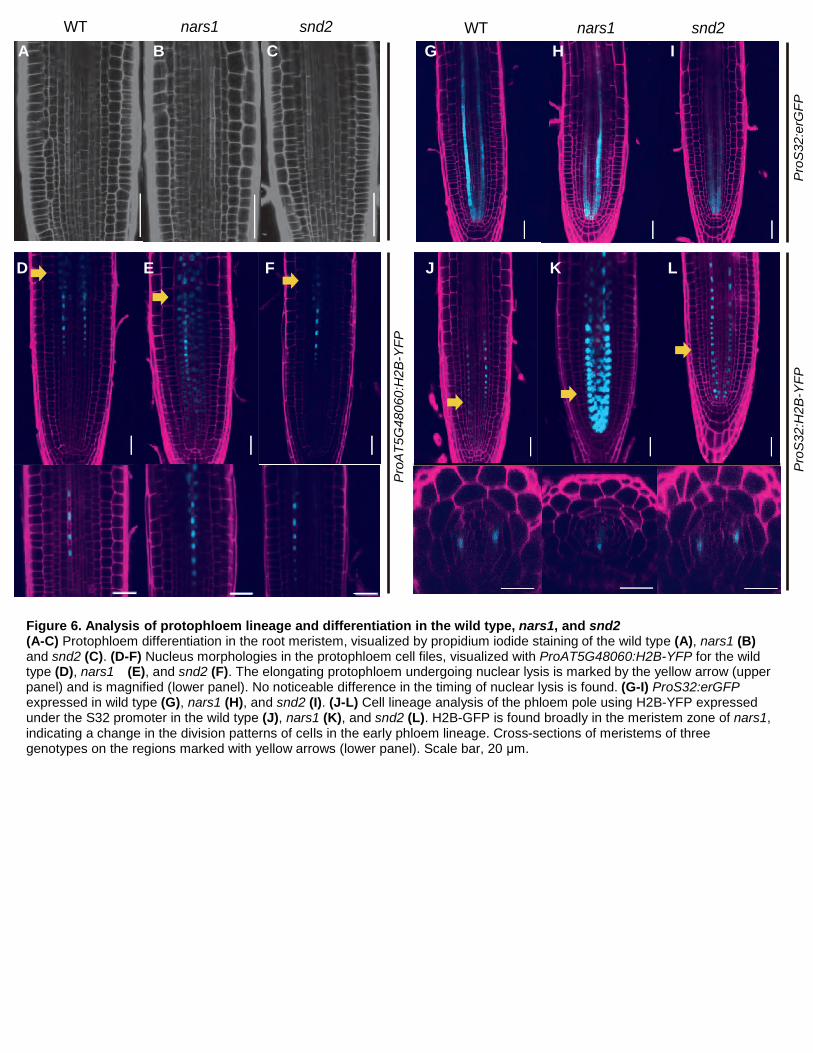
Pro
AT5
G48
060:
H2B
-YFP
1
Pro
S32
:erG
FP
Pro
S32
:H2B
-YFP
WT nars1 snd2A B C G H I
D E F J K L
WT nars1 snd2
Figure 6. Analysis of protophloem lineage and differentiation in the wild type, nars1, and snd2 (A-C) Protophloem differentiation in the root meristem, visualized by propidium iodide staining of the wild type (A), nars1 (B) and snd2 (C). (D-F) Nucleus morphologies in the protophloem cell files, visualized with ProAT5G48060:H2B-YFP for the wild type (D), nars1 (E), and snd2 (F). The elongating protophloem undergoing nuclear lysis is marked by the yellow arrow (upper panel) and is magnified (lower panel). No noticeable difference in the timing of nuclear lysis is found. (G-I) ProS32:erGFP expressed in wild type (G), nars1 (H), and snd2 (I). (J-L) Cell lineage analysis of the phloem pole using H2B-YFP expressed under the S32 promoter in the wild type (J), nars1 (K), and snd2 (L). H2B-GFP is found broadly in the meristem zone of nars1, indicating a change in the division patterns of cells in the early phloem lineage. Cross-sections of meristems of three genotypes on the regions marked with yellow arrows (lower panel). Scale bar, 20 μm.
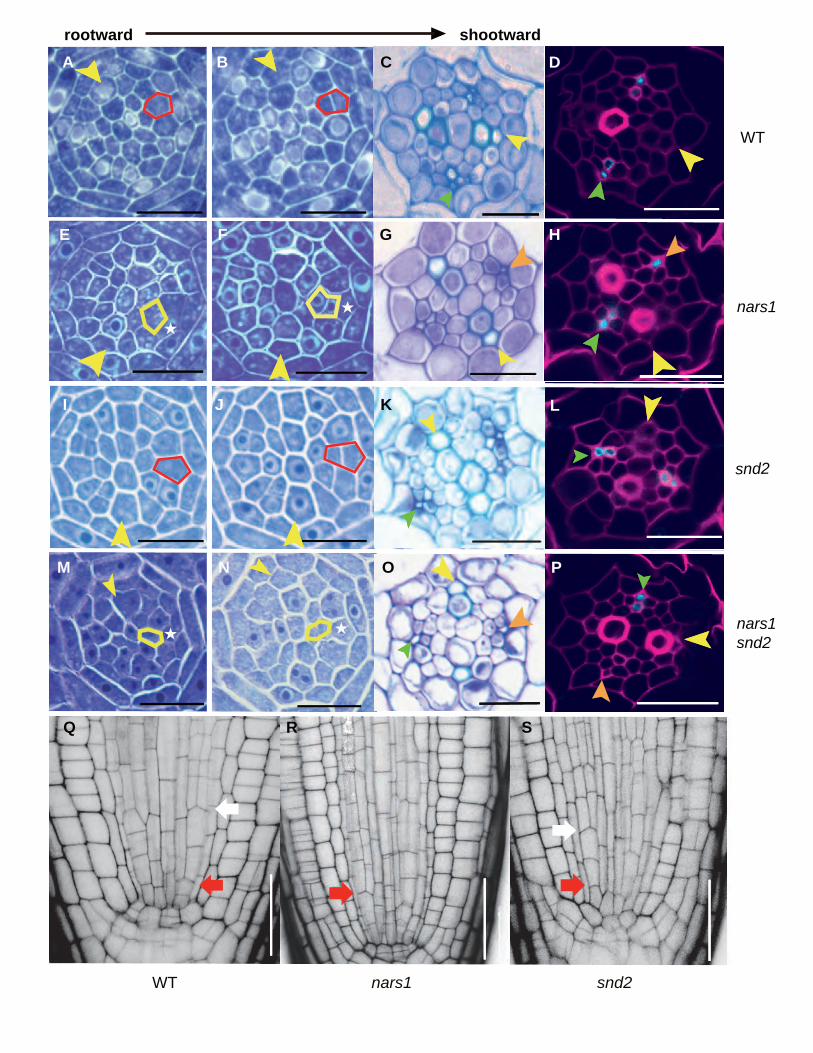
★
★
★ ★
A B C D
L
WT
nars1
snd2
nars1 snd2
rootward shootward▶
I J K
WT nars1 snd2
Q R S
E F G H
M N O P

Figure 7. Analysis of cell division patterns for phloem sieve element development in the wild type, nars1 and snd2 (A-P) Analysis of division patterns of phloem SE precursors in the roots of wild type (A-D), nars1 (E-H), snd2 (I-L) and the nars1 snd2 double mutant (M-P). Analysis of cell division patterns using consecutive cross-sections in the wild type (A, B), nars1 (E, F), snd2 (I, J) and snd2 nars1 double mutant (M, N) and resulting cell organization in the root differentiation zone (C, G, K, O). SE-ENOD immunolocalization shows two differentiated phloem SEs in the wild type (D) and snd2 (L) but only one in nars1 (H) and nars1 snd2 (P). (Q-S) Confocal images of wild-type (Q) nars1 (R), and snd2 (S) root meristems. Phloem precursor cells in the wild type and snd2 divide twice, whereas that in nars1 divides only once. Yellow arrowhead, xylem axis; green arrowhead, pole with two phloem SEs; orange arrowhead, pole with one phloem SE; red arrow, ACD of the procambium-phloem initial; white arrow, ACD of the phloem SE initial; Scale bar, 20 μm.

metaxylemprotophloem
procambium
metaphloemcompanion cell
pericycleendodermis
protoxylem
sieve element precursor
NARS1
Roo
t len
gth
(6D
AT) c
m
Roo
t len
gth
(6D
AT) c
m
WT nars1 ProS29:GFP-NARS1 nars1
WT nars1 ProSUC2:GFP-NARS1 nars1
0.5 0.5
11
1.51.5
2D E
F G H
I J K
L M
SND2
sieve element-procambium precursor
SHRSHRSCR
PHBmiR165/166
SHRNARS1
SHR
SHR
SHR
NA B C
SHRSCR
miR165/166
SHR
NARS1
PHB
NARS1
NARS1
NARS1

Figure 8. Functional analysis of NARS1 as a potential top-down signal for asymmetric cell divisions of sieve element precursors and a proposed molecular model (A-C) Analysis of the division recovery of phloem SE precursors in the roots of ProS29:GFP-NARS1 nars1 (A) and ProSUC2:GFP-NARS1 nars1 (B, C). (D, E) Analysis of the root length recovery process of ProS29:GFP-NARS1 nars1 [three independent homozygous T3 lines (N=263), WT (N=32) and nars1 (N=50)] (D) and ProSUC2:GFP-NARS1 nars1 [three independent homozygous T3 lines (N=256), WT (N=35) and nars1 (N=50)] (E). (F-H) Transgenic roots expressing ProCRE1:GFP-NARS1 Col-0. (I-K) Transgenic roots expressing ProCRE1:SND2-GFP Col-0. (L, M) Transgenic roots expressing ProCRE1:GFP-NARS1 shr-2. Longitudinal views of the root meristem expressing GFP-NARS1 (F, L) and SND2-GFP (I). (G, J, M) SE-ENOD immunolocalization (H, K) Toluidine blue staining. (N) Proposed model of phloem development initiated by SHRin Arabidopsis roots. The regulatory scheme shown on the longitudinal axis illustrates the positive feedforward regulatory loopcomposed of SHR, NARS1, and SND2 and the positive feedback regulation between NARS1 and SND2. In the cross-section,the repression of NARS1 by PHB is shown. Red arrow, gene regulation; black arrow, intercellular movement. In panels A andB, yellow arrows indicate the ACDs of procambium-phloem SE precursors, and white arrows indicate the ACDs of phloem SEprecursors. Orange arrows in the panels, G, H, J, K, and M, indicate ectopic phloem SEs. Scale bar, 20 μm.
DOI 10.1105/tpc.19.00455; originally published online February 28, 2020;Plant Cell
Miyashima, Yrjo Helariutta and Ji-Young LeeHyoujin Kim, Jing Zhou, Deepak Kumar, Geupil Jang, Kook Hui Ryu, Jose Sebastian, Shunsuke
RootsSHORTROOT-Mediated Intercellular Signals Coordinate Phloem Development in Arabidopsis
This information is current as of April 14, 2020
Supplemental Data /content/suppl/2020/02/28/tpc.19.00455.DC1.html
Permissions https://www.copyright.com/ccc/openurl.do?sid=pd_hw1532298X&issn=1532298X&WT.mc_id=pd_hw1532298X
eTOCs http://www.plantcell.org/cgi/alerts/ctmain
Sign up for eTOCs at:
CiteTrack Alerts http://www.plantcell.org/cgi/alerts/ctmain
Sign up for CiteTrack Alerts at:
Subscription Information http://www.aspb.org/publications/subscriptions.cfm
is available at:Plant Physiology and The Plant CellSubscription Information for
ADVANCING THE SCIENCE OF PLANT BIOLOGY © American Society of Plant Biologists