
Short-Term Forecasting of Surface Solar Irradiance Based on Meteosat-SEVIRI Data Using a Nighttime...
24
Short-Term Forecasting of Surface Solar Irradiance Based on Meteosat-SEVIRI Data Using a Nighttime Cloud lndex Annette Hammer Energy Meteorology Group Institute of Physics Carl von Ossietzky University Oldenburg 6th PV Performance Modeling and Monitoring Workshop, 24. October 2016, Freiburg
-
Upload
sandia-national-laboratories-energy-climate-renewables -
Category
Technology
-
view
86 -
download
0
Transcript of Short-Term Forecasting of Surface Solar Irradiance Based on Meteosat-SEVIRI Data Using a Nighttime...

Short-Term Forecasting of Surface Solar Irradiance
Based on Meteosat-SEVIRI Data Using a Nighttime Cloud lndex
Annette Hammer
Energy Meteorology GroupInstitute of Physics Carl von Ossietzky University Oldenburg
6th PV Performance Modeling and Monitoring Workshop, 24. October 2016, Freiburg

Overview
1. Motivation and aim
2. Define cloud classes in brightness temperature difference images
3. Derivation of cloud index for each cloud class
4. Validation
5. Summary
2

Motivation
Satellite images are operationally used to forecast surface solar irradiance within the next hours:
1. Meteosat Second generation HRVIS images
(300-700nm, 1km*1km)1. Heliosat Method:
cloud index → solar irradiance 2. Cloud motion vectors
3
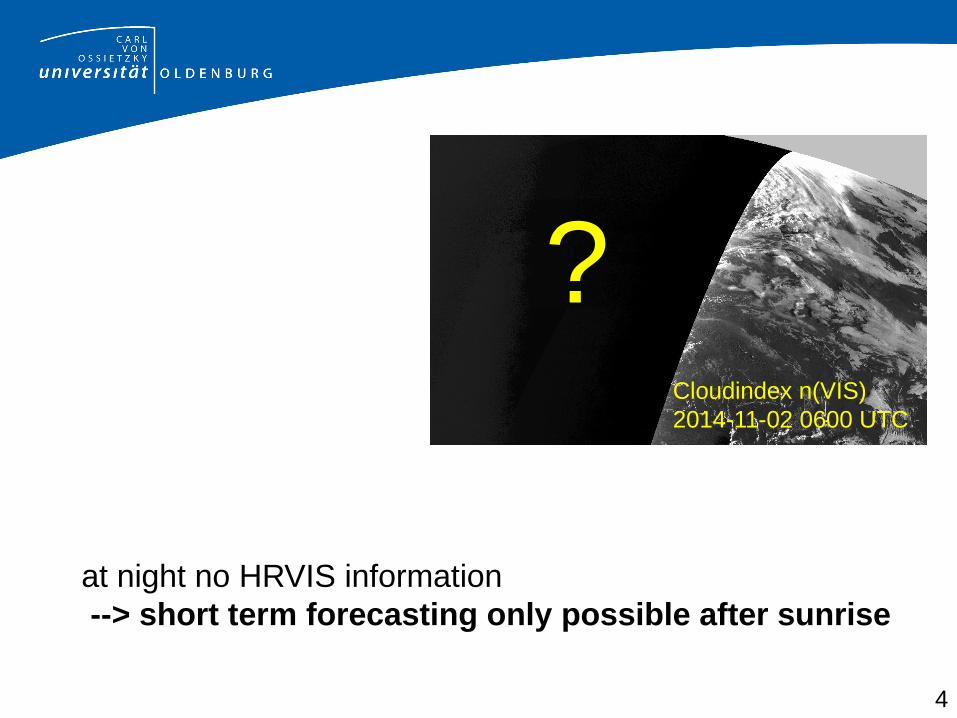
Cloudindex n(VIS)2014-11-02 0600 UTC
?
at night no HRVIS information --> short term forecasting only possible after sunrise
4

Aim: define a nighttime cloud index!
Meteosat infrared channels (here 10.8 and 3.9 µm)
Effective Brightness Temperatures T10.8, T3.9
and their Difference BTD=T3.9 − T10.8
well known quantities in nighttime cloud and fog detection up to now not used to calculate a cloud index
(Note: BTD is different for day and night, T3.9 consists of reflected solar and emitted thermal radiation) 5

BTD image observations
6

BTD image observations
limb cooling
7

BTD image observations
Noise: very cold clouds
8

BTD image observations
Noise: very cold clouds
Fog and Low Stratus
9

Observations
Cloud free land and cloud free ocean surfaces have a similar shade of grey
limb cooling Fog and low stratus look dark Other clouds look bright Very cold thick clouds show noise (opaque ==
high cloud index)
10

Satellite viewing angle correction (BTD→BTD*)
Shift of peaks: limb cooling
11

Cloud classes in BTD*-histogram
P
cloud free
other cloudsFLS
- δ -
12

Definition of cloud classes in BTD* image
P: Position of cloud free ocean or land peak in BTD* frequency distribution
13
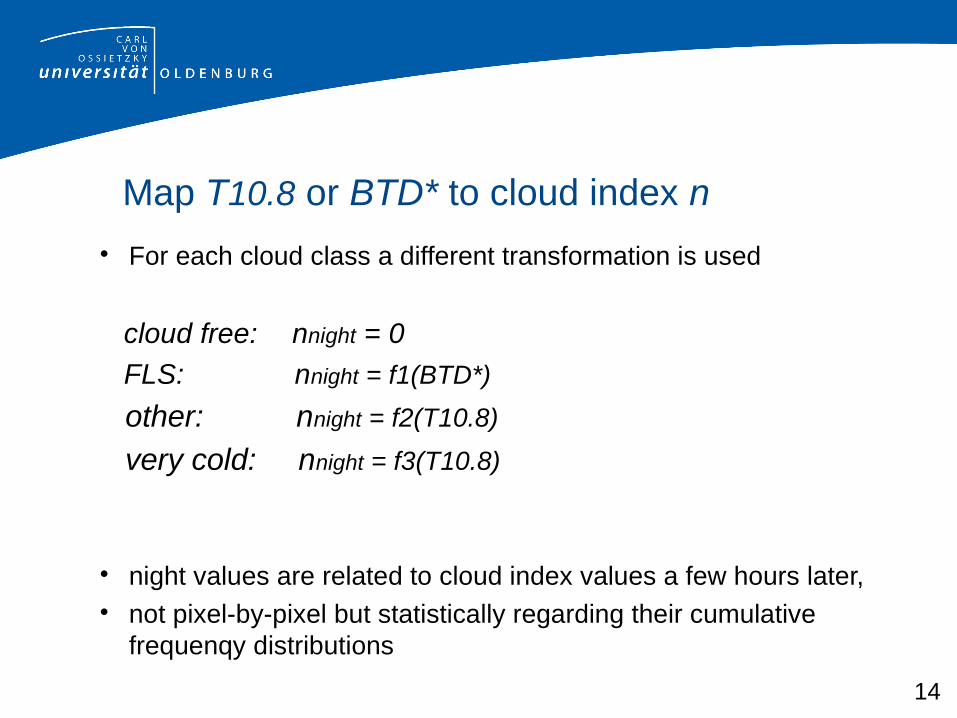
Map T10.8 or BTD* to cloud index n
For each cloud class a different transformation is used
cloud free: nnight = 0
FLS: nnight = f1(BTD*)
other: nnight = f2(T10.8)
very cold: nnight = f3(T10.8)
night values are related to cloud index values a few hours later, not pixel-by-pixel but statistically regarding their cumulative
frequenqy distributions
14

Illustration of transformation
Illustration: map T10.8 to cloud index n
F3 (T10.8) N3 (nday)
15

Map T10.8 / BTD* to cloud index n
1. Cumulative frequency distributions
2. Transformation that maps each T10.8 / BTD* value to the daytime cloud index with the same quantile F1 (BTD*) ≡ N1 (nday)
F3 (T10.8) ≡ N3 (nday)
nnight = f1 (BTD*) = (N1) ¹⁻ F1 (BTD*)
nnight = f3 (T10.8) = (N3) ¹⁻ F3 (BTD*)16

Transformations f1(BTD*) and f3(T10.8)
FLS f1 very cold f3
17

Training of transformations f1, f2 and f3
f1(BTD*) for fog and low stratus and
f3(T10.8) for very cold clouds have been trained in months with a lot of such clouds (f1: April 2013, 29 nights and f2: Feb 2013, 15 nights)
f2(T10.8) for other cloudsis taken from yesterday for today, to follow seasonal temperature changes
18

Cloudindex n(VIS)2014-11-02 0600 UTC
CompositeCloudindex n(BTD) Cloudindex n(VIS) 2014-11-02 0600 UTC
?
19

Validation
Quality of daytime cloud index can be validated with global horiziontal irradiance (compare result of Heliosat method with measurements)
But: Nighttime cloud index can not be validated in this way → Validate forecasted irradiance!
20

Germany, 116 stations, Sep 2014 to Feb 2015, hourly values of global horizontal irradiance
21

Summary
With a nighttime cloud index it is possible to forecast global horizontal irradiance for the next hours before sunrise
Effective brightness temperature values and brightness temperature differences are used to classify clouds and are mapped to cloud index values with a statistical transformation (QuantileQuantilePlot)
For three cloud classes such transformations have been developed 22

Reference
Hammer, A.; Kühnert, J.; Weinreich, K.; Lorenz, E.:
Short-Term Forecasting of Surface Solar Irradiance Based on Meteosat-SEVIRI Data Using a Nighttime Cloud Index. Remote Sensing, 2015, 7, 9070-9090; doi:10.3390/rs70709070
23

Acknowledgements
This work has been supported by the German Federal Environmental Foundation DBU (Deutsche Bundesstiftung Umwelt) and the German Federal Ministry of Economics and Technology BMWi (Bundesministerium für Wirtschaft und Technologie). We thank the German Weather Service (DWD) and meteogroup GmbH for providing global horizontal irradiance measurement data.
24


![Meteorologi/meteorologi_127[1].pdf · Meteorologi Nr 128, 2007 Meteorologi Nr 127, 2007 METEOSAT 8 SEVIRI and NOAA AVHRR Cloud Products A Climate Monitoring SAF Comparison Study Sheldon](https://static.fdocuments.net/doc/165x107/5e4a00d78ba7f72ccf142b38/meteorologi-meteorologi1271pdf-meteorologi-nr-128-2007-meteorologi-nr-127.jpg)