SHORT-TERM FINANCIAL MANAGEMENT Chapter 5 – Accounts Receivable Management.
42
SHORT-TERM FINANCIAL MANAGEMENT Chapter 5 – Accounts Receivable Management
-
Upload
ross-lyons -
Category
Documents
-
view
227 -
download
2
Transcript of SHORT-TERM FINANCIAL MANAGEMENT Chapter 5 – Accounts Receivable Management.
SHORT-TERMFINANCIAL MANAGEMENT
Chapter 5 – Accounts Receivable Management
2
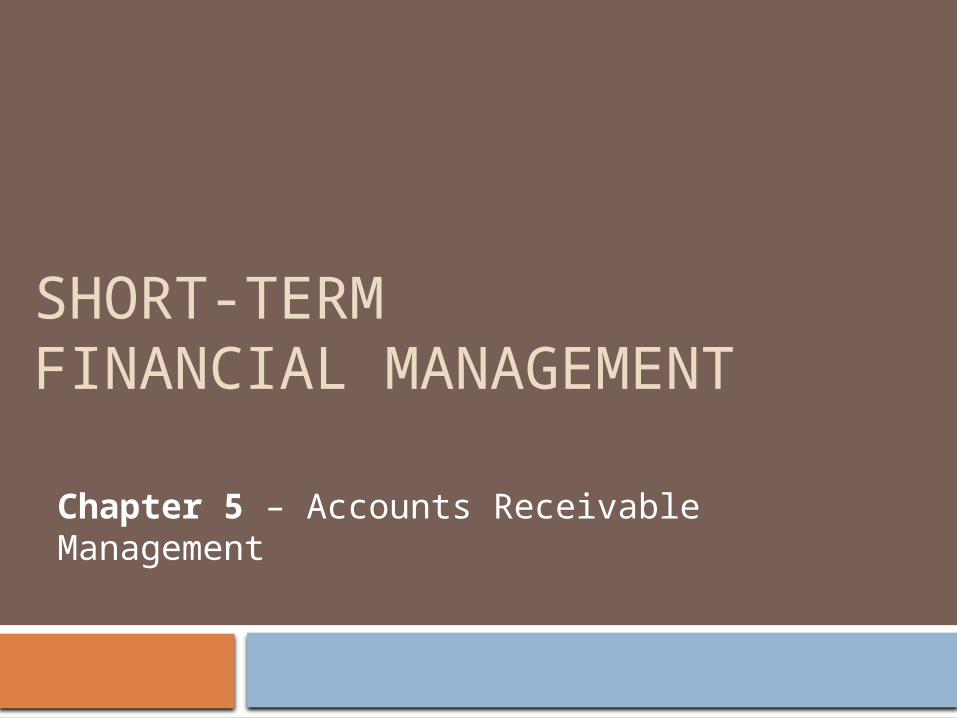
ACCOUNTS RECEIVABLE MANAGEMENT
Chapter 5 Agenda
Identify and define the components of credit policy, describe the typical credit-granting sequence, apply net present value analysis to credit extension decisions, define credit scoring and explain its limitations, and list the elements in a credit rating report.
3
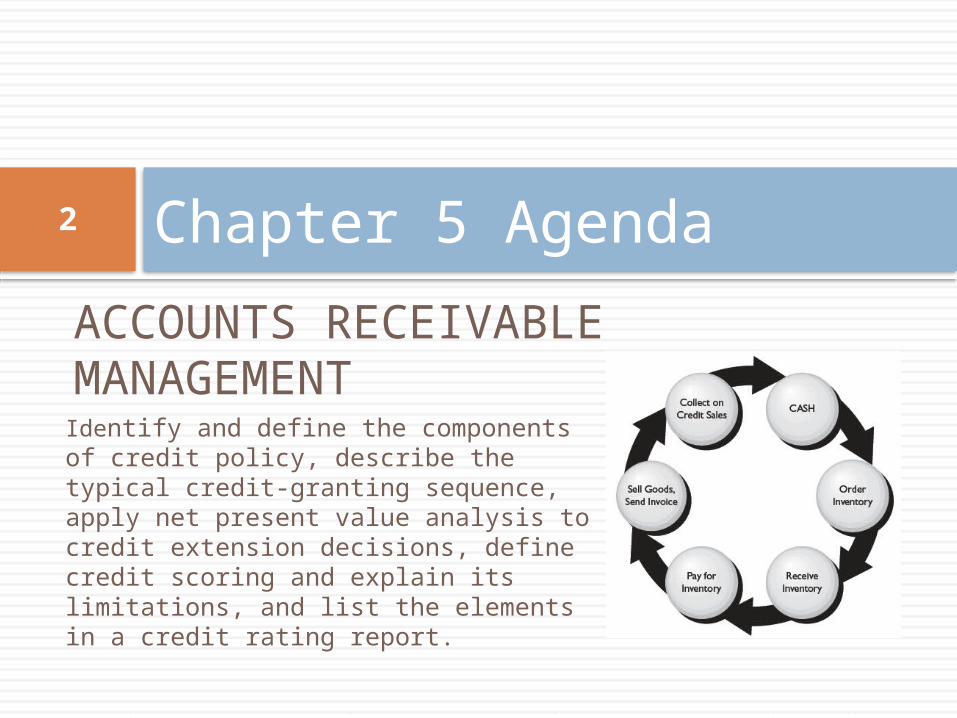
Cash Flow Timeline
The cash conversion period is the time between when cash is received versus paid.
The shorter the cash conversion period, the more efficient the firm’s working capital.
The firm is a system of cash flows. These cash flows are
unsynchronized and uncertain.

4
Trade Credit
In most industries, it is customary to offer trade credit, allowing customers a delay between receipt of goods (sometimes title transfer) and the obligation to pay for it. Also known as supplier financing, credit extension
allows deferred payment from customers and is essentially a short-term, interest-free loan.
It can be based on ‘standard’ terms, or can vary to attract new customers or large orders.
Trade credit does not have an explicit cost to the firm. It is considered a cost of doing business or built into product
pricing. Its convenience can capture new business, trigger larger
orders, build relationships, and generate repeat sales.
5
Trade Credit vs. Bank Loans
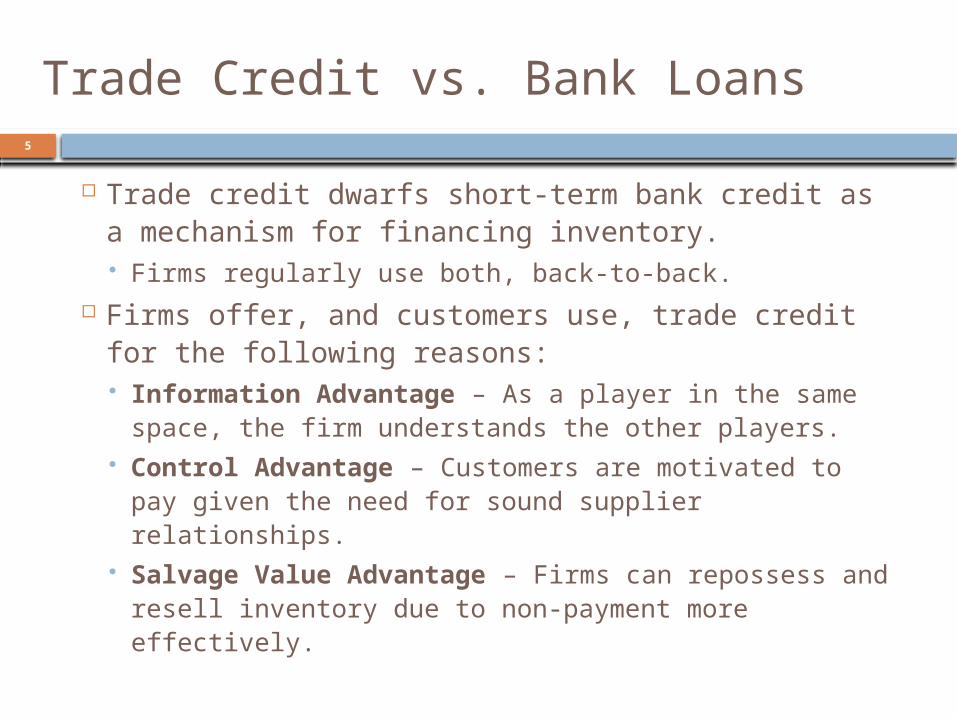
Trade credit dwarfs short-term bank credit as a mechanism for financing inventory. Firms regularly use both, back-to-back.
Firms offer, and customers use, trade credit for the following reasons: Information Advantage – As a player in the same
space, the firm understands the other players. Control Advantage – Customers are motivated to
pay given the need for sound supplier relationships. Salvage Value Advantage – Firms can repossess
and resell inventory due to non-payment more effectively.

6
Trade Credit
Offering trade credit can have a significant impact on top line growth; it also results in a significant balance sheet account…accounts receivable.
The marketing strategy must strike the balance between growing sales/capturing market share considering: Making prudent credit decisions.
Carrying and managing the accounts receivable book
Administrative costs
7
Managing The Credit Function
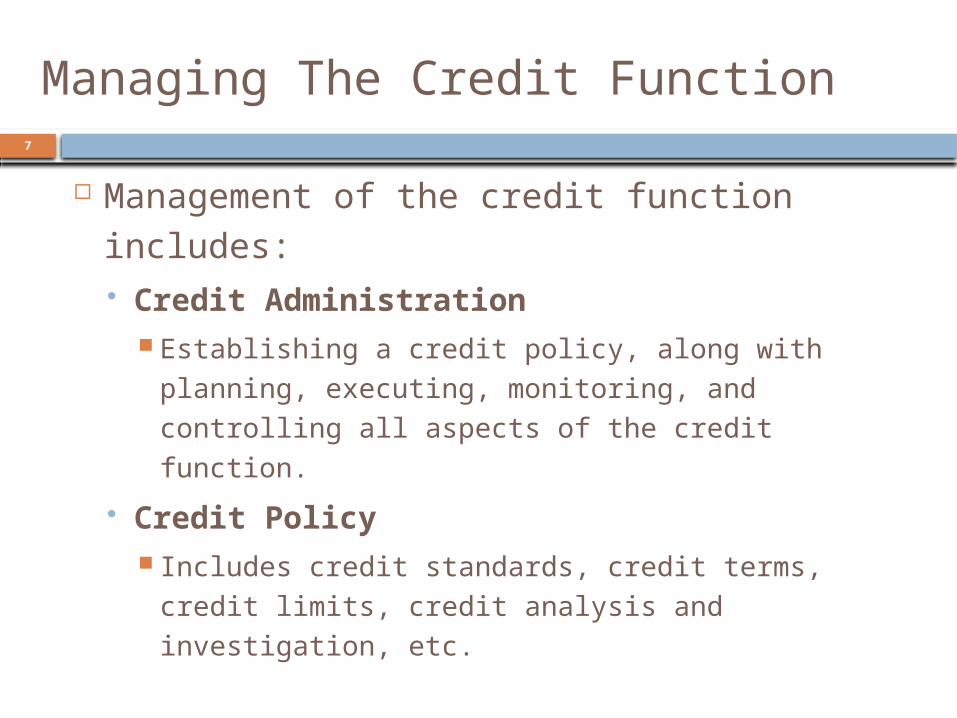
Management of the credit function includes: Credit Administration
Establishing a credit policy, along with planning, executing, monitoring, and controlling all aspects of the credit function.
Credit Policy Includes credit standards, credit terms, credit
limits, credit analysis and investigation, etc.
8
Managing Trade Credit
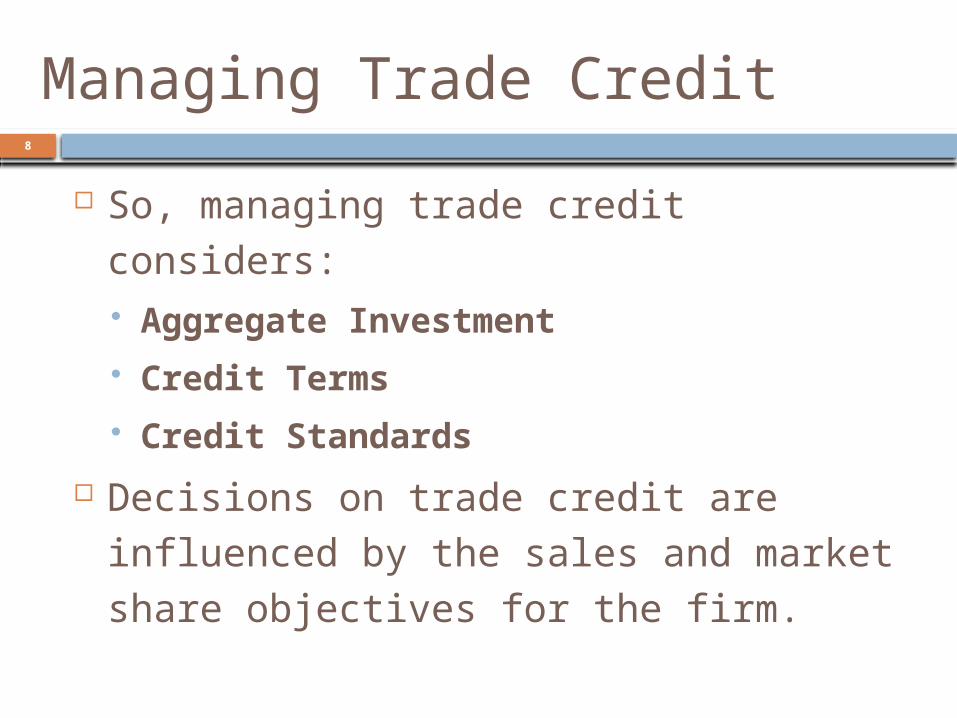
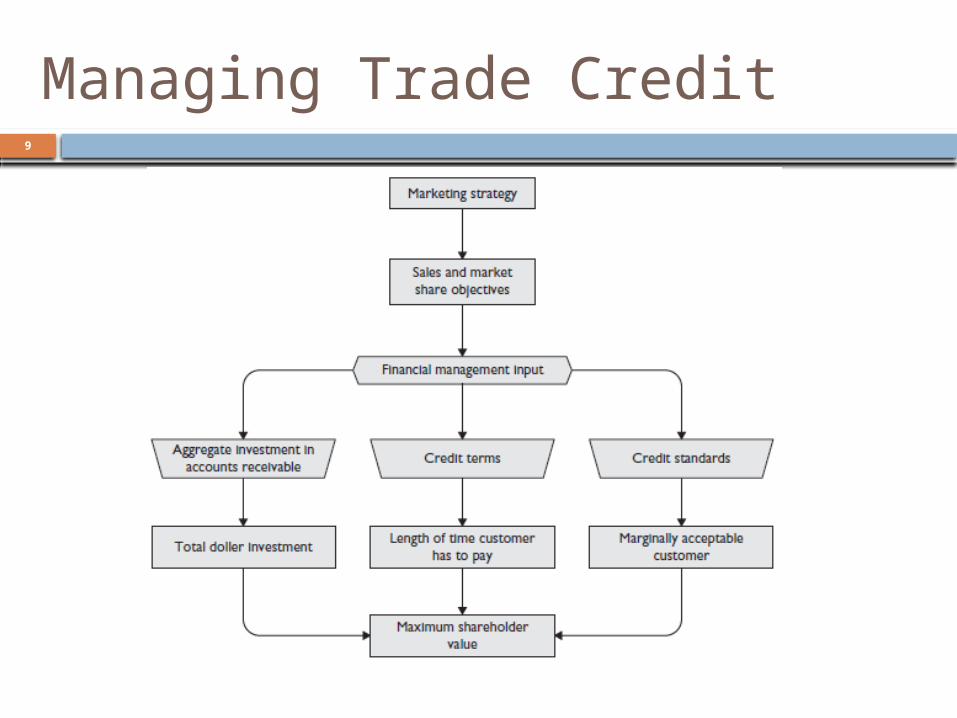
So, managing trade credit considers: Aggregate Investment Credit Terms Credit Standards
Decisions on trade credit are influenced by the sales and market share objectives for the firm.
9
Managing Trade Credit
10
Managing Trade Credit
Trade credit management includes the aggregate investment. Overinvesting in receivables is costly since:
It is often financed with short-term bank credit.
It reduces liquidity and limits alternative investments.
It could signal an ‘aging’ credit book increasing the chances of bad debts.
11
Managing Trade Credit
Trade credit management setting credit terms. If the length of time to pay is
uncompetitive, orders (and customers) are at risk to competitors selling in the same space.
12
Managing Trade Credit
Trade credit management includes establishing credit standards. What is the credit profile of a marginally
acceptable customer? How much credit should be offered?
Too stringent terms can lead to lost sales and customers.
Too lenient terms can lead to charge-offs
13
The Credit Administration Function
The Credit Administration function should: Control bad debts. Control the level of A/R. Maintain financial flexibility. Optimize the mix of company assets. Convert receivables to cash. Analyze customer risk. Minimize administrative costs.
14
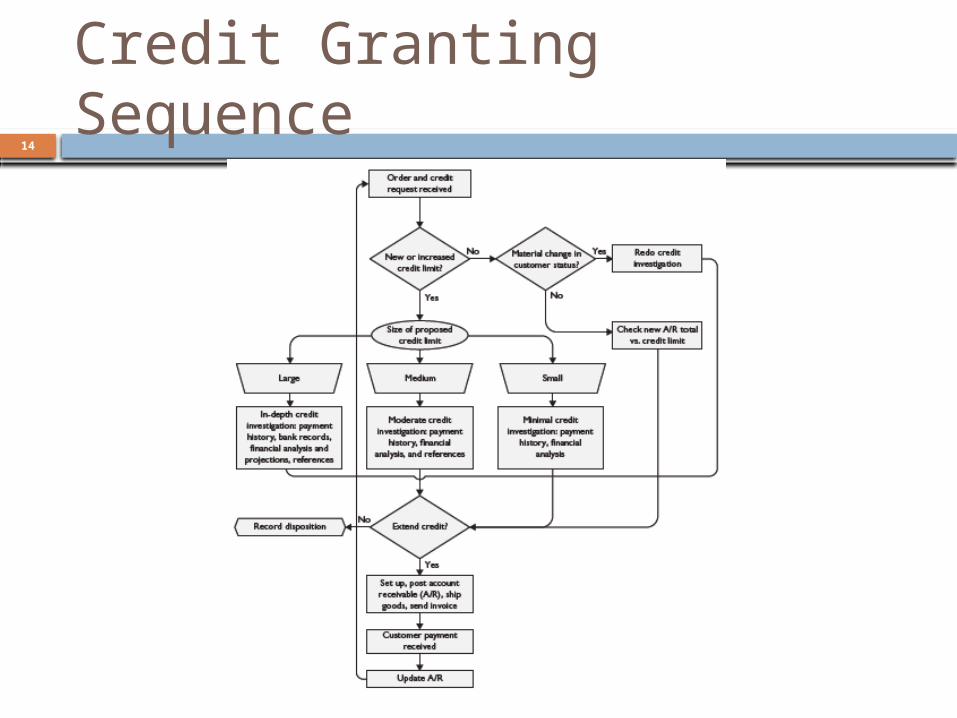
Credit Granting Sequence

15
Credit Policy
Part of Credit Administration is establishing the Credit Policy, which includes the following decision variables:
1. Credit Standards - Create a profile of the minimally acceptable credit-worthy customer.
2. Credit Terms - Define how long the customer has to pay and/or the offering of Cash Discounts.
3. Credit Limits - Determine the amount of cumulative credit offered to a single customer and/or group of customer.
4. Collection Process (Chapter 6)- Determine how and when past-due accounts are handled.

16
Credit-Granting Process
MARKETING CONTACT
CREDIT INVESTIGATION
CUSTOMER CONTACT FOR INFORMATION
FINALIZE WRITTEN DOCUMENTS
ESTABLISH CUSTOMER CREDIT FILE
FINANCIAL ANALYSIS
Tim
e
17
Credit Standards
Financial and non-financial data is used to establish the profile of the minimally acceptable credit-worthy customer.
The process is similar to the underwriting process at a bank.
Marginal account might include: Smaller amounts and/or shorter terms.
A probationary period.
Collateral or a Bank Letter of Credit.

18
Credit Standards
Unique customer data is gathered to assess credit-worthiness and is compared to the benchmark, including:
Client-provided data, such as financial statements and receivable agings (next slide) from which ratio and trend analysis and industry comparisons can be performed.
Subscriber-based credit reporting agencies, such as D&B, which provide company history and family, business registration, operations, SIC and NAICS, payment records, maximum credit lines, financial statements, banking, public filings (suits, liens, judgments, UCC), and other credit and financial information.
Information from banks, industry and trade associations, and other suppliers, including publicly-available information.

19
Credit-Scoring Models
Firms regularly model a firms likelihood to pay. Credit-scoring Models are predictive models that use
collective, historical borrower data to assess the likelihood of future default of a potential, single borrower.

20
Sample Credit Scoring Model
A model could be based on company and credit attributes, such as those below. These attributes are weighted based on predictive importance: Credit History of Principals / Business Unused Credit Industry Type Available Liquid Assets Net Worth of Principals
21
Credit Terms
Once a customer is approved for credit, the firm must define how long the customer has to pay (Credit Period) and/or any Cash Discounts offered. The Credit Period must be defined, but usually
begins with the invoice date and ends when the payment is received at the remittance address. Some firms use the date the goods are shipped or
received.

22
Credit Terms
Factors affecting Credit Terms include: Competition (standard terms exist within industries) Customer’s operating cycle Type of goods (raw materials, finished goods,
perishables, etc.) Seasonality of demand Consumer acceptance Cost and pricing Customer type Product profit margin
23
Credit Terms
Cash Discounts provide a financial incentive to encourage early customer payments. “2/10, net 30”
The customer may deduct 2% of the entire invoice amount if paid within 10 days; if the discount is not taken, the invoice is due in 30 days (the customer pays $98 per $100 invoiced amount).
“2/10, prox net 30” The customer may deduct 2% of the entire invoice amount if
paid within 10 days; if the discount is not taken, the invoice is due on the 30th day of the following month.
60% of firms offer cash discounts, but they are offered only to select customers.
24
Credit Terms
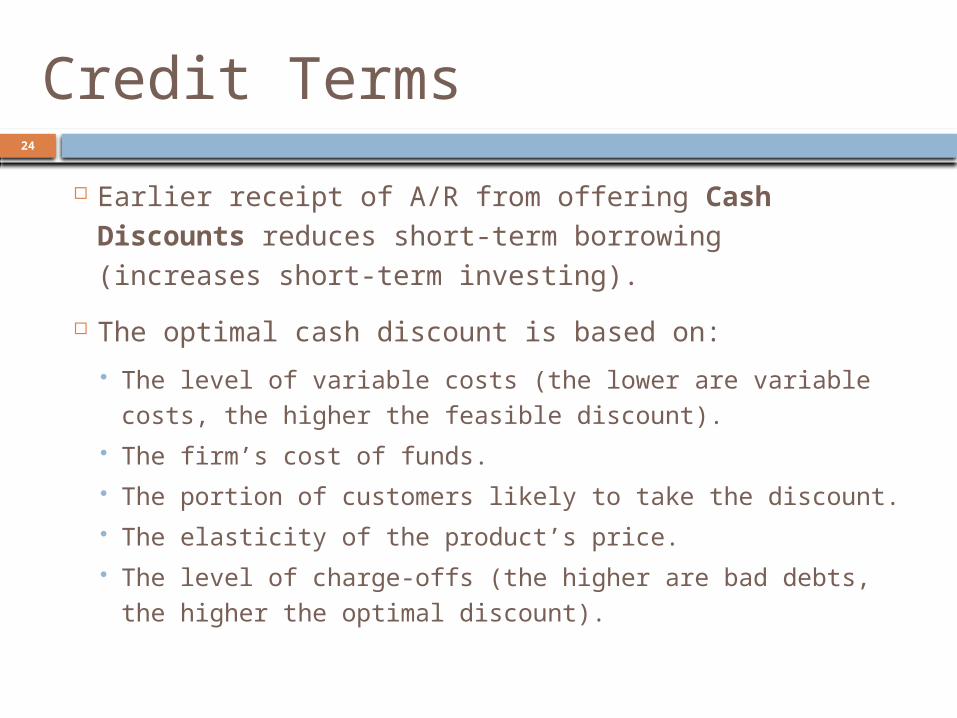
Earlier receipt of A/R from offering Cash Discounts reduces short-term borrowing (increases short-term investing).
The optimal cash discount is based on:
The level of variable costs (the lower are variable costs, the higher the feasible discount).
The firm’s cost of funds. The portion of customers likely to take the discount. The elasticity of the product’s price. The level of charge-offs (the higher are bad debts, the
higher the optimal discount).

25
Credit Terms
Firms must decide whether to impose (and/or enforce) late penalties. If a firm is too aggressive, it could drive
customers to the competition.

26
Credit Limits
Credit Limits are the amount of cumulative credit offered to a single customer or group of customers and is determined by:
Percentage of the customer’s net worth.
Percentage of the high credit amount reported by other suppliers.
Judgment (gut call).
27
Calculating NPV of Potential Sale
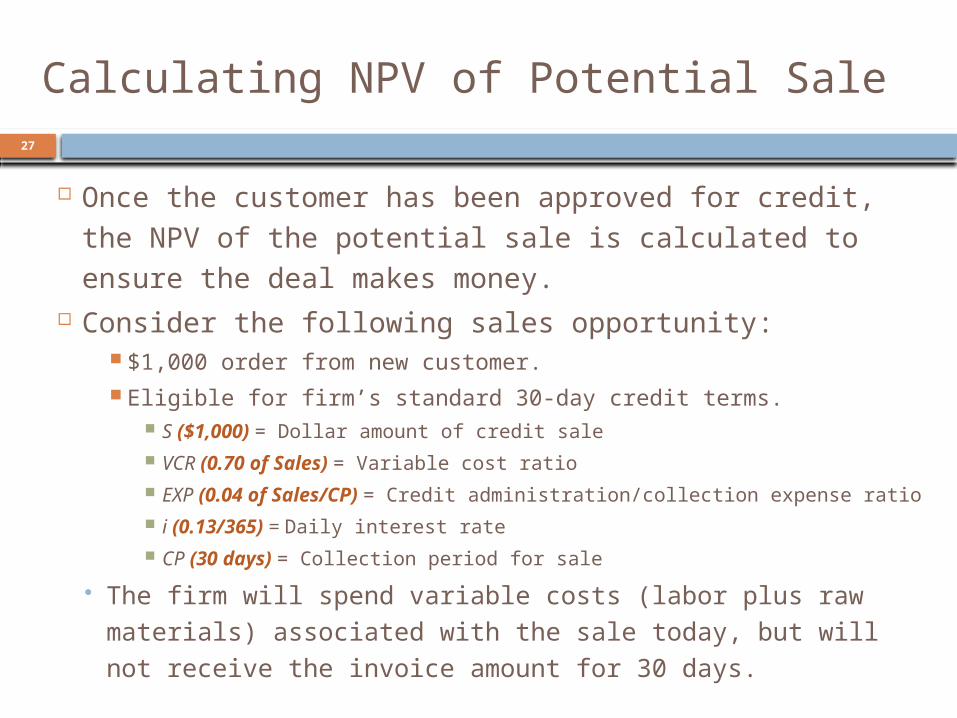
Once the customer has been approved for credit, the NPV of the potential sale is calculated to ensure the deal makes money.
Consider the following sales opportunity: $1,000 order from new customer. Eligible for firm’s standard 30-day credit terms.
S ($1,000) = Dollar amount of credit sale
VCR (0.70 of Sales) = Variable cost ratio
EXP (0.04 of Sales/CP) = Credit administration/collection expense ratio
i (0.13/365) = Daily interest rate
CP (30 days) = Collection period for sale
The firm will spend variable costs (labor plus raw materials) associated with the sale today, but will not receive the invoice amount for 30 days.
28
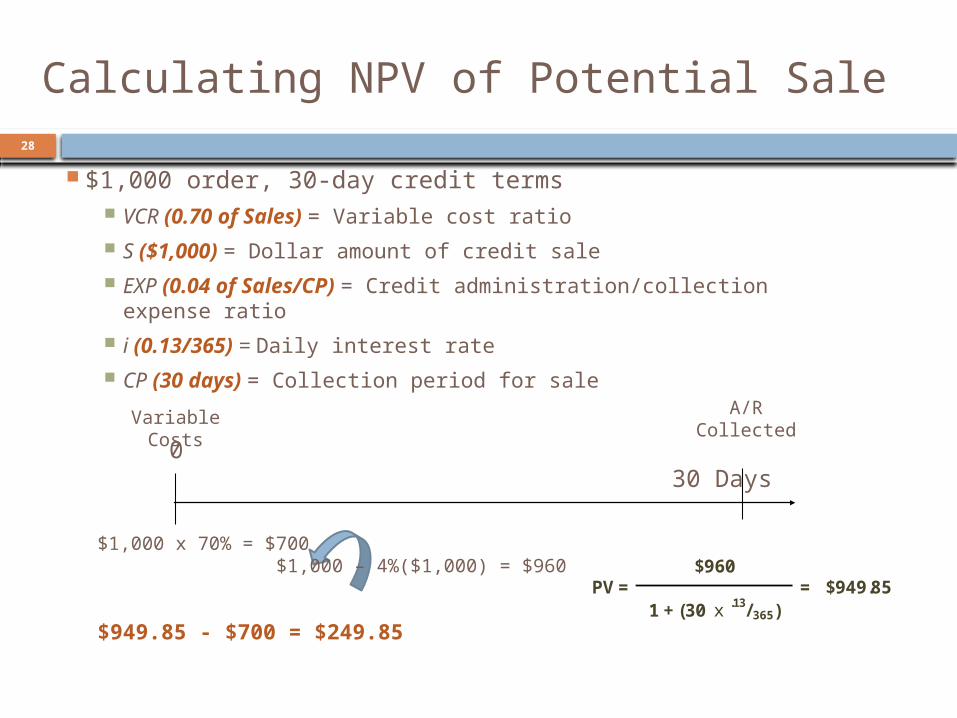
$1,000 order, 30-day credit terms VCR (0.70 of Sales) = Variable cost ratio
S ($1,000) = Dollar amount of credit sale
EXP (0.04 of Sales/CP) = Credit administration/collection expense ratio
i (0.13/365) = Daily interest rate
CP (30 days) = Collection period for sale
0 30 Days
$1,000 х 70% = $700 $1,000 – 4%($1,000) = $960
$949.85 - $700 = $249.85
Variable Costs A/R Collected
Calculating NPV of Potential Sale
$960
1 + (30 х .13/365)
PV = = $949.85

29
Calculating NPV of Potential Sale
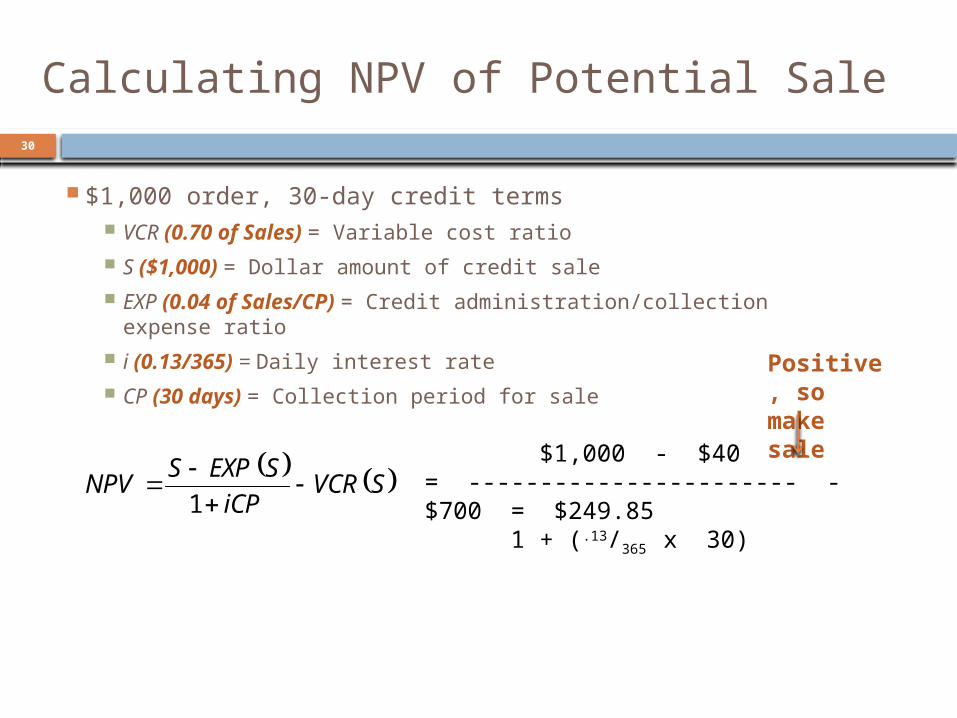
The following formula can be used:
Where: NPV = Net present value of the credit sale VCR = Variable cost ratio S = Dollar amount of credit sale EXP = Credit administration/collection expense ratio (end-of-period)
i = Daily interest rate CP = Collection period for sale (days)
NPV > 0 Extend CreditNPV = 0 Probably Extend CreditNPV < 0 Do Not Extend Credit
SVCRiCP
SEXPSNPV
1
30
$1,000 - $40= ----------------------- - $700 = $249.85 1 + (.13/365 х 30)
Positive, so make sale
Calculating NPV of Potential Sale
$1,000 order, 30-day credit terms VCR (0.70 of Sales) = Variable cost ratio
S ($1,000) = Dollar amount of credit sale
EXP (0.04 of Sales/CP) = Credit administration/collection expense ratio
i (0.13/365) = Daily interest rate
CP (30 days) = Collection period for sale
SVCRiCP
SEXPSNPV
1
31
Calculating NPV
How is NPV affected if the new client does not pay exactly on time (or pays early or does not pay at all)?
The longer someone owes you, the greater the chance you will never get paid!
Risk can be incorporated into the analysis based on a probability distribution of payment dates.

32
$1,000 - $40= ----------------------- - $700 = $249.85 1 + (.13/365 х 30)
Calculating NPV – Example Cont’d
Continuing with this example, we can model how late payments affect the result.
Before, our calculation assumed that the customer paid exactly on-time at the 30-day mark. We can use collective, historical customer data to predict more realistic payment timing for the new customer.
SVCRiCP
SEXPSNPV
1
33
Calculating NPV – Example Cont’d
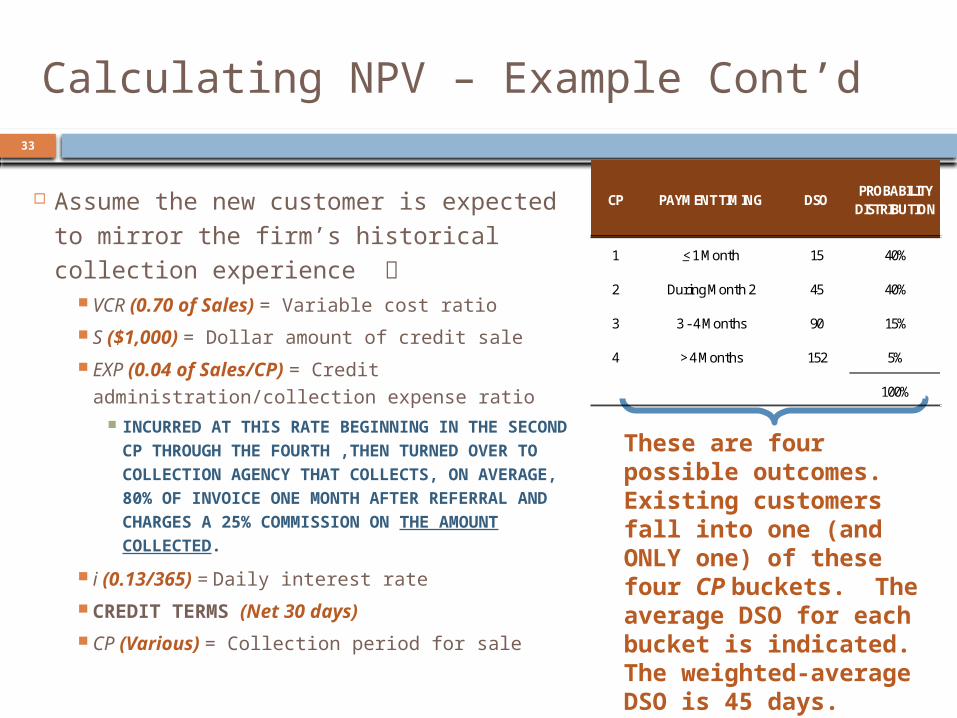
Assume the new customer is expected to mirror the firm’s historical collection experience
VCR (0.70 of Sales) = Variable cost ratio
S ($1,000) = Dollar amount of credit sale
EXP (0.04 of Sales/CP) = Credit administration/collection
expense ratio INCURRED AT THIS RATE BEGINNING IN THE
SECOND CP THROUGH THE FOURTH ,THEN TURNED OVER TO COLLECTION AGENCY THAT COLLECTS, ON AVERAGE, 80% OF INVOICE ONE MONTH AFTER REFERRAL AND CHARGES A 25% COMMISSION ON THE AMOUNT COLLECTED.
i (0.13/365) = Daily interest rate
CREDIT TERMS (Net 30 days)
CP (Various) = Collection period for sale
These are four possible outcomes. Existing customers fall into one (and ONLY one) of these four CP buckets. The average DSO for each bucket is indicated. The weighted-average DSO is 45 days.
1 < 1 Month 15 40%
2 During Month 2 45 40%
3 3 - 4 Months 90 15%
4 > 4 Months 152 5%
100%
DSOPROBABILITY
DISTRIBUTIONCP PAYMENT TIMING
34
Calculating NPV – Example Cont’d
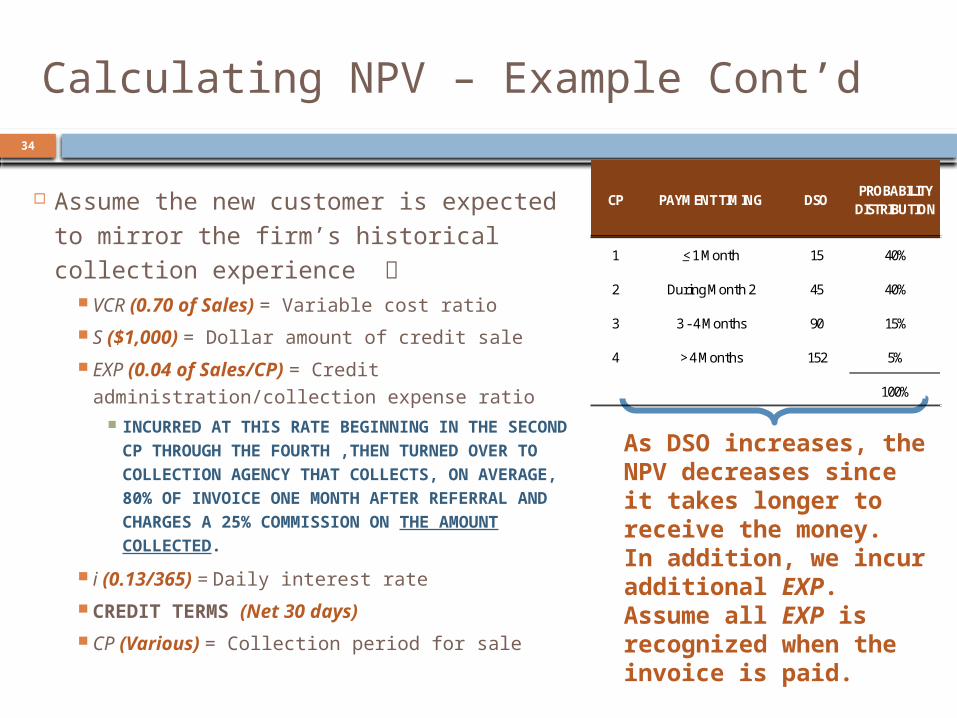
As DSO increases, the NPV decreases since it takes longer to receive the money. In addition, we incur additional EXP. Assume all EXP is recognized when the invoice is paid.
Assume the new customer is expected to mirror the firm’s historical collection experience
VCR (0.70 of Sales) = Variable cost ratio
S ($1,000) = Dollar amount of credit sale
EXP (0.04 of Sales/CP) = Credit administration/collection
expense ratio INCURRED AT THIS RATE BEGINNING IN THE
SECOND CP THROUGH THE FOURTH ,THEN TURNED OVER TO COLLECTION AGENCY THAT COLLECTS, ON AVERAGE, 80% OF INVOICE ONE MONTH AFTER REFERRAL AND CHARGES A 25% COMMISSION ON THE AMOUNT COLLECTED.
i (0.13/365) = Daily interest rate
CREDIT TERMS (Net 30 days)
CP (Various) = Collection period for sale
1 < 1 Month 15 40%
2 During Month 2 45 40%
3 3 - 4 Months 90 15%
4 > 4 Months 152 5%
100%
DSOPROBABILITY
DISTRIBUTIONCP PAYMENT TIMING
35
Calculating NPV – Example Cont’d
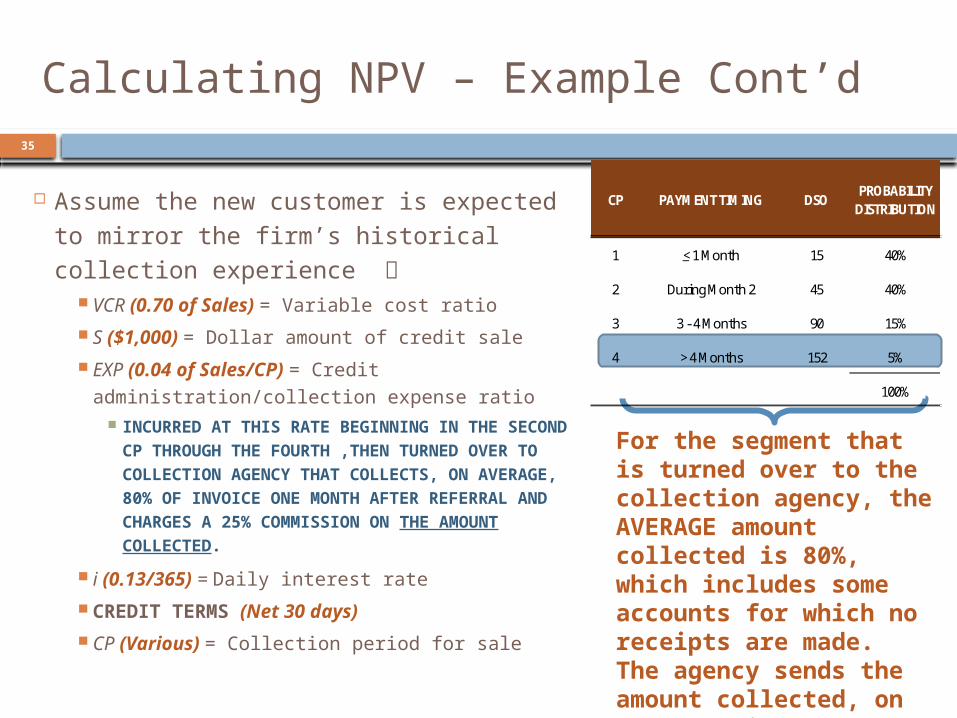
For the segment that is turned over to the collection agency, the AVERAGE amount collected is 80%, which includes some accounts for which no receipts are made. The agency sends the amount collected, on average, in 152 days.
Assume the new customer is expected to mirror the firm’s historical collection experience
VCR (0.70 of Sales) = Variable cost ratio
S ($1,000) = Dollar amount of credit sale
EXP (0.04 of Sales/CP) = Credit administration/collection
expense ratio INCURRED AT THIS RATE BEGINNING IN THE
SECOND CP THROUGH THE FOURTH ,THEN TURNED OVER TO COLLECTION AGENCY THAT COLLECTS, ON AVERAGE, 80% OF INVOICE ONE MONTH AFTER REFERRAL AND CHARGES A 25% COMMISSION ON THE AMOUNT COLLECTED.
i (0.13/365) = Daily interest rate
CREDIT TERMS (Net 30 days)
CP (Various) = Collection period for sale
1 < 1 Month 15 40%
2 During Month 2 45 40%
3 3 - 4 Months 90 15%
4 > 4 Months 152 5%
100%
DSOPROBABILITY
DISTRIBUTIONCP PAYMENT TIMING

36
Calculating NPV – Example Cont’d
Timeline for EXP (0.04 of Sales/CP) INCURRED AT THIS RATE BEGINNING IN THE SECOND
CP THROUGH THE FOURTH ,THEN TURNED OVER TO COLLECTION AGENCY THAT COLLECTS, ON AVERAGE, 80% OF INVOICE ONE MONTH AFTER REFERRAL AND CHARGES A 25% COMMISSION ON THE AMOUNT COLLECTED.
EXP
152 DSO0
EXP
90 DSO
EXP
45 DSO
EXP
15 DSO
The customer will pay in ONE of these discrete CP ranges; with the average DSO
indicated (the mid-point).
1 2 3 4
1 < 1 Month 15 40%
2 During Month 2 45 40%
3 3 - 4 Months 90 15%
4 > 4 Months 152 5%
100%
DSOPROBABILITY
DISTRIBUTIONCP PAYMENT TIMING

37
Calculating NPV – Example Cont’d
EXP
152 DSO0
EXP
90 DSO
EXP
45 DSO
EXP
15 DSO
Cumulative
Cash Flows
If the new customer pays on time like 40% of our customers (in the first CP), there is no EXP
incurred.
1 < 1 Month 15 40%
2 During Month 2 45 40%
3 3 - 4 Months 90 15%
4 > 4 Months 152 5%
100%
DSOPROBABILITY
DISTRIBUTIONCP PAYMENT TIMING Timeline for EXP (0.04 of Sales/CP)
INCURRED AT THIS RATE BEGINNING IN THE SECOND CP THROUGH THE FOURTH ,THEN TURNED OVER TO COLLECTION AGENCY THAT COLLECTS, ON AVERAGE, 80% OF INVOICE ONE MONTH AFTER REFERRAL AND CHARGES A 25% COMMISSION ON THE AMOUNT COLLECTED.

38
Calculating NPV – Example Cont’d
EXP
152 DSO0
EXP
90 DSO
EXP
45 DSO
EXP
15 DSO
Instead, if the customer pays in the second CP, an initial $40 EXP is incurred, and recognized at t=45 days.
Cumulative $40
Cash Flows $1,000 х 4% = $40
1 < 1 Month 15 40%
2 During Month 2 45 40%
3 3 - 4 Months 90 15%
4 > 4 Months 152 5%
100%
DSOPROBABILITY
DISTRIBUTIONCP PAYMENT TIMING Timeline for EXP (0.04 of Sales/CP)
INCURRED AT THIS RATE BEGINNING IN THE SECOND CP THROUGH THE FOURTH ,THEN TURNED OVER TO COLLECTION AGENCY THAT COLLECTS, ON AVERAGE, 80% OF INVOICE ONE MONTH AFTER REFERRAL AND CHARGES A 25% COMMISSION ON THE AMOUNT COLLECTED.
39
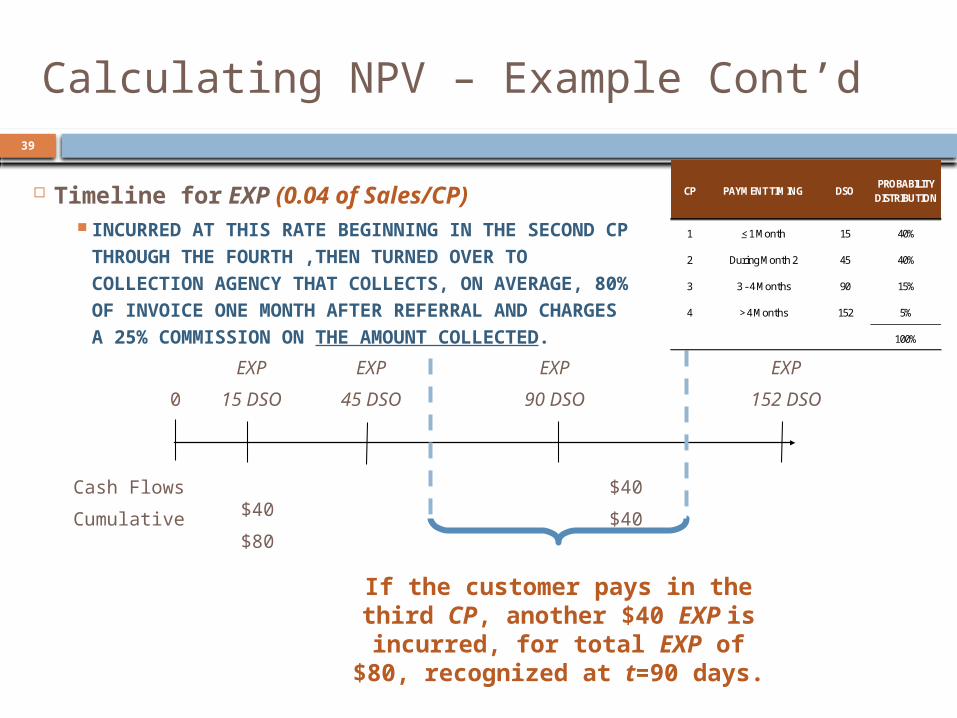
Calculating NPV – Example Cont’d
EXP
152 DSO0
EXP
90 DSO
EXP
45 DSO
EXP
15 DSO
If the customer pays in the third CP, another $40 EXP is
incurred, for total EXP of $80, recognized at t=90 days.
Cumulative $40 $80
Cash Flows $40 $40
1 < 1 Month 15 40%
2 During Month 2 45 40%
3 3 - 4 Months 90 15%
4 > 4 Months 152 5%
100%
DSOPROBABILITY
DISTRIBUTIONCP PAYMENT TIMING Timeline for EXP (0.04 of Sales/CP)
INCURRED AT THIS RATE BEGINNING IN THE SECOND CP THROUGH THE FOURTH ,THEN TURNED OVER TO COLLECTION AGENCY THAT COLLECTS, ON AVERAGE, 80% OF INVOICE ONE MONTH AFTER REFERRAL AND CHARGES A 25% COMMISSION ON THE AMOUNT COLLECTED.
40
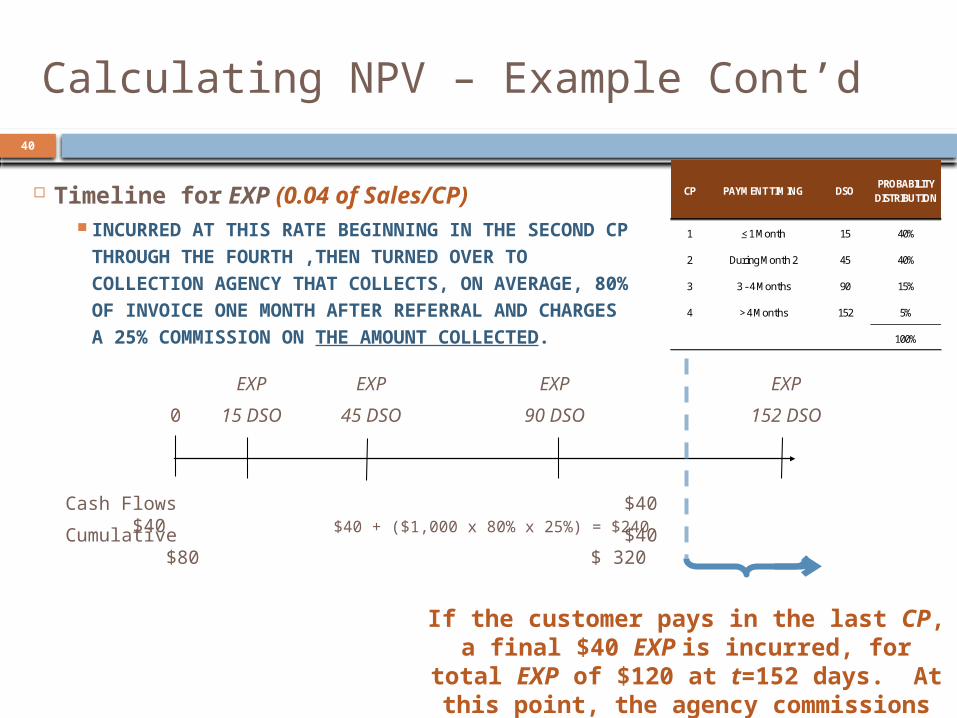
Calculating NPV – Example Cont’d
EXP
152 DSO0
EXP
90 DSO
EXP
45 DSO
EXP
15 DSO
If the customer pays in the last CP, a final $40 EXP is incurred, for total EXP of $120 at t=152 days. At this point,
the agency commissions are also paid.
Cumulative $40 $80 $ 320
Cash Flows $40 $40 $40 + ($1,000 х 80% х 25%) = $240
1 < 1 Month 15 40%
2 During Month 2 45 40%
3 3 - 4 Months 90 15%
4 > 4 Months 152 5%
100%
DSOPROBABILITY
DISTRIBUTIONCP PAYMENT TIMING Timeline for EXP (0.04 of Sales/CP)
INCURRED AT THIS RATE BEGINNING IN THE SECOND CP THROUGH THE FOURTH ,THEN TURNED OVER TO COLLECTION AGENCY THAT COLLECTS, ON AVERAGE, 80% OF INVOICE ONE MONTH AFTER REFERRAL AND CHARGES A 25% COMMISSION ON THE AMOUNT COLLECTED.
41
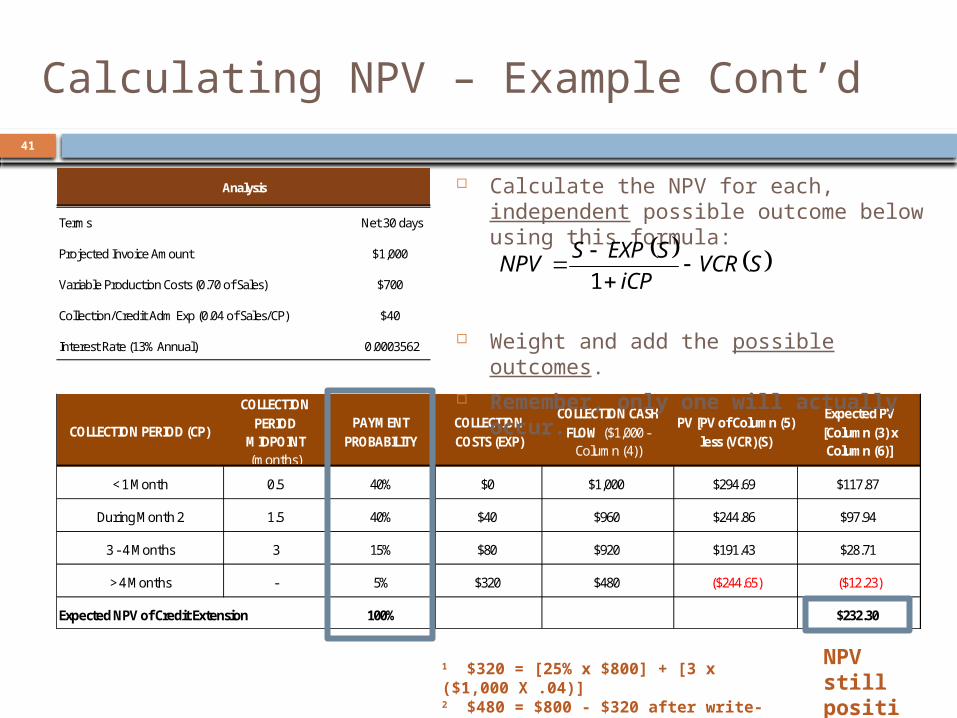
< 1 Month 0.5 40% $0 $1,000 $294.69 $117.87
During Month 2 1.5 40% $40 $960 $244.86 $97.94
3 - 4 Months 3 15% $80 $920 $191.43 $28.71
> 4 Months - 5% $320 $480 ($244.65) ($12.23)
Expected NPV of Credit Extension 100% $232.30
PAYMENT PROBABILITY
COLLECTION COSTS (EXP)
COLLECTION CASH FLOW ($1,000 -
Column (4))
PV [PV of Column (5) less (VCR)(S)
Expected PV [Column (3) x Column (6)]
COLLECTION PERIOD
MIDPOINT (months)
COLLECTION PERIOD (CP)
Calculating NPV – Example Cont’d
1 $320 = [25% x $800] + [3 x ($1,000 X .04)]2 $480 = $800 - $320 after write-off of bad debt
Calculate the NPV for each, independent possible outcome below using this formula:
Weight and add the possible outcomes. Remember, only one will actually
occur.
NPV still positive.
Terms Net 30 days
Projected Invoice Amount $1,000
Variable Production Costs (0.70 of Sales) $700
Collection/Credit Adm Exp (0.04 of Sales/CP) $40
Interest Rate (13% Annual) 0.0003562
Analysis
SVCRiCP
SEXPSNPV
1

42
Final Thoughts
Our goal is to design a credit policy that combines mutually-exclusive alternatives such that NPV is maximized.
In theory, if no credit policy alternative results in a positive NPV, credit terms would not be offered and the firm would sell on a cash-only basis.
Or, the pricing and/or cost structure of the sale would require adjustment.