Short-Selling Prior to Earnings...
35
Short-Selling Prior to Earnings Announcements By Stephen E. Christophe George Mason University School of Management/ MS 5F5 Fairfax, VA 22030 Tel. (703) 993-1767, FAX 993-1870 [email protected] Michael G. Ferri George Mason University School of Management/ MS 5F5 Fairfax, VA 22030 Tel. (703) 993-1893, FAX 993-1870 [email protected] and James J. Angel Georgetown University The McDonough School of Business Room G-4 Old North Washington, D.C. 20057 Tel. (202) 687-3765, FAX 687-4031 [email protected] November, 2002 Direct all correspondence to: Stephen E. Christophe, School of Management, MS 5F5, George Mason University, Fairfax, VA 22030, (703) 993-1767, [email protected]. We thank the Nasdaq Stock Market for providing the data. Christophe gratefully acknowledges financial support from George Mason University. Angel and Ferri gratefully acknowledge financial support from the Nasdaq Educational Foundation, and especially thank Laura Levine of the NEF. We greatly appreciate the assistance and comments of the officers and directors of Nasdaq’s Office of Economic Research – Michael Edleson, Timothy McCormick, Jeffrey W. Smith, and Frank Hatheway. We also appreciate the comments and suggestions of seminar participants at Nasdaq’s Office of Economic Research, and at the George Mason University Statistics Seminar Series. Finally, we thank Dharmesh Trivedi and Adolfo Laurenti for valuable research assistance. The views expressed in this paper, however, are those of the authors and do not necessarily reflect the views of the Nasdaq Stock Market, Inc., the Nasdaq Educational Foundation, or anyone else.
Transcript of Short-Selling Prior to Earnings...

Short-Selling Prior to Earnings Announcements
By
Stephen E. Christophe George Mason University
School of Management/ MS 5F5 Fairfax, VA 22030
Tel. (703) 993-1767, FAX 993-1870 [email protected]
Michael G. Ferri
George Mason University School of Management/ MS 5F5
Fairfax, VA 22030 Tel. (703) 993-1893, FAX 993-1870
and
James J. Angel Georgetown University
The McDonough School of Business Room G-4 Old North
Washington, D.C. 20057 Tel. (202) 687-3765, FAX 687-4031
November, 2002
Direct all correspondence to: Stephen E. Christophe, School of Management, MS 5F5, George Mason University, Fairfax, VA 22030, (703) 993-1767, [email protected]. We thank the Nasdaq Stock Market for providing the data. Christophe gratefully acknowledges financial support from George Mason University. Angel and Ferri gratefully acknowledge financial support from the Nasdaq Educational Foundation, and especially thank Laura Levine of the NEF. We greatly appreciate the assistance and comments of the officers and directors of Nasdaq’s Office of Economic Research – Michael Edleson, Timothy McCormick, Jeffrey W. Smith, and Frank Hatheway. We also appreciate the comments and suggestions of seminar participants at Nasdaq’s Office of Economic Research, and at the George Mason University Statistics Seminar Series. Finally, we thank Dharmesh Trivedi and Adolfo Laurenti for valuable research assistance. The views expressed in this paper, however, are those of the authors and do not necessarily reflect the views of the Nasdaq Stock Market, Inc., the Nasdaq Educational Foundation, or anyone else.

Abstract
Short-Selling Prior to Earnings Announcements This article examines the characteristics of short-sales transactions prior to the earnings announcements of 913 Nasdaq-listed firms. The results indicate that short-selling does not generally increase for most firms prior to earnings announcements. For a subset of companies, however, abnormal short-selling is dramatically positive in the pre-announcement period. Model estimation presents evidence of informed trading in that pre-announcement abnormal short-selling is significantly linked with the stock price reaction that occurs when earnings are ultimately revealed. Given the results of this study, financial market rulemakers may want to consider providing more extensive and timely disclosures of short-selling in order to facilitate more orderly price movements and the efficient incorporation of private information into stock prices.

1
Short-Selling Prior to Earnings Announcements
Corporate earnings announcements are scheduled information disclosure events that often
convey unfavorable news. Informed traders with private information can establish short
positions in the stocks of firms they expect to report negative earnings surprises in anticipation of
obtaining sizeable returns from falling share prices. This paper employs a unique data set to
explore the characteristics of short-sales transactions prior to the earnings announcements of 913
Nasdaq firms in the Fall of 2000. The data set consists of records from Nasdaq’s Automated
Confirmation Transaction Service (ACT) which processed the vast preponderance of transactions
in these stocks during that interval. The ACT records contain substantial information including
the identification of every ACT-processed trade in which the stock is sold short.
This paper utilizes this data to examine two specific issues. The first is the general or
aggregate pattern of short-selling, measured in several ways, around earnings announcements.
This analysis presents a previously unavailable insight into short-selling activity prior to and
around an important corporate event whose date is known in advance. The data reveal that
aggregate short-selling over the entire sample – which includes negative, neutral, and positive
earnings surprises – does not rise meaningfully in advance of the announcements. Short-selling
does, however, rise substantially for a set of specific stocks. This finding points to the possibility
that the increases in short-selling that do occur could be the work of informed investors who
select and target individual firms.

2
To investigate this possibility explicitly, the second issue examined is whether unusual
levels of short-selling in pre-announcement days are undertaken by investors who successfully
anticipate the content of the announcements. If short-sellers are primarily informed traders,
atypical increases in short-selling should occur with some frequency prior to negative earnings
surprises and their associated price declines.i On the other hand, if uninformed speculators
and/or hedgers dominate short-selling, pre-announcement short sales should be more or less
uniformly dispersed across positive, neutral, and negative earnings surprises.
Two tests of the link between pre-announcement short-selling and post-announcement
stock price changes are employed. The first consists of a multivariate model that, with the help
of several control variables, uncovers a significantly negative relationship between unusual
levels of short-selling in the days before the announcement and the immediate post-
announcement change in stock prices. This result is consistent with the notion that a significant
portion of the short-sellers are informed traders.
The second test examines the predictive power associated with the sub-samples of cases
in which short-selling is unusually high or low. The tests produce results that strongly suggest
that unusually large increases in pre-announcement short-selling often precede significantly
unfavorable stock price reactions to the announcements. However, the test reveals another
intriguing fact – short-sellers are not always correct and sometimes short numerous shares before
a sharp post-announcement rise in the stock price. Nonetheless, the analysis of these distinctive
cases, on balance, adds support to the view that a key motivation of short-selling might well be
the possession of information not yet incorporated in the prices of shares.
Collectively, the empirical results presented here raise a key question of market policy:
should U.S. stock markets become more transparent and issue more frequent and detailed reports

3
about short sales? In a study of the Australian market, Aitken, Frino, McCorry, and Swann
(1998) find that its standard, trade-by-trade disclosure of short-selling is quickly reflected in
share prices. Presently in the U.S., by contrast, the publicly available information on short-
selling is limited to the exchanges’ once-per-month reports of short interest on individual stocks,
where short interest represents the total number of shorted shares of a security on one specific
day during that month. If the existence of unusual amounts of short-selling activity precedes
significant declines in stock prices, regulators should consider requiring markets to disclose more
extensive and timely reports of short-selling activity. Such a flow of information could improve
market efficiency and the orderliness of movements in security prices.
This research into a large set of transactions data complements prior empirical analysis
into the level of, and changes in, exchanges’ reports on their companies’ short interest.ii Though
these reports give only a monthly figure (and fail to distinguish the short interest of dealers
engaged in inventory management from that of customers), this body of research has revealed
interesting patterns. For example, Desai, Ramesh, Thiagarajan, and Balachandran (2002)
examine the association between short interest and subsequent returns for a broad sample of
Nasdaq stocks. After controlling for market, size, book-to-market, and momentum factors, these
authors find that high short interest precedes significantly negative abnormal returns over the
subsequent year. Dechow, Hutton, Meulbroek, and Sloan (2001) study short interest for NYSE
and AMEX firms and report that short-sellers generate positive abnormal returns by targeting
companies with low ratios of fundamentals (such as cash flow, earnings, book value, and value
as measured using the Ohlson (1995) model) to stock price. Senchack and Starks (1993) report a
significantly negative return in the period surrounding a substantial increase in short interest and
also find that greater increases in unexpected short interest lead to greater negative returns.

4
Asquith and Meulbroek (1996) examine a sample of NYSE and AMEX firms and discover that
future negative abnormal stock returns are associated with large short interest positions. Choie
and Hwang (1994) report confirming results with regards to performance relative to the S&P 500
Index. Safieddine and Wilhelm (1996) find that short interest grows before seasoned equity
offerings and has an impact on their price discounts.
Our paper’s focus on an extensive, market-wide set of transactions data also
complements some recent studies that have examined a sub-set of short-selling transactions
through access to the equity lending activities of a single custodian bank. For example, Geczy,
Musto, and Reed (2002) explore the potential profitability of a variety of short-selling strategies
while incorporating the costs of borrowing shares in the equity lending market. They find that
investment strategies based upon going short (long) growth (value) stocks, large (small) market
capitalization stocks, and low (high) momentum stocks can all potentially generate profits after
including the costs associated with short-selling. D’Avolio (2002) reports that most stocks are
relatively easy to borrow (with only about nine percent of stocks on “special”), recall risk is
relatively rare (thus the risk of a “short squeeze” is low), and that stocks that are apparently
impossible to borrow tend to be small, illiquid companies that trade for under $5 per share. Reed
(2001) investigates loan rates in the equity lending market around earnings announcements dates.
As predicted by the Diamond and Verrecchia (1987) model, Reed finds an increased stock price
reaction associated with negative earnings announcements when short-selling is costly.
The remainder of the paper proceeds as follows. The next section describes the data and
sample; the third section presents estimations and results; and a final section contains a summary
and conclusion.

5
I. Data and Sample
The source of our data on short-selling transactions is ACT, which processed the vast
preponderance of transactions in Nasdaq-listed stocks during our study period. Most market
participants in Nasdaq-listed stocks are required to report their trades to ACT within 90 seconds
of execution.iii In addition to the price and volume statistics that are broadcast to investors, the
data also contain a required identifier that indicates whether a customer is selling short. This
data field is regularly audited by NASD Regulation to ensure compliance with the Nasdaq Short
Sale Rule.
Customer short sales fall into one of two general categories which are identified
separately and distinctly by the ACT identifier. The first category is designated “short exempt,”
because these sales are free of the restrictions of the Nasdaq Short Sale Rule.iv “Short exempt”
sales primarily involve activities such as the arbitrage of positions on options or foreign markets,
the hedging of deliveries due within a few days, and the distribution by an underwriter of an IPO.
The second category of short sales has the simple designation “short.” This group of short sales
is the focal point of our analysis.
We believe that substantially all the non-exempt short sales analyzed here are trades in
which the sellers anticipate subsequent share price deterioration or relative underperformance.
Any seller in a short transaction who has the right to claim exemption from the Rule would do
so, because the exemption allows the sale to be executed when short sales would otherwise be
prohibited.
Despite the obvious and unique value of this data set, it does have two limitations. First,
ACT files do not identify purchases that “cover” or reverse short sales. Thus, the data support

6
the computation only of a stock’s gross short sales, in terms of transactions or shares, in any
given period; the data do not permit a calculation of “net” short activity in any period.
Second, ACT records do not indicate whether a seller transacting through the Small
Order Execution System (SOES) is shorting. Nonetheless, since SOES handled only about 2%
of all Nasdaq transactions in 2000, the number of missed short sales is probably not large.v
Further, ACT rules do not require qualified Nasdaq market makers to flag their short trades.
Thus, our study results highlight the short-selling of end-investors without the confounding
influence of market maker trades which may be influenced by inventory control, rather than
information, considerations.
The sample is drawn from over 3,000 U.S.-domiciled companies whose common stocks
were listed on the Nasdaq and covered by ACT during the period from September 13 to
December 12, 2000. This period begins after the late August-Labor Day time of limited trading
and ends several weeks before the end of the calendar year when short-selling can be strongly
influenced by tax-related concerns. To minimize the potential for drawing improper inferences
from thinly traded stocks, any stock was deleted if it (a) did not trade every day and (b) had an
average daily volume less than 100 trades per day in the sample period. These criteria reduced
the sample to 1,391 stocks.vi
For each firm in this set, Compustat PC Plus was searched for a record of an earnings
announcement that occurred between September 19 and December 12, 2000. (The September 19
cutoff was necessary because short-selling is examined in this study over several pre-
announcement days.) Compustat records the date when an earnings announcement is first
reported in the news media (such as the Wall Street Journal or the Dow Jones News Service).
The accuracy of these dates was verified with a subsequent search on the Dow Jones Interactive

7
Publications Library which also resulted in the identification of a time-stamp for each
announcement. This time stamp is used to identify the first trading day after the announcement.
If the announcement occurred before or during trading hours on the announcement day, that day
is designated as the first trading day. However, if a firm’s announcement occurred after trading
hours, the next trading day is designated as the first trading day. Excluding those corporations
for which we could not find a precise time and day of announcement pares the group of usable
stocks to approximately 1,100.
The final sample restriction is guided by the finding of D’Avolio (2002) that stocks with
low prices can be difficult to short. Consequently, every stock whose price fell below $10 in the
five-day period prior to the earnings announcement is deleted. This restriction, which is also
justified by the fact that stocks with low prices present only limited profits from short-selling,
reduces the sample to 913 stocks.
Table 1 presents the month-by-month and day-of-the-week distributions of the earnings
announcements for these 913 firms. Most announcements (661) occur during October; the
fewest (11) occur in December. Announcements appear to follow a day-of-the-week pattern
with the most occurring on Thursdays, and the least occurring on Fridays.
Table 2 presents summary information on the overall pattern of short-selling for the
sample firms. As shown in Panel A, the mean amount of average daily shares sold short during
the entire sample period of 64 days is 53.28 thousand shares. These short sales on average
represent 3.53% of total traded shares.vii Some sample firms experience substantial short-selling,
as indicated by the maximum value of 27.28% for the percentage of shorted shares. Panel B
provides statistics on holding-period returns for sample firms during the five days preceding the
earnings announcement, and for both sample firms and the Nasdaq equally-weighted market

8
index for the two-day holding period beginning on the day of the earnings announcement
(hereafter in this paper, the term “earnings announcement day” represents the first trading day
when the newly revealed information contained in the earnings announcement can be revealed in
stock price).viii The mean (median) two-day percentage return following the earnings
announcement is -0.99% (-0.70%). The corresponding mean (median) return on the Nasdaq
equally-weighted market index is -0.27% (0.20). The implication of these returns is that the
average earnings announcement represents a small negative earnings surprise.
II. Estimations and Results
A. General Pattern of Short-Selling Prior to Earnings Announcements
Beginning with Ball and Brown (1968), a wide body of empirical research has
demonstrated an association between accounting information and security returns. An earnings
announcement is a known-in-advance disclosure that may result in a stock price reaction (either
positive or negative) as its new information becomes impounded into the stock price.
Consequently, an announcement date provides short-sellers with a specific opportunity to profit
from a disappointing earnings statement (which results in a stock price decline) by engaging in
informed trading and/or simple speculation.
Whether or not short-sellers specifically target these dates is an empirical issue which,
due to prior data unavailability, has heretofore not been investigated. Therefore, the first issue
we examine is the general pattern of short-selling around earnings announcements. For this
analysis, a firm-by-firm estimate of abnormal short-selling is made, where this statistic is defined
as the percentage difference between (a) the number of shares sold short in a day (or the daily
average over several days) within a 7-day window surrounding the earnings announcement and

9
(b) the average daily number of shares sold short during the other 57 days of the sample period.
Implicit in this approach is the assumption that average daily short-selling during those 57 days
is a fair representation of the issue’s typical daily level of short-selling.
More formally, a stock’s abnormal short-selling, for a day or for an interval, is measured
as:
1−=j
jj AVESS
SSABSS (1)
where: ABSSj = the average daily abnormal short-selling for the stock over day j or
interval j; SSj = the number of the issue’s shares sold short during day j or the daily
average of shorted shares during interval j; and AVESSj = the daily average number of the shares sold short prior to day -5
and after day +1, relative to the announcement day.
Abnormal short-selling is computed for each sample firm for each of the seven days (-5 through
+1) surrounding and including the earnings announcement (day 0), and for two multi-day
intervals, (-3,-1) and (-5,-1), prior to the earnings announcement. ix The intervals are considered
because there is no reason to expect that abnormal short-selling will occur only on one (or two)
days prior to the announcement. Indeed, theoretical work by Kyle (1985) argues that informed
traders have an incentive to disguise their private information by engaging in a number of
relatively smaller trades rather than a single, large trade. Consequently, informed investors
might well distribute their short-selling over several days prior to the announcement.x
It is possible, of course, that increased short-selling around the announcement simply
reflects a higher trading volume, with short-selling as a percentage of transactions volume
staying relatively constant. Such a spike in volume would be consistent with the theory of Harris
and Raviv (1993) about trading volume and differences in opinion. To consider this issue, a
second metric examined is a stock’s abnormal relative short-selling, defined as the percentage

10
difference between (a) the ratio of shorted shares to traded shares in a day (or the daily average
over several days) within a 7-day window around the announcement and (b) the average daily
ratio of shorted to traded shares in the 57 sample days that lie outside of that window. More
formally, a stock’s abnormal relative short-selling, for a day or an interval of days, is specified
as:
1)/(
)/()/( −=
j
jj VOLSSAVE
VOLSSVOLSSAB (2)
where:
AB(SS/VOL)j = the average daily abnormal ratio of shorted shares to traded shares over day j or interval j;
(SS/VOL)j = the ratio of shorted shares to traded shares in day j or the daily average of the ratio during interval j; and
AVE(SS/VOL)j = the average daily ratio of shorted shares to traded shares for days prior to day -5 and after day +1, relative to the announcement day.
As with abnormal short-selling, abnormal relative short-selling is computed for each of the seven
days (-5 through +1) surrounding the announcement day (day 0) and for two multi-day intervals,
(-3,-1) and (-5,-1), prior to the earnings announcement.
Both metrics (abnormal short-selling, and abnormal relative short-selling) are examined
for the entire sample of 913 firms. We also partition the sample based on whether the firm has
exchange-traded put options at the time of the earnings announcement.xi These partitions reflect
the findings of several studies including Brent, Morse, and Stice (1990), Chen and Singal (2002),
and Senchak and Starks (1993), that the level of short-selling (short interest) is affected by the
availability of traded options. Put options provide investors with a direct alternative to short-
selling, and therefore, short-selling around an important event such as the earnings
announcement might be lower for these firms than for the others.xii

11
Table 3 presents the estimates of abnormal short-selling and abnormal relative short-
selling for individual days and for the two intervals. Columns (i) through (vi) pertain to
abnormal short-selling, while columns (vii) through (xii) report statistics for abnormal relative
short-selling. The results of column (i) for the full sample of 913 firms indicate that, in general,
mean abnormal short-selling is positive prior to earnings announcements. The mean values are
significantly positive for days -1, -2, and -5, as well as for both the three- and the five-day
intervals. For example, abnormal short-selling on day -1 is 47.1%, which implies that, on
average across the sample, shorted shares on that day were 47.1% above the typical level in the
57 days outside the (-5,+1) window around the announcement. The median values in column
(ii), however, tell a very different story: abnormal short-selling is actually negative for a
majority of firms, with statistically significant and negative values appearing for each time
period. The implication of these facts is important: short-selling is below its normal level for
most firms but, when it is above that level, it is substantially above normal.xiii This is consistent
with short-sellers targeting a few selected firms for which they anticipate a negative market
reaction to the announcement. Note also that the lower-than-normal level of short-selling before
the announcements for most firms is also consistent with informed trading: the informed traders
who know that the news is not bad will not short the stock.
Similar results obtain for the sub-samples of stocks with available put options (columns
(iii) and (iv)) and of stocks without them (columns (v) and (vi)). The mean abnormal short-
selling for stocks without put options is generally positive and higher than the corresponding
mean values for stocks with put options. This result is consistent with tradable options providing
informed traders with an alternative way to profit from anticipated stock price declines. In
contrast, the median values tend to be lower and more negative for stocks without tradable

12
options. This latter result may be due to short-sellers avoiding thinly traded stocks – companies
with no tradable put options undoubtedly tend to be the less-followed, lower market
capitalization firms.
The statistics for abnormal relative short-selling are quite similar, and this fact indicates
that the results reported above are not just an artifact of trading volume around the
announcements. Short-selling as a percentage of volume actually grew in the pre-announcement
days – at least for a subset of actively shorted firms. On the other hand, the numerous
significantly negative medians provide evidence the short-selling as a percentage of trading
volume fell for most stocks. Again, the results are similar for the partitions with and without a
put, with positive means and negative medians. However, it is worth noting that, for the
intervals of (-3,-1) and (-5,-1), the mean values of abnormal relative short-selling among stocks
with put options are much lower than among stocks without options.
In summary, the statistics of Table 3 convey two noteworthy points. First, the known-in-
advance earnings announcement date does not generate increased short-selling across most
stocks. In fact, the majority of stocks experience lower than normal amounts of short-selling.
Second, a fairly large minority of stocks are subjected to large increases in short-selling. This
pattern suggests selectivity (or targeting) by investors who are prepared to transact in substantial
volume, which could be consistent with informed trading. The next section presents a formal
investigation of this possibility.
B. Short-Selling by Informed Traders Prior to Earnings Announcements
If there is informed trading prior to earnings announcements, there should be a significant
relationship between abnormal short-selling in the days prior to the earnings announcement and

13
the ultimate stock price reaction once the information contained in the earnings announcement
becomes publicly available. To examine this potential linkage, abnormal short-selling during the
five-day window before the announcement is regressed on a set of explanatory variables. More
formally:
ABSS(-5,-1) = β0 + β1 RET(0,+1) + β2 RET(-5,-1) + β3 ABVOL(-5,-1) + ε (3) where:
ABSS(-5,-1) = average daily abnormal short-selling for the firm over the interval of day -5 to day -1;
RET(0,+1) = return on the stock from the closing prices of day -1 to day +1; RET(-5,-1) = return on the stock from the closing prices of day -6 to day -1;
and ABVOL(-5,-1) = average daily abnormal volume in the stock over the interval
of day -5 to day -1.
The dependent variable in this specification, ABSS(-5,-1), is abnormal short-selling measured
over the 5-day pre-announcement interval. As before, this metric is defined as the percentage
difference between the average daily number of shorted shares in this five-day interval and the
average daily number of shorted shares in the sample days that lie outside a 7-day window
around the announcement. While the choice of the number of pre-announcement days to include
in the interval is necessarily somewhat arbitrary, a five-day period is selected for this estimation
because, as mentioned above, informed traders have an incentive to disguise their private
information and may therefore engage in multiple trades over multiple days. In addition, as
mentioned above, Reed (2001) presents evidence from the equity lending market that loan
durations (and therefore short positions) typically vary from one to several days. Such variation
in duration suggests that abnormal short-selling prior to earnings announcements may well be
initiated over several different days prior to the earnings announcement event date.xiv
The independent variable that serves as the proxy for the earnings surprise (positive or
negative) at the announcement is RET(0,+1), the percentage change in the stock’s price from the

14
closing value on day -1 to the closing value on day +1. The reason is that a negative two-day
return means that the market views the announcement as unfavorable (a negative surprise), and a
positive return means the report on earnings is more encouraging (a positive surprise) than most
investors had expected (absent other confounding events).
Of course, alternative proxies for this possible influence on short-selling include defining
positive and negative earnings surprises according to some deviation from analysts’ forecasts or
some divergence from a seasonal random-walk projection. However, the market’s immediate
reaction to the announcement is the preferable approach because it is most consistent with the
likely motivation of short-sellers, which is to profit from a stock’s fall in price.xv
Two additional control variables are also included in the model. The first, RET(-5,-1),
represents the movement of the stock price during the five days prior to the announcement. This
variable controls for the possibility that upward or downward changes in the stock price might
affect the level of short-selling in the days leading up to the announcement. A pre-
announcement increase in stock price, for example, might affect short-selling by inducing some
investors to short the now “over-valued” stock. With this control variable in place, the model
does not wrongly attribute all pre-announcement short-selling to expectations regarding the
earnings release.
The second control variable, ABVOL(-5,-1), accounts for the potential contemporaneous
correlation between abnormal short-selling and spikes in volume, and for the possibility that
stocks experiencing sudden increases in volume might be easier to short. Abnormal volume is
measured, once again, as the percentage difference between (a) the average daily volume in the
5-day interval and (b) the average daily volume in the 57 sample days outside the 7-day window
around the announcement.

15
The model is estimated for the total sample of 913 firms as well as for sub-samples
determined by the availability of exchange-traded put options. Note that the parameter estimate
associated with RET(0,+1) indicates the presence of informed trading in pre-announcement
abnormal short-selling. If informed trading exists, the β1 coefficient should be significantly
negative. That would imply that abnormal short-selling prior to the earnings announcement is
inversely related to the stock price reaction to the earnings announcement – essentially an
indication of informed trading.
Results from estimating equation 3 appear in Table 4. Panel A’s results, for the whole
sample of 913 stocks, reveal a reasonable R-squared for the model and indicate the presence of
informed trading prior to earnings announcements. There is a statistically significant negative
relationship between the post-announcement stock return, RET(0,+1) and abnormal short-selling
before the announcement, ABSS(-5,-1). The parameter estimate of -1.039 implies that, if two
stocks are similar except for a 1% difference in their post-announcement returns, the stock with
the lower returns has on average pre-announcement abnormal short-selling that is 1.039
percentage points larger. In addition, the results suggest that abnormal short-selling in the 5 pre-
announcement days is not regularly affected by the contemporaneous return of stocks, RET(-5,-
1), because that estimated coefficient is far from being statistically significant. Finally, there is
an interesting relationship between pre-announcement abnormal short-selling and abnormal
volume ABVOL(-5,-1). The positive coefficient, 1.088, is significantly different from zero, but
the hypothesis that it equals unity cannot be rejected with high level of confidence. These two
facts demonstrate that abnormal volume tends to support abnormal short-selling but that these
two variables do not necessarily rise at different rates.

16
Panel B offers quite similar regression estimates for the sub-sample of 670 firms with
tradable put options. The coefficient for the relationship between the post-announcement stock
return and the pre-announcement abnormal short-selling is once again statistically significant and
negative (at -0.760). The fact that the parameter estimate is smaller than the corresponding
estimate for the full sample is not surprising, because the availability of put options allows
informed traders to exploit their information advantage outside of the channel of short-selling.
As in Panel A, there is also a significant contemporaneous relationship between abnormal
volume and abnormal short-selling.
Panel C contains the results for the sub-sample of firms without tradable put options. The
results also indicate a significantly negative relationship between the earnings announcement
stock return and abnormal short-selling prior to that announcement. Indeed, the parameter
estimate associated with the announcement day return, β1, is larger for this estimation than it is in
either Panel A or Panel B.xvi
C. Robustness Tests
To examine the sensitivity of the results presented above to shifts in the overall Nasdaq
market index at the time of the earnings announcements, the model is next estimated after
restricting the sample to observations where there was a moderate two-day return on the Nasdaq
equally-weighted market index during the day (0,1) time period. The justification for this
approach is that evidence of an inverse connection between short-sellers’ actions and post-
announcement returns on specific stocks might get spurious support from large negative
movements in the overall market at the time of the announcement. Indeed, during the time

17
period under consideration, the Nasdaq stock market index was generally in decline, dropping an
aggregate of 41.3% from the beginning of September through the end of December.
Given this downward trend, it is necessary to ensure that the results are not merely an
artifact of short-selling in a generally deteriorating market. Accordingly, estimates are made for
sub-samples in which the absolute value of the change in the Nasdaq equally-weighted market
index was less than or equal to 1%, 2%, or 3% during the two-day post earnings announcement
window. In these comparatively placid cases, the market’s overall change is unlikely to bias the
test results in favor of a negative link between pre-announcement activity and stock price
reaction to the announcement. If the estimates from these sub-samples closely resemble those
from the entire sample, they would provide direct evidence that the overall estimates are free of
this problem.
Table 5 presents regressions of equation 3 for the sub-sample of announcements that took
place in times of a relatively calm market, i.e., the 573 cases in which the Nasdaq equally-
weighted index moved less than a total of 2% in either direction during the day of announcement
and the next day. (Estimates with sub-samples in which the market shifted less than 3% and 1%
in either direction produced results very much like these and may be obtained from the authors
upon request.) While the values of Table 5 generally resemble those of Table 4, it is noteworthy
that these statistically significant estimates of β1 are much more negative here than in the
regressions for the entire sample. And, it is particularly important that estimations based on
observations in which the overall market changes relatively little affirm the results reported for
the unconstrained samples.
The basic conclusion supported by the various regressions is that there is a statistically
significant and negative relationship between market reaction to earnings announcements and

18
abnormal short-selling over five preceding days. This result is consistent with the proposition
that informed traders use short-selling to exploit their advantage.
A presumption employed in this study is that the trades marked as “short” represent sales
by investors who expect share prices to decline or at least underperform on a relative basis.xvii
Nevertheless, the inclusion of some non-information motivated short-sale activity does not
weaken our results, but actually strengthens them. Since one would not expect informationless
trades to be correlated with future price changes, the inclusion of such trades, if any, means that
our statistical tests are more conservative.
D. Additional Evidence from Cases of Unusual Levels of Abnormal Short-Selling
The final issue we consider is the predictive power associated with sub-samples of cases
in which short-selling is unusually high or low. This analysis is designed to ascertain the degree
to which short sellers can effectively anticipate the stock reaction to the earnings announcement.
Table 6 presents statistics for two partitions of the sample according to the relative level
of abnormal short-selling in the interval (-5,-1). Panel A focuses on cases of large abnormal
levels. The first partition in Panel A splits the sample of 913 companies into the 10% with the
highest level of abnormal short-selling and the other 90%. The second partition splits the sample
into the 25% with the greatest amount of abnormal short-selling versus the remaining 75%.
The results in Panel A provide some interesting findings. As expected on the basis of the
foregoing regressions, the stocks with the largest pre-announcement short-selling have mean and
median post-announcement returns that are substantially negative and below those of the rest of
the sample. For example, the stocks with the highest 10% level have a mean (median) two-day
return following the earnings announcement of -5.321% (-5.139%), and this value is

19
significantly negative at a 1% level of confidence. The mean (median) two-day return for the
other 90% of firms is -0.502% (-0.568%), and it is not significantly different from zero. The t-
test rejects the hypothesis that the mean of the post-announcement two-day stock return is the
same on both sides of this partition (t-value = 2.62). With regards to mean and median values for
the two-day return, the second partition of the highest 25% of firms versus the remainder
generates qualitatively similar results.
However, both partitions reveal that short-sellers are sometimes wrong. For both the
highest 10% and 25% groups, the 75th percentile cut-off is positive. This means that, in at least
one out of every four times, very high levels of abnormal short-selling precede positive post-
announcement returns.
It is also interesting to examine the cases in which “the dog doesn’t bark,” or the stocks
with the lowest levels of abnormal short-selling. Panel B of Table 6 contains the results of an
analysis that reverses the categories and compares the post-announcement returns of the stocks
with the lowest level of abnormal short-selling to those of the other stocks. Again, the full
sample of 913 firms is partitioned twice, once on the basis of whether a stock’s abnormal short-
selling is among the lowest 10% in the sample and once on whether it is among the lowest 25%
of the sample.
For the bottom 10% (versus 90%) partition, the results are not as clear-cut as those found
for the increase in short-selling analysis. Although the mean two-day stock return for the bottom
10% of firms (-0.615%) is higher than the mean for the other 90% of firms (-1.028%), it is not
significantly higher (t=.22). In addition, the median two-day stock return for the bottom 10% of
firms is lower than the corresponding return for the other 90% of firms.

20
The results, however, are somewhat stronger for the bottom 25% (versus 75%) partition.
The mean, median, 25th percentile, and 75th percentile two-day stock returns at the earnings
announcement date are all higher for the bottom 25% set of firms than for the other 75% of
firms. And, the mean is close to being significantly higher (t-value = 1.73). Overall, these
results imply that above-normal short-selling is a better indicator of a forthcoming negative
earnings surprise than below-normal short-selling is at indicating a forthcoming positive surprise.
Finally, Panel C reveals the difference between the two-day stock returns for the top 10%
of firms with the greatest versus the bottom 10% of firms with the lowest amount of abnormal
short-selling during the (-5,-1) window. The mean difference is -4.706%, and is significantly
different at a 4% level of confidence (t-value = -2.09). The corresponding differences in the
median, 25th percentile and 75th percentile returns are -4.086%, -4.908%, and -3.363%,
respectively. A basic conclusion from these results is the abnormal short-selling is an indicator
of future stock returns at earnings announcements. It is not a perfect indicator – for example, an
unusual increase in short-selling does not precede all negative earnings announcements.
Nonetheless, in the majority of cases, the announcement period stock price return is negative
following unusually high short-selling.
III. Conclusion
This study has examined the short-selling behavior of investors prior to the earnings
announcements of 913 Nasdaq-listed stocks. The results indicate that short-selling does not
increase consistently across all firms prior to earnings announcements. Rather, for most firms,
abnormal short-selling is somewhat lower in the days prior to the announcement than it is during
other days. For a subset of firms, however, abnormal short-selling is positive in the pre-

21
announcement period. This latter result is consistent potentially with the existence of informed
traders engaging in abnormally large short-selling in anticipation of a negative earnings surprise
and a corresponding decline in share price.
Estimating an empirical specification designed to investigate whether abnormal short-
selling prior to the earnings announcement is related to the eventual announcement-period stock
price reaction reveals evidence of the presence of informed traders. This relationship is
somewhat stronger for firms without available put options, which is consistent with some
informed traders employing options (when available) to exploit their private information rather
than short-selling. Restricting the sample to exclude earnings announcement dates when the
Nasdaq equally-weighted market index either rose or declined substantially leads to estimation
results consistent with those found for the full sample of observations. Consequently, the link
between pre-announcement period short-selling and announcement period stock returns is not
driven by contemporaneous movements in the overall market.
Each of these results is consistent with the possibility that informed traders execute a
substantial amount of short-selling in the pre-announcement period. However, this study does
not indicate where the information came from. The information which motivated the short-
sellers could have been based on material nonpublic information, or it could have been based on
perfectly legal information obtained from legitimate sources. Investors routinely devote
significant resources on legitimate research into the economic fundamentals of firms, and it
stands to reason that the better ones would make use of such information, when it is negative,
through short-selling.
A basic conclusion from these results is that abnormal short-selling is an indicator of
future stock returns at earnings announcement. It is not a perfect indicator – for example, an

22
unusual increase in short-selling does not precede all negative earnings announcements.
Nonetheless, in the majority of cases, the announcement period stock return is negative
following unusually high short-selling. An implication of all of these results is that general
investor knowledge of unusual short-selling activity – as it is occurring – could facilitate more
orderly price movements and the more efficient incorporation of private information into stock
prices. Consequently, financial market rulemakers may want to consider requiring more
extensive and timely public disclosures of short-selling.

Table 1 Distribution of Earnings Announcements by Months and Days of the Week for the 913
Firms in the Sample Panel A: Month-by-Month Distribution of Sample Earnings Announcements September October November December Number of announcements
23 661 218 11
Panel B: Day-by-Day Distribution of Sample Earnings Announcements Monday Tuesday Wednesday Thursday Friday Number of announcements
132 234 231 290 26

Table 2
Key Characteristics of Short-Selling for 913 Nasdaq Stocks: Fall, 2000 Average daily shorted shares equals the average daily number of shares sold short for the firm over the 64-day sample period. Average shorted shares as a percentage of total shares is defined as [average daily shorted shares for the firm over the 64-day sample period/average daily total shares traded for the firm over the period] x 100. Average daily volume is equal to average daily number of shares traded for the firm over the 64-day sample period. Five-day holding period percentage returns (-5,-1) is equal to the return measured from the last transaction price on day -6 to the last transactions price on day -1. Two-day holding period percentage returns (0,+1) is the return measured from the last transaction price on day -1 to the last transactions price on day +1. Nasdaq two-day holding period percentage returns (0,+1) is the return on the Nasdaq equally-weighted market index. All days are measured relative to the day that the earnings announcement is first reflected in stock price (day = 0). Sample size is 913 Nasdaq-listed firms during the Fall of 2000. Panel A: Shorted share and total share data Average daily shorted
shares (000’s shares) Average shorted shares as
a percentage of total shares Average daily volume
(000’s shares) Mean 53.28 3.53% 1,515.37 Median 12.00 2.95 366.05 Maximum 2,005.05 27.28 68,734.90 Minimum 0.14 0.17 143.91 Panel B: Returns data (%) Five-day holding
period percentage returns (-5,-1)
Two-day holding period percentage returns
(0,+1)
Nasdaq two-day holding period percentage
returns (0,1) Mean 0.90% -0.99% -0.27% Median 0.37 -0.70 0.20 Maximum 45.66 79.17 9.52 75th percentile 7.79 7.13 3.28 25th percentile -6.33 -8.87 -4.99 Minimum -73.29 -67.86 -8.97

Table 3 Abnormal Short-Selling and Abnormal Relative Short-Selling: Statistics for Days and Intervals around Earnings Announcements of
913 Nasdaq Stocks in Fall, 2000 ABSS,j is a firm’s abnormal short-selling, and is measured as the number of the firm’s shares sold short on day j (or the daily average in interval j) divided by the average daily number of the firm’s shorted shares during sample days prior to -5 and after +1. AB(SS/VOL)j is a firm’s abnormal relative short-selling, and is specified as ratio of shorted shares to traded shares (or the average daily ratio in interval j) divided by the firm’s average daily ratio of shorted to traded shares during sample days prior to -5, and after +1 relative to the announcement. P-values in parentheses represent the probability that the value equals zero based upon a t-test (mean results), or the M-statistic from a sign test (median results).
Day or Interval
ABSSj Full Sample (n=913)
ABSSj With Tradable Put
(n=670)
ABSSj No Tradable Put
(n=243)
AB(SS/VOL)j Full Sample (n=913)
AB(SS/VOL)j With Tradable Put
(n=670)
AB(SS/VOL)j No Tradable Put
(n=243) Mean
(i) Median
(ii) Mean (iii)
Median (iv)
Mean (v)
Median (vi)
Mean (vii)
Median (viii)
Mean (ix)
Median (x)
Mean (xi)
Median (xii)
+1 86.3 (0.00)
-5.0 (0.35)
97.7 (0.00)
17.8 (0.10)
55.0 (0.01)
-44.8 (0.00)
4.3 (0.41)
-36.7 (0.00)
0.2 (0.97)
-31.6 (0.00)
15.8 (0.32)
-56.9 (0.00)
0 84.0 (0.00)
-9.6 (0.10)
84.0 (0.00)
0.5 (0.91)
84.2 (0.00)
-43.3 (0.00)
38.5 (0.00)
-15.1 (0.00)
37.3 (0.00)
-9.5 (0.02)
41.8 (0.02)
-42.9 (0.00)
-1 47.1 (0.00)
-37.8 (0.00)
35.9 (0.00)
-30.2 (0.00)
77.9 (0.02)
-55.0 (0.00)
39.1 (0.00)
-24.9 (0.00)
29.5 (0.00)
-23.2 (0.00)
65.4 (0.00)
-29.0 (0.00)
-2 13.0 (0.03)
-45.8 (0.00)
10.2 (0.11)
-39.5 (0.00)
20.7 (0.17)
-67.2 (0.00)
27.2 (0.00)
-28.9 (0.00)
23.9 (0.00)
-24.5 (0.00)
36.3 (0.01)
-51.7 (0.00)
-3 8.4 (0.24)
-46.8 (0.00)
9.1 (0.28)
-40.2 (0.00)
6.6 (0.65)
-69.0 (0.00)
19.2 (0.00)
-29.7 (0.00)
16.1 (0.00)
-23.7 (0.00)
27.6 (0.08)
-55.7 (0.00)
-4 22.9 (0.11)
-47.2 (0.00)
5.6 (0.38)
-39.3 (0.00)
70.5 (0.16)
-66.8 (0.00)
24.2 (0.01)
-28.3 (0.00)
14.7 (0.01)
-23.0 (0.00)
50.3 (0.14)
-50.1 (0.00)
-5 19.3 (0.02)
-45.8 (0.00)
26.9 (0.01)
-38.8 (0.00)
-1.6 (0.90)
-66.8 (0.00)
26.7 (0.00)
-29.5 (0.00)
25.1 (0.00)
-22.8 (0.00)
31.2 (0.04)
-49.4 (0.00)
-1,-3 22.8 (0.00)
-25.4 (0.00)
18.4 (0.00)
-19.2 (0.00)
35.1 (0.04)
-40.3 (0.00)
27.4 (0.00)
-10.7 (0.00)
22.8 (0.00)
-8.6 (0.04)
40.2 (0.00)
-14.2 (0.01)
-1,-5 22.1 (0.00)
-21.0 (0.00)
17.5 (0.00)
-16.6 (0.00)
34.8 (0.04)
-34.2 (0.00)
30.3 (0.00)
-7.6 (0.02)
21.4 (0.00)
-3.8 (0.23)
54.9 (0.03)
-16.6 (0.00)

Table 4
Results of OLS Regression: Abnormal Short-selling for 913 Nasdaq Stocks around Earnings Announcements, For Stocks with and without Tradable Put Options, in Fall, 2000
ABSS(-5,-1) = β0 + β1 RET(0,+1) + β2 RET(-5,-1) + β3 ABVOL(-5,-1) + ε (3)
Results of OLS estimation of equation (3). ABSS(-5,-1) is the average daily abnormal short-selling for the stock from day -5 to -1. RET(0,+1) is the stock’s two-day return following the earnings announcement and measured from the closing price on day -1 to that of day +1). RET(-5,-1) represents the stock’s price change measured from the closing price on day -6 to the closing price on day -1. ABVOL(-5,-1) is the stock’s average daily abnormal volume over the five-day window (-5 to -1) preceding the earnings announcement divided by average daily volume for the firm outside the seven-day window (-5 to +1) around the announcement, all minus 1. White’s (1980) heteroskedasticity-consistent standard errors are in parentheses below the coefficients. ββββ0 ββββ1 ββββ2 ββββ3 Adjusted R2 Panel A Full Sample (n=913)
0.232** (0.052)
-1.039** (0.309)
-0.197 (0.395)
1.088** (0.178)
.151
Panel B Stocks with Put Options (n=670)
0.159** (0.041)
-0.760** (0.225)
-0.029 (0.302)
0.917** (0.123)
.207
Panel C Stocks with no Put Options (n=243)
0.485** (0.169)
-2.040* (0.934)
-0.620 (1.580)
1.634* (0.515)
.139
* = statistically significant at 5% ** = statistically significant at 1%

Table 5
Results of OLS Regression: Abnormal Short-selling for 913 Nasdaq Stocks Around Earnings Announcements, For Days When the Nasdaq Index Returns Around Announcements Is Between +-2%
in Fall, 2000
ABSS(-5,-1) = β0 + β1 RET(0,+1) + β2 RET(-5,-1) + β3 ABVOL(-5,-1) + ε (3) Results of OLS estimation of equation (3), as applied to sub-sample of cases in which the equally-weighted Nasdaq Index has a return of greater than -2% and less than 2%. ABSS(-5,-1) is the average daily abnormal short-selling for the stock from day -5 to -1. RET(0,+1) is the stock’s two-day return following the earnings announcement and measured from the closing price on day -1 to that of day +1. RET(-5,-1) represents the stock’s price change measured from the closing price on day -6 to the closing price on day -1. ABVOL(-5,-1) is the stock’s average daily abnormal volume over the five-day window (-5 to -1) preceding the earnings announcement divided by average daily volume for the firm outside the seven-day window (-5 to +1) around the announcement, all minus 1. White’s (1980) heteroskedasticity-consistent standard errors are in parentheses below the coefficients. ββββ0 ββββ1 ββββ2 ββββ3 Adjusted R2 Panel A All Cases (n=573)
0.245** (0.078)
-1.639** (0.479)
-0.783 (.680)
1.093** (0.228)
.141
Panel B Firms with Put Options (n=428)
0.114** (0.054)
-0.994** (0.359)
-0.172 (0.356)
0.866** (0.135)
.211
Panel C Firms with no Put Options (n=145)
0.651** (0.247)
-3.715** (1.593)
-2.036 (2,416)
1.832** (0.657)
.143
* = statistically significant at 5% ** = statistically significant at 1%
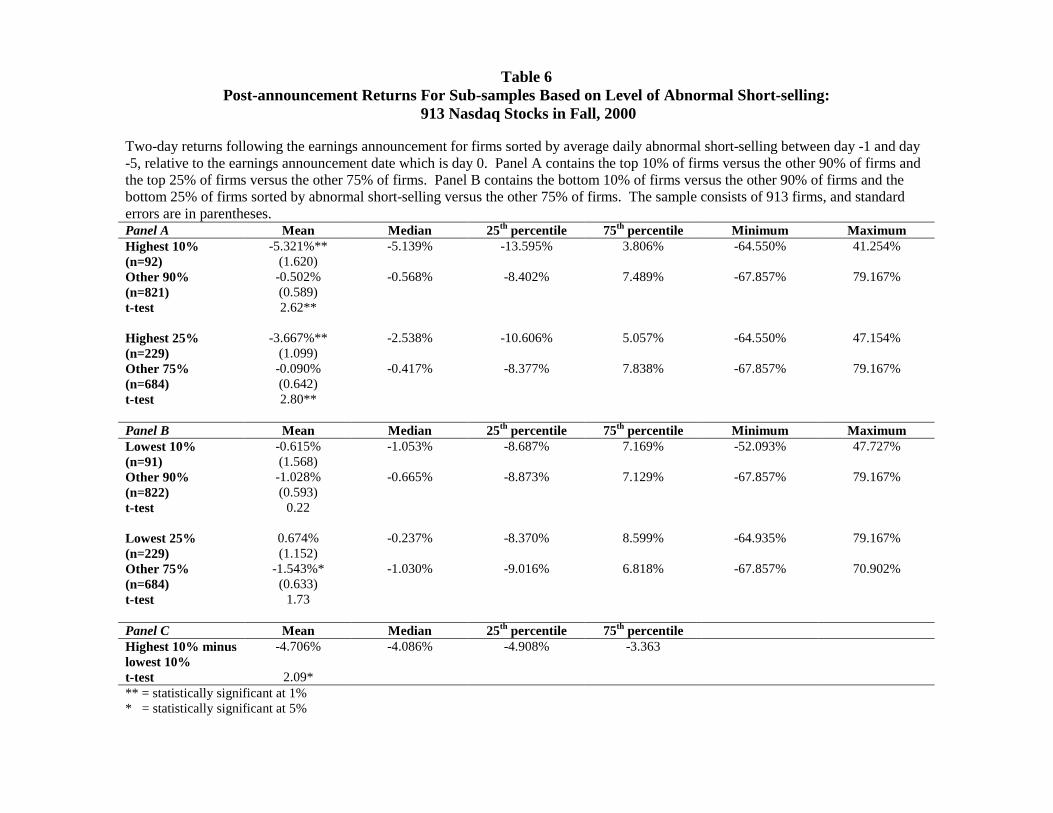
Table 6
Post-announcement Returns For Sub-samples Based on Level of Abnormal Short-selling: 913 Nasdaq Stocks in Fall, 2000
Two-day returns following the earnings announcement for firms sorted by average daily abnormal short-selling between day -1 and day -5, relative to the earnings announcement date which is day 0. Panel A contains the top 10% of firms versus the other 90% of firms and the top 25% of firms versus the other 75% of firms. Panel B contains the bottom 10% of firms versus the other 90% of firms and the bottom 25% of firms sorted by abnormal short-selling versus the other 75% of firms. The sample consists of 913 firms, and standard errors are in parentheses. Panel A Mean Median 25th percentile 75th percentile Minimum Maximum Highest 10% (n=92)
-5.321%** (1.620)
-5.139% -13.595% 3.806% -64.550% 41.254%
Other 90% (n=821)
-0.502% (0.589)
-0.568% -8.402% 7.489% -67.857% 79.167%
t-test 2.62** Highest 25% (n=229)
-3.667%** (1.099)
-2.538% -10.606% 5.057% -64.550% 47.154%
Other 75% (n=684)
-0.090% (0.642)
-0.417% -8.377% 7.838% -67.857% 79.167%
t-test 2.80** Panel B Mean Median 25th percentile 75th percentile Minimum Maximum Lowest 10% (n=91)
-0.615% (1.568)
-1.053% -8.687% 7.169% -52.093% 47.727%
Other 90% (n=822)
-1.028% (0.593)
-0.665% -8.873% 7.129% -67.857% 79.167%
t-test 0.22 Lowest 25% (n=229)
0.674% (1.152)
-0.237% -8.370% 8.599% -64.935% 79.167%
Other 75% (n=684)
-1.543%* (0.633)
-1.030% -9.016% 6.818% -67.857% 70.902%
t-test 1.73 Panel C Mean Median 25th percentile 75th percentile Highest 10% minus lowest 10%
-4.706% -4.086% -4.908% -3.363
t-test 2.09* ** = statistically significant at 1% * = statistically significant at 5%

References Aitken, Michael J., Alex Frino, Michael S. McCorry, and Peter L. Swan, 1998, Short sales are almost instantaneously bad news: Evidence from the Australian Stock Exchange, Journal of Finance 53, 2205-2223. Alexander, Gordon J. and Mark A. Peterson, 2002, Implications of a reduction in tick size on short-sell order execution, Journal of Financial Intermediation 11, 37-60. Asquith, Paul, and Lisa Meulbroek, 1996, An empirical investigation of short interest, Working paper, Harvard Business School, Harvard University. Ball, Ray, and Philip Brown, 1968, An empirical evaluation of accounting numbers, Journal of Accounting Research, 6 (Autumn), 159-178. Brent, Averil, Dale Morse, and E. Kay Stice, 1990, Short Interest: Explanations and Tests, Journal of Financial and Quantitative Analysis 25, 273-289. Chen, Honghui, and Vijay Singal, 2002, Role of speculative short sales in price formation: Case of the weekend effect, forthcoming: Journal of Finance. Choie, Kenneth S., and S. James Hwang, 1994, Profitability of short-selling and exploitability of short information, Journal of Portfolio Management 20, 33-38. D’Avolio, Gene, 2002, The market for borrowing stock, forthcoming: Journal of Financial Economics. Dechow, Patricia M., Amy P. Hutton, Lisa Meulbroek, and Richard G. Sloan, 2001, Short sellers, fundamental analysis and stock returns, Journal of Financial Economics 61, 77-106. Desai, Hemang, K. Ramesh, S. Ramu Thiagarajan, and Bala V. Balachandran, 2001, An Investigation of the Informational Role of Short Interest in the Nasdaq Market, forthcoming: Journal of Finance. Diamond, Douglas W., and Robert E. Verrecchia, 1987, Constraints on short-selling and asset price adjustment to private information, Journal of Financial Economics 18, 277-311. Geczy, Christopher C., David K. Musto, and Adam V. Reed, 2002, Stocks are Special Too: An Analysis of the Equity Lending Market, forthcoming: Journal of Financial Economics. Harris, Milton, and Artur Raviv, 1993, Differences of opinion make a horse race, Review of Financial Studies 6, 473-506. Kyle, Albert S., 1985, Continuous auctions and insider trading, Econometrica 53, 1315-1335.

Ohlson J., 1995, Earnings, book values, and dividends in security valuation, Contemporary Accounting Research 11, 661-687. Reed, Adam V., 2001, Costly Short-Selling and Stock Price Adjustment to Earnings Announcements, working paper: The University of North Carolina at Chapel Hill. Safieddine, Assem Jr., and William J. Wilhelm, 1996, An Empirical Investigation of Short-Selling Activity Prior to Seasoned Equity Offerings, Journal of Finance 51, 729-749. Senchack, A.J. and Laura T. Starks, 1993, Short-sale restrictions and market reaction to short-interest announcements, Journal of Financial and Quantitative Analysis 28, 177-194. White, Halbert, 1980, A heteroskedasticity-consistent covariance matrix estimator and a direct test for heteroskedasticity, Econometrica 48, 817-838.

Footnotes i Indeed, informed traders should only short-sell when the expected profits exceed the costs of
short-selling. Consequently, a slightly negative earnings surprise would lead to no unusual
short-selling.
ii This review of the literature excludes the work on execution quality of short-sell orders, such
as Alexander and Peterson (2002).
iii ACT reporting is not required for odd-lots, although some odd-lots are reported anyway to
ACT because they need to use the clearing services of DTCC. Also, ACT reporting is not
required for trades conducted completely outside the United States, and for informal trades
between individuals that do not involve the use of a broker/dealer. We believe the total volume
of these non-reported trades to be very small.
iv Nasdaq’s Short Sale Rule (Rule 3350) is analogous to the “uptick” rule for NYSE-listed
securities. The major difference is that is uses a bid-test instead of a tick-test. Generally, the
rule prohibits short-selling at the bid if the current bid price is lower than the preceding bid. See
also NASD’s Notices to Members, 94-68 and 94-83.
v See Nasdaq’s website, www.marketdata.nasdaq.com, for more details.
vi In addition, visual analysis of the data revealed two firms with such suspicious data that we
were obliged to remove them from the sample.
vii Average shorted shares as a percentage of total shares is obtained by dividing the average
number of shares shorted daily over the 64 day sample period by the average number of shares
traded daily over the same period, and then multiplying by 100.
viii The five-day holding period percentage return is equal to the return measured from the last
transactions price on day t-6 to the last transactions price on day t-1; the two-day holding period

percentage return is equal to the return measured from the last transactions price on day-1 to the
last transactions price on day +1. All days are specified relative to the day that the earnings
announcement is first reflected in stock price (day 0). Nasdaq two-day holding period
percentage returns are based on CRSP record of the Nasdaq equally-weighted index.
ix For these multi-day intervals, the average daily short-selling is obtained by taking the average
daily number of shares sold short during the interval divided by AVESSj, and then subtracting 1.
Consequently, it does represent the average daily abnormal short-selling during that interval. In
addition, to examine the sensitivity of the results presented herein to the selection of the window
length, abnormal short-selling is also estimated using an 11 day window (-5 to +5). With this
longer window, in all cases the results obtained are similar to those presented throughout this
paper.
x In addition, the use of intervals is suggested by the findings of Reed (2001) that equity lending
market loans (and therefore short positions) typically vary from one to several days.
xi We obtained the data on the existence of traded put options during the month of the earnings
announcement from The Options Clearing Corporation via its web site
www.optionsclearing.com. Approximately two-thirds (670) of the stocks in our sample had
exchange-traded put options.
xii It might be argued that the availability of put options could lead to an increase in short-selling
because of the hedging activities of options issuers. However, options issuers would typically
receive the “short exempt” designation on their short trades, and therefore their short sales are
not included in this study’s short transactions data set.

xiii A further, related implication of these mean versus median results is that the data are very
skewed. Consequently, the p-values associated with the mean statistics should be interpreted
with caution.
xiv Tests for the case of 3 pre-announcement days generated results that are similar to those
reported in this paper.
xv It might also be argued that some kind of market-adjusted return would be a suitable indicator
of the surprise in the announcement. This issue is addressed below where equation 3 is
estimated after restricting the sample to eliminate observations where the two-day return on the
Nasdaq equally-weighted market index at the time of the earnings announcement is relatively
high or low.
xvi However, a test to determine whether it is significantly larger than the parameter estimate for
firms with available put options fails to reject the null hypothesis of parameter equivalence.
xvii A customer might sell short as part of a market-neutral or hedge bet on a corresponding long
position in another stock. The motivation for such a sale encompasses an expectation of relative
underperformance.