
Short selling and firms’ disclosure of bad news: Evidence ... Li_2016 Accounting... · Short...
53
Short selling and firms’ disclosure of bad news: Evidence from Regulation SHO Greg Clinch Wei Li Yunyan Zhang Dept of Accounting University of Melbourne January 2016 We benefited from helpful comments and suggestions from Maggie Abernethy, Douglas Skinner, Jennifer Wu Tucker and seminar participants at the 2015 AFANNZ conference, the University of Adelaide and the University of Melbourne. Corresponding author: Greg Clinch, [email protected]. 0
Transcript of Short selling and firms’ disclosure of bad news: Evidence ... Li_2016 Accounting... · Short...

Short selling and firms’ disclosure of bad news:
Evidence from Regulation SHO
Greg Clinch
Wei Li
Yunyan Zhang
Dept of Accounting
University of Melbourne
January 2016
We benefited from helpful comments and suggestions from Maggie Abernethy, Douglas Skinner, Jennifer Wu Tucker and seminar participants at the 2015 AFANNZ conference, the University of Adelaide and the University of Melbourne. Corresponding author: Greg Clinch, [email protected].
0

Short selling and firms’ disclosure of bad news:
Evidence from Regulation SHO
Abstract
This study provides evidence that short selling influences the disclosure of bad news by firms. Managers have incentives to withhold or delay the release of bad news. As informed traders, short sellers enhance the informativeness of stock prices, especially related to bad news, which leads to lower information asymmetry between firms and outside investors, and thus reduces the benefits and increases the litigation and reputational risks of withholding bad news. We exploit the quasi-natural experimental setting provided by the introduction of SEC regulation SHO (Reg-SHO), which significantly reduced the constraints faced by short sellers for a randomly selected subsample of U.S. firms (pilot firms). Relative to control firms, we observe a significant increase in the likelihood of bad news management forecasts among the pilot firms. Managers also provide these forecasts in a more timely fashion. We also find that managers accelerate the release of quarterly earnings news especially when the news is bad. Further analyses reveal that Reg-SHO lifts the threshold of bad news disclosure by encouraging more timely disclosure of moderate bad news. And the effect of Reg-SHO on bad news disclosure is more significant when litigation risk is higher. A series of robustness tests reinforce our main results. Keywords: Short selling, Voluntary disclosure, Information asymmetry, Litigation risk
JEL Classification: G14, D22, K22, K41, M40
1

Short selling and firms’ disclosure of bad news:
Evidence from Regulation SHO 1. Introduction
In this paper we investigate the role of short selling in influencing the disclosure of bad news by
firms. We exploit the quasi-natural experimental setting provided by the introduction of SEC
regulation SHO (Reg-SHO), which significantly reduced the constraints faced by short sellers for
a subsample of U.S. firms, and investigate whether this was associated with changed voluntary
bad news disclosure behavior by firms. We investigate three dimensions of voluntary disclosure:
the likelihood that bad news is voluntarily disclosed by firms, the timing of any voluntarily
disclosed bad news, and the timing of mandatory quarterly earnings releases when the earnings
news is bad.
Managers have incentives to withhold and/or delay the release of bad news (e.g., Dye,
1985; Jung and Kwon, 1988; Verrecchia, 2001; Kothari et al., 2009; Acharya et al., 2011, among
others). Short selling potentially affects these incentives in two ways. First, evidence suggests
that the information held by short sellers likely overlaps that of managers. Short sellers represent
informed traders and their actions assist in impounding negative news more quickly into stock
prices (e.g., Diamond and Verrecchia, 1987). An increase in short interest is often associated
with significant negative returns in subsequent periods (e.g., Senchack and Starks, 1993; Desai et
al., 2002; Diether et al., 2009b) and occurs before a variety of negative corporate events (e.g.,
Christophe et al., 2004; Desai et al., 2006; Christophe et al., 2010). Thus changes in short interest
in a stock have the potential to communicate new information to capital markets about the firm
and cause investors to update their beliefs. The resulting negative impact on share prices reduces
the benefit to managers from withholding bad information since at least some of their
2

information will already be reflected in price. Second, prior research indicates that litigation and
reputational costs play an important role in managers’ bad news disclosure decisions (e.g.,
Skinner, 1994, 1997; Field et al., 2005; Kothari et al., 2009). To the extent that short selling
causes prices to already reveal some bad news held by managers, it will be more difficult for
managers to claim no possession of private information of bad news. Consequently, if managers
withhold bad news, such an action will be more likely to be detected and lead to higher litigation
and reputational costs. Combining these two effects — the reduction in benefits and increase in
costs associated with withholding bad news — suggests that short selling will motivate greater
and more timely disclosure of bad news.
In this paper, we exploit an exogenous shock to short selling activities to investigate this
prediction. In July 2004, the SEC adopted Rule 202T of Reg-SHO, which established procedures
for the SEC to temporarily suspend any short sale price test (including the tick test for exchange-
listed stocks and the bid test for Nasdaq Nation Market stocks) — a short sale constraint — on
short selling in U.S. equity markets, in order for the SEC to study the effectiveness of the tests.1
Under the Reg-SHO pilot program short sale constraints were suspended for only a subset of
(effectively) randomly selected firms (pilot firms), while short sale constraints remained
unchanged for other firms (control firms).2 As a result, around the announcement date, short
1 In 1938, the NYSE adopted an uptick rule, Rule 10a-1, known as the “tick test”. The rule requires that a short sale cannot be completed if the current bid price is below the most recently traded price (plus tick). In 1994, the NASDAQ also adopted its own price test under Rule 3350, requiring a short sale to occur at a price one penny above the current bid price if the current bid price is a downtick from previous bid. The purpose of these tests is to prevent short sellers from participating in market manipulation that forces prices downward. 2 According to the Rule 202T’s pilot program, stocks in the Russell 3000 index as of June 25, 2004 were ranked by average daily dollar volume of trade over the one year prior to the issuance of Reg-SHO from highest to lowest for the period. Within each exchange — American Stock Exchange, New York Stock Exchange or NASDAQ — every third ranked stock was drawn from the pool and designated into the pilot group, resulting in a pilot group comprising 986 stocks and a control group (comprised of all the remaining stocks in the Russell 3000 index). From May 2, 2005
3

interest increased dramatically for pilot firms compared to control firms (Grullon et al., 2015),
consistent with Reg-SHO having a substantial effect on short selling activities for the pilot firms.
Managers also appeared sensitive to such effects on their firms. For instance, in a 2008 NYSE
survey, the majority of top executives surveyed were in favour of re-instituting the price tests as
soon as possible (Grullon et al., 2015). Therefore, the exogenous shock to short sale constraints
along with the randomization of treatment firms under Reg-SHO provides an attractive quasi-
natural experimental setting within which to examine the potential causal effect of short selling
on corporate bad news disclosures.
We focus on the disclosure of bad earnings news by firms and investigate three aspects of
voluntary disclosure by firms with regard to bad earnings news via difference-in-differences
(DiD) comparisons of pilot vs. control firms before, during and after the pilot program. During
the pilot program, we observe a significant increase (8%) in the likelihood of bad news
management forecasts among the pilot firms. Managers also provide these forecasts in a more
timely fashion, 2.3 days earlier. Additionally we find that managers accelerate the release of
mandatory quarterly earnings news when the news is bad, 0.3 days earlier. However, the
differences disappear (or are much weaker in some cases) after the pilot program when the short-
sale price tests were removed for all firms. These results provide strong and consistent support
for our prediction that the pressure of short selling from lifting of short-sale constraints
increases/accelerates bad news disclosure by firm managers.
We conduct several additional analyses to strengthen the inference that our results are
driven by short selling changes arising from the implementation of Reg-SHO. As discussed
to August 6, 2007, pilot stocks were exempted from short-sale price tests, and after August, 2007, the SEC repealed the price test rule on short selling for all stocks.
4

previously, short selling likely increases the potential litigation and reputational costs faced by
managers who withhold bad news. This effect is expected to be more pronounced in firms with
higher ex ante litigation risk. Consistent with this prediction, we find that pilot firms in high
litigation risk industries release more bad news earnings forecasts during the Reg-SHO pilot
program compared to control firms, but that in low litigation risk industries no such difference is
apparent. Similarly, we find that the earlier releases of bad news forecasts and earnings
announcements by pilot firms are also driven by high litigation risk firms. These results provide
evidence that short selling alters managerial bad news disclosure through the threat of an
increase in subsequent litigation and reputational cost.
To rule out the alternative explanation that our findings are due to a change of managerial
disclosure in general (both good news and bad news), we examine the effects of Reg-SHO on
good news disclosure and find no differences between pilot and control firms during the pilot
program period. We also find that the effects of short selling on the likelihood and timing of bad
news management forecasts are stronger for pilot firms that experienced stronger negative share
price reactions when the Reg-SHO pilot program was first announced, and for firms that
experienced greater amounts of short interest during the pilot program. These results provide
further support for a causal link between the Reg-SHO short-selling changes and firms’ bad news
disclosure choices.
Finally, we demonstrate that our main results remain qualitatively unchanged for a series
of robustness tests. First, following Rogers and Van Buskirk (2013), we use an alternative
definition of management forecast news to classify bad news forecasts, correcting for the
potential bias of conventional management forecasts news when applied to forecasts bundled
with earnings announcements. Second, we control for the bundle factor in the regressions of the
5
timing of bad news forecasts to mitigate the concern that a reduced delay in earnings
announcements mechanically leads to more timely forecasts for those bundled. Third, to address
the possibility that our main findings—the difference in disclosure behavior between pilot and
control firms during Reg-SHO pilot program — are due to chance, we conduct sensitivity
analyses using pseudo “pilot firms” and a pseudo “pilot program period” randomly generated
from simulations and find no results. Finally, as Grullon et al. (2015) find that pilot firms
significantly reduce equity issuance during Reg-SHO, it is possible that our results may be due to
a decrease in external financing needs in pilot firms. To mitigate this concern, we partitioned
sample firms based on whether firms issue equity in the subsequent year and find that our results
hold in non-equity issuing firms, which suggests that our results are not driven by the
documented changing trend in equity issuance.
Our study complements prior research on the influence of short selling on major
corporate decisions. Prior literature suggests that short sellers mitigate manager-investor agency
problems by curbing earnings management (e.g., Massa et al., 2013; Fang et al., 2014), deterring
financial misconduct (e.g., Karpoff and Lou, 2010), and enhancing investment efficiency (e.g.,
Chang et al., 2014; He and Tian, 2014). Our research extends this line of research by examining
the influence of short sellers on the disclosure of bad news by firms.
Two concurrent papers, Cheng et al. (2014) and Li and Zhang (2015) also employ the
Reg-SHO pilot program to explore the link between firms’ voluntary disclosure policies and
short selling. Our research differs from both Cheng et al. (2014) and Li and Zhang (2015) in
three important respects. First, we focus on bad news disclosure because prior research suggests
that managers have incentives to withhold bad news, but not good news, and because shortselling
generally is associated with unfavourable news. Second, we investigate a broader spectrum of
6

corporate disclosure decisions: the likelihood that firms voluntarily issue a bad news
management forecast, the timing of such voluntary disclosures, and the timeliness of bad news
(mandatory) earnings announcements. Our results indicate that Reg-SHO affected all of these
dimensions of firm disclosure in a consistent manner. Third, we investigate the channel through
which short selling affects firm disclosure behavior. In particular, our results indicate that the
effect of Reg-SHO on the disclosure of bad news by firms is concentrated in high litigation risk
industries, and for firms that experienced greater initial price reactions to the introduction of
Reg-SHO and higher short interest during the implementation of Reg-SHO.
We are also able to resolve, to a significant extent, inconsistencies in the two concurrent
papers. Cheng et al. (2014) argue that short selling is a negative signal to the market and
managers, on average, respond (or ‘fight back’) by releasing good news. In contrast, Li and
Zhang (2015) find no difference in the disclosure of either good or bad news by pilot and control
firms, but pilot firms reduce the precision of bad news management forecasts during Reg-SHO
for pilot firms, as well as the readability of 10-K reports.3 The difference in the findings between
our study and these two concurrent papers can be attributed to both research design and sample
selection differences.4 Our results are consistent with Li and Zhang (2015) except for the
3 Regarding good news disclosure, Li and Zhang (2015) find that pilot firms reduce good news disclosure by over 10% (see Table 1 in the paper) in contrast to Cheng et al. (2014)’s finding that pilot firms increase good news disclosure over 10% (see Panel A in Table 2 in the paper). 4 Although not their focus, both Cheng et al. (2014) and Li and Zhang (2015) also report some results regarding the association between short selling and the voluntary disclosure of bad news management forecasts. In contrast to our results, they find at best weak support for such an association. We find that this difference in results is largely explained by differences in sample selection procedures. Specifically, consistent with prior research based on Reg-SHO (e.g., Fang et al. (2014)), we exclude financial and regulated firms because disclosure requirements and accounting rules are different for these industries. These firms account for 30% of the sample firms in Cheng et al. (2014). If we include such firms in our sample our results are weaker but consistent with those we report. Similarly, we exclude the announcement period of Reg-SHO (July, 2004 to April, 2005) from the pre Reg-SHO period, whereas Li and Zhang (2015) include it. We find that pilot firms significantly increase their bad news disclosure
7

likelihood of bad news management forecasts. In our study, we exclude the announcement
period of Reg-SHO (July, 2004 to April, 2005) from the pre Reg-SHO period, whereas Li and
Zhang (2015) include it. We find that pilot firms significantly increase their bad news disclosure
after the announcement of Reg-SHO pilot list and before the official start of the program.
Therefore, including the announcement period in the pre Reg-SHO period potential contaminates
the pre Reg-SHO period as managers of pilot firms had already changed some of their behaviour
anticipating the pilot period. Compared to Cheng et al. (2014), we focus on managerial bad news
disclosure and exclude financial and regulated firms in the main tests because disclosure
requirements and accounting rules are different for these industries. We examine these firms
separately and find no significant differences in disclosure decisions between pilot and control
firms. Further, since financial and regulated firms reside in low litigation cost industries, this is
consistent with our additional analysis (discussed previously) that indicates low litigation cost
firms exhibit no disclosure differences between pilot and control samples. The presence or
absence of these firms in our sample reconciles our results with those of Cheng et al. (2014).
The remainder of the paper is organized as follows. In section 2 we describe more fully
the related literature and develop our hypotheses. Sections 3 and 4 describe the sample and our
research design, while section 5 presents our results. We conclude in section 6.
after the announcement of Reg-SHO pilot list and before the official start of the program. Therefore, including the announcement period as pre Reg-SHO would bias against finding results.
8

2. Related literature and hypotheses
2.1. The background of Reg-SHO
In July 2004, the SEC adopted Rule 202T of Reg-SHO, which established procedures for
the SEC to temporarily suspend any short sale price test for a subset of firms (the pilot firms),
while short sale constraints remained unchanged for other firms (the control firms). According to
Rule 202T’s pilot program, stocks in the Russell 3000 index as of June 25, 2004 were ranked by
average daily dollar volume of trade over the one year period prior to the issuance of Reg-SHO
from highest to lowest for the period. Within each exchange — American Stock Exchange, New
York Stock Exchange or NASDAQ — every third ranked stock was drawn from the pool and
designated into the pilot group, resulting in a pilot group comprising 986 stocks and a control
group (comprised of all the remaining stocks in the Russell 3000 index).
From May 2, 2005 to July 6, 2007, pilot stocks were exempted from short-sale price tests,
and after August, 2007, the SEC repealed the price test rule on short selling for all stocks.
However, the removal of short-sale price tests was not welcomed by managers and exchanges. In
a 2008 NYSE survey, 85% of top executives surveyed were in favour of re-instituting the price
tests as soon as possible (Grullon et al., 2015). Various parties including law firms, members of
congress and journalists blamed the SEC for the 2007/08 financial crisis in part because of
increased short selling. Under this pressure, on February 24, 2010, SEC restored a modified
uptick rule that price tests are triggered when a security’s price declines by 10% or more from
the previous closing price.
2.2. The potential impact of Reg-SHO on bad news disclosure
Managers have various incentives to withhold bad earnings-related news and avoid the
resulting negative stock price effects (e.g., Graham et al., 2005; Kothari et al., 2009). They also
9

bear potentially large costs when investors are surprised by large negative news on earnings
announcement dates (Skinner, 1994). Managers can be sued for not releasing adverse earnings
surprises promptly. They may also incur reputational costs for failing to disclose bad news in a
timely manner. Those firms with poor reporting reputations are less likely to be followed by
analysts and money managers, which reduces the price and/or liquidity of their firms’ stocks
(Skinner, 1994).
Short selling likely influences both benefits and costs to managers associated with their
decision to disclose or withhold bad news. Prior studies suggest that short sellers are informed
investors and their information set overlaps managers’ private information. Greater short interest
is associated with poor future performance, negative earnings surprises and managerial financial
misconduct (e.g., Christophe et al., 2004; Diether et al., 2009a; Karpoff and Lou, 2010). Thus, an
increase in abnormal short interests is often perceived as a bad signal to market participants (e.g.,
Diamond and Verrecchia, 1987), and stock prices fall immediately in response to the
announcement of an increase in short interest (e.g., Aitken et al., 1998). As a result, stock prices
already likely incorporate at least partially the undisclosed upcoming bad news withheld by
managers, reducing the benefits from withholding disclosure.5
On the cost side, since managers’ ability to withhold unfavourable news is constrained
by investors’ beliefs about their possession of private information (e.g., Dye, 1985; Jung and
Kwon, 1988), it will be harder for managers to hide bad news and claim “no news” when
investors’ beliefs are updated via new information from short selling. As a result, managers are
5 Consistent with this argument, Karpoff and Lou (2010) report evidence that for firms that are experiencing financial misconduct, those with high abnormal short interest will be publicly revealed 8 months earlier than firms with low abnormal short interest.
10

likely to face larger litigation and reputational costs if they continue withholding bad news
(Trueman, 1997).
In summary, in the presence of short selling managers are likely to face lower
incremental benefits from withholding bad news and higher potential litigation and reputational
costs leading to increased and more timely disclosure of bad earnings news.
The introduction of Reg-SHO acts as an exogenous shock to short selling constraints for
the pilot firms. The reduction in transaction costs associated with short selling led to a dramatic
increase in short selling for firms in the Reg-SHO pilot group. Diether et al. (2009b) report an
8% increase in intraday short sales immediately following the implementation date of the pilot
program on May 2, 2005. Similarly, Grullon et al. (2015) document a 19% increase of monthly
short interest for pilot firms around the announcement date of Reg-SHO compared to control
firms. These findings provide evidence that the removal of short sale price tests under Reg-SHO
was significant enough to materially affect the extent of short selling activity, and suggest that
the increase in short selling pressure for pilot firms could affect managerial decisions. Relating to
the disclosure of bad earnings news, we expect that the enhanced threat from short selling
motivated managers of pilot firms to release bad news voluntarily through management earnings
forecasts more than those of control firms. This leads to our first hypothesis:
H1: During the Reg-SHO period, firms in the pilot group were more likely to disclose
bad news through management earnings forecasts compared to those in the control
group.
Prior research also indicates that managers not only have incentives to withhold bad
news, they also delay the voluntary disclosure of bad news (e.g., Kothari et al., 2009). As
11
discussed above, since short selling is likely to reduce the incentives for managers to withhold
bad news, we expect short selling to similarly reduce managers’ incentive to delay the voluntary
release of bad news:
H2: During the Reg-SHO period, firms in the pilot group accelerated the release of bad
news management earnings forecasts compared to those in the control group.
Finally, turning to mandatory earnings announcements, prior research documents that
managers may deliberately time the release of (mandatory) earnings news (e.g., Chambers and
Penman, 1984; Begley and Fischer, 1998; Bagnoli et al., 2002; Cohen et al., 2007). As discussed
above, Reg-SHO enhances the informativeness of stock prices with respect to negative news for
pilot firms, which reduces the information asymmetry between investors and firm managers.
Due to increased short-selling, investors of pilot firms are likely aware of/anticipate the
upcoming bad earnings news. As a result, there is less incentive for managers to delay the
earnings release. Instead, they may accelerate the earnings announcement to build a reputation
for transparent reporting or to reduce potential litigation and/or reputational costs associated with
late reporting. This leads to our third hypothesis:
H3: During the Reg-SHO period, firms in the pilot group accelerated the release of bad
earnings news compared to those in the control group.
12

3. Sample selection
We begin with the Russell index as of June 2004. On July 28, 2004, the SEC announced
that out of the Russell 3000, 986 stocks would trade without any price test restrictions applied to
short sales during the term of pilot program.6 Following the SEC requirement, we exclude stocks
that are not listed on the NYSE, AMEX or Nasdaq, and also those that went private or had spin-
offs after April 30, 2004. As a result we identify 986 pilot firm stocks (the pilot group) according
to the published list of the SEC’s pilot order and 1986 non-pilot firm stocks (the control group).7
We obtain financial statement data from COMPUSTAT, institutional ownership data
(form 13F) from the Thomson-Reuters CDA/spectrum database, and analyst following
information from the I/B/E/S detail files. The quarterly EPS management forecast data is
provided by the I/B/E/S guidance feed database.8 We define the Reg-SHO pilot period
(durSHO) as the period from May 2, 2005 to July 6, 2007, when the pilot program was in place.
We choose December 1st 2002 – July 28th 2004 as the pre-treatment period (preSHO) to match
the length of the two periods.9 We examine whether the effect of Reg-SHO on management
forecasts diminishes after August 2007, when the uptick rule was also suspended for the control
group. We choose the post SHO implementation period (postSHO) as the period from August
2007 to July 2009 for the test of the likelihood and timing of bad news management forecasts
6 Details of the pilot list are available at http://www.sec.gov/rules/other/34-50104.htm. 7 The total number of firms in our sample at this step is 2972, comparable to the 2952 identified by Fang et al. (2014). 8 Chen et al. (2014) uses the same database. “I/B/E/S Guidance Feed database offers quantitative guidance from press releases and corporate event transcripts, together with analyst forecasts from First Call and I/B/E/S. It provides a deep level of data for back testing purposes dating back to Dec. 1st, 2002. The sample period is after Reg-FD, so analyses are not confounded by changes in disclosure practices triggered by Reg-FD (Heflin et al. 2003; Kross and Suk, 2012).” 9 SEC announced the Reg-SHO on July 29th, 2004, while management earnings forecast data is only available from December, 2002.
13

(hypotheses 1 and 2). For tests of the delay in bad news earnings announcements (hypothesis 3)
we choose postSHO as August 2008 to July 2010 because we require earnings announcement
date for the same quarter in the previous year under the same regulation regime to calculate our
expected delay metric (see below).10
Following the related literature (e.g., Diether et al., 2009b; Grullon et al., 2015), firms
with a price less than $1 or greater than $100 are excluded from the sample. We also exclude
financial and regulated firms (SIC code between 4450 and 4500; and SIC code between 6000
and 7000) because disclosure requirements and accounting rules are different for these industries
(e.g., Fang et al., 2014).11 We further require each firm-quarter to have all control variables
available (as described in the following section). Following Anilowski et al. (2007), we exclude
non-EPS forecasts and require management forecasts to be made before the earnings
announcement and not more than 90 days before the fiscal quarter end. To measure the analyst
consensus, we use the item Mean_at_date (analyst forecast consensus at the time of guidance),
provided by the I/B/E/S Guidance Feed database. Monthly short interest data is provided by
COMPUSTAT. Finally, following Grullon et al. (2015), we require that each firm must be in the
Russell 3000 index in 2005.
For the test of the timing of earnings announcements (hypothesis 3), we require each
firm-quarter to have an actual quarterly earnings report date (RDQ) from COMPUSTAT for
quarter q of year t and year t-1. Following Bagnoli et al. (2002), we eliminate earnings
10 We also reran the test using August 2007- July 2009 as postSHO and found a significant difference between pilot and control firms in the delay of bad news earnings announcements. This may suggest the influence of measurement error in the “expected delay of earnings announcement”, and/or a prolonged effect of RegSHO on pilot firms. 11 If we include such firms in our sample our results are weaker but consistent with the main tests.
14

announcements with actual report dates more than 60 calendar days before or 90 calendar days
after the expected announcement date (the earnings report date in the same quarter of the
previous year). These restrictions reduce our sample by less than 1% and reduce the likelihood of
data entry errors in our sample data.
4. Research Design
We employ a difference-in-difference approach, using the Reg-SHO as the quasi-natural
experiment to identify the causal effect of short selling on firms’ disclosure choices. Specifically,
we compare the likelihood of bad news management earnings forecasts, the horizon of bad news
forecasts, and the timing of earnings announcements between pilot firms and control firms
before, during and post the pilot program.
4.1. Measurement of disclosure properties
4.1.1 The likelihood of bad news management earnings forecasts
Following Anilowski et al. (2007), we classify a management earnings forecast as a bad
news forecast if the forecast is less than the prevailing analysts’ consensus earnings estimate.12
The majority of our sample forecasts are issued in range and point forms. We use the mid-point
of the range (for a range forecast) to measure the forecast value. For open-range management
forecasts, the forecast is classified as bad news if the upper boundary is lower than the analyst
consensus.13 The analyst consensus is provided by the I/B/E/S Guidance Feed database (item
12 We repeated our analyses after eliminating bad news forecasts in the top decile by magnitude of all negative management forecast errors. We also eliminated possible low ball management forecasts (defined as in Chen (2014)). Our main results were qualitatively similar in these tests. 13 Inferences are unchanged if we exclude the management forecasts when the magnitude of the forecasts news (scaled by stock price in the beginning of the quarter) is in the bottom quintile of the sample distribution.
15

Mean_at_date).14 We use an indicator, BADNEWS, to capture whether firms disclose bad news
in a firm-quarter. If managers provide at least one bad news forecast during a firm-quarter, then
BADNEWS is one and zero otherwise.15
4.1.2 The timing of bad news management earnings forecasts
Once a manager has decided to provide a bad news forecast, s/he faces choices about the
properties of the forecast (King et al., 1990), including when to release the forecast. To reflect
the timeliness of bad news forecasts issued by managers, we compute the forecast horizon.
Following Rogers and Van Buskirk (2009), we define MF_HORIZON_BAD as the length of time
between when the forecast was released and the end date of the fiscal period being forecasted.
Using this definition, preannouncements (i.e, forecasts made after the end of a fiscal period but
before earnings announcement date) will have a negative horizon. Increasing the horizon of a
forecast is consistent with managers providing more timely information to the market, i.e.,
releasing the information earlier. If a firm issues multiple bad news forecasts for a fiscal quarter,
we choose the first forecast to compute MF_HORIZON_BAD.16
14 Using the I/B/E/S detail history file, we also computed the analyst consensus based upon individual analyst forecasts provided 90 days before the management forecast date. Using this measure of analyst consensus yields qualitatively similar results to those we report below. 15 In our sample, 65% of management quarterly EPS forecasts are issued once in a quarter. Therefore, multiple management forecasts are a minority. Nevertheless, in robustness checks (untabulated), we employed the proportion of bad news forecasts to all forecasts in a quarter as a proxy for bad news, BADNEWS_PROPORTION. The results are qualitatively similar to those we report below. 16 In robustness tests, we also reran our tests with all bad news forecasts, or eliminated firm-quarters with multiple management forecasts. The results are qualitatively similar.
16

4.1.3 The timeliness of bad news mandatory earnings announcements
We measure the timeliness of earnings announcements by using the following
extrapolative model employed in prior related research (e.g., Givoly and Palmon, 1982; Bagnoli
et al., 2002; Brown et al., 2012):
_ _ _ _iqt iqt iqtER ANN DELAY ANN lag ANN Expect= − (1)
where _ iqtANN lag is the number of trading days between the earnings announcement date for
firm i in quarter q of fiscal year t and the fiscal end date of quarter q. This model estimates the
deviation of the firm's earnings announcement lag from its expected announcement timing
_ iqtANN Expect . Following Brown et al. (2012), we assume _ iqtANN Expect to be the same as
the reporting lag in days for the corresponding quarter of year t-1.17
4.2. Empirical Models
4.2.1. Management earnings forecasts
We employ the following models to estimate the effect of Reg-SHO on the likelihood of
bad news forecasts (BADNEWS) and the horizon of bad news forecast (MF_HORIZON_BAD):
0 1 2 3 4
5 1
it i t t i t
i t it it
BADNEWS a a PILOT a DURSHO a POSTSHO a PILOT DURSHOa PILOT POSTSHO Za ε−
= + + + + ×+ × + +
(2)
0 1 2 3
4 5 1
_ _ it i t t
i t i t it it
MF HORIZON BAD b b PILOT b DURSHO b DURSHOb PILOT DURSHO b PILOT POSTSHO Zb ε−
= + + ++ × + × + +
(3)
17 In addition, we employed a time-series model to estimate the expected earnings announcement lag as in Brown et al. (2012). Briefly, we used the median announcement date for each firm quarter as the proxy for the expected announcement date and computed the median announcement date for the prior two, three and four years, respectively. The results are qualitatively similar to those we report below.
17

where:
iPILOT is an indicator that equals 1 if firm i is in the pilot group and 0 otherwise;
tDURSHO is an indicator that equals 1 if a quarter is during the period of the Reg-SHO
program and 0 otherwise;
tPOSTSHO is an indicator that equals 1 if a quarter is after the period of the Reg-SHO
program and 0 otherwise;
1itZ − is a set of firm and industry characteristics that may affect management forecasts
(discussed later). Industry fixed effect and year-quarter fixed effects are also included
where indicated in the relevant tables.
We test whether the relaxation of shortselling constraints for pilot firms is associated with
an increase in bad news forecasts (compared with control firms) using model (2), and whether it
results in earlier voluntary disclosure of bad news forecasts using model (3). In model (2),
BADNEWS, an indicator variable, is equal to one if there is at least one management forecast less
than the consensus of analyst forecasts at the time of announcement for each fiscal period and
zero otherwise. In model (3), MF_HORIZON_BAD is the number of days between the forecast
date and the fiscal period end being forecasted, conditional on there being a bad news forecast
(BADNEWS =1).
The coefficient estimates on i tPILOT DURSHO× , 4a and 4b , capture the causal effect of
short sellers on the likelihood and horizon of bad news forecasts, respectively. Subsequent to
August 2007, the Reg-SHO pilot program expired and all stocks in the Russell Index were
exempted from the “price check” rule. Therefore, we expect there to be no difference in the
18

likelihood of bad news forecasts, the bad news forecast horizon, and the delay in earnings
announcements between the pilot group and control group during the post-SHO period. To test
this additional prediction, we include an interaction term in our regressions, i tPILOT POSTSHO×
, to capture the difference between pilot and control firms in the post SHO period. Note that
tDURSHO and tPOSTSHO are dropped from some model specifications when year-quarter fixed
effects are included because they are perfectly correlated with and thus fully absorbed by the
year-quarter fixed effects.
Following prior research, we control for several factors related to managers’ incentives
for voluntary disclosure. We include firm size (SIZE), measured as the logarithm of market value
of equity (in millions of dollars) at the beginning of the relevant quarter. Lang and Lundholm
(1993) and Kasznik and Lev (1995) document a positive association between firm size and the
frequency of voluntary disclosure. We also consider firms’ underlying performance in
determining disclosure choices. Prior studies find that firms’ propensity to issue bad news
forecasts is associated with the underlying earnings news (e.g., Skinner, 1994; Field et al., 2005;
Kothari et al., 2009). To control for earnings news, we include a loss indicator, EPS_LOSS_D ,
equal to one if actual quarterly earnings is less than zero and zero otherwise. In addition, we also
include return on assets (ROA) as in Miller (2002). This measure is computed as earnings before
extraordinary items scaled by lagged total assets at the end of each fiscal quarter. We control for
proprietary costs, proxied by research and development expense (RD) computed as research and
development expenditures scaled by total assets at the beginning of a fiscal quarter.
We further control for uncertainty and growth of firms’ operation by using return
volatility (RETVOLATILITY) and the market-to-book ratio (MTB). Firms facing greater
19

uncertainty in their future earnings realizations may discourage managers from providing
earnings forecasts (e.g., Waymire, 1985; Graham et al., 2005; Feng and Koch, 2010).
Alternatively, a volatile and fast growth business environment may motivate managers to
disclose more forecasts to avoid/reduce potential litigation costs (e.g., Skinner, 1994, 1997).
RETVOLATILITY is computed as the standard deviation of daily market-adjusted returns during
a fiscal quarter. MTB is measured as the ratio of market value of equity to book value.
Prior studies document that bad news disclosure increases with increased litigation risk
(e.g., Brown et al., 2005; Field et al., 2005) and some specific industries have higher inherent
litigation risk (e.g., Kim and Skinner, 2012). We use an industry dummy to proxy for high
litigation risk (HILIRI).18 The coefficient on the high litigation risk industry dummy is expected
to be positive. In addition, we use prior stock return (CRET) to capture litigation risk. CRET is
computed as the 90 days value-weighted market adjusted returns accumulation ending with the
fiscal quarter-end.
We also include analyst following (LNANALYSTS) and institutional ownership
(INSTITUTION) to control for demand for credible earnings guidance from managers. Prior
research finds that greater analyst following and higher institutional ownership are both
associated with more disclosure (Lang and Lundholm, 1996; Ajinkya et al., 2005). We use a
logarithmic transformation of one plus the number of analysts to capture analyst following.
Institutional ownership is the percentage of aggregated institutionally owned shares over total
18 Following Kim and Skinner (2012), we classify high litigation risk firms as those with Standard Industrial Classification (SIC) codes 2833-2836, 3570-3577, 3600-3674, 5200-5960, 7371-7379 and 8371-8734.
20

outstanding shares for each quarter, based on data from Form 13F.19 Next, as analytical studies
posit that firms facing high proprietary costs are reluctant to disclose information (e.g.,
Verrecchia, 1983).
Finally, prior research suggests that firms’ disclosure policies tend to be “sticky”; that is,
some firms consistently provide earnings guidance while others rarely do (e.g., Bushee et al.,
2003; Skinner, 2003; Graham et al., 2005). It is possible that firms issue bad news to maintain
the continuity of their usual disclosure pattern. Following Field et al. (2005) and Cao and
Narayanamoorthy (2011), we use an indicator variable, MF_D, to capture firms’ past disclosure
patterns. The indicator variable is equal to 1 if a management forecast was issued in the previous
quarter and 0 otherwise. It is predicted to be positively associated with bad news disclosure.
All above measures are computed at the beginning of a firm-quarter, except ROA and
EPS_LOSS_D that are computed in current firm-quarter.
4.2.2. The timeliness of earnings announcements
We employ the following model to estimate the effect of Reg-SHO on the delay in
earnings announcements (ER_ANN_DELAY):
0 1 2 3
4 5 1
_ _ it i t t
i t i t it it
ER ANN DELAY c c PILOT c DURSHO c POSTSHOc PILOT DURSHO c PILOT POSTSHO Wγ ε−
= + + ++ × + × + +
(4)
19 Because Form 13F is provided every calendar quarter, for each firm whose fiscal quarter doesn’t align with the calendar quarter, we round the fiscal quarter to the calendar quarter. For example, if a firm’s fiscal quarter is January 2004, the institutional holdings published in March 2004 will be allocated to this firm. In our sample, around 20% observations are subject to this adjustment.
21
where _ _ itA DE N ELAYR N is the difference (in trading days) between the earnings
announcement date and the announcement date from the corresponding quarter in the prior year
(see equation (1)); The variables, iPILOT , tDURSHO , and tPOSTSHO , are as defined in models
(2) and (3); 1itW − is a set of firm and industry characteristics that may affect earnings
announcement timing (discussed below). Industry fixed effects and year-quarter fixed effects are
also included.
The coefficient estimate on i tPILOT DURSHO× , 4c captures the causal effect of short
sellers on the delay in earnings announcements. In some model specifications, tDURSHO and
tPOSTSHO are dropped when including year-quarter fixed effects as they are perfectly
correlated with and thus fully absorbed by the year-quarter fixed effects.
Following prior research, we control for several factors that are associated with the delay
in earnings announcements. Bagnoli et al. (2002) and Brown et al. (2012) document that firms
with negative news are more likely to delay the earnings announcement. Therefore, we control
for expected earnings, measured as the forecast error (FE) --- the difference between actual
earnings and the analyst consensus.20 We also include an indicator variable NEG_FE_D equal to
1 if FE is negative and 0 otherwise. Finally, we include an indicator variable EPS_LOSS_D
equal to 1 if actual EPS is negative and 0 otherwise. We expect the coefficient on FE to be
negative and coefficients on NEG_FE_D and EPS_LOSS_D to be positive.
20 Using the I/B/E/S detail history file, we compute the analyst consensus based on individual analyst forecasts provided 90 days before the earnings announcements date.
22

In addition, we control for firm size (SIZE), market to book ratio (MTB), return on assets
(ROA), institutional ownership (INSTITUTION) and litigation risk (HILIRI), computed as in
models (2) and (3). Finally, we control for several other determinants of the timing of firms’
earnings announcements, including earnings volatility (STDROA), occurrence of one-time events
proxied by the reporting of special items in Compustat (SPECIAL_D), and an indicator (
GUIDANCE_D) whether or not firms provide management earnings forecasts. STDROA is
computed as a standard deviation of return on assets over at least three of the past eight quarters.
SEPECIAL_D is an indicator variable equal to 1 if a firm reports non-zero special items in
current quarter and 0 otherwise. GUIDANCE_D is an indicator variable equal to 1 for those firm-
quarters with at least one outstanding management earnings forecasts as of the earnings
announcement date and 0 otherwise.
In order to mitigate the effect of extreme observations, we winsorize all continuous
variables at the first and 99th percentiles.
5. Results
5.1. Descriptive statistics
In Table 1, we compare the primary research variables between pilot and control firms
before the announcement of Reg-SHO (Panel A) and during the implementation of Reg-SHO
(Panel B). Because the pilot firms are created by (effectively) random selection from Russell
3000 index firms there should be no systematic difference between these two groups before
SHO. However, after requiring relevant data for our tests and excluding financial/regulated
firms, there are several differences between pilot and control firms before the announcement of
Reg-SHO. For instance, pilot firms are larger, have lower market/accounting return volatility,
23

and a longer delay in earnings announcements, relative to control firms. There are also weak
differences in the bad news forecast horizon, market-to-book ratio, R&D, unexpected earnings,
litigation risk and special items.21 As a result, we control for these firm-specific characteristics in
our difference-in-difference analyses.
[Insert Table 1 about here]
5.2. Difference-in-Difference analyses
5.2.1. The effect of Reg-SHO on the likelihood of bad news management earnings forecasts
Table 2 presents regression results regarding the effects of Reg-SHO on the likelihood of
bad news management forecast disclosure (hypothesis 1). In column (1), without any control
variables, the coefficient on i tPILOT DURSHO× is 0.12 and significant at the 5% level,
indicating that managers in the pilot firms are more likely to issue bad news forecasts during the
Reg-SHO period, relative to those in control firms. After controlling for other factors, the effect
of Reg-SHO still holds, shown by the significantly positive coefficient on i tPILOT DURSHO× ,
0.13 (significant at the 1% level), in column (2). In column (3), when firm and quarter fixed
effects are included, the coefficient on i tPILOT DURSHO× is 0.15 and significant at the 1%
level.
As expected, the coefficients on the iPILOT variable are not significantly different from
zero in table 2 (see columns (1)-(3)), revealing that there is no reliable evidence of a difference
21 Systematic differences between pilot and controls firms are also observed in Li and Zhang (2015) and He and Tian (2014). In addition, the SEC randomly selected pilot firms based upon dollar trading volume one year immediately prior to the SHO announcement. If we restrict our pre Reg-SHO sample period to this 1 year period, the differences between pilot and control groups are smaller.
24

between pilot and control firms’ disclosure of bad news management forecasts in pre Reg-SHO
period. However, in columns (2) and (3) there is marginal evidence of significance (at the 10%
level) for the coefficient on i tPILOT POSTSHO× . However, when we remove the global
financial crises period from the post-Reg SHO period this difference disappears, suggesting that
it is driven by factors relating to the crisis period, rather than short selling differences between
pilot and control firms.22 These results reinforce the inference that the difference in managerial
disclosure behavior between pilot and control firms during Reg-SHO is driven by the increase in
short selling pressure resulting from the relaxation of constraints on short-selling.
We extended our analysis to investigate whether the increased disclosure of bad news
forecasts holds for extremely bad news versus only moderately bad news. Extremely bad news is
likely to be revealed even in the absence of short selling pressure due to the likely associated
litigation costs and other factors discussed in section 2. In these cases it is less likely that the
removal of short selling constraints under Reg-SHO will have an important influence on firms’
disclosure of bad news. However, for less extreme or moderately bad news, the removal of short
selling constraints is more likely to influence firms’ disclosure decisions regarding bad news.
Therefore, we expect that the increased disclosure of bad news concentrates in the moderately
bad news cases, and has less or no effect for extremely bad news cases. To investigate this
possibility, we divided the sample of all bad news management forecasts into two groups:
22 Specifically, we divided the post-Reg SHO period into two sub-periods: August 2007 – September 2008, and October 2008 – July 2009. The second of these corresponds to the global financial crisis. Only in the second sub-period is there evidence of a difference between the disclosure of bad news between pilot and control firms. Moreover, when we remove firms from the regressions who disappear during the global financial crises period the disclosure difference between pilot and control firms in the second sub-period (the global financial crises period) disappear. This suggests that the marginal significance in table 2 for the coefficient on i tPILOT POSTSHO× is driven by failed firms during the global financial crisis, rather than short selling related differences.
25

‘moderately bad’ forecasts, which are those where the forecast is above the median of all bad
news forecasts, and ‘extremely bad’ news forecasts where the forecast is below the median. We
then re-estimated equation (2) twice: first where the left-hand side (LHS) variable is redefined to
be one if the forecast is ‘moderately bad’ and zero if it is not bad (column (4) of table 2), and
then where the LHS is redefined to be one if the forecast is ‘extremely bad’ and zero if it is not
bad (column (5) of table 2). In each case the LHS excludes bad news forecasts of the opposite
type: column (4) excludes extremely bad forecasts from the estimation sample and column (5)
excludes moderately bad forecasts.
In column 4, the coefficient on the i tPILOT DURSHO× variable is 0.22 (significant at 1%
level) when the LHS variable is based on moderately bad news forecasts. In contrast, when the
LHS variable is based on extremely bad news the coefficient is not significantly different from
zero in column (5). This is consistent with the difference in the likelihood of bad news forecast
disclosure between pilot and control firms being driven primarily by moderately bad news
forecasts. The results imply that Reg-SHO relaxes the threshold of bad news disclosure, and
encourages moderately bad news to be released to the market. In both cases there remains no
significant difference between the disclosure of bad news forecasts by pilot and control firms in
the pre Reg-SHO period, and only a marginal difference in the post Reg-SHO period. Again, the
latter difference disappears once the influence of the global financial crises is removed from the
sample.
[Insert Table 2 about here]
26

5.2.2. Effect of Reg-SHO on the timing of bad news earnings forecasts
Table 3 presents results regarding the effects of Reg-SHO on the timing of bad news
management forecasts (hypothesis 2). These regressions are based on the subsample of firm-
quarters where a bad news management forecast was released. The LHS variable is measured as
the number of days prior to the end of the forecasted fiscal quarter that the management forecast
was released. In column (1), the coefficient on i tPILOT DURSHO× is 2.65 and significant at the
1% level, suggesting that managers in the pilot firms issued bad news forecasts earlier than those
issued by control firms during Reg-SHO. After controlling for other factors, the result still holds
as the coefficient on i tPILOT DURSHO× is 2.23 and 2.34 (significant at the 5% level) in column
(2) and (3), respectively. Regarding economic significance, the increase in the horizon is almost
7% compared to the mean horizon of bad news forecasts for the pilot firms before Reg-SHO.
The coefficient on i tPILOT DURSHO× is insignificant in column (1) , (2) and (3), which implies
that the difference disappears between pilot and control firms in the post Reg-SHO period.
However, the coefficient on iPILOT in columns (1) (2) and (3) is significant and negative,
indicating that prior to Reg-SHO pilot firms tended to report bad news management forecasts
later than control firms. This suggests that the assignment of firms by the SEC to the pilot and
control groups (and after the further effects of our sample selection procedures) was not
completely random in effect and reinforces the importance of using a difference-in-difference
research design.
Similar to the analysis of the likelihood of bad news forecasts in the previous subsection,
we refined the definition of bad news management forecast into extremely bad and moderately
bad news forecasts. The coefficient on i tPILOT DURSHO× is 2.73 (significant at 5% level) when
27

the forecast news is classified as moderately bad (reported in column (4)), indicating that the
difference in the horizon of bad news forecast between pilot and control firms is again primarily
driven by moderately bad news. For the extremely bad forecast news (column (5)), there is no
difference between pilot and control firms during Reg-SHO.
[Insert Table 3 about here]
5.2.3. Effect of Reg-SHO on the timing of earnings announcements
In Table 4, we report results regarding the effect of Reg-SHO on the timing of earnings
announcements (hypothesis 3). In the baseline model (column (1)), the coefficient on
i tPILOT DURSHO× is -0.31 (significant at the 5% level), suggesting that as predicted by
hypothesis 3, during the Reg-SHO pilot period managers in pilot firms move their earnings
announcements forward (compared with control firms). After controlling for other factors, this
result continues to hold as shown by the significant coefficient on i tPILOT DURSHO× in columns
(2) and (3).23 Turning to the post Reg-SHO period, the coefficient on i tPILOT POSTSHO× is not
significant (see column (2) and (3)), suggesting that the difference between pilot and control
firms in the timing of earnings announcement disappears in the post Reg-SHO period.24
23 Also note that the coefficient on PILOT DURSHO× appears economically small. As discussed in Brown et al. (2012), this result may be attributable to the substantial clustering of announcements around the expected data (i.e., around ER_ANN_DELAY = 0). To address this issue, following Brown et al. (2012), we reran our test after eliminating observations with an absolute ER_ANN_DELAY less than three days (i.e., earnings announcements that are less than three days late or less than three days early). The results in the reduced sample exhibit a more striking effect for Reg-SHO ─ the coefficient on PILOT DURSHO× is -0.88 and significant at the 1% level. 24 As in table 3, the coefficient on ipilot is statistically significant. The positive sign of the coefficient indicates that, on average, prior to the Reg-SHO period pilot firms delayed their earnings results compared with control firms, consistent with their delay of management earnings forecasts relative to control firms in the pre Reg-SHO period in table 3.
28

The discussion surrounding hypothesis 3 in section 2 suggests that the potential effect of
short selling on firms reporting of (mandatory) earnings news is likely to be concentrated in
situations where the firm is reporting bad earnings news. To investigate this possibility we
partitioned our sample into two subsamples based upon earnings news: reported earnings less
than (greater than or equal to) the analyst consensus forecast is classified as bad (neutral or good)
news. We expect that the effect of Reg-SHO on the timing of earnings announcement will be
more pronounced in the subsample when the earnings news is bad. The results are consistent
with this prediction, indicated by the negative coefficient on i tPILOT DURSHO× , -0.74
(significant at the 5% level) when earnings news is bad, compared with an insignificant
coefficient on i tPILOT DURSHO× when the earnings news is neutral or good.
[Insert Table 4 about here]
5.3. Litigation risk and the effects of short selling on bad news disclosure
As discussed in section 2, although managers have incentives to withhold bad news, they
incur higher costs when facing higher ex ante litigation risk. And prompt disclosure of bad news
can reduce firm’s litigation and reputational costs. In the presence of high ex ante litigation risk,
short selling activities signal the existence of bad news to the market, increasing the likelihood
that the withholding of bad news will be detected by investors and correspondingly higher
associated litigation and reputational costs. In contrast, for firms facing low perceived litigation
risk, the threat of lawsuits is already low. So the increased detection rate will likely have little
deterrence effect on management disclosure behavior through the litigation channel. Therefore,
we expect that the impact of Reg-SHO on disclosure will be greater for firms facing high ex ante
litigation risk.
29

Following prior research we use industry membership to proxy for firms’ ex ante
litigation risk. Table 5 presents the results of the impact of litigation risk on the effect of Reg-
SHO for our three hypotheses ─ the likelihood of bad news management forecasts (Panel A), the
timing of bad news forecasts (Panel B), and the timing of earnings announcements (Panel C).
In panel A, for firms in high litigation risk industries the coefficient on
i tPILOT DURSHO× is 0.31 and significant at the 1% level, while the coefficient has smaller
magnitude (0.04) and is statistically insignificant when litigation risk is low. That is, only for
high litigation risk firms do we obtain statistically reliable evidence consistent with short selling
increasing the likelihood that firms will disclose bad news management earnings forecasts.
Similarly, in panel B the coefficient on i tPILOT DURSHO× is 4.37 (significant at the 5% level)
for firms facing high litigation risk but insignificant for low litigation risk firms (0.96). And in
panel C, we find similar results for the effect of Reg-SHO on the timeliness of earnings
announcements. The coefficient on i tPILOT DURSHO× is -0.48 (significant at the 5% level) for
high litigation risk firms and insignificant for low litigation risk firms (-0.25). These results
provide evidence that short sellers can motive managers to accelerate the release of bad news
through the channel of litigation threat.25
[Insert Table 5 about here]
25 In panel A, table 5, the coefficient on PILOT POSTSHO× is significant at the 5% level. However, this result disappears when the effects of the global financial crisis are removed from the post period.
30

5.4. Additional analyses
Good news earnings forecasts
To rule out the possibility that our findings are due to a change of managerial disclosure
in general (e.g., increases in the likelihood of both good news and bad news forecasts), we also
examined the effect of short selling on good news forecasts. Table 6 columns (1) – (3) show no
difference in the likelihood of good news forecasts between pilot and control firms during Reg-
SHO, consistent with the findings in Li and Zhang (2015). In addition, panels (4) – (6) show no
difference in the horizon of good news forecasts between pilot and control firms.
[Insert Table 6 about here]
Impact of stock price response to initial announcement of Reg-SHO
Grullon et al. (2015) document a decline in the short-term cumulative abnormal return
around the Reg-SHO announcement date for the pilot group. If Reg-SHO affects managerial
disclosure behavior, then we expect the effect will be more pronounced for those firms which are
most affected by the regulation, indicated by the larger drop in prices around Reg-SHO
announcement date. To investigate this possibility, we partitioned the full sample into two
groups based on the 12-day cumulative abnormal return around the Reg-SHO announcement.
Specifically, Reg-SHO was announced on June 28, 2004; the cumulative abnormal return,
CAR[-10,+1], for each firm was computed between 10 days before and 1 day after the Reg-SHO
announcement. We partitioned the sample into firms with a CAR below the median (low CAR
firms) and with a CAR above the median (High CAR firms). Low CAR firms are those with the
greatest magnitude price decline and so are those expected to be most affected by the Reg-SHO
provisions.
31

Untabulated results indicate that the difference between the likelihood of bad news
forecasts for pilot and control firms is significant when firms experienced a greater negative
initial stock price reaction (i.e., were more negatively affected by the regulation), but not when
the initial price response was less negative (or positive). Similar results hold for the impact on
the effect of Reg-SHO on the timing of earnings announcements. However there is no difference
in results for low and high CAR firms with respect to the timing of bad news management
forecasts.
Impact of short interest on the effect of Reg-SHO
Grullon et al. (2015) document a significant increase of short interest in the pilot group
during Reg-SHO, relative to the control group. If Reg-SHO reduces the cost of short selling to an
extent that encourages managers to change their disclosure behavior, this implies that the effect
of Reg-SHO will be more pronounced when short selling is more active, that is, when there is a
higher level of short interest. To test this implication, we divided our sample based on high
versus low average levels of short interest during the pilot period (using the median as the
dividing line).
Untabulated results indicate that managers in pilot firms are more likely to issue bad new
forecasts than those in the control firms when experiencing more active short selling activities. In
contrast, the difference between pilot and control firms is not apparent when the average level of
short interest is low. Similarly, managers in pilot firms release bad forecast news earlier than
those in control firms when they experience above median level of short interest during Reg-
SHO. However, this difference disappears for the subsample with low level of short interest.
However, there is no difference in results for high and low levels of short interest firms regarding
the timing of their mandatory earnings results.
32

Bundled management forecasts
Rogers and Van Buskirk (2013) show that the traditional measure of management
forecast news contains error due to the bundling of current quarter earnings announcements with
management forecasts for next quarter. The majority of management forecasts in our sample are
bundled with earnings announcements, leading to a potential measurement error in the traditional
calculation of forecast news. Following Rogers and Van Buskirk (2013), we correct the
management forecasts news by substituting the conditional analyst forecast consensus (to
earnings announcements) for the unconditional consensus forecasts used in traditional
calculation of management forecast news. Untabulated results indicate that all of our results are
robust to this redefinition of forecast news.
Correlation of management forecasts horizon and earnings announcement delay
Because the majority of management forecasts are bundled with earnings announcements,
our finding of a decrease in bad news forecast horizons might be due to a reduction in delay of
earnings announcements. To mitigate this concern, we included an indicator variable in our
regressions to control for this bundle effect. Following Rogers and Van Buskirk (2013), we
define the indicator variable as equal to 1 if management forecasts fall within two days of the
earnings announcement date and 0 otherwise. Untabulated results indicate that all of our results
are robust to this check.
Pseudo pilot firms and pseudo Reg-SHO pilot program period
Following He and Tian (2014), we ran simulations to create pseudo pilot firms and
pseudo pilot program period to address the concern that our results may be caused by chance.
Specifically, we randomized one third of firms into a pseudo pilot group and the rest were
33

assigned to the control group in the quarter immediately before the Reg-SHO announcement
(July 2004). Using this bootstrapped sample, we estimated the models (2)-(4) and repeated the
simulation 5000 times. The original coefficients on the likelihood (0.15 in Table 2) and horizon
of bad news forecasts (2.34 in Table 3) as well as that of the delay of earnings announcements (-
0.33 in Table 4) fall in the tails (95% or 5%) of the simulated distribution of the coefficients on
PILOT DURSHO× , which is inconsistent with our findings in tables 2-4 being generated by
chance.
To address the concern that our findings are driven by the implementation of Reg-SHO
and are not caused by unobservable confounding shocks during Reg-SHO period, we also
conducted a placebo test by taking the pilot firms identified by SEC to a “pseudo Reg-SHO”
period, July 2003 that is one year before the official Reg-SHO period. Untabulated findings
indicate that the coefficients on PILOT DURSHO× in all three models are insignificant at the
10% level, which suggests our inferences in tables 2-4 are not driven by unobservable
confounding factors that coincide with the implementation Reg-SHO.
Impact of external financing on the effect of short selling
We also explore the potential influence of firms’ external financing needs on the effect of
short selling. Korajczyk et al. (1991) show that firms’ earnings news contains more good news
before SEO than after SEO, which is consistent with the finding of Asquith and Mullins (1986)
that there is on average a price run-up preceding equity issuance, suggesting that firms may
withhold bad news disclosure prior to equity issuance. Grullon et al. (2015) document that pilot
firms significantly reduce equity issuance during Reg-SHO and hence it is possible that reduced
withholding of bad news simply reflects the changes in the difference between pilot and control
34

firms’ equity issuance. We investigate this possibility by partitioning sample firms based on
whether firms issue equity in the year subsequent to disclosure/non-disclosure. Firms are
classified as equity issuers if they issue equity and non-equity issuers if they did not, as recorded
in Thomson Reuters’ SDC Platinum database.
Untabulated results show that our main findings—more likely and timelier disclosure of
bad news in pilot firms — hold in the subsample comprised of non-equity issuers, which
suggests our inferences in tables 2-4 are not driven by the documented changing trend in equity
issuance.
6. Conclusion
In this study, we investigate how short selling pressure affects firms’ voluntary disclosure
of bad news. As informed traders, short sellers enhance the informativeness of stock prices,
potentially decreasing the benefits and increasing the costs to managers from withholding and/or
delaying the release of bad news. In this study, we employ a quasi-natural experiment — the
relaxation of short selling constraints for a pilot group of firms under Reg-SHO — to investigate
this possibility. Relative to control firms, we observe a significant increase in the likelihood of
bad news management forecasts among the pilot firms. In addition, managers also provide these
forecasts in a more timely fashion. We also find that managers accelerate the release of quarterly
earnings news when the news is bad. We further find that Reg-SHO lifts the threshold of bad
news disclosure by encouraging more timely disclosure of moderately bad news. Additional
analyses reveal that the effect of Reg-SHO on bad news disclosure is more significant when
litigation risk is higher. A series of robustness test reinforce our main findings.
35

Overall, our results are consistent with short selling having real effects on corporate
disclosure decisions, and are of potential relevance to regulators in considering the likely effects
of regulated short-sales constraints.
36

References
Acharya, V.V., DeMarzo, P., Kremer, I., 2011. Endogenous Information Flows and the
Clustering of Announcements. The American Economic Review 101, 2955-2979.
Aitken, M.J., Frino, A., McCorry, M.S., Swan, P.L., 1998. Short sales are almost instantaneously
bad news: Evidence from the Australian Stock Exchange. The Journal of Finance 53, 2205-2223.
Ajinkya, B., Bhojraj, S., Sengupta, P., 2005. The association between outside directors,
institutional investors and the properties of management earnings forecasts. Journal of
accounting Research 43, 343-376.
Anilowski, C., Feng, M., Skinner, D.J., 2007. Does earnings guidance affect market returns? The
nature and information content of aggregate earnings guidance. Journal of Accounting and
Economics 44, 36-63.
Asquith, P., Mullins, D.W., 1986. Equity issues and offering dilution. Journal of Financial
Economics 15, 61-89.
Bagnoli, M., Kross, W., Watts, S.G., 2002. The information in management’s expected earnings
report date: A day late, a penny short. Journal of Accounting Research 40, 1275-1296.
Begley, J., Fischer, P.E., 1998. Is there information in an earnings announcement delay? Review
of accounting studies 3, 347-363.
Brown, N.C., Christensen, T.E., Elliott, W.B., 2012. The timing of quarterly ‘pro forma’earnings
announcements. Journal of Business Finance & Accounting 39, 315-359.
37

Brown, S., Hillegeist, S., Lo, K., 2005. Management forecasts and litigation risk. Sauder School
of Business Working Paper.
Bushee, B.J., Matsumoto, D.A., Miller, G.S., 2003. Open versus closed conference calls: the
determinants and effects of broadening access to disclosure. Journal of Accounting and
Economics 34, 149-180.
Cao, Z., Narayanamoorthy, G.S., 2011. The Effect of Litigation Risk on Management Earnings
Forecasts*. Contemporary Accounting Research 28, 125-173.
Chambers, A.E., Penman, S.H., 1984. Timeliness of reporting and the stock price reaction to
earnings announcements. Journal of accounting research, 21-47.
Chang, E.C., Lin, T.-C., Ma, X., 2014. Does Short Selling Discipline Managerial Empire
Building? Available at SSRN 2348193.
Chen, J., 2014. Lowball Guidance and Management’s Credibility. Available at SSRN 2363258.
Cheng, Q., Chen, X., Luo, T., Yue, H., 2014. Short sellers and corporate disclosures: European
Annual Meetings.
Christophe, S.E., Ferri, M.G., Angel, J.J., 2004. Short‐selling prior to earnings announcements.
The Journal of Finance 59, 1845-1876.
Christophe, S.E., Ferri, M.G., Hsieh, J., 2010. Informed trading before analyst downgrades:
Evidence from short sellers. Journal of Financial Economics 95, 85-106.
Cohen, D.A., Dey, A., Lys, T.Z., Sunder, S.V., 2007. Earnings announcement premia and the
limits to arbitrage. Journal of Accounting and Economics 43, 153-180.
38

Desai, H., Krishnamurthy, S., Venkataraman, K., 2006. Do short sellers target firms with poor
earnings quality? Evidence from earnings restatements. Review of Accounting Studies 11, 71-90.
Desai, H., Ramesh, K., Thiagarajan, S.R., Balachandran, B.V., 2002. An investigation of the
informational role of short interest in the Nasdaq market. The Journal of Finance 57, 2263-2287.
Diamond, D.W., Verrecchia, R.E., 1987. Constraints on short-selling and asset price adjustment
to private information. Journal of Financial Economics 18, 277-311.
Diether, K.B., Lee, K.-H., Werner, I.M., 2009a. Short-sale strategies and return predictability.
Review of financial Studies 22, 575-607.
Diether, K.B., Lee, K.H., Werner, I.M., 2009b. It's SHO Time! Short‐Sale Price Tests and
Market Quality. The Journal of Finance 64, 37-73.
Dye, R.A., 1985. Disclosure of nonproprietary information. Journal of accounting research 23,
123-145.
Fang, V.W., Huang, A., Karpoff, J., 2014. Short Selling and Earnings Management: A
Controlled Experiment. Available at SSRN 2286818.
Feng, M., Koch, A.S., 2010. Once bitten, twice shy: The relation between outcomes of earnings
guidance and management guidance strategy. The Accounting Review 85, 1951-1984.
Field, L., Lowry, M., Shu, S., 2005. Does disclosure deter or trigger litigation? Journal of
Accounting and Economics 39, 487-507.
Givoly, D., Palmon, D., 1982. Timeliness of annual earnings announcements: Some empirical
evidence. Accounting review, 486-508.
39

Graham, J.R., Harvey, C.R., Rajgopal, S., 2005. The economic implications of corporate
financial reporting. Journal of accounting and economics 40, 3-73.
Grullon, G., Michenaud, S., Weston, J., 2015. The real effects of short-selling constraints:
Review of financial studies Forthcoming.
He, J., Tian, X., 2014. Short Sellers and Innovation: Evidence from a Quasi-Natural Experiment.
Available at SSRN 2380352.
Heflin, F., Subramanyam, K., Zhang, Y., 2003. Regulation FD and the financial information
environment: Early evidence. The Accounting Review 78, 1-37.
Jung, W.-O., Kwon, Y.K., 1988. Disclosure when the market is unsure of information
endowment of managers. Journal of Accounting Research 26, 146-153.
Karpoff, J.M., Lou, X., 2010. Short sellers and financial misconduct. The Journal of Finance 65,
1879-1913.
Kasznik, R., Lev, B., 1995. To warn or not to warn: Management disclosures in the face of an
earnings surprise. Accounting review: A quarterly journal of the American Accounting
Association 70, 113-134.
Kim, I., Skinner, D.J., 2012. Measuring securities litigation risk. Journal of Accounting and
Economics 53, 290-310.
King, R., Pownall, G., Waymire, G., 1990. Expectations adjustment via timely management
forecasts: Review, synthesis, and suggestions for future research. Journal of accounting
Literature 9, 113-144.
40

Korajczyk, R.A., Lucas, D.J., McDonald, R.L., 1991. The effect of information releases on the
pricing and timing of equity issues. Review of financial studies 4, 685-708.
Kothari, S.P., Shu, S., Wysocki, P.D., 2009. Do managers withhold bad news? Journal of
Accounting Research 47, 241-276.
Kross, W.J., Suk, I., 2012. Does Regulation FD work? Evidence from analysts' reliance on
public disclosure. Journal of Accounting and Economics 53, 225-248.
Lang, M., Lundholm, R., 1993. Cross-sectional determinants of analyst ratings of corporate
disclosures. Journal of accounting research, 246-271.
Lang, M.H., Lundholm, R.J., 1996. Corporate disclosure policy and analyst behavior.
Accounting review, 467-492.
Li, Y., Zhang, L., 2015. Short Selling Pressure, Stock Price Behavior, and Management Forecast
Precision: Evidence from a Natural Experiment. Journal of Accounting Research 53, 79-117.
Massa, M., Zhang, B., Zhang, H., 2013. The Invisible Hand of Short Selling: Does Short Selling
Discipline Earnings Manipulation?: Working paper.
Miller, G.S., 2002. Earnings performance and discretionary disclosure. Journal of Accounting
Research 40, 173-204.
Rogers, J.L., Van Buskirk, A., 2009. Shareholder litigation and changes in disclosure behavior.
Journal of Accounting and Economics 47, 136-156.
Rogers, J.L., Van Buskirk, A., 2013. Bundled forecasts in empirical accounting research. Journal
of Accounting and Economics 55, 43-65.
41

Senchack, A.J., Starks, L.T., 1993. Short-sale restrictions and market reaction to short-interest
announcements. Journal of Financial and quantitative analysis 28, 177-194.
Skinner, D.J., 1994. Why firms voluntarily disclose bad news. Journal of accounting research,
38-60.
Skinner, D.J., 1997. Earnings disclosures and stockholder lawsuits. Journal of Accounting and
Economics 23, 249-282.
Skinner, D.J., 2003. Should firms disclose everything to everybody? A discussion of “Open vs.
closed conference calls: the determinants and effects of broadening access to disclosure”. Journal
of Accounting and Economics 34, 181-187.
Trueman, B., 1997. Managerial disclosures and shareholder litigation. Review of Accounting
Studies 2, 181-199.
Verrecchia, R.E., 1983. Discretionary disclosure. Journal of accounting and economics 5, 179-
194.
Verrecchia, R.E., 2001. Essays on disclosure. Journal of Accounting and Economics 32, 97-180.
Waymire, G., 1985. Earnings volatility and voluntary management forecast disclosure. Journal of
Accounting Research, 268-295.
42

Appendix 1: Variable Definitions BADNEWS = an indicator variable equal to 1 if there is at least one management forecast less
than the consensus of analyst forecasts at the time of announcement for each fiscal period and 0 otherwise; GOODNEWS = an indicator variable equal to 1 if there is at least one management forecast greater than the consensus of analyst forecasts at the time of announcement for each fiscal period and 0 otherwise; MF_HORIZON_BAD = the number of days between the forecast date and the end date of a fiscal period being forecasted (conditional on BADNEWS=1);
MF_HORIZON_GOOD=
the number of days between the forecast date and the end date of a fiscal period being forecasted (conditional on GOODNEWS=1);
ER_ANN_DELAY = the firm's deviation from its expected announcement date, assumed to be the same as the reporting lag in days for the corresponding quarter of year t-1;
SIZE = logarithm of the market value of equity at the beginning of a fiscal quarter; MTB = ratio of market value of equity to book value at the beginning of a fiscal quarter; ROA = earnings before extraordinary items scaled by lagged total assets in current
quarter; LNANALYST = logarithm of one plus analyst following, computed at the beginning of a fiscal
quarter; CRET = market adjusted daily returns over the previous quarter, computed at the
beginning of a fiscal quarter; RETVOLATILITY = standard deviation of market adjusted daily returns over past quarter, computed
at the beginning of a fiscal quarter; RD = research and development expenditures scaled by total asset, computed at the
beginning of a fiscal quarter; INSTITUTION = percentage of institutional ownership over outstanding shares over past quarter,
computed at the beginning of a fiscal quarter. If missing institution data, 0 will be assigned; MF_D = an indicator variable equal to 1 if a management forecast was issued in the previous quarter and 0 otherwise;
HILIRI = an indicator variable equal to 1 if a firm’s industry code SICC falls into any of the following range. (2833,2836), (3570, 3577), (3600, 3674), (5200 5961), (7371, 7379) or (8731, 8734) and 0 otherwise;
FE = analyst forecast error, computed as the difference between actual EPS and analyst consensus of forecasts at the time of earnings announcement;
NEG_FE_D = an indicator variable equal to 1 if actual EPS minus analyst consensus of forecasts is negative and 0 otherwise; EPS_LOSS_D = an indicator variable equal to 1 if actual EPS is negative and 0 otherwise;
STDROA = standard deviation of returns on assets over at least three of the previous eight quarters, computed at the beginning of the quarter;
SPECIAL_D = an indicator variable equal to 1 if the firm reports non-zero special items in quarter q and 0 otherwise;
GUIDANCE_D = an indicator variable equal to 1 for those firm-quarters with at least one outstanding management earnings forecast as of the earnings announcement date based on the I/B/E/S guidance feed database and 0 otherwise.
43

TABLE 1
Descriptive statistics Panel A: Summary statistics of sample firms before Reg-SHO announcement Pilot group Control group Test for difference (pilot-control) # obs. Mean Median Std. Dev. # obs. Mean Median Std. Dev. t-value Wilcoxon z-stat BADNEWS 3626 0.22 0.00 0.41 7187 0.22 0.00 0.42 -0.68 -0.68 MF_HORIZON_BAD 786 32.70 42.00 20.25 1599 34.16 43.00 19.96 -1.70 -1.96 ER_ANN_DELAY 3643 0.04 -1.00 4.16 7180 -0.26 -1.00 4.34 3.42 2.44 SIZE 3626 6.92 6.68 1.50 7187 6.83 6.61 1.44 3.24 3.22 MTB 3626 3.36 2.28 3.60 7187 3.23 2.28 3.70 1.70 1.72 ROA 3626 0.01 0.01 0.04 7187 0.01 0.01 0.04 1.64 2.73 LNANALYST 3626 1.59 1.61 0.67 7187 1.59 1.61 0.64 0.25 0.34 CRET 3625 0.01 0.00 0.11 7185 0.01 0.00 0.11 0.36 0.67 RETVOLATILITY 3625 0.02 0.02 0.01 7184 0.02 0.02 0.01 -2.90 -2.37 RD 3504 0.02 0.00 0.02 6904 0.01 0.00 0.02 0.08 -2.08 INSTITUTION 3626 0.57 0.64 0.32 7187 0.57 0.65 0.33 0.21 -0.75 MF_D 3590 0.12 0.00 0.32 7057 0.12 0.00 0.32 0.35 0.35 HILIRI 3626 0.32 0.00 0.47 7187 0.34 0.00 0.47 2.12 -2.04 FE 3268 0.06 0.04 0.70 6407 0.07 0.04 0.86 -1.02 -2.08 NEG_FE_D 3643 0.24 0.00 0.43 7180 0.23 0.00 0.42 0.83 -0.83 EPS_LOSS_D 3643 0.16 0.00 0.37 7180 0.17 0.00 0.38 -1.44 1.44 STDROA 3643 0.02 0.01 0.03 7180 0.02 0.01 0.04 -4.34 -5.15 SPECIAL_D 3643 0.99 1.00 0.08 7180 0.99 1.00 0.10 1.75 1.75 GUIDANCE_D 3643 0.35 0.00 0.48 7180 0.35 0.00 0.48 -0.15 0.16
44

Panel B: Summary statistics of sample firms during Reg-SHO announcement Pilot group Control group Test for difference (pilot-control) # obs. Mean Median Std. Dev. # obs. Mean Median Std. Dev. t-value Wilcoxon z-stat BADNEWS 4541 0.24 0.00 0.43 9020 0.22 0.00 0.42 1.86 1.87 MF_HORIZON_BAD 1076 37.48 42.00 16.27 2009 36.36 43.00 17.54 1.76 -0.68 ER_ANN_DELAY 4594 1.03 0.00 4.59 9143 1.04 0.00 4.39 -0.17 0.03 SIZE 4541 7.35 7.15 1.47 9020 7.23 7.06 1.45 4.52 4.08 MTB 4541 3.43 2.64 3.14 9020 3.61 2.70 3.72 -2.81 -1.58 ROA 4541 0.01 0.01 0.04 9020 0.01 0.01 0.04 1.98 2.56 LNANALYST 4541 1.75 1.79 0.64 9020 1.75 1.79 0.65 0.69 -0.52 CRET 4541 0.00 0.00 0.09 9018 0.00 0.00 0.09 -0.94 -1.05 RETVOLATILITY 4541 0.02 0.02 0.01 9018 0.02 0.02 0.01 -2.16 -2.94 RD 4396 0.01 0.00 0.02 8738 0.01 0.00 0.02 -3.60 3.36 INSTITUTION 4541 0.66 0.77 0.33 9020 0.67 0.77 0.33 -0.99 1.17 MF_D 4538 0.34 0.00 0.48 9017 0.35 0.00 0.48 -0.85 0.85 HILIRI 4541 0.32 0.00 0.47 9020 0.33 0.00 0.47 -1.76 1.76 FE 4194 0.01 0.04 0.86 8364 0.04 0.05 0.94 -1.92 -2.51 NEG_FE_D 4594 0.28 0.00 0.45 9143 0.27 0.00 0.45 1.33 1.33 EPS_LOSS_D 4594 0.14 0.00 0.34 9143 0.15 0.00 0.36 -2.15 2.15 STDROA 4594 0.02 0.01 0.02 9143 0.02 0.01 0.02 -2.90 1.92 SPECIAL_D 4594 0.99 1.00 0.10 9143 0.99 1.00 0.11 0.37 0.37 GUIDANCE_D 4594 0.35 0.00 0.48 9143 0.34 0.00 0.48 0.70 0.70
45

The sample is comprised of firm-quarters before the announcement of Reg-SHO (12/01/2002 - 07/28/2004) in Panel A and during the implementation of Reg-SHO (05/02/2005-07/06/2007) in Panel B. The Pilot group is comprised of the Russell 3000 components that are on the pilot list of Reg-SHO in June 2004. The Control group is comprised of all other components on the Russell 3000. Mean differences from zero in variables between pilot and control groups (assumed independent samples) are tested using two-sample t-tests (unpaired) and Wilcoxon Ranksum test.
Variable Definitions: BADNEWS = an indicator variable equal to 1 if there is at least one management forecast less than the consensus of analyst forecasts at
the time of announcement for each fiscal period and 0 otherwise; MF_HORIZON_BAD = the number of days between the forecast date and the end date of a fiscal period being forecasted;
ER_ANN_DELAY = the firm's deviation from its expected announcement date, assumed to be the same as the reporting lag in days for the corresponding quarter of year t-1;
SIZE = logarithm of the market value of equity at the beginning of a fiscal quarter; MTB = ratio of market value of equity to book value at the beginning of a fiscal quarter; ROA = earnings before extraordinary items scaled by lagged total assets in current quarter;
LNANALYST = logarithm of one plus analyst following, computed at the beginning of a fiscal quarter; CRET = market adjusted daily returns over the previous quarter, computed at the beginning of a fiscal quarter;
RETVOLATILITY = standard deviation of market adjusted daily returns over past quarter, computed at the beginning of a fiscal quarter; RD = research and development expenditures scaled by total asset, computed at the beginning of a fiscal quarter;
INSTITUTION = percentage of institutional ownership over outstanding shares over past quarter, computed at the beginning of a fiscal quarter. If missing institution data, 0 will be assigned; MF_D = an indicator variable equal to 1 if a management forecast was issued in the previous quarter and 0 otherwise;
HILIRI = an indicator variable equal to 1 if a firm’s industry code SICC falls into any of the following range. (2833,2836), (3570, 3577), (3600, 3674), (5200 5961), (7371, 7379) or (8731, 8734) and 0 otherwise;
FE = analyst forecast error, computed as the difference between actual EPS and analyst consensus of forecasts at the time of earnings announcement;
NEG_FE_D = an indicator variable equal to 1 if actual EPS minus analyst consensus of forecasts is negative and 0 otherwise; EPS_LOSS_D = an indicator variable equal to 1 if actual EPS is negative and 0 otherwise;
STDROA = standard deviation of returns on assets over at least three of the previous eight quarters, computed at the beginning of the quarter;
SPECIAL_D = an indicator variable equal to 1 if the firm reports non-zero special items in quarter q and 0 otherwise; GUIDANCE_D = an indicator variable equal to 1 for those firm-quarters with at least one outstanding management earnings forecast as of
the earnings announcement date based on the I/B/E/S guidance feed database and 0 otherwise.
46

TABLE 2 Effect of short selling on the likelihood of bad news forecasts
BADNEWS Predicted sign
Full sample MF bad news above
median
MF bad news below
median (1) (2) (3) (4) (5) INTERCEPT -1.25*** -2.45*** -2.28*** -3.82*** -1.78** PILOT -0.03 -0.04 -0.05 -0.05 -0.10 DURSHO 0.00 -0.27** POSTSHO -0.05 -0.19 PILOT×DURSHO + (H1) 0.12** 0.13*** 0.15*** 0.22*** 0.13 PILOT×POSTSHO 0.13 0.11* 0.12* 0.15* 0.17 SIZE -0.00 0.01 0.15*** -0.16*** LNANALYST 0.15*** 0.20*** 0.17*** 0.24*** MTB -0.01 -0.01 0.00 -0.04*** ROA -1.70*** -2.05*** 0.78 -3.59*** CRET -0.67*** -0.58** -0.18 -1.06*** RETVOLATILITY -9.81*** -12.89*** -16.65*** -12.16*** RD -3.84*** -3.34** -1.57 -3.86** INSTITUTION 0.13 0.09 0.22** 0.06 EPS_LOSS_D 0.07 0.09 -1.04*** 0.34*** HILIRI 0.12** -0.07 -0.09 -0.09 MF_D 2.72*** 2.65*** 2.59*** 2.45*** Industry fixed
No No Yes Yes Yes
Quarter/year fixed
No No Yes Yes Yes # of obs. 34796 33635 33615 30188 30535 Pseudo R-sq <0.01 0.26 0.28 0.31 0.24
This table presents the effect of short selling on the likelihood of bad news forecasts. Dependent variable: management bad news forecasts, BADNEWS, estimated by logit model with/without a set of controls, respectively. The sample period is pre Reg-SHO (PRESHO), during SHO implementation (DURSHO) and post SHO implementation (POSTSHO). Column (1) , (2) and (3), BADNEWS is defined as one if there is at least one management forecast less than the consensus of analyst forecasts at the time of announcement for each fiscal period and zero otherwise. Column (4) / (5), BADNEWS is defined as one if the BADNEWS is above / below the median of BADNEWS (scaled by firm stock price at the beginning ot the quarter) cross all firms in current quarter and zero if there is no bad news forecast. ***, ** and * indicate significance of coefficient at 1%, 5% and 10% levels, respectively, based on firm and year-quarter clustered standard errors. The appendix contains the variable definitions.
47

TABLE 3 Effect of short selling on the horizon of bad news management forecasts
MF_HORIZON_BAD
Predicted sign
Full sample MF bad news above
median
MF bad news below
median (1) (2) (3) (4) (5) INTERCEPT 34.21*** 20.21*** 3.95* 23.24*** -6.42 PILOT -1.50* -1.80** -1.85** -2.77** -2.09 DURSHO 2.12 -0.87
POSTSHO 3.60* 1.03 PILOT×DURSHO + (H2) 2.65*** 2.23** 2.34** 2.73** 2.63
PILOT×POSTSHO 1.39 1.46 1.03 2.43* 0.16 SIZE 0.79*** 1.19*** 0.93*** 0.73 LNANALYST
0.48 -0.46 -1.20** -0.29
MTB
0.25*** 0.24*** 0.27*** 0.08 ROA
-3.72 3.89 3.68 -0.75
CRET
1.37 -0.12 -0.14 -1.45 RETVOLATILITY
-50.17 -27.54 -85.44* 12.99
RD
99.21*** 72.24*** 41.79** 94.29*** INSTITUTION
-0.94 -0.63 0.68 -2.36***
EPS_LOSS_D
5.70*** -4.98*** -3.20 -4.42*** HILIRI
0.50 0.85 1.45 -0.70
MF_D
12.58*** 10.91*** 5.59*** 11.16*** Industry fixed effects No No Yes Yes Yes Quarter/year fixed
No No Yes Yes Yes # of obs. 34796 33635 33615 30188 30535 R-sq <0.01 0.26 0.28 0.31 0.24
This table presents the effect of short selling on the horizon of bad news management forecast. Dependent variable: management bad news forecast horizon, MF_HORIZON_BAD, the number of days between the forecast date and the end date of a fiscal period being forecasted. MF_HORIZON_BAD is estimated by OLS model. Column (1), (2) and (3), bad news is defined as one if there is at least one management forecast less than the consensus of analyst forecasts at the time of announcement for each fiscal period and zero otherwise. Column (4) and (5), Column (4) / (5), bad news is defined as one if the bad news is above / below the median of bad news (scaled by firm stock price at the beginning of the quarter) cross all firms in a quarter and zero if there is no bad news forecast. The sample period is before SHO announcement (PRESHO), during SHO enforcement (DURSHO) and post SHO implementation (POSTSHO). ***, ** and * indicate significance of coefficient at 1%, 5% and 10% levels, respectively, based on firm and year-quarter clustered standard errors. The appendix contains the variable definitions.
48

TABLE 4 Effect of short selling on the timing of earnings announcements
ER_ANN_DELAY
Predicted sign
Full sample SUE<0
SUE>=0
(1) (2) (3) (4) (5) INTERCEPT -0.19*** -1.05*** -0.28 1.29*** -1.10** PILOT 0.28*** 0.29*** 0.27*** 0.55** 0.17** DURSHO 1.12*** 1.09***
POSTSHO -0.12 -0.12 PILOT×DURSHO - (H3) -0.31** -0.35*** -0.33*** -0.74** -0.17
PILOT×POSTSHO -0.14 -0.16 -0.15 -0.53* 0.01 FE -0.03 -0.02 -0.07* 0.02 NEG_FE_D
0.31*** 0.39*** 0.00 0.00
EPS_LOSS_D
0.25** 0.21* 0.11 0.19 SIZE
0.04 0.04* -0.09*** 0.09***
MTB
-0.03*** -0.03*** -0.04*** -0.02* ROA
-2.87*** -3.07*** -2.15* -3.95***
INSTITUTION
0.02 0.01 0.15 0.01 STDROA
-2.08*** -2.22*** -3.66*** -1.89***
SPECIAL_D
-0.02 -0.02 -0.10 0.09 GUIDANCE_D
0.09* 0.13** 0.04 0.14***
Industry fixed
No No Yes Yes Yes
Quarter/year fixed
No No Yes Yes Yes # of obs. 34471 33711 33711 9924 23787 R-sq 0.02 0.03 0.03 0.04 0.03
This table presents the effect of short selling on the timing of earnings announcements. Dependent variable: earnings announcement delay, ER_ANN_DELAY, estimating the firm's deviation from its expected announcement timing (assumed to be the same as the reporting lag in trading days for the corresponding quarter of year t-1). Full sample is used without (with) controls in column 1 (2 and 3). In column 4 (5), the full sample is partitioned into good (bad earnings news), based upon standardized unexpected earnings (SUE), computed as the difference between actual EPS and analyst consensus just before earnings announcement, scaled by stock price in the beginning of a quarter. All regressions are estimated by OLS model. The sample period is prior SHO announcement ( PRESHO ) and during SHO enforcement ( DURSHO ) and post SHO implementation (POSTSHO). ***, ** and * indicate significance of coefficient at 1%, 5% and 10% levels, respectively, based on firm and year-quarter clustered standard errors. The appendix contains the variable definitions.
49
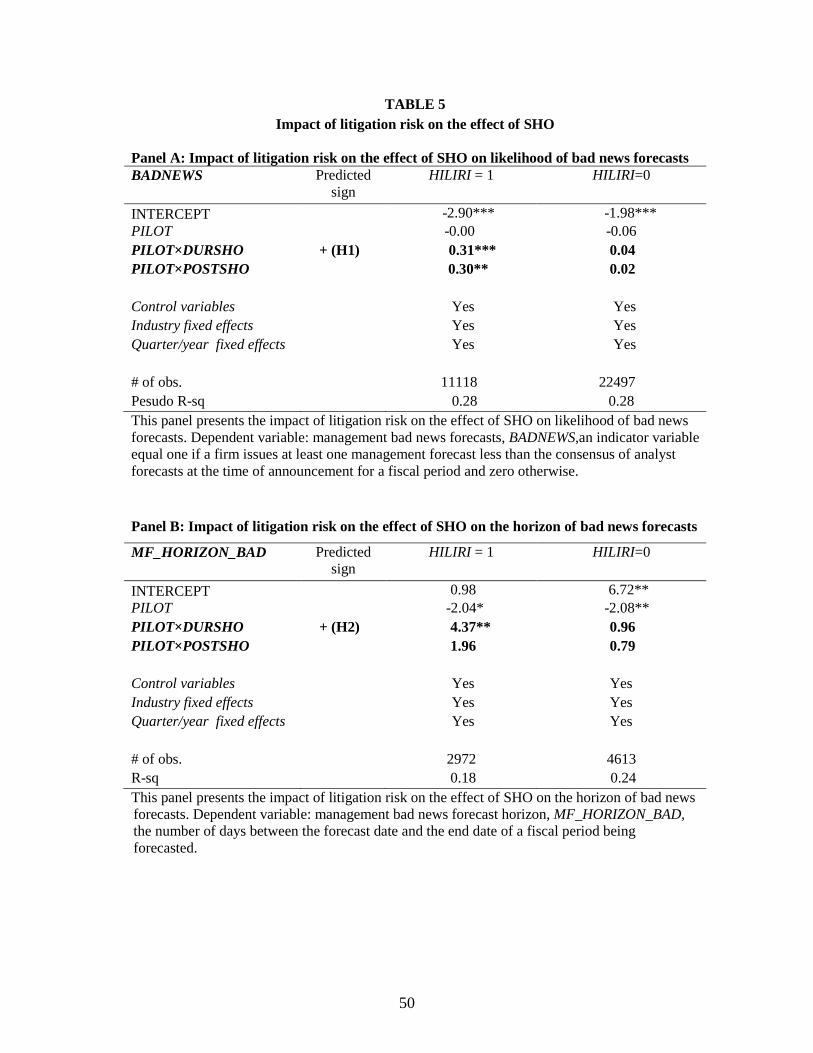
TABLE 5 Impact of litigation risk on the effect of SHO
Panel A: Impact of litigation risk on the effect of SHO on likelihood of bad news forecasts BADNEWS
Predicted sign
HILIRI = 1
HILIRI=0
INTERCEPT -2.90*** -1.98*** PILOT -0.00 -0.06 PILOT×DURSHO + (H1) 0.31*** 0.04 PILOT×POSTSHO 0.30** 0.02
Control variables Yes Yes Industry fixed effects Yes Yes Quarter/year fixed effects
Yes Yes # of obs. 11118 22497 Pesudo R-sq 0.28 0.28 This panel presents the impact of litigation risk on the effect of SHO on likelihood of bad news forecasts. Dependent variable: management bad news forecasts, BADNEWS,an indicator variable equal one if a firm issues at least one management forecast less than the consensus of analyst forecasts at the time of announcement for a fiscal period and zero otherwise.
Panel B: Impact of litigation risk on the effect of SHO on the horizon of bad news forecasts
MF_HORIZON_BAD Predicted sign
HILIRI = 1
HILIRI=0
INTERCEPT 0.98 6.72** PILOT -2.04* -2.08** PILOT×DURSHO + (H2) 4.37** 0.96 PILOT×POSTSHO 1.96 0.79
Control variables Yes Yes Industry fixed effects Yes Yes Quarter/year fixed effects
Yes Yes # of obs. 2972 4613 R-sq 0.18 0.24 This panel presents the impact of litigation risk on the effect of SHO on the horizon of bad news forecasts. Dependent variable: management bad news forecast horizon, MF_HORIZON_BAD, the number of days between the forecast date and the end date of a fiscal period being forecasted.
50
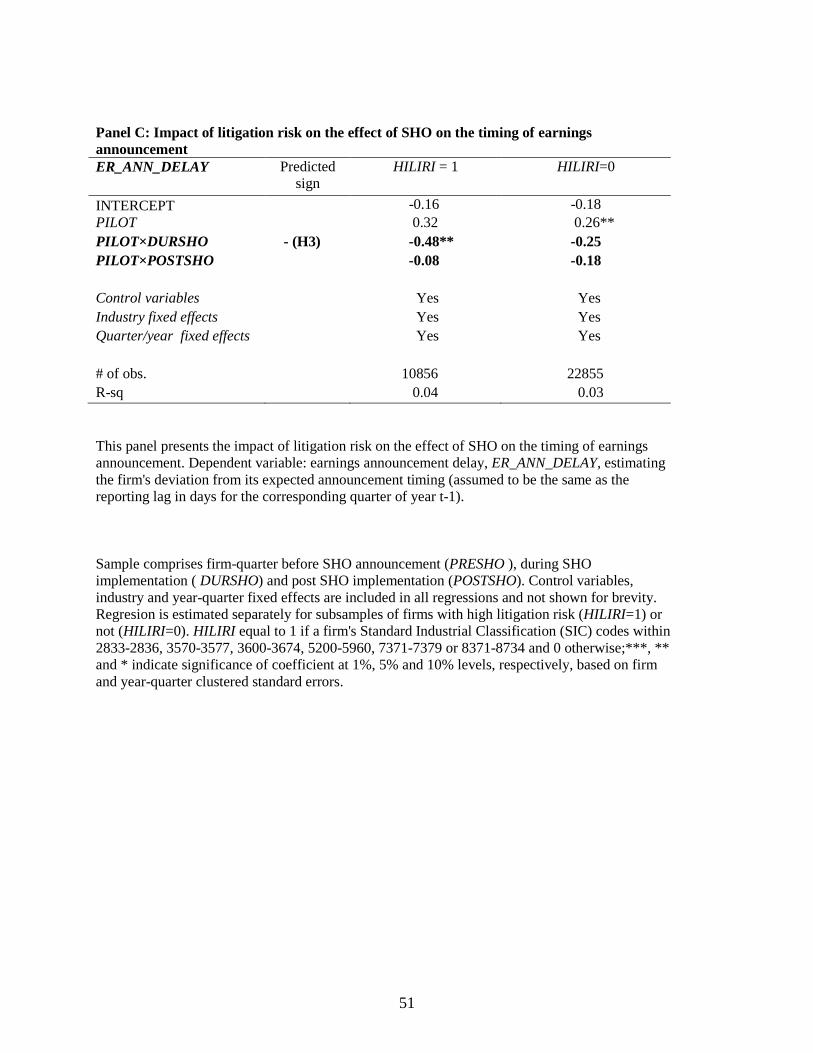
Panel C: Impact of litigation risk on the effect of SHO on the timing of earnings announcement ER_ANN_DELAY Predicted
sign HILIRI = 1
HILIRI=0
INTERCEPT -0.16 -0.18 PILOT 0.32 0.26** PILOT×DURSHO - (H3) -0.48** -0.25 PILOT×POSTSHO -0.08 -0.18
Control variables Yes Yes Industry fixed effects Yes Yes Quarter/year fixed effects
Yes Yes # of obs. 10856 22855 R-sq 0.04 0.03
This panel presents the impact of litigation risk on the effect of SHO on the timing of earnings announcement. Dependent variable: earnings announcement delay, ER_ANN_DELAY, estimating the firm's deviation from its expected announcement timing (assumed to be the same as the reporting lag in days for the corresponding quarter of year t-1). Sample comprises firm-quarter before SHO announcement (PRESHO ), during SHO implementation ( DURSHO) and post SHO implementation (POSTSHO). Control variables, industry and year-quarter fixed effects are included in all regressions and not shown for brevity. Regresion is estimated separately for subsamples of firms with high litigation risk (HILIRI=1) or not (HILIRI=0). HILIRI equal to 1 if a firm's Standard Industrial Classification (SIC) codes within 2833-2836, 3570-3577, 3600-3674, 5200-5960, 7371-7379 or 8371-8734 and 0 otherwise;***, ** and * indicate significance of coefficient at 1%, 5% and 10% levels, respectively, based on firm and year-quarter clustered standard errors.
51

TABLE 6 Effect of short selling on the likelihood and horizon of good news forecasts
Prob(GOODNEWS=1) MF_HORIZON_GOOD (1) (2) (3) (4) (5) (6)
INTERCEPT -1.79*** -3.34*** -4.27*** 30.76*** 18.15*** 5.83 PILOT 0.07 0.09 0.07 0.53 0.61 -0.03 DURSHO -0.21* -0.44***
3.76 1.19
POSTSHO -0.37*** -0.50***
2.98 -0.18 PILOT×DURSHO -0.06 -0.10 -0.13 -1.39 -1.86 -1.00 PILOT×POSTSHO -0.08 -0.15 -0.14 -1.57 -1.02 -1.57 SIZE -0.02 0.01 0.07 0.90* LNANALYST
0.19*** 0.18***
1.29 -0.28
MTB
-0.02** -0.02***
0.19 0.16 ROA
10.49*** 9.47***
15.13 36.00
CRET
1.32*** 1.43***
7.09** 5.17* RETVOLATILITY
3.11 3.31*
-64.67 -18.23
RD
0.52 0.16
228.75*** 76.29*** INSTITUTION
0.08 0.05
1.75 1.99*
EPS_LOSS_D
-0.85*** -0.87***
-2.27 -0.42 HILIRI
0.49*** 0.15*
-2.00** 0.70
MF_D
2.29*** 2.21***
11.60*** 9.55*** Industry fixed
No No Yes No No Yes
Quarter/year fixed
No No Yes No No Yes # of obs.
34790 33629 33525 4278 4188 4188 Pseudo R-sq/R-sq <0.01 0.22 0.23 0.01 0.09 0.21 This table presents the effect of short selling on the likelihood and horizon of good news forecasts. Dependent variables: management good news forecast, GOODNEWS, estimated by logit model with/without a set of controls, respectively. Management good news forecast horizon, MF_HORIZON_GOOD, the number of days between the forecast date and the end date of a fiscal period being forecasted. MF_HORIZON_GOOD is estimated by OLS model. The sample period is pre Reg-SHO (PRESHO), during SHO implementation (DURSHO) and post SHO implementation (POSTSHO). GOODNEWS is defined as one if there is at least one management forecast greater than the consensus of analyst forecasts at the time of announcement for each fiscal period and zero otherwise. ***, ** and * indicate significance of coefficient at 1%, 5% and 10% levels, respectively, based on firm and year-quarter clustered standard errors. The appendix contains the variable definitions.
52