Short Sale Constraints, Dispersion of Opinion, and … Sale Constraints, Dispersion of Opinion, and...
46
Short Sale Constraints, Dispersion of Opinion, and Market Quality: Evidence from the Short Sale Ban on U.S. Financial Stocks Don M. Autore Florida State University Randall S. Billingsley Virginia Tech Tunde Kovacs Virginia Tech Northeastern University June 2009 ABSTRACT The three-week ban on short selling during 2008 for nearly 800 U.S. financial stocks provides an opportunity to directly test how binding short sale constraints affect stock valuation. We focus on the relative valuation effects of the ban on stocks with higher vs. lower dispersion of investor opinion and stocks that experience greater vs. smaller deterioration in market quality. First, we find that the initiation of the ban is associated with abnormal price increases that continue even after the ban. Second, valuation increases are significantly more pronounced for stocks associated with greater dispersion of opinion. However, after the ban is removed, this dispersion effect disappears. Third, the ban is associated with large increases in relative quoted spreads and decreases in the average number of trades per day, consistent with a reduction in market quality. Finally, the banned stocks that face the greatest widening in their spread experience weaker abnormal stock performance during and after the ban. In summary, the dispersion-related findings support Miller’s (1977) argument that high dispersion stocks become overvalued under binding short sale constraints. The spread-related findings suggest that short sellers are viewed as informed investors. In the absence of short sellers, investors demand higher risk premiums to reflect the increased uncertainty about the stock’s value. From a policy standpoint, the actions of the Securities and Exchange Commission might have curbed excessive price declines for troubled firms without lasting differential valuation consequences for higher vs. lower dispersion stocks. However, these policy actions had severe market quality consequences. (JEL G12, G14, G18, G28)
Transcript of Short Sale Constraints, Dispersion of Opinion, and … Sale Constraints, Dispersion of Opinion, and...

Short Sale Constraints, Dispersion of Opinion, and Market Quality: Evidence from the Short Sale Ban on U.S. Financial Stocks
Don M. Autore Florida State University
Randall S. Billingsley
Virginia Tech
Tunde Kovacs Virginia Tech
Northeastern University
June 2009
ABSTRACT The three-week ban on short selling during 2008 for nearly 800 U.S. financial stocks provides an opportunity to directly test how binding short sale constraints affect stock valuation. We focus on the relative valuation effects of the ban on stocks with higher vs. lower dispersion of investor opinion and stocks that experience greater vs. smaller deterioration in market quality. First, we find that the initiation of the ban is associated with abnormal price increases that continue even after the ban. Second, valuation increases are significantly more pronounced for stocks associated with greater dispersion of opinion. However, after the ban is removed, this dispersion effect disappears. Third, the ban is associated with large increases in relative quoted spreads and decreases in the average number of trades per day, consistent with a reduction in market quality. Finally, the banned stocks that face the greatest widening in their spread experience weaker abnormal stock performance during and after the ban. In summary, the dispersion-related findings support Miller’s (1977) argument that high dispersion stocks become overvalued under binding short sale constraints. The spread-related findings suggest that short sellers are viewed as informed investors. In the absence of short sellers, investors demand higher risk premiums to reflect the increased uncertainty about the stock’s value. From a policy standpoint, the actions of the Securities and Exchange Commission might have curbed excessive price declines for troubled firms without lasting differential valuation consequences for higher vs. lower dispersion stocks. However, these policy actions had severe market quality consequences. (JEL G12, G14, G18, G28)

Short Sale Constraints, Dispersion of Opinion, and Market Quality:
Evidence from the Short Sale Ban on U.S. Financial Stocks 1. Introduction
How do short sale constraints affect security prices? Long debated by financial
researchers, this question is of particular importance today. The Securities and Exchange
Commission (SEC) adopted extraordinary measures during the recent financial crisis,
banning the short selling of 797 financial stocks for the 14 trading days from September
19th through October 8th of 2008.1 The ban was intended to prevent speculators from
placing excessive downward pressure on the stocks of already troubled financial firms. In
its emergency order to ban short selling in financial stocks (Release No. 34-58592/
September 18, 2008), the SEC states:
Recent market conditions have made us concerned that short selling in the securities of a wider range of financial institutions may be causing sudden and excessive fluctuations of the prices of such securities in such a manner so as to threaten fair and orderly markets. … [W]e have become concerned about recent sudden declines in the prices of a wide range of securities. Such price declines can give rise to questions about the underlying financial condition of an issuer, which in turn can create a crisis of confidence, without a fundamental underlying basis.2
The crisis also triggered calls in the U.S. Congress to re-examine the current short
sale trading rules. The SEC has adopted permanent rules banning naked short selling,
enhanced reporting requirements for short sellers, and is currently considering
amendments to Regulation SHO that include the introduction of market-wide uptick rules
1 In an amendment to the order the SEC gave authority to the exchanges to add additional stocks to the banned list. Altogether, over 1,000 stocks were brought under the ban within several days of the order. 2 Similarly, in its earlier temporary ban of naked shorting in 19 securities (Release No. 58166 / July 15, 2008), the SEC cites the cause for action as desiring to limit speculative rumors that are detrimental to the targeted corporations. On September 18, 2008, the SEC instituted a permanent ban on naked short selling for all U.S. securities.
1

and various short sale circuit breakers to be triggered when a stock’s price falls
significantly.3 Informed policy-making should take into consideration the lessons offered
by the SEC’s short sale ban implemented in the fall of 2008. The current paper seeks to
provide empirical evidence on the effects of this event.
The purpose of this study is to use the short sale ban as a laboratory to test how short
sale constraints affect the cross-section of banned stocks. In particular, we seek to answer
two questions. The first question probes Miller’s (1977) hypothesis concerning the cross-
section of stock returns: Do stocks with greater dispersion of opinion become more
overvalued under binding short sale constraints? The second question examines changes
in market quality brought about by the absence of short sellers: Are there cross-sectional
differences in the change in market quality, and if so, how do these differences affect
relative valuations? The short sale ban is an ideal setting for both of these tests because it
provides a binding constraint.4 Therefore, the researcher does not have to rely on
measuring short sale supply and demand to determine when short sale constraints bind, as
is often the case in previous studies.
Miller (1977) provides a framework for examining the effect of short sale constraints
on equity prices. He argues that the combination of binding short sale constraints and
differences of opinion among investors results in share price overvaluation. This is
because security prices are determined by the consensus opinion of participating
investors. If bearish investors are excluded from the market by binding short sale
constraints, the distribution of opinions is truncated from below and the consensus
3 SEC proposed rule: Amendments to Regulation SHO; Release No. 34-59748; File No. S7-08-09 http://sec.gov/rules/proposed/2009/34-59748.pdf. 4 The only exception to the ban is for short selling by bona fide market makers and short selling as a result of exercising derivatives positions. The latter is presumably due to the ban period coinciding with option expiration dates.
2

opinion necessarily becomes more optimistic. The extent of overvaluation increases with
greater disagreement among investors because excluding the most pessimistic part of a
more dispersed distribution increases the expected return of the distribution. This inflates
equity values beyond their fair value.
The second channel through which short sale constraints can affect stocks is by
altering the informativeness of prices. If short sellers are informed traders and contribute
to price discovery, their absence could increase market uncertainty, increase trading
spreads, and lower prices.5 Alternatively, if short sellers are primarily liquidity providers,
their absence could lead to less liquidity, an increased number of informed investors in
the market, and wider trading spreads, all without compromising the informativeness of
prices. Both of these hypotheses predict a widening of spreads and reduced liquidity as
the number of investors in the market falls. There is, however, an important distinction
between these two hypotheses. If the average short seller is more informed than the
average investor, we expect that greater deterioration of market quality corresponds to
lower stock returns due to increased uncertainty and the resulting increased risk premium
demanded. Alternatively, if short sellers are not informed traders, no such cross-sectional
relation is expected.
Because the ban is industry-concentrated, assessing aggregate valuation changes of
the short sale-banned sample by comparing returns to benchmark firms outside the
financial sector presents a joint hypothesis. Thus, any differences in returns could be
driven by industry effects, irrespective of the ban. To mitigate such concerns about the
measurement of relative valuations, our hypotheses and our empirical analysis focus on
5 For example, see Boehmer, Huszar, Jordan (2009).
3

testing for valuation differences across firms (based on dispersion of opinion and the
deterioration in market quality) within the sample of short sale-banned stocks.
Specifically, we calculate abnormal stock returns using the Fama-French (1992)
three-factor portfolio approach and regress abnormal returns in the cross-section of
banned firms on proxies derived from our hypotheses. We measure dispersion of opinion
using the security’s residual standard deviation and analyst forecast dispersion. Market
quality is measured using the relative quoted spread. We estimate regressions including
both dispersion of opinion and trading spread as independent variables because Miller’s
(1977) hypothesis and the stock price informativeness hypotheses are not mutually
exclusive.
The period of study is not representative of ordinary market conditions. During the
three weeks of the ban, the overall market exhibited a -16.23% return, while banned firms
generally experienced a -9.74% return. Interestingly, banned firms have positive
abnormal returns at the initiation of the ban (1.82% and 2.70%, respectively on
September 18th and 19th)6 and throughout the banned period (5.28% from September 18th
to October 8th), negative abnormal returns on the day after the ban is removed (-2.01%),
but slightly positive abnormal returns in the three weeks subsequent to the ban (1.30%).
Thus, there is no return reversal in the post-ban period. This suggests that the ban (or the
financial bailout-related events of these weeks) might have had a lasting effect on the
average financial stock’s valuation. Further, banned firms experience significant
decreases in market quality – as evidenced by widening bid-ask spreads – after the
initiation of the ban and little improvement in quality after the ban expires. For example,
6 Although the ban started on September 19th, there is reason to believe that investors might have anticipated the ban after learning of a similar ban initiated in the United Kingdom on September 18th at 1:00 pm EST.
4

relative quoted spreads of affected stocks average 3.06% during the three weeks prior to
the ban, 4.78% during the ban, and 5.14% in the three weeks after the ban is removed.
Average dollar quoted spreads of banned stocks are $0.35, $0.64, and $0.51, respectively.
These figures are generally consistent with the findings of Boehmer, Jones, and Zhang
(2009).
Our primary tests examine whether the degree of dispersion of investor opinion or the
degree of deterioration in market quality influences how stock prices move around the
ban. First, we provide evidence that the ban has a differential impact on security
valuation that is related to the level of dispersion of opinion. Consistent with Miller’s
(1977) hypothesis, higher dispersion stocks tend to experience higher abnormal returns
than lower dispersion stocks at the initiation of the ban and throughout the ban. For
example, the day before the ban takes effect, on September 18th, abnormal stock returns
in quartiles of residual standard deviation (high to low) are 5.35%, 1.85%, 0.91%, and -
0.80%, respectively. Similarly, in quartiles of forecast dispersion these figures are 5.58%,
3.72%, 1.80%, and 2.08%, respectively. Second, we find that there is a differential
impact on security valuation that is related to the severity of the decline in market quality.
Firms in the top quartile of deterioration in market quality during the ban (based on the
change in the relative quoted spread) are associated with negative abnormal stock returns.
This occurs even though banned firms in aggregate have positive abnormal returns.
We provide multivariate tests that control for factors including firm size, abnormal
stock returns in the prior sixty days, and during all of 2007, the relative short interest
(RSI) and relative quoted spread prior to the ban, the percentage of shares held by
institutions and insiders, whether the firm is exchange-listed, and whether the firm has
listed options. The results indicate that greater dispersion is associated with higher
5

BHARs during the ban, ceteris paribus. These regressions also include an indicator
variable to test for the differential valuation impact for stocks that experience the greatest
deterioration in market quality. The estimates provide some evidence that banned firms
experiencing the largest widening in spreads are associated with lower BHARs than other
banned firms.
Specifications that examine the three weeks after the ban indicate that dispersion of
opinion is not significantly related to BHARs. Further, specifications that examine an
extended window including both the ban and the three weeks after the ban provide no
evidence that dispersion of opinion is significantly related to BHARs. This suggests that
the significant divergence in abnormal valuation between low and high dispersion stocks
is short-lived, which is consistent with the hypothesis that the removal of short sale
restrictions causes the relative valuations of high and low dispersion stocks to converge.
These findings are consistent with Miller’s (1977) hypothesis that high dispersion stocks
become more overvalued than low dispersion stocks in the presence of binding short sale
constraints. The findings also indicate that there is no material difference in information
arrival between high versus low dispersion stocks – the Miller effect for the banned firms
is only temporary.
In contrast to the above findings concerning the dispersion of opinion, differential
changes in market quality appear to have lasting effects on valuation. Stocks that suffer
the greatest decline in market quality from the pre-ban to post-ban period also experience
more negative BHARs over the entire ban and the post-ban period.
In robustness tests, the main findings are unchanged after excluding infrequently-
traded stocks to mitigate possible nonsynchronous trading effects. Further, the results
hold only in the subsample of stocks that are not heavily short sale constrained before the
6

ban. This suggests that a binding short sale constraint has less impact on stocks that might
already have had a “close-to-binding” constraint.
The paper is organized as follows. Section 2 discusses how short sale constraints are
measured empirically and discusses the existing evidence on the relationship between
stock price behavior and short sale constraints. Section 3 describes the data and variables.
In Section 4 we present evidence on the association between dispersion of opinion and
relative stock valuations around the ban. Section 5 concludes with a discussion of the
significance of our findings.
2. Short Sale Constraints and Their Effect on Stock Prices: Existing Evidence
Historically, it has been difficult to test directly how short sale constraints influence
prices because it has been hard to determine the extent to which short sale constraints are
binding. Prior empirical studies use various proxies for the degree of short sale
constraints. The most commonly used proxy is relative short interest (RSI), which is short
interest scaled by the number of outstanding shares. Figlewski (1981) uses RSI to proxy
for short sale demand and argues that firms with high RSI are more difficult to short.
Nagel (2005) uses institutional ownership as a proxy for the lendable supply of shares.
He argues that short sale constraints are more likely to bind among stocks with low
institutional ownership. Asquith, Pathak, and Ritter (2005) posit that short sale
constraints only bind when there is strong demand and limited supply. They use
institutional ownership as a proxy for the lendable supply of shares and define short sale-
constrained stocks as having both high RSI and low institutional ownership. They find
that short sale constraints are extremely uncommon using this criterion. Specifically, they
classify only 21 stocks out of 5,500 in an average month as short sale-constrained. More
7

generally, Asquith, Pathak, and Ritter (2005) find that over 95% of firms have
institutional ownership that exceeds short sales.
Diether, Lee, and Werner (2009a) use daily short sale transaction data and find that
during 2005 short sales represented 24% of NYSE and 31% of NASDAQ share volume.
This further demonstrates that the constraints on short selling are typically far from
binding in the U.S. equity markets.
The evidence on the relationship between short sale constraint metrics and subsequent
stock returns is mixed. Using the intensity of short selling to proxy for short sale
constraints, several papers find that heavily-shorted stocks – which are arguably the most
constrained – subsequently underperform less heavily-shorted stocks (Figlewski, 1981;
Asquith and Meulbroek, 1995; and Desai, Ramesh, Thiagarajan and Balachandran,
2002). In contrast, other studies find no relation between the level of short interest and
subsequent returns (Woolridge and Dickson, 1994; Brent, Morse and Stice, 1990;
Figlewski and Webb, 1993).
Jones and Lamont (2002) examine firms that enter the centralized stock loan market
at the NYSE during 1926-1933. Stocks appear to enter this “loan list” when shorting
demand is high. They find that share valuation starts increasing prior to being added to
the list, peaks immediately prior to being added, and declines after entering the loan
market. We report a similar pattern around the 2008 short sale ban, whereby banned firms
experience relative increases in valuation at the initiation and during the ban, and a
relative decrease in valuation on the first day after the ban is removed. Importantly and
distinctly, we also show that the increase in relative valuation is more pronounced for
high dispersion firms.
8

Two recent studies examine both conditions of Miller’s (1977) hypothesis: short sale
constraints and the dispersion of investor opinion. Boehme, Danielsen, and Sorescu
(2006) find that short sale-constrained and high dispersion firms severely underperform
on a risk-adjusted basis. Chang, Cheng, and Yu (2007) bypass the need to proxy for short
sale constraints by studying the Hong Kong market, in which securities can be sold short
only if they are on an official short sale list. They find significantly negative cumulative
abnormal returns (CARs) when a firm is added to the list. These negative CARs are
larger for firms that have greater dispersion of investor opinion.
Given the unique nature of our experiment, we add to this literature by examining the
cross-sectional effect related to dispersion of opinion and market quality when a binding
constraint is put into place in the U.S. markets.
A related line of research examines the effect of recent changes in the regulation of
short selling. In 2006 the SEC adopted regulation SHO, which suspended the uptick and
bid test requirements for short sales. Studies examining data made available during the
pilot phase of the regulation generally agree that the presence of short sellers enhances
both market liquidity and price informativeness (e.g. Boehmer and Wu, 2008; Alexander
and Peterson, 2009; Diether, Lee and Werner, 2009a and 2009b; and Edwards and
Hanley, 2009).
On July 15, 2008, the SEC initiated a temporary ban on naked short selling for 19
financial stocks. The impact of this order on security prices and market quality is still
debated in the literature. However, the evidence generally is not consistent with naked
short sellers’ acting in a speculative manner that destabilizes markets (see, e.g. Bris,
2008; Boulton and Braga-Alves, 2009; and Fotak, Raman, and Yadav, 2009). Finally,
Boehmer, Jones, and Zhang (2009) study the average impact of the September 19 –
9

October 8, 2008, SEC ban on short selling financial stocks by comparing banned stocks
to non-banned stocks. Our paper is a logical addition to the above mentioned studies by
examining the cross-sectional effects of a hard short sale constraint among stocks under
the purview of the order.
3. Data, Variables, and Descriptive Statistics
3.1. Data
The short sale ban on financial stocks was effective from September 19th through
October 8th, 2008.7 We also report information for September 18th, the day before the
ban, because on this day at 1pm EST a similar rule banning the short selling of financial
stocks was enacted on the London Stock Exchange, that may have raised expectations for
a similar ban in the U.S. markets. Our sample includes all 797 securities listed in the SEC
Emergency Order, as presented in Release No. 34-58592. We exclude ten securities due
to missing price and return data (MASB, PROS, NMX, SSBX, RGA, FIFG, NAHC,
AXG, AGII, and SAF). Five of the underlying ten firms were acquired in the months
leading up to the event period. We also exclude companies that were bought or became
bankrupt through direct involvement in the incipient financial crisis (LEH, MER, AIG,
FRE, FNM, WM, and WB). Finally, we exclude one exchange-traded fund that is on the
list (RKH). We do not include stocks that have been added to the short sale ban list after
the initiation of the ban8. Price and return data come from the Center for Research in
Security Prices (CRSP), and analyst forecast data from I/B/E/S.
7 The order (as amended on 9/21/2008) contains exceptions from the ban for bona fide market making and hedging activities as well as for the creation of short positions due to the automatic exercise or expiration of derivatives positions that were established prior to the ban. 8 The SEC amended its original emergency order to allow for stock exchanges to add further stocks to the ban list. In the week following the start of the ban exchanges added more than 300 more stocks to the list.
10

We acquire short sale data from Shortsqueeze.com and the Wall Street Journal. Short
interest data are available twice per month. We collect this data immediately prior to the
ban, during the ban, and immediately after the ban: (i) as of the market close on
September 10, 2008, with a settlement date of September 15, 2008; (ii) as of the market
close on September 25, 2008, with a settlement date of September 30, 2008; and (iii) as
of the market close on October 10, 2008, with a settlement date of October 15, 2008. Our
multivariate cross-sectional analysis controls for the change in short interest around the
initiation of the ban. Although it would be preferable to have short interest data on the
day before the ban takes effect, the cross-sectional correlation of short interest between
the last two available short interest dates, September 10 and August 24, is over 99%.
There is consequently little time-series variability in the cross-sectional distribution of
short interest. This mitigates concerns over using data as of September 10, 2008 in our
cross-sectional analysis.
3.2. Measures of Dispersion of Opinion and Market Quality
We use two variables to proxy for differences of investor opinion: residual standard
deviation (RSTD) and analyst earnings forecast dispersion (ADISP). RSTD is estimated
using the market model during the 60 trading days immediately prior to the initiation of
the short sale ban, where the market proxy is the value-weighted market return.9 A firm’s
RSTD captures the variation in returns that is not explained by market-wide factors.
Greater divergence of opinion is expected to cause greater stock price fluctuations that
are unassociated with market returns. Thus, more divergence of opinion should be
associated with more residual volatility. We define ADISP as the standard deviation of
9 Using 30 instead of 60 trading days provides qualitatively similar results.
11

analyst forecasts during March 2008 (collected from I/B/E/S), scaled by the stock price at
the end of 2007.10 This proxy is more direct than RSTD because it measures actual
differences of opinion across market professionals. However, data are available only for
larger firms (54% of our sample firms) that have at least two analysts reporting to
I/B/E/S. As noted by Boehme, Danielson, and Sorescu (2006), this data restriction is
important because only relatively large firms have at least two analysts following them. If
small firm size is correlated with high levels of dispersion of opinion, then using ADISP
restricts the sample to firms in which the Miller effect is less likely to be present.
Moreover, dispersion in analysts’ forecasts is likely to understate the level of dispersion
in investor beliefs because it is known that analysts tend to be optimistic and publish
positive forecasts. These drawbacks make it important to conduct the analysis using both
measures of dispersion in investor opinion.
Another focus of this study is the change in market quality around the ban. The
change in market quality is measured as the change in the relative quoted spread around
the ban. The average relative quoted spread is calculated in the three weeks prior to the
ban, the three weeks during the ban, and the three weeks subsequent to the ban. The
source of this data is the TAQ database.
3.3. Sample statistics
Table 1 presents descriptive statistics for the sample firms. Panel A provides statistics
for the entire sample of banned firms. The average sample firm has a market
capitalization of $3.3 million and is followed by 6 analysts. Of particular note, quoted
10 This definition of dispersion of analysts’ forecasts results in a small number of outliers for penny stocks. We delete the dispersion of opinion variable when it is greater than 50, which eliminates 5 observations.
12

spreads and relative quoted spreads increase substantially during the ban compared to the
three weeks prior, and the average number of trades per day decreases during the same
period. This is consistent with a decline in the market quality of the average banned firm.
After the ban market quality tends to improve somewhat. Panel B displays Pearson
correlation coefficients, which are generally low. The correlation between RSTD and
ADISP is 0.53, indicating that the two proxies for dispersion of opinion capture different
information.
Panel C presents firm statistics within quartiles of the two variables that proxy for
dispersion of opinion. RSTD is decreasing in market capitalization and is generally
increasing in the number of days that the stock is not traded in the 60 days prior to the
ban. Firms with greater RSTD have greater systematic risk. In contrast, ADISP exhibits
no clear association with either market capitalization or the percentage of days that the
stock is not traded. But similar to RSTD, greater ADISP is associated with greater
systematic risk. These statistics dramatize the importance of controlling for systematic
risk and firm characteristics in our analysis.
3.4. Short interest, short sale constraints, and the short ban
Panel A of Table 2 displays measures of short sale constraints prior to the ban for
financial and non-financial stocks. The first row indicates that the relative short interest
on September 10, 2008, is significantly lower for financials, 6.3% as compared to 7.6%
for non-financials. This indicates that there was less short demand for financials and that
it was possibly easier to short them than non-financials. However, the second row
indicates that the percentage of public float held by institutions is significantly lower for
financials, 44.6% as compared to 64.6% for non-financials. The third row provides
13

qualitatively similar evidence for the percentage of total shares held by institutions. This
suggests that there was a lower supply of lendable shares in financial stocks, which made
it harder to short the stocks.
The fourth row of Panel A in Table 2 reports statistics for a measure we call Short
Constraint. Short Constraint compares the relative shorting demand and supply and is
measured as the percentage of public float held by institutions minus the RSI. This
measure indicates no statistical difference in the level of short sale constraints between
financial and non-financial stocks. The next row shows that the days-to-cover (ratio of
short interest to average daily volume) is slightly higher for financials. Finally, a
combined measure of short sale constraints, based on the average decile rank of Short
Constraint and days-to-cover, yields no statistically significant difference between
financial and non-financial stocks.
Collectively, the results suggest that the constraints on short selling are similar across
financial and non-financial stocks. This evidence, combined with the evidence in the
literature that short sale constraints are typically far from binding in the U.S. equity
markets (e.g., Asquith, Pathak, and Ritter, 2005; Diether, Lee, and Werner, 2009a),
implies that the ban on financial stocks could have potentially significant economic
effects.
Panel B of Table 2 provides evidence on the extent to which the initiation of the ban
caused short sellers to cover their positions in banned and not banned stocks. Three
findings stand out. First, the RSI is lower for financials than non-financials before,
during, and after the ban. Second, in the two-week period from before the ban
(September 10th) to during the ban (September 25th), the RSI of financials declined
significantly from 6.3% to 5.3%. In comparison, the RSI of non-financials fell
14

significantly from 7.6% to 7.0%. Finally, in the two-week period from during the ban
(September 25th) to after the ban (October 10th) the RSI of financials experienced another
significant decline, from 5.3% to 4.5%. This decline is slightly smaller than the decline
for non-financials over the same interval, which was from 7.0% to 5.8%.
The evidence reveals that most of the investors who had open short positions in
financial stocks were not quick to close their short positions after the ban was initiated.
However, there was a significantly greater tendency for shorts to be closed in financial
than in non-financial stocks. Moreover, investors were not quick to re-open short
positions in financial stocks when the ban was lifted. Indeed, they continued to close their
positions, albeit at a lower rate than investors in non-financials.
Table 3 examines changes in the level of short interest for banned stocks around the
short sale ban, partitioned by dispersion of investor opinion. Panel A reports statistics for
below and above the median values of RSTD, while Panel B displays statistics for below
and above median values of ADSIP. Stocks associated with high levels of dispersion
(RSTD or ADISP) are associated with higher levels of RSI than stocks with low levels of
dispersion. Further, there is a decline in the average level of RSI from before- to during-
to after- the ban for both high and low dispersion stocks. For example, prior to the ban
(September 10th) the mean level of RSI is 7.5% for high RSTD stocks and 4.3% for low
RSTD stocks. During the ban (September 25th) these figures declined to 6.6% for high
RSTD stocks and 4.0% for low RSTD stocks. After the ban (October 10th), there is a
further decline to 5.6% for high RSTD stocks and 3.3% for low RSTD stocks. Finally,
the declines in RSI are significantly larger for high dispersion stocks than for low
dispersion stocks. Thus, investors with short positions in high dispersion financial stocks
were more likely to close the position after the ban was initiated. This is possibly because
15

they believed that high dispersion stocks were more likely to become overvalued during
the ban, and even though the ban contained an explicit closing date, the probability of an
extension was not zero.11 Such a belief would be consistent with Miller’s (1997)
hypothesis, and the belief itself could cause abnormal returns to increase more for high
dispersion stocks. Importantly, we control for changes in RSI in the multivariate tests
presented below.
4. Empirical Results: The Short Sale Ban, Dispersion of Opinion, and Relative Stock Valuations
In this section we examine the valuation impact of the ban, which is in effect for the
14 trading day period from September 19 through October 8, 2008. On September 18, the
United Kingdom instituted a ban on short selling for 29 financial securities, and also on
this date the SEC instituted a permanent ban on naked short selling for all U.S. stocks.
These events potentially increased investors’ expectations that a short sale ban was
imminent and therefore we believe that the announcement effect of the ban might
partially occur on this date.
4.1. Univariate evidence
Panel A of Table 4 examines the valuation impact of the ban. An overall picture of
stock performance during this turbulent period is provided by the raw returns on the
market and by the raw and abnormal returns on banned stocks. We calculate abnormal
returns using the Fama-French (1993) three-factor model for which we estimate factor 11 In fact, the ban’s original closing date was extended to close three days after Congress passed the economic rescue package under negotiation. The SEC had a regulatory mandate to keep the ban intact for a maximum of 30 days. Several foreign exchanged kept similar bans open for a much longer period. For example, the United Kingdom initiated a similar short sale ban on September 18, 2008 that remained in effect through January 15, 2009.
16

betas similar to the portfolio approach introduced by Fama and French (1992). This 2-
step procedure mitigates estimation error in the factor loadings. For each firm on CRSP,
we estimate betas using daily returns from 2007. Then we sort firms into portfolios based
first on NYSE size quintile breakpoints (based on the market capitalization on June 30,
2008), then within these, based on NYSE beta quintile breakpoints. We independently
sort the CRSP universe of stocks into book-to-market quintiles, where book-to-market is
measured at the stock’s most recently available fiscal year-end. The intersection of these
three sorts yields 125 portfolios for which we calculate equal-weighted daily returns. For
each portfolio we estimate factor loadings using the Fama-French three-factor model in
the sixty days prior to the ban and assign the portfolio factor loadings to each stock in
that particular portfolio. We use these factor loadings to calculate abnormal stock returns.
On September 18, 2008, the about-to-be-banned stocks have an average raw stock
return of 7.28%. This is followed on September 19th by a raw return of 6.34%. Over the
next several weeks during the ban and subsequently, it is evident that prices fall
dramatically. However, the declines in the value-weighted CRSP index are substantially
greater. On September 18th and 19th, the abnormal returns of banned stocks are a highly
significant 1.82% and 2.70%, respectively. Over the period from September 18th to
October 8th, banned stocks experience an average buy-and-hold abnormal return (BHAR)
of 5.28%. This evidence suggests that the binding short sale constraint leads to abnormal
valuation increases for affected stocks.
The first day after the ban is removed, there is a reversal wherein the average
abnormal return is -2.01%. However, in the three weeks after the ban, BHARs of affected
stocks are a marginally positive 1.30%. As a result, BHARs over the entire six-week
period are a significantly positive 6.79%. One potential explanation is that prior to
17

September 18th the banned stocks were actually undervalued, possibly because of
excessive shorting pressure. Further, the SEC’s actions may have allowed these stocks to
recover so that after the ban they were priced closer to fair value. An alternative
explanation is that the passage of the financial bailout package contributed to an
abnormally positive stock price response for financial stocks, irrespective of the ban.
It is hard to disentangle these alternative explanations. The remainder of our
empirical analysis focuses on testing whether the amount of dispersion in investor
opinion significantly influences valuations within our sample of short sale banned stocks.
4.1.1. Dispersion effect
Panels B and C of Table 4 examine whether the short sale ban is associated with
greater abnormal returns for high dispersion stocks compared to low dispersion stocks.
Panels B and C partition stocks on the SEC’s ban list by quartiles of RSTD and ADISP,
respectively. On September 18th, the stocks in the highest quartile (Q4) of RSTD
experience mean abnormal returns of 5.35%, whereas stocks in the lowest quartile (Q1)
experience abnormal returns of -0.79%. The p-value for differences between Q4 and Q1
is <0.0001. Similarly, stocks in Q4 of ADISP have abnormal returns of 5.88%, while
stocks in Q1 have abnormal returns of 2.08%. The p-value for differences between Q4
and Q1 is 0.0378. On September 19, we observe a similar but less pronounced pattern.
During the ban, from September 18 to October 8, BHARs of high dispersion stocks
(Q4) are 2% to 3% greater than those of low dispersion stocks (Q4). However, the
differences are not statistically significant. This suggests that the differential valuation
impact of the ban might be driven by the price reactions on September 18th and 19th. If so,
there are at least two potential explanations. Perhaps investors anticipated and
18

immediately priced a Miller effect when they learned of the ban. This would be
consistent with the evidence in Table 3 that short interest decreases around the ban more
for high dispersion stocks. Alternatively, it is possible that high dispersion stocks are
associated with greater uncertainty. Investors in these stocks consequently rushed to close
their short positions when the ban was announced in response to the greater perceived
uncertainty.
Figures 1 and 2 graphically depict BHARs from September 18th through October 8th
separately for high and low dispersion stocks. Figure 1 illustrates BHARs in the highest
and lowest quartiles of RSTD. Figure 2 displays BHARs in the highest and lowest
quartiles of ADISP. In Figure 1, the difference in BHARs between high and low RSTD
quartiles is evident immediately and remains steady or declines slightly during the ban
period. In Figure 2, the difference in BHARs between high and low ADISP quartiles
grows over the first several days of the ban and then fluctuates, but remains positive,
throughout the remainder of the ban.
There is little evidence of a dispersion effect when the ban is lifted. Moreover, over
the entire six week period from September 18th to October 29th, there is no evidence that
BHARs are greater for high dispersion firms. This suggests that the initial dispersion
effect is short-lived.
4.1.2. Market quality effect
Panel D of Table 4 examines abnormal stock returns around the ban within quartiles
of changes in the relative quoted spread. The first two columns display changes in
relative quoted spreads and BHARs, respectively, within quartiles of changes in relative
quoted spreads. The change in the relative quoted spread for each stock is calculated as
19

the stock’s average relative quoted spread during the ban period minus the stock’s
average relative quoted spread during the three weeks prior to the ban. This partitioning
of the data illustrates large cross-sectional differences in the effect of the ban on market
quality. The top quartile of banned firms experience a much larger increase in spreads
than any of the other quartiles. Consistent with this observation, BHARs exhibit no clear
pattern across the first three quartiles, but are negative in quartile 4. This indicates that
banned stocks associated with the largest increase in spreads (largest deterioration in
market quality) during the ban period contemporaneously experience abnormal stock
price declines, despite the fact that the typical banned firm experiences abnormal price
increases over this period.
The third and fourth columns in Panel D examine the three week post-ban window,
from October 9th through October 29th. The change in the relative quoted spread for each
stock is calculated as the change in spreads from the ban period to the post-ban period.
The evidence indicates that some firms continue to experience large declines in market
quality after the ban is lifted. BHARs are again negative in quartile 4, which suggests that
banned stocks associated with a large decline in spreads after the ban contemporaneously
experience abnormal stock price declines.
The final two columns in Panel D examine the entire six week period, September 18th
through October 29th. The change in the relative quoted spread for each stock is
calculated as the change in spreads from the pre-ban period to the post-ban period. Again,
the partition indicates that the subset of stocks in Q4 experience much larger increases in
spreads than other stocks. BHARs are -7.85% in quartile 4, which is consistent with the
large deterioration in market quality within this quartile over the entire six week window.
20

The collective evidence in Table 4 shows large cross-sectional variations in stock
returns around the ban. Stocks with higher dispersion of opinion experience larger
abnormal price increases during the ban, however, this effect disappears after the ban is
lifted. Stocks that suffer the most severe deterioration in market quality experience
abnormal price declines during the ban, and this effect persists after the ban is lifted.
4.2. Regression analysis
This section examines cross-sectional variation in abnormal stock returns around the
short sale ban in a multivariate setting that controls for the influence of numerous factors.
In particular, we estimate cross-sectional regressions in which the dependent variable is
the abnormal stock return over various dates and event windows, and the explanatory
variables include our proxies for the dispersion of investor opinion, our measure of
market quality, a binary variable that indicates whether the stock is in the top quartile of
deterioration in market quality, and various control variables. The binary indicator is
motivated by the empirical finding in the prior section that stocks in the highest quartile
of deterioration in market quality are associated with substantially greater deterioration
than other firms. This binary indicator is included only in specifications that cover
multiple-day event windows to asses the contemporaneous association between the
decline in market quality during a particular window and BHARs in the same window.
The control variables include the natural log of market capitalization, the alpha from a
market model estimated over the 60 days prior to the ban, the alpha from a market model
estimated during 2007, days-to-cover defined as short interest / average volume, the
change in relative short interest (ΔRSI) from September 10th to September 25th, the
percentage of shares held by insiders, the percentage of shares held by institutions, a
21

NASDAQ indicator, and an indicator variable that equals one if the stock has traded
options and zero otherwise.
4.2.1. The ban period
Table 5 provides regressions that examine abnormal returns over the following five
dates/windows: September 18th; September 19th; September 18th through October 8th;
September 19th through October 8th; and September 22th through October 8th. The last
window examines the ban period after excluding the first day of the ban, which could be
affected by a rush to close short positions, or a rush to purchase shares in anticipation that
other investors would close their short positions.
Panel A includes RSTD as the proxy for dispersion of investor opinion. In the first
four estimations, RSTD enters significantly in the direction consistent with Miller’s
(1977) hypothesis. For example, the estimate of RSTD in the second estimation indicates
that a one standard deviation increase in RSTD (standard deviation = 0.0258) is
associated with a 3.72% greater abnormal return on the day that the ban was initiated.
Similarly, the estimate of RSTD in the third model suggests that a one standard deviation
increase in RSTD is associated with a 4.22% greater BHAR over the entire period from
September 18th through October 8th. The last model in the table indicates no relation
between RSTD and BHARs over the window that excludes the first day of the ban,
September 22nd through October 8th. Furthermore, in each multiple-day window the
binary variable indicating a large increase in the relative quoted spread enters
significantly negatively. This implies that firms that experience large declines in market
quality are associated with larger abnormal declines in share price. The level variable
capturing the relative quoted spread prior to the ban is generally insignificant.
22

Panel B uses ADISP to proxy for dispersion of opinion. In the last three models, the
coefficient of ADISP enters significantly in the direction predicted by Miller’s (1977)
hypothesis. For example, in the third model the estimates suggest that a one standard
deviation increase in ADISP is associated with a 4.93% greater BHAR over the entire
period from September 18th to October 8th. The effect of ADISP on abnormal returns is
statistically significant for each window that covers all or most of the ban period, but is
not significant on September 18th or 19th. This is somewhat inconsistent with the results
for RSTD in Panel A. The findings with respect to market quality are less obvious. The
level variable capturing the relative quoted spread is significantly negatively, although
the binary variable indicating a large increase in spreads enters insignificantly.
Overall, Table 5 indicates that the ban is associated with a Miller-like dispersion
effect, whereby higher dispersion firms experience significantly greater abnormal returns.
However, it is not clear if this effect is priced immediately at the initiation of the ban (as
indicated by the effect of residual standard deviation), or if relative valuations slowly
diverge during the three week ban period (suggested by the impact of forecast
dispersion). Moreover, there is some evidence of a market quality effect in which stocks
that suffer the largest increase in relative quoted spreads during the ban suffer the largest
abnormal price declines.
4.2.2. The post-ban period
Table 6 tests whether the dispersion of opinion and the change in market quality
continue to influence abnormal returns after the ban. Panel A includes the variable RSTD
as the proxy for dispersion, while Panel B includes ADISP as the proxy. Each panel
23

includes a binary variable that equals one if the firm is in the top quartile of deterioration
in market quality (i.e., increase in relative quoted spread).
We expect relative valuations to converge after the ban, if the ban’s effect on the
relative valuation of high and low dispersion firms is temporary. The specifications in the
first two columns of Panel A and B of Table 6 provide virtually no evidence of a
dispersion effect after the ban is removed. Instead of reversing, the Miller-like effect
simply disappears. This finding is somewhat inconsistent with Boehme, Danielsen, and
Sorescu’s (2006) finding that short sale-constrained and high dispersion firms severely
underperform on a risk-adjusted basis. Further, the evidence is not consistent with Chang,
Cheng, and Yu’s (2007) finding that abnormal returns are more negative for firms that
have greater dispersion of investor opinion when a binding short sale constraint is
removed. Moreover, the coefficient on the binary variable indicating the largest change in
relative quoted spread is insignificant. This finding suggests that stocks that experience
the largest increase in spreads after the ban expires (see Table 4 Panel D, Q4 for evidence
of this increase) are not penalized by stock price declines.
The final estimation in each panel of Table 6 examines the differential valuation
effects during the ban and subsequent to the ban in a single specification. The estimates
indicate that dispersion has no significant impact on BHARs when the post-ban period is
included. Thus, the dispersion effect that we report appears to be short-lived and
concentrated during the ban period. However, stocks that experience the largest increase
in spreads from before to after the ban are associated with significantly more negative
abnormal stock returns over the entire period.
An implication of the dispersion-related findings is that there are no lasting
differential valuation consequences of the SEC’s initiative to ban short selling in financial
24

stocks. However, the market quality evidence suggests there might be longer-lived
consequences of the ban. Hard-hit firms in this respect suffer abnormal price declines that
continue after the ban expires. One caveat is that it is difficult to determine whether the
severe decline in market quality for certain stocks is entirely due to the ban, or whether it
is caused by other aspects of the financial crisis. Nevertheless, the evidence supports the
hypothesis that in troubled times, during which market quality deteriorates on average,
stocks that experience the most extreme declines in market quality incur larger stock
price penalties.
4.3. Robustness tests
For robustness, Table 7 provides several additional specifications that model BHARs
over the window September 18th to October 8th. The first specification in Panel A
(RSTD) and Panel B (ADISP) exclude infrequently-traded stocks to mitigate any effects
related to nonsynchronous trading. Stocks are ranked on the number of days that the
stock was not traded during the 60 days prior to the ban and the 25% least-traded stocks
are excluded. In the respective panels, RSTD and ADISP enter significantly positively,
indicating that during the ban abnormal returns are greater for stocks that are associated
with greater dispersion of investor opinion. The next two models provide separate
specifications for NYSE/AMEX and NASDAQ stocks. In Panel A, RSTD enters
insignificantly for NYSE/AMEX stocks and significantly positively for NASDAQ stocks.
In Panel B, ADISP enters significantly positively for NYSE/AMEX stocks and
insignificantly for NASDAQ stocks. The binary variable that indicates a severe decline in
market quality enters significantly negatively in each panel for the NYSE/AMEX sample.
25

In Table 7 we also conduct separate tests based on whether the stock is short sale-
constrained prior to the ban. Our rationale for this test is that the ban might have less
impact on stocks that were particularly hard to short prior to the ban. We rank stocks
based on the Short Constraint variable, which is defined as the percentage institutional
holding minus relative short interest. We then estimate separate specifications for the
80% least-constrained and the 20% most-constrained stocks. The specifications are
presented in the last two columns. As expected, the findings for the 80% least-
constrained stocks are consistent with our findings using the full sample. However, we
find no evidence of a dispersion effect or market quality effect within the top 20% of
short sale-constrained firms. This finding suggests that a binding short sale constraint has
less impact on stocks that might already have a “close-to-binding” constraint.
4.4. Control firms
In Table 8 we conduct additional tests using a control sample of firms for which short
selling was not banned at any time in our sample period. The rationale for these
additional tests is twofold. First, it is possible that our results regarding the Miller (1977)
effect are misleading if there is a cross-sectional relationship between dispersion of
opinion and abnormal stock returns for some reason other than overvaluation due to short
sale constraints. If such a relationship exists, it should be present in the non-banned
control firms. Second, on September 18th the SEC enacted a permanent order banning
naked short selling for all stocks. If banning naked short selling represents a short sale
constraint and if naked short selling compromises market quality, the control firms
should reflect such an effect.
26

We select control firms by sorting the entire universe of CRSP firms simultaneously
into quartiles based on RSTD and into deciles based on market capitalization. Then we
count the number of banned firms in each of these 40 groups, and randomly draw the
same number of firms from non-banned firms in each group. This ensures that the
dispersion and market capitalization characteristics in the non-banned control sample are
relatively similar to the main sample we study.
As expected, we find markedly different results when we replicate Table 5 using non-
banned control firms. Evidence of a dispersion effect is only present on the day of
September 18th, and only when we measure dispersion of opinion by residual standard
deviation. However, we find that firms with the largest increase in trading spreads do
realize lower abnormal returns than firms with less increase in their relative quoted
spreads over the entire period. These findings indicate that spreads widen due to
investors’ increased uncertainty and suggest that the market views even the less drastic
measure of banning naked short selling as an impediment to the price discovery process.
5. Conclusions
This study uses the three-week short sale ban on U.S. financial securities in 2008 as a
laboratory to examine the association between short sale constraints and stock valuation.
We provide evidence that the ban is associated with relative increases in share valuation
that are not reversed when the ban is lifted. One interpretation is that the SEC’s short
selling ban came after financial stock prices had fallen below fair value and perhaps the
ban was successful in pre-empting a decline beyond that level and helped these securities
revert to fundamental value. Another possibility is that the events around the ban affected
27

financial stocks – the subject of the short sale ban – differently compared to how they
affected the rest of the market.
In light of this joint hypothesis we focus on the relative valuation effects of dispersion
of opinion and market quality. We find that the increase in valuation among banned
stocks is significantly more pronounced for stocks with higher levels of dispersion of
investor opinion. Among banned stocks, high dispersion stocks earn abnormally high
returns compared to low dispersion stocks during the ban. This difference in abnormal
returns disappears over the following three weeks, although there is no clear reversal. The
findings suggest that the Miller effect for the banned firms is only temporary. Thus, the
ban appears to have no lasting differential valuation consequences for higher versus
lower dispersion stocks.
We also find a significantly greater decrease in valuation among banned stocks that
suffer a severe deterioration in market quality. This effect persists after the ban expires. A
pre- to post-ban deterioration in market quality is met with a large contemporaneous
abnormal decline in stock prices. The evidence is consistent with the argument that the
ban has a lasting differential valuation consequence with respect to its effect on market
quality. The policy implications of our findings are problematic. It is arguable that the
SEC’s actions may have curbed excessive price declines for troubled firms without
lasting differential valuation consequences for higher vs. lower dispersion stocks.
However, the success of the short sale ban of 2008 was achieved at the cost of a severe
deterioration in market quality.
28

References
Aitken, M.J., Frino A, McCorry, M.S., Swan, P.L., 1998, Short sales are almost instantaneously bad news: evidence from the Australian Stock Exchange, Journal of Finance 53, 2205-2223. Alexander, Gordon and Mark A. Peterson, 2008, The Effect of Price Tests on Trader Behavior and Market Quality: An Analysis of Reg SHO, Journal of Financial Markets 11, 84-111. Asquith, P. and L. Meulbroek, 1995, An empirical investigation of short interest. Working Paper, Harvard Business School. Asquith, P., P. Pathak and J. Ritter, 2005, Short Interest, Institutional Ownership, and Stock Returns, Journal of Financial Economics 78, 243-276. Boehme, Rodney D., Bartley R. Danielsen, and Sorin M. Sorescu, 2006, Short-sale constraints, differences of opinion, and overvaluation, Journal of Financial and Quantitative Analysis 41, 455. Boehmer, Ekkehart, Zsuzsa R. Huszar, and Bradford D. Jordan, 2009, The good news in short interest, Forthcoming, Journal of Financial Economics. Boehmer, Ekkehart, Charles M. Jones, and Xiaoyan Zhang, 2008, Which shorts are informed? Journal of Finance 63(2), 491-527. Boehmer, Ekkehart, Charles M. Jones, and Xiaoyan Zhang, 2009, Shackling short sellers: The 2008 shorting ban, Working paper, Texas A&M University. Boehmer, Ekkehart and J. Julie Wu, 2009, Short selling and the information efficiency of prices, Working paper, Texas A&M University. Boulton, Thomas J. and Marcus V. Braga-Alves, 2009, The skinny on the 2008 naked short sale restrictions, Working paper, Miami University and Marquette University. Bris, Arturo, William N. Goetzmann and Ning Zhu, 2007, Efficiency and the bear: Short sales and markets around the world, Journal of Finance, 62, 1029-1079. Bris, Arturo, 2008, Short selling activity in financial stocks and the SEC July 15th emergency order, Working paper, IMD, European Corporate Governance Institute and Yale International Center for Finance. Chang, Eric C., Joseph W. Cheng, and Yinghui Yu, 2007, Short-sales constraints and price discovery: evidence from the Hong Kong market, Journal of Finance 62, 2097-2121.
29

Chen, Joseph, Harrison Hong, and Jeremy C. Stein, 2002, Breadth of ownership and stock returns, Journal of Financial Economics 66, 171-205. Cohen, Lauren, Karl Diether, and Christopher Malloy, 2007, Supply and demand shifts in the shorting market, Journal of Finance 62, 2061-2096. Desai, H., K. Ramesh, S. R. Thiagarajan, and B. Balachandran, 2002, An investigation of the informational role of short interest in the nasdaq market, Journal of Finance 57, 2263-2287. Diamond, Douglas W. and Robert E. Verrecchia, 1987, Constraints on short-selling and asset price adjustment to private information, Journal of Financial Economics 18, 277-311. Diether, Karl B., Kuan-Hui Lee, and Ingrid M. Werner, 2009a, Short-sale strategies and return predictability, Review of Financial Studies 22, 575-607. Diether, Karl B., Kuan-Hui Lee, and Ingrid M. Werner, 2009b, It’s SHO time! Short-sale price tests and market quality, Journal of Finance 64, 37-73. Edwards, Amy K. and Hanley, Kathleen Weiss, 2009, Short selling in initial public offerings, Journal of Financial Economics, forthcoming Fama, Eugene F. and Kenneth R. French, 1992, The cross-section of expected stock returns, Journal of Finance 47, 427-465. Fama, Eugene F. and Kenneth R. French, 1993, Common risk factors in the returns on stocks and bonds, Journal of Financial Economics 33, 3-56. Figlewski, Stephen, 1981, The informational effects of restrictions on short sales: some empirical evidence, Journal of Financial and Quantitative Analysis 16, 463-476. Figlewski, Stephen, and Gwendolyn P. Webb, 1993, Options, short sales, and market completeness, Journal of Finance 48, 761-777. Fotak, Veljko, Vikas Raman, and Pradep K. Yadav, 2009, Naked short selling: The Emperor’s new clothes? Working paper, University of Oklahoma. Jones, Charles M. and Owen A. Lamont, 2002, Short sale constraints and stock returns, Journal of Financial Economics 66,207-239. Miller, Edward M., 1977, Risk, uncertainty, and divergence of opinion, Journal of Finance 32, 1151-1168. Nagel, S., 2005, Short sales, institutional investors and the cross-section of stock returns’, Journal of Financial Economics 78, 277–309.
30

Woolridge, J. R. and Amy Dickinson, 1994, Short selling and common stock prices. Financial Analysts Journal 50, 20-28.
31

Table 1 Descriptive statistics Panel A provides descriptive statistics for firms in the sample. Panel B provides Pearson correlations between the indicated variables. Panel C displays mean variables estimated in quartiles formed on the dispersion of opinion. Market capitalization is the number of shares outstanding times the share price on December 31, 2007. Alpha 2007 is the market model daily alpha estimated in the year of 2007. Alpha 60 is the market model daily alpha, volume is the average daily number of shares traded, turnover is volume scaled by the number of shares outstanding, Stdev is the standard deviation of daily returns, and RSTD is the residual standard deviation of daily returns from the market model estimated using data from the 60 trading days prior to the ban. ADISP is the standard deviation of analyst forecast dispersion and Numest is the number of analysts following (most recently available in March 2008) scaled by the end-of-2007 stock price. % days not traded is the percentage of days on which the stock posted 0 volume in the 60 trading days prior to the ban. Quoted spreads, relative quoted spreads, and average number of trades per day are estimates measured in the window indicated; prior=three weeks before ban; during ban; after=three weeks after ban.
Panel A: Statistics for short sale banned firms N Minimum 25% Mean Median 75% Maximum Std Dev
Mkt capitalization 781 5,919 76,043 3,334,845 225,929 1,078,148 183,124,993 13,822,532 Alpha 2007 781 -0.0101 -0.0015 -0.0008 -0.0007 -0.0001 0.0197 0.0016 ADISP 427 0.0000 0.0023 0.0092 0.0046 0.0085 0.1995 0.0172 Numest 547 1 2 5.8995 4 8 24 5.3190 % days not traded 786 0 0 0.0910 0 0.1268 0.6901 0.1563 Alpha 60 786 -0.0477 -0.0007 0.0029 0.0018 0.0060 0.0476 0.0067 Volume 786 34 2002 1,234,053 28,744 317,131 117,125,368 6,767,863 Turnover 785 0.0194 0.3976 6.2546 1.8573 7.1658 337.7355 15.9503 Stdev 786 0.0016 0.0302 0.0465 0.0408 0.0561 0.2453 0.0269 RSTD 786 0.0016 0.0241 0.0404 0.0344 0.0484 0.2382 0.0258 Quoted spread (prior) 772 0.0122 0.0556 0.3457 0.1423 0.4778 6.9020 0.5187 Quoted spread (during) 771 0.0134 0.1279 0.6421 0.3381 0.6898 65.4286 2.4590 Quoted spread (after) 765 0.0132 0.0984 0.5135 0.2698 0.7295 12.8308 0.7247 Relative quoted spread (prior)
772 0.0003 0.0032 0.0306 0.0116 0.0469 0.3018 0.0408
Relative quoted spread (during)
771 0.0004 0.0079 0.0478 0.0248 0.0692 0.5339 0.0571
Relative quoted spread (after)
765 0.0002 0.0073 0.0514 0.0256 0.0800 0.3698 0.0594
Avg. # of trades (prior) 773 1.33 10.14 4102 200 2,617 141,855 11,914 Avg. # of trades (during) 771 1.75 10.43 3,084 166 1,687 124,401 9,464 Avg. # of trades (after) 765 2.67 10.75 4,397 174 2,287 155,957 13,472
Panel B: Pearson correlations of variables Alpha07 Volume Turnover Stdev Var Alpha60 Beta RSTD ADISP Numest
Alpha 2007 1.00 -0.05 0.01 -0.45 -0.40 -0.23 -0.23 -0.44 -0.38 0.09 Volume -0.05 1.00 0.01 0.11 0.08 0.12 0.26 0.02 0.10 0.44 Turnover 0.01 0.01 1.00 -0.01 -0.01 0.04 0.03 -0.02 0.36 0.47 Stdev -0.45 0.11 -0.01 1.00 0.92 0.42 0.50 0.97 0.52 0.06 Variance -0.40 0.08 -0.01 0.92 1.00 0.41 0.42 0.91 0.59 0.05 Alpha 60 -0.23 0.12 0.04 0.42 0.41 1.00 0.66 0.30 0.17 0.20 Beta -0.23 0.26 0.03 0.50 0.42 0.66 1.00 0.27 0.27 0.38 RSTD -0.44 0.02 -0.02 0.97 0.91 0.30 0.27 1.00 0.53 -0.06 ADISP -0.38 0.10 0.36 0.52 0.59 0.17 0.27 0.53 1.00 0.00 Numest 0.09 0.44 0.47 0.06 0.05 0.20 0.38 -0.06 0.00 1.00
32

Panel C: Dispersion of opinion quartiles
Residual standard deviation quartiles Quartile #
obs Residual standard deviation
Market capitalization
% days not traded
Market model alpha 2007
Market model alpha
[-60,-1]
Beta [-60,-1]
1 191 0.0185 5,091,593 0.0763 0.0000 0.0015 0.77 2 192 0.0291 4,332,461 0.0640 -0.0006 0.0027 1.04 3 196 0.0409 3,308,897 0.1146 -0.0010 0.0028 1.08 4 187 0.0737 537,867 0.1077 -0.0017 0.0049 1.28
Analyst forecast dispersion quartiles
Quartile # obs
Dispersion Market capitalization
% days not traded
Market model alpha 2007
Market model alpha
[-60,-1]
Beta [-60,-1]
1 106 0.0014 6,451,219 0.0122 -0.0001 0.0029 1.27 2 106 0.0033 4,066,503 0.0073 -0.0006 0.0047 1.38 3 106 0.0065 4,821,381 0.0120 -0.0009 0.0057 1.53 4 99 0.0265 8,180,498 0.0114 -0.0018 0.0064 1.79
33

Table 2 Short constraints: Financials vs. non-financials This table provides variables associated with short sale constraints for financial and non-financial firms. Financials represent the main sample used in this study, whereas the comparison group of non-financials includes all other common stocks traded on the NYSE, AMEX, or Nasdaq that are not on the list of short sale banned stocks and have short interest data. Panel A provides data on short interest on 9/10, while Panel B provides level and change data for 9/10, 9/25, and 10/10. Short interest is the number of shares shorted in the stock at the end of the day given. Relative short interest is defined as Short interest/Float. Short constraint is Institutional holdings/Float - Relative short interest. Days- to-cover is Short interest/Average volume as reported by shortsqueeze.com. Average constraint decile is the average decile rank of Short constraint and Days to cover. ΔRelative short interest is Relative short interestt – relative short interestt-1.
Panel A: Short sale constraints before the ban Means Medians Non-
financials Financials P-value
Non-financials
Financials Wilcoxon P-Value
Short Interest/Float 9/10 7.614*** 6.298*** 0.0004 4.68*** 2.6*** <.0001 Inst. Holdings /Float 64.61*** 44.57*** <.0001 62.05*** 38.68*** <.0001
Inst. Holdings/ Shares Outstanding
45.06*** 36.23*** <.0001 44.2*** 30.5*** <.0001
Short constraint 9/10 0.1291*** 0.1151*** 0.3695 0.0468*** 0.0482*** 0.9426 Days to cover 9/10 8.428*** 10.59*** 0.0012 5*** 5.3*** 0.3069
Avg. constraint decile 9/10 4.629*** 4.558*** 0.5443 5*** 5*** 0.8453
Panel B: Short interest before, during, and after the ban
Means Medians
Non-
financials Financials P-value
Non-financials
Financials Wilcoxon P-Value
Short interest 9/10 4,697,877 6,190,149 0.1049 1,585,000 595,700 <.0001 Short interest 9/25 4,246,307 4,386,934 0.8024 1,450,600 514,200 <.0001
Short interest 10/10 3,925,238 3,797,631 0.7835 1,261,100 434,900 <.0001 Relative short interest
9/10 7.614 6.298 0.0004 4.68 2.6 <.0001
Relative short interest 9/25
6.962 5.328 <.0001 4.2 1.985 <.0001
Relative short interest 10/10
5.845 4.462 <.0001 3.6 1.75 <.0001
ΔRelative short interest 9/10 to 9/25
-0.7336*** -0.9535*** 0.0067 -0.18*** -0.13*** 0.0212
ΔRelative short interest 9/25 to 10/10
-1.185*** -0.8881*** 0.0003 -0.3*** -0.15*** 0.8726
34

Table 3 Short interest and relative short interest for firms with high and low dispersion of opinion This table provides variables associated with short sale constraints for sample firms partitioned on the amount of dispersion of opinion: above median (High) and below median (Low). Panel A measures dispersion of opinion with the residual standard deviation estimated using the market model in the 60 trading days prior the ban. Panel B measures dispersion of opinion with the most recently available analyst forecast dispersion scaled by the stock price on 12/31/2007. Short interest is the number of shares shorted in the stock at the end of the day given. Relative short interest is defined as Short interest/Float. Short constraint is Institutional holdings/Float - Relative short interest. ΔRelative short interest is Relative short interestt – relative short interestt-1.
Panel A: Residual standard deviation groups Means Medians Low High P-value Low High Wilcoxon
P-Value Short interest 9/10 3,146,987 6,340,083 0.0039 851,400 277,350 0.0520 Short interest 9/25 2,596,071 5,084,210 0.0057 754,400 206,500 0.0652
Short interest 10/10 2,323,741 4,398,469 0.0075 619,600 192,600 0.0622 Relative short interest
9/10 4.255 7.495 <.0001 2 1.62 0.1615
Relative short interest 9/25
3.955 6.64 <.0001 1.77 2.3 0.1418
Relative short interest 10/10
3.251 5.624 <.0001 1.6 2.12 0.1394
ΔRelative short interest 9/10 to 9/25
-0.5486*** -1.301*** <.0001 -0.17*** -0.11*** 0.2486
ΔRelative short interest 9/25 to 10/10
-0.7121*** -1.03*** 0.0020 -0.17*** -0.11*** 0.1485
Shortconstr 9/10 0.0727*** 0.1572*** <.0001 0.0343*** 0.0744*** 0.0004
Panel B: Analyst forecast dispersion groups
Means Medians Low High P-value Low High Wilcoxon
P-Value Short interest 9/10 4,367,390 11,581,933 0.0002 2,066,350 2,383,300 0.1572 Short interest 9/25 3,494,645 9,314,577 0.0002 1,656,750 1,975,900 0.1344
Short interest 10/10 3,109,032 8,080,538 0.0002 1,404,700 1,733,500 0.1879 Relative short interest
9/10 7.634 10.73 0.0023 6.585 7.05 0.0773
Relative short interest 9/25
6.776 9.149 0.0075 6 6.545 0.1343
Relative short interest 10/10
5.722 7.708 0.0116 4.8 4.8 0.1768
ΔRelative short interest 9/10 to 9/25
-1.085*** -1.849*** 0.0004 -0.5*** -0.8*** 0.0275
ΔRelative short interest 9/25 to 10/10
-1.064*** -1.417*** 0.0215 -1.04*** -1.22*** 0.1300
Shortconstr 9/10 0.1254*** 0.1699*** 0.0046 0.0986*** 0.1123*** 0.0696
35

Table 4 Abnormal returns for financials with high and low dispersion of opinion Panel A displays mean returns for sample firms and for the value-weighted market index in various windows around the ban. Panels B-D display mean abnormal returns for sample firms within quartiles of dispersion of opinion and changes in relative quoted spread. In Panel B quartiles are formed on residual standard deviation estimated using the market model in the 60 trading days prior the ban. In Panel C quartiles are formed on the most recently available analyst forecast dispersion scaled by the stock price on 12/31/2007. In Panel D there are three different quartile sorts, based on the change in relative quoted spread from before the ban to the ban period, from the ban period to the three weeks after the ban, and from the three weeks prior to the ban to the three weeks after the ban, respectively. Abnormal returns are measured using the Fama-French three factor model where the factors are estimated using a portfolio approach. For the windows that include multiple days, the abnormal return is calculated using buy-and-hold returns over the window.
Panel A: Average returns
Sept 18 Sept 19 Sept 18-Oct 8 Oct 9 Oct 9-Oct 29 Sept 18-Oct 29 Banned firms: raw
returns 0.0728 0.0634 -0.0974 -0.0833 -0.0692 -0.1618
Banned firms: Abnormal returns
0.0182 0.0270 0.0528 -0.0201 0.0130 0.0679
Value-weighted market return
0.0442 0.0458 -0.1639 -0.0733 -0.0670 -0.2199
Panel B: Residual standard deviation (RSTD) quartiles
RSTD Quartile
#Obs Sept 18 Sept 19 Sept 18-Oct 8 Oct 9 Oct 9-Oct 29 Sept 18-Oct 29
1 193 -0.0079 0.0185 0.0262 -0.0241 0.0187 0.0429 2 194 0.0091 0.0183 0.0727 -0.0162 0.0185 0.0979 3 198 0.0185 0.0314 0.0540 -0.0300 0.0301 0.0901 4 189 0.0535 0.0387 0.0596 -0.0097 -0.0094 0.0458
P-value (Diff 4-1)
- <0.0001 0.0917 0.1096 0.1071 0.1443 0.3353
Panel C: Analyst forecast dispersion (ADISP) quartiles
ADISP Quartile
#Obs Sept 18 Sept 19 Sept 18-Oct 8 Oct 9 Oct 9-Oct 29 Sept 18-Oct 29
1 105 0.0208 0.0314 0.0894 -0.0179 0.0252 0.1222 2 108 0.0180 0.0258 0.0817 -0.0345 0.0504 0.1436 3 107 0.0372 0.0417 0.0941 -0.0329 0.0530 0.01478 4 100 0.0558 0.0473 0.1135 -0.0294 0.0070 0.1155
P-value (Diff 4-1)
- 0.0378 0.2810 0.4583 0.3596 0.5594 0.5080
36

Panel D: Change in relative quoted spread quartiles
Quartile
Change in relative quoted spread
pre-ban to ban
Abnormal return
Sept 18- Oct 8
Change in relative
quoted spread ban to post-
ban
Abnormal return
Oct 9-Oct 29
Change in relative quoted spread
pre-ban to post-ban
Abnormal return
Sept 18- Oct 29
1 -0.0035 0.0550 -0.0206 0.0191 -0.0042 0.0947 2 0.0054 0.0953 -0.0010 0.0630 0.0052 0.1671 3 0.0142 0.0923 0.0022 0.0044 0.0164 0.0968 4 0.0499 -0.0279 0.0377 -0.0326 0.0649 -0.0785
P-value (Diff 4-1)
- <0.0001 - 0.0039 - <0.0001
37

Table 5 Regression analysis This table provides cross-sectional regressions of abnormal returns explained by dispersion of opinion, the change in relative quoted spread, and firm characteristics. Panel A measures dispersion of opinion with the residual standard deviation estimated using the market model in the 60 trading days prior the ban. Panel B measures dispersion of opinion with the most recently available analyst forecast dispersion scaled by the stock price on 12/31/2007. Abnormal returns are measured using the Fama-French three factor model where the factors are estimated using a portfolio approach. For the windows that include multiple days, the abnormal return is calculated using buy-and-hold returns over the window. Change in relative quoted spread is indicated by a binary variable taking the value of one when the firm is in the highest quartile formed on change in relative quoted spread from before the ban to the ban period. Ln (Mkt capitalization) is the natural logarithm of the product of the number of shares outstanding and share price on 12/31/2007. Days-to-cover is Short interest/Average volume as reported by shortsqueeze.com. Relative short interest is defined as Short interest/Float. Insider holdings is the percentage of shares outstanding held by insiders and Institutional holdings is the percentage of shares outstanding held by institutions (expressed as %). NASDAQ is a binary variable indicating that the major trading venue for the stock is Nasdaq. Options is a binary variable indicating that there are traded option available for the stock. Asymptotic errors are reported in parentheses. *,**,*** indicate significance at the 10, 5, and 1% level, respectively.
Panel A: Residual standard deviation Explanatory variables Sept 18 Sept 19 Sept 18-Oct 8 Sept 19-Oct 8 Sept 20-Oct 8
Intercept -0.1104** (0.0442)
-0.1031** (0.0466)
-0.5861*** (0.0955)
-0.4891*** (0.0899)
-0.4449*** (0.0892)
RSTD 0.8261*** (0.3268)
1.4422*** (0.2859)
1.6368*** (0.5938)
0.8732* (0.5073)
-0.3485 (0.4924)
Ln (Mkt capitalization) 0.0068** (0.0032)
0.0077** (0.0034)
0.0437*** (0.0072)
0.0381*** (0.0068)
0.0344*** (0.0065)
Alpha 60 5.9708*** (1.1149)
-9.8305***(1.1524)
3.1361 (1.9815)
-2.9727* (1.6422)
6.1559*** (1.5063)
Alpha 2007 -0.4135 (3.0758)
-5.7838 (3.8496)
-3.6126 (7.2362)
-2.5502 (6.4571)
2.9134 (7.0056)
Days to cover 0.0003
(0.0002) 0.0004** (0.0002)
0.0015** (0.0006)
0.0013*** (0.0005)
0.0009** (0.0004)
Relative quoted spread -0.1021 (0.1328)
-0.5541***(0.1685)
-0.2699 (0.2827)
-0.1573 (0.2501)
0.4987* (0.2970)
ΔRelative short interest 0.0006
(0.0027) -0.0086***
(0.0023) -0.0004 (0.0056)
-0.0023 (0.0054)
0.0052 (0.0053)
Insider holdings -0.0002 (0.0001)
-0.0002 (0.0001)
-0.0001 (0.0003)
0.0001 (0.0003)
0.0003 (0.0003)
Institutional holdings -0.0005***
(0.0001) 0.0002
(0.0001) -0.0005 (0.0003)
-0.0001 (0.0003)
-0.0003 (0.0002)
NASDAQ 0.009
(0.0088) 0.0063
(0.0091) 0.0754*** (0.0184)
0.0649*** (0.0168)
0.0611*** (0.0167)
Options 0.0101
(0.0123) -0.0042 (0.0120)
-0.0501** (0.0226)
-0.0626*** (0.0233)
-0.0632*** (0.0222)
Dummy: Highest Δrelative quoted spread
-
-
-0.0517*** (0.0183)
-0.0492*** (0.0163)
-0.0487*** (0.0162)
Adj R-Sq 0.2870 0.2176 0.2076 0.0973 0.1511 n 756 756 752 752 752
38

Panel B: Analyst forecast dispersion
Explanatory variables Sept 18 Sept 19 Sept 18-Oct 8 Sept 19-Oct 8 Sept 20-Oct 8
Intercept -0.0683 (0.0548)
0.0977 (0.0742)
-0.4566*** (0.1419)
-0.3772*** (0.1499)
-0.4835*** (0.1251)
ADISP 0.3165
(0.4752) 0.5352
(0.4763) 2.8646*** (0.8071)
2.1046*** (0.6260)
1.5473*** (0.4881)
Ln (Mkt capitalization) 0.0034
(0.0037) -0.0047 (0.0050)
0.0325*** (0.0103)
0.0288*** (0.0104)
0.0348*** (0.0088)
Alpha 60 6.5769***(1.6127)
-6.8995***(1.5034)
5.3707** (2.6980)
-1.2501 (1.8658)
4.9439*** (1.9699)
Alpha 2007 -5.2898 (5.1483)
-2.8767 (5.7525)
4.0865 (10.1115)
6.4603 (9.0130)
6.9862 (8.8447)
Days to cover 0.0012** (0.0005)
0.0004 (0.0006)
0.0051*** (0.0011)
0.004*** (0.0014)
0.0033*** (0.0009)
Relative quoted spread 0.1939 (0.3734)
0.0676 (0.4949)
-1.6541** (0.8376)
-1.5588* (0.9569)
-1.293* (0.7101)
ΔRelative short interest -0.0016 (0.0029)
-0.0093***(0.0026)
0.0022 (0.0057)
0.0026 (0.0055)
0.0097* (0.0052)
Insider holdings -0.0003 (0.0003)
0.0002 (0.0003)
0 (0.0006)
0.0003 (0.0006)
0 (0.0006)
Institutional holdings -0.0004**(0.0001)
0.0001 (0.0001)
-0.0003 (0.0003)
0 (0.0003)
-0.0001 (0.0003)
NASDAQ 0.0089
(0.0118) -0.0028 (0.0127)
0.0895*** (0.0236)
0.0749*** (0.0225)
0.0794*** (0.0216)
Options 0.0293** (0.0136)
0.0223* (0.0138)
-0.0236 (0.0252)
-0.0502* (0.0272)
-0.0745*** (0.0244)
Dummy: Highest Δrelative quoted spread
-
-
-0.0014 (0.0415)
-0.0169 (0.0326)
-0.0418 (0.0290)
Adj R-Sq 0.2362 0.130 0.218 0.1051 0.1890 n 417 417 416 416 416
39

Table 6 Regressions during the ban and post-ban period This table displays regressions on October 9th, over October 9 – October 29 post-ban three week period and over the combined 6-week ban and post-ban period (Sept18-Oct29). The explanatory variable is the abnormal return on the day or over the period indicated. Panel A measures dispersion of opinion with the residual standard deviation estimated using the market model in the 60 trading days prior the ban. Panel B measures dispersion of opinion with the most recently available analyst forecast dispersion scaled by the stock price on 12/31/2007. Change in relative quoted spread is indicated by a binary variable taking the value of one when the firm is in the highest quartile formed on change in relative quoted spread. Changes are calculated from the periods indicated. Abnormal returns are measured using the Fama-French three factor model where the factors are estimated using a portfolio approach. Ln (Mkt capitalization) is the natural logarithm of the product of the number of shares outstanding and share price on 12/31/2007. Days-to-cover is Short interest/Average volume as reported by shortsqueeze.com. Relative short interest is defined as Short interest/Float. Insider holdings is the percentage of shares outstanding held by insiders and Institutional holdings is the percentage of shares outstanding held by institutions (expressed as %). NASDAQ is a binary variable indicating that the major trading venue for the stock is NASDAQ. Options is a binary variable indicating that there are traded option available for the stock. Asymptotic errors are reported in parentheses. *,**,*** indicate significance at the 10, 5, and 1% level, respectively.
Panel A: residual standard deviation Panel B: Analyst forecast dispersion 1 2 3 4 5 6
Explanatory variables Oct 9 Oct 9- Oct 29
Sept 18- Oct 29
Oct 9 Oct 9- Oct 29
Sept 18- Oct 29
Intercept -0.1389***
(0.0446) -0.5648***
(0.0927) -1.0114***
(0.1249) -0.1587***
(0.0570) -0.5782***
(0.1275) -0.9866***
(0.1760)
RSTD 0.1916
(0.2009) -0.3138 (0.3723)
0.6859 (0.5978)
- - -
ADISP - - - 0.1468
(0.4305) -0.9328 (0.6409)
1.2535 (0.9943)
Ln (Mkt capitalization) 0.0087*** (0.0032)
0.0427***(0.0069)
0.077*** (0.0095)
0.0096** (0.0038)
0.0421*** (0.0092)
0.0709***(0.0130)
Alpha 60 -1.8463** (0.7609)
1.8057 (1.8195)
6.7555***(2.6110)
-1.4528 (0.9974)
1.3058 (2.1864)
8.0678** (3.4073)
Alpha 2007 2.4996
(3.2959) -10.5231 (7.2663)
-16.159* (9.4033)
3.1427 (4.3410)
-13.5907 (11.1616)
-11.2912 (12.8101)
Days to cover -0.0004** (0.0001)
0.0005* (0.0003)
0.0021***(0.0005)
-0.0002 (0.0004)
0.002*** (0.0007)
0.0073***(0.0011)
Relative quoted spread 0.4424*** (0.1193)
0.4414* (0.2279)
0.1424 (0.2828)
0.8947***(0.3506)
0.2251 (0.6946)
-0.292 (0.9248)
Dummy: Highest Δrelative quoted spread
ban->after ban -
-0.011 (0.0163)
- - -0.0295 (0.0307)
-
ΔRelative short interest -0.0037 (0.0024)
-0.0093**(0.0046)
-0.0108 (0.0067)
-0.0046* (0.0025)
-0.0082* (0.0049)
-0.006 (0.0071)
Insider holdings 0.0003* (0.0001)
-0.0001 (0.0003)
-0.0002 (0.0004)
0.0002 (0.0002)
0.0001 (0.0006)
-0.0001 (0.0009)
Institutional holdings -0.0002 (0.0001)
0 (0.0003)
-0.0005 (0.0004)
0 (0.0001)
0.0002 (0.0003)
0 (0.0004)
NASDAQ 0.0126
(0.0085) 0.0695***(0.0201)
0.1476***(0.0264)
0.0166* (0.0100)
0.0522** (0.0245)
0.147*** (0.0338)
Options -0.0263** (0.0107)
-0.0786***(0.0248)
-0.1212***(0.0332)
-0.0311***(0.0112)
-0.0793*** (0.0259)
-0.0999***(0.0358)
Dummy: Highest Δrelative quoted spread
pre-ban->after ban - -
-0.0866***(0.0215)
- - -0.1516***
(0.0516)
Adj R-Sq 0.0900 0.1142 0.2898 0.0486 0.1285 0.2855 n 752 746 746 416 415 415
40

Table 7 Regression analysis for subsamples This table presents cross-sectional regressions of abnormal returns on dispersion of opinion and firm characteristics. Panel A measures dispersion of opinion with the residual standard deviation estimated using the market model in the 60 trading days prior the ban. Panel B measures dispersion of opinion with the most recently available analyst forecast dispersion scaled by the stock price on 12/31/2007. Change in relative quoted spread is indicated by a binary variable taking the value of one when the firm is in the highest quartile formed on change in relative quoted spread from before the ban to the ban period. Column 1 uses firms from the bottom 3 quartiles formed on the % of days not traded in the 60 trading days prior the ban. Columns 2 and 3 provide estimates for NYSE & AMEX and NASDAQ listed firms, respectively. Columns 4 and 5 provide estimates for the bottom 4 and top 1 quintile of firms, respectively, where quintiles are formed on Short constraints defined as Institutional holdings/Float – Relative short interest. Abnormal returns are measured using the Fama-French three factor model where the factors are estimated using a portfolio approach. Ln (Mkt capitalization) is the natural logarithm of the product of the number of shares outstanding and share price on 12/31/2007. Days-to-cover is Short interest/Average volume as reported by shortsqueeze.com. Relative short interest is defined as Short interest/Float. Insider holdings is the percentage of shares outstanding held by insiders and Institutional holdings is the percentage of shares outstanding held by institutions (expressed as %). NASDAQ is a binary variable indicating that the major trading venue for the stock is Nasdaq. Options is a binary variable indicating that there are traded option available for the stock. Asymptotic errors are reported in parentheses. *,**,*** indicate significance at the 10, 5, and 1% level, respectively.
Panel A: Residual standard deviation 1 2 3 4 5
Explanatory variables
Frequently traded firms
NYSE & AMEX
NASDAQ Not short
constrained firms (80%)
Short constrained firms (20%)
Intercept -0.6523***
(0.1215) -0.1237 (0.1473)
-0.9505***(0.1229)
-0.4986*** (0.0980)
-0.6322* (0.3582)
RSTD 2.5376*** (0.6444)
1.3646 (1.5990)
2.1696***(0.6030)
1.8846*** (0.7378)
1.8402 (1.1684)
Ln (Mkt capitalization)
0.0459*** (0.0087)
0.0098 (0.0111)
0.0773***(0.0097)
0.0363*** (0.0076)
0.0624** (0.0250)
Alpha 60 0.3554
(2.2716) 2.398
(4.2968) 1.5627
(1.8554) 5.0193** (2.0691)
-4.8434 (4.4951)
Alpha 2007 -2.3841 (8.2236)
-2.7841 (14.4742)
-9.6515 (8.3870)
-0.062 (7.6141)
-1.1047 (14.3107)
Days to cover 0.0036*** (0.0005)
0.0022 (0.0016)
0.0014** (0.0006)
0.0019*** (0.0006)
0.0005 (0.0007)
Relative quoted spread
-1.2046* (0.7008)
-0.6329 (1.0965)
0.2369 (0.2743)
-0.2314 (0.2808)
-3.7613* (2.2628)
Dummy: Highest Δrelative quoted
spread
-0.0328 (0.0258)
-0.2975***(0.0995)
-0.024 (0.0172)
-0.0552*** (0.0164)
0.1355 (0.1029)
ΔRelative short interest
0.0019 (0.0054)
0.0033 (0.0101)
0.0034 (0.0060)
0.0072 (0.0087)
0.0008 (0.0086)
Insider holdings -0.0004 (0.0004)
-0.0001 (0.0007)
-0.0004 (0.0003)
0.0002 (0.0003)
-0.0015 (0.0011)
Institutional holdings -0.0004 (0.0003)
-0.0006 (0.0004)
-0.0001 (0.0003)
-0.0004 (0.0003)
-0.0019 (0.0012)
NASDAQ 0.0827*** (0.0202)
-
-
0.0414** (0.0181)
0.1352*** (0.0475)
Options -0.0509** (0.0226)
0.0231 (0.0313)
-0.0938***(0.0286)
-0.046* (0.0258)
-0.0098 (0.0458)
Adj R-Sq 0.2241 0.0649 0.3111 0.186 0.1128 n 564 210 542 621 131
41

Table 7 Regression analysis for subsamples (cont.)
Panel B: Analyst forecast dispersion 1 2 3 4 5
Explanatory variables
Frequently traded firms
NYSE & AMEX
NASDAQ Not short
constrained firms (80%)
Short constrained firms (20%)
Intercept -0.4621***
(0.1449) -0.2552 (0.1830)
-0.7599***(0.2135)
-0.4339*** (0.1550)
-0.305 (0.4921)
ADISP 3.0562*** (0.8398)
4.5904*** (1.0359)
1.4257 (0.9876)
3.6407*** (0.7794)
-3.443 (2.8284)
Ln (Mkt capitalization)
0.0324*** (0.0104)
0.0165 (0.0132)
0.0625***(0.0160)
0.0302*** (0.0112)
0.0317 (0.0317)
Alpha 60 5.7697** (2.8483)
6.5265** (2.9365)
4.7777** (2.1934)
7.279*** (2.6565)
-0.9527 (3.8704)
Alpha 2007 7.8913
(10.3977) 24.6891
(15.6668) -25.1247**(11.0444)
12.0248 (10.8605)
-34.9081 (30.7223)
Days to cover 0.0052*** (0.0011)
0.0051*** (0.0019)
0.0055***(0.0012)
0.0057*** (0.0017)
0.001 (0.0014)
Relative quoted spread
-1.4748 (1.1316)
-4.8238 (5.1266)
-0.7998 (0.9563)
-1.3311 (0.8506)
0.8827 (5.5477)
Dummy: Highest Δrelative quoted
spread
0.0139 (0.0452)
-0.4595***(0.1573)
0.0499 (0.0388)
-0.0066 (0.0328)
0.2249 (0.1592)
ΔRelative short interest
0.0021 (0.0057)
-0.0012 (0.0103)
0.0128* (0.0074)
0.0108 (0.0081)
0.007 (0.0121)
Insider holdings -0.0001 (0.0006)
0.001 (0.0011)
-0.001 (0.0006)
0 (0.0006)
0.0007 (0.0014)
Institutional holdings -0.0002 (0.0003)
-0.0003 (0.0004)
-0.0001 (0.0005)
-0.0002 (0.0003)
-0.0002 (0.0015)
NASDAQ 0.0909*** (0.0240)
-
-
0.0682*** (0.0255)
0.0858* (0.0521)
Options -0.0229 (0.0252)
0.0136 (0.0342)
-0.0453 (0.0342)
-0.0273 (0.0309)
0.0246 (0.0515)
Adj R-Sq 0.202 0.2276 0.2917 0.2303 0.016 n 404 172 244 315 101
42
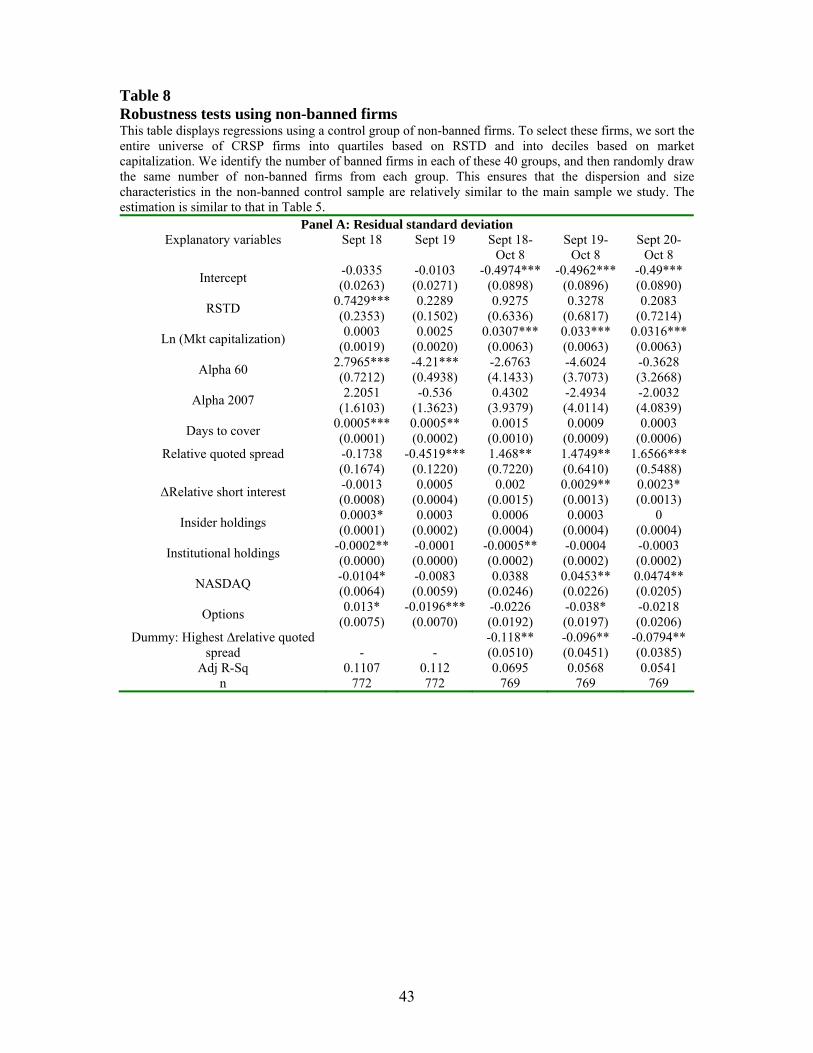
Table 8 Robustness tests using non-banned firms This table displays regressions using a control group of non-banned firms. To select these firms, we sort the entire universe of CRSP firms into quartiles based on RSTD and into deciles based on market capitalization. We identify the number of banned firms in each of these 40 groups, and then randomly draw the same number of non-banned firms from each group. This ensures that the dispersion and size characteristics in the non-banned control sample are relatively similar to the main sample we study. The estimation is similar to that in Table 5.
Panel A: Residual standard deviation Explanatory variables Sept 18 Sept 19 Sept 18-
Oct 8 Sept 19-
Oct 8 Sept 20-
Oct 8
Intercept -0.0335 (0.0263)
-0.0103 (0.0271)
-0.4974***(0.0898)
-0.4962*** (0.0896)
-0.49***(0.0890)
RSTD 0.7429***(0.2353)
0.2289 (0.1502)
0.9275 (0.6336)
0.3278 (0.6817)
0.2083 (0.7214)
Ln (Mkt capitalization) 0.0003
(0.0019) 0.0025
(0.0020) 0.0307***(0.0063)
0.033*** (0.0063)
0.0316***(0.0063)
Alpha 60 2.7965***(0.7212)
-4.21*** (0.4938)
-2.6763 (4.1433)
-4.6024 (3.7073)
-0.3628 (3.2668)
Alpha 2007 2.2051
(1.6103) -0.536
(1.3623) 0.4302
(3.9379) -2.4934 (4.0114)
-2.0032 (4.0839)
Days to cover 0.0005***(0.0001)
0.0005** (0.0002)
0.0015 (0.0010)
0.0009 (0.0009)
0.0003 (0.0006)
Relative quoted spread -0.1738 (0.1674)
-0.4519***(0.1220)
1.468** (0.7220)
1.4749** (0.6410)
1.6566***(0.5488)
ΔRelative short interest -0.0013 (0.0008)
0.0005 (0.0004)
0.002 (0.0015)
0.0029** (0.0013)
0.0023* (0.0013)
Insider holdings 0.0003* (0.0001)
0.0003 (0.0002)
0.0006 (0.0004)
0.0003 (0.0004)
0 (0.0004)
Institutional holdings -0.0002**(0.0000)
-0.0001 (0.0000)
-0.0005**(0.0002)
-0.0004 (0.0002)
-0.0003 (0.0002)
NASDAQ -0.0104*(0.0064)
-0.0083 (0.0059)
0.0388 (0.0246)
0.0453** (0.0226)
0.0474**(0.0205)
Options 0.013*
(0.0075) -0.0196***
(0.0070) -0.0226 (0.0192)
-0.038* (0.0197)
-0.0218 (0.0206)
Dummy: Highest Δrelative quoted spread
-
-
-0.118** (0.0510)
-0.096** (0.0451)
-0.0794**(0.0385)
Adj R-Sq 0.1107 0.112 0.0695 0.0568 0.0541 n 772 772 769 769 769
43

Panel B: Analyst forecast dispersion
Explanatory variables Sept 18 Sept 19 Sept 18- Oct 8
Sept 19- Oct 8
Sept 20- Oct 8
Intercept 0.0256
(0.0447) 0.0555
(0.0430) -0.3832***
(0.1063) -0.4257***
(0.1033) -
0.4657***(0.1071)
ADISP 0.2573
(0.1649) 0.0229
(0.1941) -0.2449 (0.5594)
-0.4668 (0.5145)
-0.4125 (0.6019)
Ln (Mkt capitalization) -0.0036 (0.0030)
-0.0024 (0.0028)
0.0235***(0.0073)
0.0284*** (0.0071)
0.0302***(0.0074)
Alpha 60 2.2198***(0.7535)
-3.8033***(0.6307)
0.15 (2.2403)
-1.8449 (2.2300)
1.0896 (2.5791)
Alpha 2007 7.8299***(1.8596)
-0.301 (1.9033)
-1.2872 (5.0664)
-9.1253* (5.3441)
-8.9203 (5.6452)
Days to cover 0.0013***(0.0003)
0 (0.0003)
0.0015* (0.0009)
0.0003 (0.0008)
0.0004 (0.0009)
Relative quoted spread -0.4461 (0.5809)
-0.1402 (0.2819)
-0.1679 (0.8540)
0.1584 (0.6335)
0.4737 (0.7094)
ΔRelative short interest -0.0006 (0.0009)
0.0006 (0.0004)
0.0004 (0.0016)
0.0007 (0.0014)
0.0003 (0.0014)
Insider holdings 0.0003
(0.0002) 0.0004
(0.0003) 0.0009
(0.0006) 0.0007
(0.0006) 0.0003
(0.0006)
Institutional holdings 0
(0.0000) 0
(0.0000) -0.0002 (0.0002)
-0.0002 (0.0002)
-0.0002 (0.0002)
NASDAQ -0.0055 (0.0070)
-0.0024 (0.0083)
0.0378* (0.0209)
0.047** (0.0208)
0.0471**(0.0212)
Options 0.0205**(0.0087)
-0.0105 (0.0078)
-0.013 (0.0211)
-0.0366* (0.0206)
-0.0267 (0.0208)
Dummy: Highest Δrelative quoted spread
-
-
-0.0644* (0.0390)
-0.0607* (0.0369)
-0.0715*(0.0377)
Adj R-Sq 0.1246 0.0902 0.0493 0.0414 0.0593 n 444 444 443 443 443
44

Figure 1 Buy-and-hold abnormal returns partitioned by dispersion of investor opinion (Residual standard deviation) This figure displays average buy-and-hold abnormal returns of firm in the highest and lowest quartile of residual standard deviation. Abnormal returns are measured using the Fama-French three factor model where the factors are estimated using a portfolio approach.
Figure 2 Buy-and-hold abnormal returns partitioned by dispersion of investor opinion (Analyst forecast dispersion) This figure displays average buy-and-hold abnormal returns of firm in the highest and lowest quartile of analyst forecast dispersion. Abnormal returns are measured using the Fama-French three factor model where the factors are estimated using a portfolio approach.
45