
Short-lived Climate Pollutants (SLCPs) - eib.org · 1 Short-lived Climate Pollutants (SLCPs) An...
52
Short-lived Climate Pollutants (SLCPs) An analysis of the EIB’s policies, procedures, impact of activities and options for scaling up mitigation efforts November 2016
-
Upload
phungkhanh -
Category
Documents
-
view
224 -
download
0
Transcript of Short-lived Climate Pollutants (SLCPs) - eib.org · 1 Short-lived Climate Pollutants (SLCPs) An...
Short-lived Climate Pollutants (SLCPs) An analysis of the EIB’s policies,
procedures, impact of activities and options for scaling up mitigation efforts
November 2016

1
Short-lived Climate Pollutants (SLCPs) An analysis of the EIB’s policies, procedures, impact of activities
and options for scaling up mitigation efforts
November 2016

2
Contents
List of abbreviations and acronyms.................................................................................................... 3
List of tables and figures .................................................................................................................. 4
Acknowledgements ......................................................................................................................... 4
Message VP Taylor ......................................................................................................................... 5
Executive Summary ......................................................................................................................... 6
1. Introduction .......................................................................................................................... 10
1.1 Why this report? - Objectives ......................................................................................................... 10 1.2 Limitations ..................................................................................................................................... 11 1.3 Structure ....................................................................................................................................... 11 1.4 Disclaimer ..................................................................................................................................... 12
2. What Are SLCPs? ................................................................................................................... 12
3. Impacts of SLCPs and benefits of mitigation ............................................................................... 13
3.1 Benefits to Climate ........................................................................................................................ 14 3.2 Benefits to Health & Ecosystems ..................................................................................................... 15
4. The Four Main SLCPs ............................................................................................................. 16
4.1 Methane ....................................................................................................................................... 16 4.2 Tropospheric Ozone ...................................................................................................................... 17 4.3 Black carbon ................................................................................................................................. 18 4.4 Hydrofluorocarbons ....................................................................................................................... 19
5. Policy Framework................................................................................................................... 20
5.1 International level .......................................................................................................................... 20 5.2 EU level ........................................................................................................................................ 21 5.3 International Actors ....................................................................................................................... 24
6. EIB and SLCPs ....................................................................................................................... 25
6.1 Mitigation of climate and air pollutants at EIB to date ..................................................................... 25 6.2 Standards & Criteria on GHG and air pollution - SLCPs at EIB ....................................................... 26 6.3 Understanding the impact of EIB’s lending activities on SLCP emissions & Financing of SLCP mitigating projects ............................................................................................................................... 28 6.3.1 Methodology.............................................................................................................................. 28 6.3.2 Overview of SLCP-relevant financing at EIB ................................................................................. 31 6.3.3 The Energy Sector ...................................................................................................................... 32 6.3.4 Waste management – Solid Municipal Waste .............................................................................. 35 6.3.5 Wastewater ................................................................................................................................ 40 6.3.6 Transport ................................................................................................................................... 42 6.3.7 Agriculture ................................................................................................................................. 44 6.3.8 Industry ...................................................................................................................................... 44
109. Outlook ............................................................................................................................. 46
References ................................................................................................................................... 48

3
LIST OF ABBREVIATIONS AND ACRONYMS
AD Anaerobic Digestion AR5 IPCC fifth assessment report BAT Best Available Technologies BC Black Carbon CCAC Climate and Clean Air Coalition CH4 Methane CLTRAP Convention on Long Range Transboundary Air Pollution CO2 Carbon dioxide CO2-eq. Carbon dioxide equivalent DPF Diesel Particle Filter EC European Commission EEA European Environment Agency EIB European Investment Bank EPS Emissions Performance Standard EU European Union GWP Global Warming Potential HCFC Hydrochlorofluorocarbons HDV Heavy duty vehicle HFCs Hydrofluorocarbons IEA International Energy Agency IPCC Intergovernmental Panel on Climate Change JRC EU Joint Research Centre LLGHG Long-lived greenhouse gases MARPOL The International Convention for the Prevention of Marine Pollution from Ships MBT Mechanical and Biological Treatment MDB Multilateral Development Banks MP Montreal protocol MSW Municipal solid waste NEC EU National Emissions Ceilings NMVOC Non-Methane Volatile Organic Compounds NOx Nitrogen oxides O3 Tropospheric or ground-level ozone OC Organic carbon ODS Ozone depleting substances PE Polyethylene PM Particulate matter SLCPs Short-lived climate pollutants SO2 Sulphur dioxide UNEP United Nations Environment Programme UNFCCC United Nations Framework Convention on Climate Change USEPA U.S. Environmental Protection Agency WTE Waste-to-energy

4
LIST OF TABLES AND FIGURES
Table 1: Overview of properties of SLCPs in comparison to CO2
Table 2: Overlap between 16 selected UNEP/WMO measures and EIB activities
Table 3: Relative emissions (avoided emissions) from SLCP-relevant projects
ACKNOWLEDGEMENTS
Lead: Stefanie Lindenberg; Expert contributors: Peter Anderson, Matthew Arndt, Elena Campelo Aubarell, Edward Calthrop, Esther Badiola, Jonas Bystroem, Patrick Dorvil, Eva Krampe, Susanna Lagarto, Latina Percheva, Piers Vickers, Nancy Saich, Violaine Silvestro.
Layout and linguistics: Laetitia Prando, Kyla Richardson.
The team would also like to thank the CCAC for its support, namely Yekbun Gurgoz and James Morris.

5
Message VP Taylor
In September 2015 the European Investment Bank issued its first comprehensive Climate Strategy, which guides the Bank’s Climate Action with the aim of contributing to keeping global warming well below 2 degrees Celsius and adapting to climate change impacts.
Building on a strong track record in the area of climate action and being one of the largest climate financiers globally, we are eager to explore new avenues to understand how to increase the positive impact of our projects and of our financing operations.
When I heard about the potential of SLCPs to mitigate near-term climate change and simultaneously deliver immediate benefits to human health and the environment, I had no hesitation about the Bank joining the Climate and Clean Air Coalition. We are committed to exploring the impact of the EIB’s projects on SLCP emissions and how we can address SLCPs in our financing operations, as well as raising awareness of this issue across the Bank.
I am very pleased to share with you this report, which presents an analysis of SLCPs in the EIB’s project portfolio.
I wish you an interesting read.
Jonathan Taylor

6
EXECUTIVE SUMMARY
1. The European Investment Bank (EIB) is the European Union’s bank and supports EU policy
objectives through its financing activities, both inside and outside the EU. One of the EU’s key
policy objectives, and hence a key objective for the EIB, is addressing climate change. The EIB is
one of the largest financiers of climate action globally with around EUR 110 billion of lending
between 2010 and 2015. Building on its achievements in the field of climate action to date, the
Bank published its first Climate Strategy in the autumn of 2015. The aim of the Climate Strategy is
to further fine-tune the Bank’s climate action activities, to explore new avenues to address climate
change and increase the positive impact of its investments.
2. Addressing the emissions of short-lived climate pollutants (SLCPs) – methane (CH4), ground-level
ozone (O3), black carbon (BC) and some hydrofluorocarbons (HFCs) – can contribute substantially
to tackling near-term climate change. A joint report by the United Nations Environment Programme
(UNEP) and the World Meteorological Organization (WMO) published in 2011 found that tackling
SLCPs could reduce near-term global warming by 0.4 to 0.5°C before 2050. Thus, mitigating
SLCPs could contribute towards achieving the international community’s objective of keeping the
rise in global mean temperatures well below 2°C. To deliver the Paris Agreement will require
substantial reductions in carbon dioxide (CO2) emissions and this must be a key focus for the EIB.
Yet, delivering reductions in SLCPs can make a vital contribution to reducing near-term climate
change. The Bank recognises that to address the significant challenges faced, all opportunities that
contribute to reductions in greenhouse gas (GHG) emissions must be carefully considered. In
addition, some SLCPs are also air pollutants with a negative impact on human health and
ecosystems. The World Health Organization (WHO) estimates that 3.1 million people (WHO,
2009), mostly in developing countries, die prematurely each year from indoor and outdoor air
pollution. Full implementation of all measures to mitigate SLCPs could prevent, each year, more
than 2.4 million pre-mature deaths and the loss of 52 million tonnes of crops (1-4 percent of the
global production of maize, rice, soybeans and wheat yearly (WMO/UNEP, 2001)). In Europe, air
pollution is also an issue. A study by the consultancy Aphekom (2013) concluded that reducing
annual average levels of fine particulate matter (PM2.5) to the WHO guideline levels (10ugm)
would result in gains in average life expectancy ranging from: 22 months on average per person in
Bucharest, 19 months in Budapest, to 2 months in Malaga.
3. In line with the EIB’s ambition to fine tune its climate action and in view of the substantial potential
to reduce global warming in the near-term, it was decided to raise awareness of the potential for
addressing SLCPs internally, to gain a better understanding of the impacts of the Bank’s lending
activities on the emissions of SLCPs and to review whether considerations for SLCPs are consistently
integrated into our lending criteria and standards. To explore these questions further, this report
takes two approaches:
a. The first looks at the Bank’s standards, criteria and procedures in relation to SLCPs;

7
b. The second looks at projects and sectors that the Bank finances, the impacts they have on the
emission of SLCPs and whether the Bank could scale up the financing of projects which mitigate
emissions of SLCPs.
4. The report has looked at the Bank’s procedures, criteria and standards with the aim of
understanding whether SLCPs are appropriately taken into account. In an organization such as the
EIB which mainly responds to financing requests from project developers, “procedures”, “standards”
and “criteria” are among the most powerful tools to influence the quality and the type of projects
financed.
The Bank’s cost benefit analysis (CBA) puts a cost on a number of pollutants (e.g. nitrogen oxide,
nitrous oxide, ammonia etc.) directly related to the projects under appraisal (upstream or
downstream emissions are normally not included). The external costs caused by emissions of fine
particulate matter (PM2.5) are already included in the CBA for projects in the energy sector. An area
where fine particulate matter (PM2.5) and its component black carbon are, however, not yet
integrated and priced into the project costs is in the transport sector. Transport is one of the sectors
with the highest impact on PM2.5 emissions and it is hence important that the costs caused by PM2.5
emissions are internalised into the costs of transport projects.
5. The second approach is to explore projects financed by the Bank, the impact they have on SLCP
emissions, and finally whether the Bank should and could finance more projects that have a positive
impact on mitigating the emissions of SLCPs. To this end the report looked at several sectors which
the joint UNEP/WMO report suggested were among those with the highest impact on SLCP
emissions and where the highest savings could be achieved. The report includes analysis of the
projects in the suggested sectors by looking at the available carbon footprint data of projects for six
years between 2009 and 2014. The data from the carbon footprint exercise has, however, only a
limited informative value for the emissions of SLCPs. The carbon footprint exercise provides data on
significant1 absolute (gross) and significant relative (net i.e. saved, reduced or avoided) CO2-eq.
emissions of a project. While the data usually provides precise information on the expected
emissions of an SLCP, for example when a project only emits significant amounts of methane, for
other projects the data can include methane as well as CO2 and other GHGs, making the
1 Emissions above 100,000 kt CO2-eq/year.
The report found not only that most SLCPs are taken into account in the Bank’s project appraisal and monitoring exercises, but that SLCPs are also considered in the decision making process on eligibility for financing, which means that projects where the CO2-eq. of SLCP emissions is above a certain threshold do not receive the Bank’s support.
Therefore the Bank will work towards the inclusion of the external costs caused by PM2.5 into the CBA for transport projects, if considered of value.

8
information on the specific SLCP emissions less clear. For some projects or sectors the available
emissions data can only be considered a surrogate for SLCP emissions, e.g. in the transport sector
where the data consists of CO2 emissions and only allows for an approximate estimate of PM2.5 and
black carbon emissions. In addition, for some sectors, the carbon footprint exercise is a relatively
new exercise and the availability and consistency of the data still requires refinement.
In addition to the caveats mentioned above, the results of the carbon footprint exercise indicating
potential SLCP reductions need to be considered together with the financing volumes of projects in
the respective sectors. In particular, due to their large financing volumes, gas network refurbishment
projects, and transport projects, show overall a much larger saving of SLCPs than that of projects in
sectors which might have been expected, for example the solid waste sector.
6. However, looking only at the carbon footprint of projects fails to provide a comprehensive picture of
the impact of SLCP-relevant projects. Therefore, the report also describes SLCP-relevant projects
from a more qualitative angle.
7. With respect to scaling up the financing of projects that contribute to mitigating SLCPs, the Bank is
prepared to finance more projects in all of the sectors in which it is currently active and which have
been identified as contributing to reducing SLCPs. However, demand for investments in projects in
these sectors largely depends on factors which are outside of the Bank’s sphere of influence, i.e. the
regulatory framework and general market demand.
8. In comparison to other EIB-financed projects that contribute to the mitigation of greenhouse gases
(GHGs), the climate-mitigation effect of SLCP-relevant projects is currently moderate. Yet,
addressing SLCPs is an excellent way to complement other mitigation efforts made by the Bank, and
simultaneously contributes towards improving local air quality, and thus positively impacts on the
health of local populations and ecosystems.
Bearing these restrictions of methodology in mind, the analysis suggests that, among SLCP-relevant projects financed by the Bank between 2009 and 2014, replacing old gas pipelines, and thus reducing methane leakages, is the sector where the highest direct savings in SLCP emissions (methane) were demonstrated.
The findings of this analysis pointed to the fact that waste and waste-water projects for example not only contribute consistently to emission savings, but also have positive impacts on the environment (e.g. water and soil quality), on the health of the local population, as well as on the economy by increasing resource efficiency. Finally, waste and waste-water projects seem to be an area where the EIB can particularly add value.
The Bank will continue to explore whether specific funding for SLCP-relevant projects could support the objectives of the Bank’s climate strategy during its implementation phase.

9
9. Exploring the relationship between SLCPs and the EIB’s activities has contributed to raising
awareness internally about emissions of SLCPs, as well as the benefits of mitigating these
substances. The analysis has shed light on additional opportunities to contribute to mitigating
climate change which the Bank has not explored to date.
Integrating the findings of this report will contribute to the objectives set out in the Climate Strategy, further refine the Bank’s approach to climate action and support continued focus on reducing air pollution.
10
1. Introduction
1.1 Why this report? - Objectives
1. Addressing short-lived climate pollutants (SLCPs) has important potential to mitigate both air
pollution and near-term climate change. A joint report by the United Nations Environment
Programme (UNEP) and the World Meteorological Organization (WMO) (UNEP/WMO, 20111)
found that by implementing a set of measures by 2030 mitigating SLCPs could reduce global
warming by 0.5 ˚C by 2050 and thus support the international community’s target of keeping
global mean temperatures well below 2 ˚C. In contrast, even a fairly aggressive strategy to reduce
carbon dioxide (CO2) emissions under the (CO2) measures scenario will do little to mitigate near-
term climate change by 2050. Slowing down near-term climate change reduces the risk of
triggering “knock-on effects”, changes in weather patterns and allows more time to adapt to the
impacts of climate change.
2. Two SLCPs – black carbon (BC) and tropospheric ozone (O3) – are not only climate forcers, but
also air pollutants with detrimental impacts on human heath, ecosystems and vegetation, in
particular global crop production. The World Health Organization (WHO) estimates that 3.1
million people (WHO, 2009) die prematurely each year from indoor and outdoor air pollution
caused by BC, O3 and other air pollutants. More recently, a report by the World Health
Organization (WHO, 2014)2 estimates that 7 million premature deaths were linked to air pollution
in 2012 – these findings more than double previous estimates. In addition, the UNEP/WMO report
(2011) suggests that implementing a set of measures by 2030 would avoid annual losses from four
major crops of approximately 32 million tonnes (range of 21-57 million tonnes) each year after
2030 when all measures have been implemented.
3. This means mitigating this group of substances referred to as short-lived climate pollutants (SLCPs)
not only offers benefits for the climate, but also to human health, and vegetation and thus global
food security. In view of this important potential a number of governments, international
organizations and non-governmental organizations created a voluntary international coalition in
2012, the Climate and Clean Air Coalition (CCAC) in order to address SLCPs. In 2013 the EIB
joined the coalition, which is led by the United Nations Environment Programme (UNEP), and
committed to supporting the coalition’s objectives.
4. To gain a better understanding of how the EIB can support and contribute to mitigating SLCP
emissions, achieving the CCAC’s objectives and creating a basis from which to work, the Bank
decided to prepare this report. The report has the following key objectives:
• To raise awareness inside the Bank about the benefits and the potential of mitigating SLCPs,
• To assess whether the Bank’s standards and criteria appropriately consider SLCPs,

11
• To develop an improved understanding of the impacts of the EIB’s activities with respect to
emissions of SLCPs,
• To identify potential opportunities for the EIB to address and mitigate SLCPs,
• To communicate to the Bank’s counterparts what EIB can offer to more effectively match the
interests of the Bank and potential project developers willing to address SLCPs.
5. More generally, the EIB is keen to understand where and how it can employ its financial and
technical in-house expertise to contribute to mitigating air- and climate polluting SLCPs.
1.2 Limitations
6. In supporting the mitigation of SLCPs the European Investment Bank is subject to the following
limitations:
• The European Investment Bank is not a policy-setting institution, but a bank which largely
responds to demands for financing economically viable projects 2. As the EU’s bank and a not-
for profit bank the EIB is, however, distinct from commercial banks and offers a range of
benefits. These include providing in-house technical expertise and assistance during project
preparation and implementation, and providing concessional loans or blending grants and
loans.
• Developing countries offer the highest potential for mitigating SLCPs, especially countries in
Africa and Asia. As the EU’s investment bank, 90 percent of EIB’s lending goes to projects inside
the EU and 10 percent to projects outside the EU. At first, this could lead to the assumption that
the Bank’s impact outside the EU is marginal. However, due to the large total lending volumes
of the Bank, investments outside the EU can still be considered important: in 2013 the Bank lent
a total of EUR 7.6 billion to projects outside the EU 28, of which more than 30 percent, or EUR
2.3 billion, was invested in climate action projects.
1.3 Structure
7. The report is structured as follows. Chapters two and three provide background information on
SLCPs, their impacts on the climate, human health and ecosystems, and the benefits of mitigation.
Chapter four discusses the four main SLCPs in more depth. Building on this information, chapter
five looks at the policy framework at the international and EU level, as well as the international
actors active in addressing SLCPs. Chapter six explores the impacts of the EIB’s activities on the
emissions of SLCPs in different sectors and the potential for mitigating action in these sectors. It
identifies those areas and sectors where the Bank has the highest impact on mitigating SLCPs and
2 “Economically viable” as defined by the Bank

12
sectors with a potential for stepping up action. The outlook summarises the key findings and
messages of this report.
1.4 Disclaimer
8. Descriptions of potential projects are provided to demonstrate to the interested audience (e.g.
municipalities, cities, private developers, etc.) the type of services that the Bank can offer. Yet, a
finance contract would be subject to the economic viability of the project, the compatibility with the
Bank’s standards and criteria.
2. What Are SLCPs?
9. Climate change is principally caused by the emission of greenhouse gases 3. Carbon dioxide (CO2)
is the single most significant greenhouse gas and the most important cause of global warming.
Carbon dioxide (CO2) makes up for approximately 76 percent of anthropogenic greenhouse gas
emissions globally, followed by methane (CH4) responsible for approximately 16 percent and
nitrous oxide (N2O) responsible for approximately 6 percent of global greenhouse gas emissions
(IPCC, 2014, in US EPA3). Another important property of carbon dioxide (CO2) is that it remains in
the atmosphere for a comparatively (in human terms) long time – between a hundred and a
thousand years. (80 percent of CO2 emissions will stay in the atmosphere for around 100 years, the
remaining 20 percent for on average 800 years). This means that CO2 emitted today will continue
to impact the climate in many centuries to come and will be inherited by future generations. For this
reason CO2 is also referred to as a long-lived greenhouse gas (LLGHG) or climate pollutant.
10. In contrast to carbon dioxide (CO2) and other long-lived greenhouse gases (e.g. nitrous oxide
(N2O) life-time of approx. 120 years) there is a group of ‘short-lived climate gases or pollutants’
(SLGHGs or SLCPs). This report will refer to ‘Short-Lived Climate Pollutants’, because the report
also explores the climate forcing impact of black carbon (BC) which is not a greenhouse gas, but
particles which warm the atmosphere by changing the surface albedo. Short-lived climate pollutants
remain in the atmosphere for between a couple of days and up to just over a decade. Even though
SLCPs have a relatively short atmospheric lifetime, they have a significant warming potential which
is often a multiple of that of carbon dioxide (CO2) and are hence powerful warming agents (see
table 1). Up until recently SLCPs have received little attention, despite the fact that they make up
approximately 30 percent of climate pollutants emitted globally.
11. The main SLCPs include black carbon (BC), a substantial part of particulate matter (PM2.5), methane
(CH4) and ground-level ozone (O3). Other SLCPs include a number of hydrofluorocarbons (HFCs).
While the share of HFCs in the mix of GHGs is currently very low (less than 1%), it is expected that
3 Black carbon also causes warming, but is not a greenhouse gas. Warming mechanisms will be described further below.

13
their emissions may increase by as much as 19% of global GHGs emissions by 2020 (CCAC). All
SLCPs have a potential to warm the atmosphere, also referred to as the ‘global-warming potential
(GWP)’, more potent than that of CO2. The potential to warm the atmosphere or the global-
warming potential (GWP) of greenhouse gases or particulate matter is expressed as a factor of
carbon dioxide (CO2) whose GWP is standardised at 1. Methane, for example, has a GWP of 28
over a 100-year time horizon (Myhre et al, 20134) which means its warming potential is 28 times
more powerful than that of carbon dioxide (CO2).
12. Single air pollutants and/or climate forcers have been policy issues for a long time and started to be
addressed over thirty years ago. One of the first major and internationally binding agreements
addressing air pollution was, for example, the Geneva Convention on ‘Long-range, Transboundary
Air Pollution’ (CLRTAP) signed in 1979. A number of other initiatives and agreements addressing
individual air pollutants, including some of the substances labelled as SLCPs today, followed.
However, addressing the four substances: methane, black carbon, ozone and HFCs as a group and
labelling them as “SLCPs” is relatively new and dates back to the publication of two seminal reports
in 2011: ‘The Integrated Assessment of Black Carbon and Tropospheric Ozone’ published by the
United Nations Environment Programme (UNEP) and the World Meteorological Organization
(WMO) and the publication of “Near-term Climate Protection and Clean Air Benefits: Actions for
Controlling Short-Lived Climate Forcers” published by UNEP the following year. In 2012 the
‘Climate and Clean Air Coalition’ (CCAC) was founded and has since then taken the lead in
addressing the group of substances labelled as SLCPs.
3. Impacts of SLCPs and benefits of mitigation
13. Deep and immediate carbon dioxide (CO2) reductions are required to protect the long-term
climate, as this cannot be achieved by addressing SLCPs alone. Measures to reduce SLCP emissions
can complement CO2 emissions reduction measures. Yet emission reduction measures targeting
black carbon and ozone precursors would pay off in only a few years’ time and have an immediate
beneficial effect on health, climate, water and food security as well as ecosystems.
14. Near-term reduction of global warming is not only necessary to keep temperature increases within
the 2°C target, but will also bring substantial benefits by slowing down the melting in the Arctic, the
Himalayas and other glaciated and snow-covered regions which could trigger unforeseeable knock-
on effects. Reducing exposure to air pollution will directly reduce negative impacts on human
health. It also has to be recognized that carbon dioxide reduction strategies and strategies to abate
SLCPs mostly target different sectors or areas which means that action in one area does not have to
be traded against action in another area, but that efforts to mitigate carbon dioxide and SLCPs
emissions can be complementary to each other.

14
3.1 Benefits to Climate
15. Since the start of industrialization the world has warmed by about 0.85 degrees C (AR5 IPCC,
2013) and the average global mean temperature is expected to rise by at least 2˚C from pre-
industrial levels by 2050. Temperatures in Europe have been rising even faster than the global
average. Over the last 30 years the average mean temperature in Europe rose by 0.48˚C whereas
the average global temperature rose by 0.27˚C (IPCC). Due to its long atmospheric lifetime and
the amounts emitted, carbon dioxide (CO2) is considered the most important greenhouse gas, for
which emissions reductions must be prioritised in order to mitigate the rise of global temperature
over the long term. However, some of the SLCPs, even though they remain in the atmosphere only a
relatively short time, are extremely powerful GHGs with GWPs which can be up to a thousand times
higher than that of CO2 (IPCC, 2007). Mitigating SLCP emissions, is hence estimated to have the
potential to limit near-term climate change and increase the chances of keeping temperatures well
below 2 °C relative to pre-industrial levels as agreed in the framework of the UNFCCC. Two studies
from UNEP/WMO estimate that implementing a number of suggested measures by 2030, would
reduce global warming by between 0.4˚C (UNEP 2011) and 0.5˚C (UNEP/WMO, 2011). In
contrast, even very ambitious measures to mitigate CO2 would do little to mitigate warming over the
next 20 -30 years (UNEP/WMO, 2011). The report ‘Integrated Assessment of Black Carbon and
Tropospheric Ozone’ (UNEP/WMO, 2001a) suggests that measures agreed by the international
community to mitigate carbon dioxide (CO2) alone, will most likely not be sufficient to keeping the
global temperatures increase to less than 2 °C.
16. In addition to keeping temperatures well below the 2˚C target, mitigating near-term climate change
could also avoid potentially dangerous “tipping points”, i.e. thresholds of abrupt and irreversible
change in important climatic systems (Molina et al., 2009). Such “tipping points” and abrupt
transitions could be triggered through knock-on effects. The risk of abrupt or irreversible changes
increases with the magnitude of warming increases (IPCC, 2013). For example, the release of
further carbon from melting arctic ice and permafrost could lead to an accelerated melting and
other knock-on effects. Finally, reducing near-term climate change could help reduce the extinction
of species and loss of biodiversity.
17. Whilst reducing SLCPs offers an important opportunity to reduce the rate of warming in the coming
decades, it has to be acknowledged that over the long term, mitigating SLCPs only makes a modest
contribution to climate change mitigation.
Full implementation of all SLCP mitigation measures suggested by WMO/UNEP by 2030, is estimated to reduce global warming projected for 2050 by between
0.4˚C (UNEP 2011) and 0.5˚C (UNEP/WMO, 2011)
15
3.2 Benefits to Health & Ecosystems
18. In addition to being climate forcers, some of the SLCPs are also air pollutants with a negative
impact on human health and ecosystems. The World Health Organization (WHO) estimates that
3.1 million people (WHO, 2009), mostly in developing countries, die prematurely each year from
indoor and outdoor air pollution. The main air pollutants include sulphur dioxide (SO2), nitrogen
oxides (NOx) non-methane volatile organic compounds (NMVOCs), ammonia (NH3), carbon-
monoxide (CO), lead, ground-level ozone (O3), and particulate matter/black carbon (PM/BC), not
all of which are SLCPs. Particulate matter (PM) and ground-level ozone (O3) are associated with
serious health risks in particular. Methane, though not an air pollutant in itself, is a precursor to
ground-level ozone.
19. Exposure to ground-level ozone (O3) can harm human health leading to impacts ranging from
minor effects such as irritation of the eyes, nose, throat and respiratory symptoms, such as coughing
and shortness of breath to more serious impacts such as a decrease in lung function and respiratory
symptoms, aggravated asthma and eventually premature mortality (EEA, 2012)5. The EU’s
‘Thematic strategy on air pollution’ estimates that there will be around 21,000 cases of premature
mortality in 2020 in the EU because of elevated ozone levels.
20. Ground-level ozone (O3) is equally toxic to plants and damages ecosystems. It harms vegetation by
damaging leaves, reducing photosynthesis, impairing plant reproduction and growth, reducing
plants’ uptake of carbon dioxide (CO2) and decreasing crop yields. In fact, ground-level ozone is
the air pollutant most responsible for reducing crop yields, and thus affecting global food security.
One study estimates, for example, that yields of wheat, soybeans and maize could be reduced by
up to 26% globally in 2030 should O3 emissions continue to increase (S. Avnery et al.6). The study
“Integrated Assessment of Black Carbon and Tropospheric Ozone”, suggests that by cutting
ground-level ozone and its precursor gases 32 million tonnes (range of 21-57 million tonnes) of
annual crop losses could be avoided (UNEP/WMO, 2011).
21. Particulate matter (PM2.5) and its sooty component, black carbon are also responsible for causing
asthma attacks, bronchitis, sinus infections and a reduction of general life expectancy. Whereas
larger particles such as PM10 can be filtered in the nose and upper lungs, it is in particular the
smallest particulate matter, PM2.5 which is too small to be filtered. They enter not only through the
respiratory system, but also through the human skin. Supported by the GAINS (Greenhouse gas-air
pollution Interactions and Synergies) model it is estimated that in 2005 European average statistical
life expectancy was shortened by 8.5 months due to the exposure to fine particulate matter (Amann
Full implementation of all measures to mitigate SLCPs could prevent more than 2.4 million premature deaths and the loss of 52 million tonnes of crops, (1-4 percent of the global
production of maize, rice, soybeans and wheat) each year (WMO/UNEP, 2001)

16
CH4
et al., 20147). According to a study by
Aphekom (Aphekom, 20138) reducing
annual average levels of PM2.5 to the
World Health Organization (WHO)
guideline levels (10ugm) would result in
possible gains in average life
expectancy ranging from 22 months on
average per person in Bucharest, and
19 months in Budapest, to 2 months
in Malaga, and half a month in
Dublin. At a global level it is estimated that reducing SLCPs by implementing the 16 measures
suggested by UNEP/WMO (UNEP/WMO, 2011) targeting methane and black carbon could
prevent more than 2 million premature deaths annually from outdoor and indoor air pollution by
2030.
22. While air pollution is a transboundary issue and pollutants emitted in one country or continent can
be carried over long distances, addressing SLCPs is considered to have direct impacts on the
improvement of local and regional air quality as well as local weather patterns.
4. The Four Main SLCPs
4.1 Methane
23. Methane (CH4) is a hydrocarbon and the primary component of natural gas. Methane is also a
potent greenhouse gas. Its GWP over a 100-year time span is 28 times higher than that of the
greenhouse gas carbon dioxide. In contrast to CO2, however, it has a comparatively short life time
of only 12 years. Methane is the second most abundant GHG after CO2 accounting for 16% of
global emissions (US EPA). Methane emissions do not cause direct harm to human health,
agriculture or ecosystems. Yet, methane is one of the most
prominent precursor gases to ground-level ozone which
has detrimental impacts, both on human health and in
particular on crop yields (ecosystems, agriculture). Like
other greenhouse gases, methane prevents infra-red
radiation that enters the atmosphere from exiting the
Reducing annual average levels of fine particulate matter (PM2.5) to the WHO guideline levels (10ugm) would result in possible gains in average life expectancy ranging from: 22
months on average per person in Bucharest, 19 months in Budapest to 2 months in Malaga (Aphekom, 2013)
EIB helps financing a tram in Morocco to move to low-carbon transport and reduce urban air pollution.
17
O3
atmosphere and being released into space. Methane is emitted both, from natural sources, such as
wetlands (or the decomposition of plant and animal waste) and man-made sources. Emissions from
natural sources and processes account for approximately 40% and those from man-made sources
for approximately 60% of total global methane emissions. At the global level, the main sources of
methane emissions from human activities are the production and transportation of fossil fuels (gas),
agriculture (enteric fermentation, livestock manure, rice cultivation), solid waste and wastewater
treatment and coal mining.
24. Main measures to reduce methane emissions include recovering and flaring methane from oil and
gas production, reducing fugitive emissions from gas networks, managing manure from livestock,
changing farming techniques for rice and with respect to waste, diverting biodegradable waste away
from landfill and using alternative disposal/treatment methods such as composting or incineration,
collection and combustion of landfill gas, and improved oxidation of fugitive landfill emission in the
landfill cap.
4.2 Tropospheric Ozone
25. Ozone (O3) is a highly reactive gas. It is a reactive form of oxygen that primarily exists in two layers
of the atmosphere: the troposphere, the lower layer of the atmosphere and the stratosphere, the
upper layer of the atmosphere. In the stratosphere ozone protects life on Earth by absorbing strong
ultraviolet (UV-B) solar radiation. In the troposphere, at ground-level, however, ozone is a potent
greenhouse gas and harmful to human health and ecosystems. The ozone in the troposphere is also
referred to as ‘tropospheric or ground-level ozone’. This report looks at tropospheric or ground-
level ozone. Ground-level ozone is the third most important contributor to the anthropogenic
greenhouse effect after carbon dioxide and methane (Royal Society, 2008). Heightened levels of
tropospheric ozone reduce the ability of plants to conduct photosynthesis, the plant’s capacity to
take up carbon dioxide, to reproduce and grow. As a result tropospheric
ozone is one of the main reasons for globally reduced crop yields and
slower forest growth. High ozone levels also contribute to the corrosion of
materials and especially building substances (EEA Signals, 2013). In
humans high ozone levels can cause inflammation of the lungs, asthma
and allergies. In the EU alone, tropospheric ozone causes approximately
22 000 premature deaths every year (WHO, 2008).
26. Unlike carbon dioxide, methane and other air pollutants, tropospheric ozone is a secondary
pollutant as it is not directly emitted. It is formed as a result of sun-light driven chemical reactions
between carbon monoxide (CO), non-methane volatile organic compounds (NMVOCs), nitrogen
oxides and methane. The latter can be considered as one of the main precursors of tropospheric
ozone (50%). Like other GHGs, ozone warms the atmosphere by preventing infra-red radiation from
exiting the atmosphere and reaching space. Tropospheric ozone is included in the group of SLCPs,
because it remains in the atmosphere for between hours and a couple of days only.
18
BC
27. The wide range of sources of ozone precursors, the natural and physical process of distribution and
its complex chemistry means that controlling tropospheric ozone formation is not straightforward.
The most effective strategy to mitigate ozone consists in reducing precursor gases and in particular
methane and nitrogen oxide (N2O).
4.3 Black carbon
28. In contrast to the climate forcers presented so far, black carbon (BC) is not a greenhouse gas. Black
carbon (BC) is a major component of soot and exists in the atmosphere as particles or so called
particulate matter (PM). Black carbon is a climate forcer harming human
health. Black carbon causes warming of the atmosphere in a number of
different ways. Firstly, due to their black colour, particles do not reflect
incoming radiation, but absorb it and release the heat into the
atmosphere. Secondly, when deposited on ice or snowfields, black carbon
reduces the albedo of these surfaces and leads to accelerated melting
rates and atmospheric warming. Finally, the particles also influence cloud formation thereby
changing regional weather and in particular rainfall patterns. Black carbon is always emitted
together with organic carbon which is a cooling agent. Yet, they are emitted in different proportions.
Mitigation measures for black carbon need to take into account the changes in all emissions that
influence warming. Black carbon mainly occurs in two different sizes, PM10 and PM2.5. The negative
health impacts increase with the decreasing size of the particles. Hence, it is especially the small-
sized or ‘fine’ particulate matter defined as PM2.5 (particles with a diameter of less than 2.5
micrometres) which has detrimental impacts on the cardiovascular and respiratory human system.
According to the World Health Organization black carbon and organic carbon contribute a
substantial part of the fine particulate matter in air pollution that is the major environmental cause
of ill-health and premature deaths globally (WHO, 2009).
29. The global warming potential of black carbon over a 100 year time period exceeds that of carbon
dioxide by a thousand times.
30. Black carbon results from the incomplete combustion of fossil fuels, wood and other biomass. The
main sources of black carbon at the global level are transport, especially diesel engines; residential
heating and cooking, especially the burning of coal, wood and other biomass cooking and heating
stoves and diesel generators; open burning of agricultural waste; open burning of biomass from
deforestation, forest fires and some industrial facilities.
31. At the global level the main mitigation solutions addressing black carbon include strengthening
vehicle and fuel standards (ensuring diesel cars are equipped with particulate filters), introducing
clean burning fuel stoves, improving wood-burning stoves and heating; replacing traditional brick
and coke ovens; reducing open burning of agricultural and forestry waste; reducing forest fires.

19
HFCs
4.4 Hydrofluorocarbons
32. Hydrofluorocarbons (HFCs) are a set of very potent
greenhouse gases. An indication of their potency is their
GWP which can range from 4 up to 12400 (IPCC, AR5).
Hydrofluorocarbons have an atmospheric lifetime of up to
15 years and belong to the group of fluorinated GHGs
with the three main groups of Hydrofluorocarbons (HFCs), Perfluorocarbons (PFCs) and Sulphur
Hexafluoride (SF6). Currently, HFCs contribute to just 1 percent of global GHG emissions. Yet, they
are the fastest growing GHGs globally. They are regulated under the Kyoto Protocol, but if left
unabated, HFC emissions could rise to as much as 19% of GHG emissions by 2050 (US EPA,
2014). The rapid growth in the use and emissions of HFCs comes principally as a result of the
phasing out of ozone-depleting substances (ODS) under the Montreal Protocol on Substances that
Deplete the Ozone Layer (Montreal Protocol).
33. HFCs are industrially produced; they do not have any natural sources. They are used in residential,
commercial and industrial air conditioning (A/C), mobile air conditioning, refrigeration units, the
manufacturing of insulation, fire extinguishing foams and solvents.
34. Possibilities to mitigate the further increase and spread of HFCs would include avoiding or
minimizing HFCs in construction material as well as avoiding or identifying alternatives to HFCs in
mobile air-conditioning systems in vehicles and other transport units such as trains and buses.
Table 1: Overview of properties of SLCPs in comparison to CO2
Substance Lifetime Global Warming Potential over 100 yrs Health impacts
Ecosystem & Other impacts
Carbon dioxide (CO2)
Decades, to centuries, about 20% remains for millennia
1 (reference unit) no indirect
Methane (CH4)
12+/-3 years 21 Indirect (precursor to O3)
indirect
Tropospheric Ozone (O3)
4-18 days Is indirectly included in the GWP of methane
yes yes
Black Carbon
(BC)
3-8 days 1055-2020 yes yes
Hydrofluorocarbons (HFCs)
Between days and up to 15 years
140-11700 no indirect
20
5. Policy Framework
35. There is no piece of legislation addressing the group of SLCPs as a whole and with the objective of
tackling the effects of short-term climate change and air pollution. However, this does not mean
that the substances grouped as SLCPs are not regulated. SLCPs are rather addressed together with
other climate forcers and/or other air pollutants. Some are targeted in their capacity as air
pollutants, some in their capacity as climate forcers. They are regulated at international, EU- and/or
national level. The sections below provide a brief overview of where and how the different SLCPs
are regulated or addressed otherwise. The following analysis focuses on the policy framework for
SLCPs at international and EU level. A country level analysis would exceed the scope of this report.
5.1 International level
36. Both, substances causing anthropogenic climate change and those responsible for air pollution
have a transboundary character. Regardless, of where a climate forcing substance is emitted, it will
contribute to the overall amount of GHGs and warming agents. Likewise, air pollutants emitted in
one country can be carried many hundreds of kilometres by winds and pollutants may have an
impact in other countries than their country of origin. Thus, there is a good rationale for addressing
such substances through international treaties or conventions.
37. At the international level the most important agreements in relation to SLCPs are the Paris
Agreement, the Kyoto Protocol and the International Gothenburg Protocol. While the primary
objective of the Paris Agreement and the Kyoto Protocol are to reduce global warming, the
International Gothenburg Protocol’s primary goal is to address air pollution harming human health
and ecosystems.
38. The Paris Agreement’s central aim is to strengthen the global response to the threat of climate
change by keeping a global temperature rise this century well below 2 degrees Celsius above pre-
industrial levels and to pursue efforts to limit the temperature increase even further to 1.5 degrees
Celsius. The Agreement requires all Parties to put forward their best efforts through “nationally
determined contributions” (NDCs) and to strengthen these efforts in the years ahead. This includes
requirements that all Parties report regularly on their emissions and on their implementation efforts.
39. The Kyoto Protocol is an international agreement linked to the 1992 United Nations Framework
Convention on Climate Change (UNFCCC) committing the Parties by setting internationally binding
emission reduction targets. The Kyoto Protocol covers seven greenhouse gases — carbon dioxide
(CO2), methane (CH4), nitrous oxide (N2O), hydrofluorocarbons (HFCs), perfluorocarbons (PFCs),
sulphur hexafluoride (SF6) and Nitrogen Triflouride (NF3). This means the Protocol covers two out of
the four SLCPs.
40. The 1999 Gothenburg Protocol to Abate Acidification, Eutrophication and Ground-level Ozone is
part of the Convention on Long-Range Transboundary Air Pollution (CLRTAP). The Convention is an
21
international agreement to protect human health and the natural environment from air pollution.
The Protocol is a multi-pollutant protocol designed to reduce acidification, eutrophication and
ground-level ozone. Geographically, the Protocol covers Europe, North America and Countries of
Eastern Europe, Caucasus and Central Asia and it entered into force in May 2005. The original
Protocol sets emissions ceilings for sulphur-dioxide, nitrogen oxides, volatile organic compounds
and ammonia. This means that the only SLCP directly addressed in the 1999 Protocol is ground-
level ozone (O3).
41. In 2012, however, the Parties to the Gothenburg Protocol agreed to amend and revise the Protocol.
From an SLCP perspective the most important revision was that the revised Protocol will for the first
time include emission reduction commitments for fine particulate matter (PM2.5), i.e. black carbon as
well as methane (CH4). From a more general perspective, the most important decision was that the
Parties agreed to include national emission reduction commitments to be achieved by 2020 and
beyond. The Protocol still waiting to be ratified by all parties.
42. This means that these two international agreements, the Kyoto and the Gothenburg Protocol, in
theory address all SLCPs – methane, ground level ozone, particulate matter and HFCs in the
countries that signed these agreements once the revision of the Gothenburg Protocol has been
implemented into EU and national legislations.
43. The International Convention for the Prevention of Pollution from Ships (MARPOL) and its Annex VI
which entered into force 2005 specifically addresses air pollution from international shipping
activities. Among other things MARPOL sets standards for the emission of particulate matter.
44. The Montreal Protocol on Substances that Deplete the Ozone Layer (Montreal Protocol) addresses
ozone depleting substances (ODS), such as hydrochlorofluorocarbons (HCFCs). As a result of this
international agreement the ozone layer over the Antarctica has been slowly recovering in recent
years. In October 2016 the Parties to the Montreal adopted the Kigali Amendment to phase out
hydrofluorocarbons (HFCs). HFCs had become a major replacement in many ODS applications
and while they do not deplete the stratospheric ozone layer, they are potent greenhouse gases.
Under the Kigali Amendment developed countries have committed to phase out HFCs by 2019 and
reaching an 85% reduction by 2036 compared to 2011-2013 consumption levels. Most
developing countries, including China, agreed to follow the developed countries commitments by
freezing consumption in 2024 and gradually reducing use by 85% by 2045. The Amendment also
included a commitment by developed countries to provide financing towards the cost of reducing
HFCs.
5.2 EU level
45. Air pollution and climate change are issues that overlap and are closely intertwined. At an EU policy
level, however, both topic areas are addressed mainly separately – though with effects on each
other.

22
Main components of EU policy framework on GHGs
46. Substances causing climate change, in particular GHGs have been addressed by the successive
policy frameworks on climate and energy (2008-2012 implementation by Member States of Kyoto
Protocol commitments; Europe 2020 growth strategy; climate and energy policy framework 2030;
Roadmap 2050 for building the low-carbon European economy). A number of other pieces of
legislation, with a more sectorial focus equally aim at mitigating greenhouse gas emissions.
47. Commitments made in the Kyoto Protocol have been taken into consideration in the successive EU
policy frameworks also referred to as “packages” on climate and energy which aim to progressively
reduce greenhouse gas emissions. The current 2030 policy framework on climate and energy has
set the objective of reducing the EU’s overall emissions by at least 40% below 1990 levels by 2030.
The main two tools developed to achieve these reductions are: the EU’s Emissions Trading System
and the “Effort Sharing Decision” which together cover GHGs including the two SLCPs, methane
(CH4) and some hydrofluorocarbons (HFCs).
Main components of current EU policy framework on air pollutants
48. Air pollution has been addressed through successive policy initiatives and various directives since
the 1970s. The EU’s long-term objective is "to achieve levels of air quality that do not result in
unacceptable impacts on, and risks to, human health and the environment" (6th Environmental
Action Programme). The following policies and directives guide the current EU policy on air quality:
The 2005 EU Thematic Strategy on Air Pollution, setting out strategic policy objectives,
The 2001 National Emission Ceilings Directive, NECD (2001/81/EC), establishing national
emissions ceilings for all Member States covering four main pollutants
The Ambient Air Quality Directives, AAQD (2008/50/EC), setting local air quality limits
which may not be exceeded anywhere in the EU, and
Source-specific legislation designed to limit emissions from specific economic sectors, such
as the Euro standards for vehicles, energy efficiency standards or fuel standards for ships.
49. This current framework of EU air quality policy is currently being reviewed. As a result of the review,
the European Commission has proposed a number of changes which have been formulated in the
Clean Air Policy Package. The package is now being considered by the other EU institutions and
awaiting approval. With respect to SLCPs the most important potential changes are in the proposed
revised National Emissions Ceilings Directive (NECD):
emissions ceilings for methane and,
methodologies for monitoring and reporting on black carbon emissions with the possibility of
also including emissions ceilings for black carbon in the future.

23
Brief overview of the EU policies and legislation targeting the different SLCPs
50. Methane
• Effort Sharing Decision – methane forms part of the basket of seven of the Kyoto Protocol and is
regulated under the Effort Sharing Decision. Yet, the Effort Sharing Decision only provides limits for
all greenhouse gases per Member State without specifying a reduction target for methane (CH4).
• National Emission Ceilings Directive, NECD (2001/81/EC) – methane is currently not included in
the NECD. However, if the Clean Air Policy Package was accepted, ceilings for methane would be
included in the revised Directive.
• Ambient Air Quality Directive (2008/50/EC) – does not set direct reduction targets for methane
emissions. Yet, the Directive sets reduction targets for ozone. As methane is an important precursor
to ozone, the Member States could in theory be expected to reduce methane emissions to achieve
the reduction targets set for ozone.
• Source-specific directives/regulations – e.g. Landfill Directive (1999/31/EC); Waste Directive
(2006/2012/EC); Waste Management Framework Directive (2008/98/EC) and agriculture
directives (Nitrate Directive 1991/676/EEC); the Common Agriculture Policy (CAP). These source-
specific directives/regulations can have an important impact on the emissions of methane: for
example, by reducing the amount of biodegradable waste that is landfilled, methane emissions
from landfills have dropped by 35% since 1990.
51. Tropospheric Ozone
• Ambient Air Quality Directive (2008/50/EC) – sets targets for ozone concentration in a specific
zone or agglomeration. Among other issues, the protection of human health and the protection of
vegetation are addressed. The target for the protection of human health is set at a maximum daily 8
hour mean of 120μg/m3 within a calendar year. Where targets are systematically not achieved,
fixed measurement for ozone will be required.
52. PM2.5 - Black Carbon
• Ambient Air Quality Directive (2008/50/EC) – in the AAQD PM2.5 is regulated through EU air
policy standards. These standards are currently local concentration limit values for the air pollutants
most harmful to health. For PM2.5 the AAQD set a limit value of 25μg/m3, a value which entered
into force in January 2015. Before 2015 the same value was a target value. A target value needs
to be attained as far as possible whereas a limit value is legally binding.
• Revised National Emission Ceilings Directive, NECD (2001/81/EC) – if the Air Policy Package is
ratified, the Directive would introduce EU emissions ceilings for PM2.5 which Member States would
have to respect by a certain date. The suggested overall emission ceilings for PM2.5 would be a
reduction of 22% compared to 2005 levels by 2020 and a reduction of 51% by 2030 in the EU.

24
This revision would implement the 2012 revision of the Gothenburg Protocol which introduced
emission ceilings for PM2.5.
• Industrial Emissions Directive (2010/75) – which sets limit values for fine particulate emissions from
industrial plants. The Directive makes no distinction between PM10 and PM2.5.
53. Hydrofluorocarbons
• Mobile Air-Conditioning System Directive, MACs (2006/40/EC) – Directive on air conditioning
systems used in small motor vehicles. It prohibits the use of F-gases with a GWP which is more than
150 times greater than that of carbon dioxide (CO2) in new types of cars and vans introduced from
2011, and in all new cars and vans produced from 2017 onwards.
• F-gas Regulation (517/2014) – covers all other key applications in which F-gases are used (entered
into force in 2015). The regulation limits the total amount of the most important F-gases that can
be sold in the EU, bans the use of F-gases in many new types of equipment where less harmful
alternatives are widely available, requires checks for existing equipment, proper servicing and
recovery of the gases at the end of the equipment's life and prohibits the sale of a number of
products which contain HFCs with a GWP greater than 150.
Policy Framework Summary
All signatories to the main international agreements on climate forcing agents and air pollutants,
through the Paris Agreement, the Kyoto Protocol, the Gothenburg Protocol and the Montreal Protocol
have in theory committed to address all SLCPs. The Paris Agreement and the Kyoto Protocol address
methane (CH4) and hydrofluorocarbons (HFCs), the Kigali Amendment to the Montreal Protocol
addresses HFCs and the revised Gothenburg Protocol addresses ground-level ozone (O3), methane
(CH4) and fine particulate matter (PM2.5). However, the transposition of the agreements at the regional
and national levels can sometimes be inconsistent, which may lead to SLCPs being emitted without the
appropriate controls. Even where the agreements have been transposed into national legislation there
often is a lack of enforcement and air quality requirements not being met (e.g. PM2.5 limits are regularly
exceeded in urban areas in the EU (Cars 2020 Communication9)).
For countries and regions which have not signed one or both of the agreements, emissions of SLCPs
may be less regulated.
5.3 International Actors
54. In addition to state actors, there are other initiatives that address SLCPs outside regulatory
frameworks of which two are particularly important.
• The leading initiative in this area is the Climate and Clean Air Coalition to Reduce Short-Lived
Climate Pollutants (CCAC) which was launched by six governments and the United Nations
Environment Programme (UNEP) as the first global effort to address short-lived climate pollutants.
As of 2015, the CCAC counted 100 partners, including state partners, multilateral organizations
25
and private organizations. Partners in the Coalition have agreed to take meaningful and fast action
to reduce SLCPs. The EIB became a partner in the CCAC in 2013.
• The Global Methane Initiative (GMI) addresses, as the name suggests, the abatement and recovery
of methane emissions internationally. This voluntary initiative, which was launched in 2004 brings
together national governments, private sector entities, development banks, NGOs and other
interested stakeholders. The European Commission became a member of the GMI, which is led by
the United States Environment Protection Agency, in 2007.
6. EIB and SLCPs
55. Following this general overview of SLCPs, the benefits of mitigation and an overview on how they
are currently regulated, the following sections will focus on how considerations for SLCPs are
integrated into the EIB’s activities and the impact of those activities on SLCP emissions. The report
identifies potential opportunities for the EIB to address and mitigate SLCPs, as well as highlight to
the Bank’s counterparts what the Bank can offer and how it can support projects addressing SLCPs.
This should contribute to more efficiently matching the interests of the Bank and potential project
developers who aim at addressing SLCPs.
6.1 Mitigation of climate and air pollutants at EIB to date
56. The EIB addresses climate change and air pollution through two principal mechanisms. The first
mechanism or tool is a commitment by the Bank to invest at least 25 percent of its total lending in
climate action projects. This target helps to channel finance into projects which contribute to
mitigating GHG emissions, sequestering GHG emissions or adapting to the impacts of climate
change. Projects that mitigate the emission of greenhouse gases can, for example, be projects
which have an effect on reducing the emissions of methane. Projects that have an impact on
reducing the emission of black carbon often include the reduction of carbon dioxide emissions (e.g.
the replacement of an old bus fleet) and would hence also be considered as climate action projects.
57. The second mechanism to address climate and air pollutants is the mainstreaming of standards,
criteria and the application of thresholds. In addition to the Bank’s in-house standards, the Bank
applies EU directives and regulations within the EU-28, but often also outside the EU. The
application of EU directives and regulations namely those described above ensures a certain quality
of the projects.
58. In the section below, both mechanisms and approaches to financing projects which mitigate climate
forcers and air pollutants are described. It is explained how the Bank’s criteria, standards and
thresholds take SLCPs into consideration, what effect the EIB’s lending activities have on the
emissions of SLCPs and how both mechanisms could be fine-tuned in order to address SLCPs in a
more targeted way. Finally, whether or how finance for projects which have a mitigating impact on
SLCPs could be scaled up is discussed.

26
6.2 Standards & Criteria on GHG and air pollution - SLCPs at EIB
59. In an organization that traditionally does not proactively develop its project portfolio, but rather
responds to project financing proposals by project developers, standards are one of the main tools
to steer the Bank’s lending portfolio in a desired direction. The Bank has introduced standards and
criteria with respect to the emission of GHGs and the emission of air pollutants in many of its
processes. Many of these standards or criteria directly or implicitly apply to one or more SLCPs.
Standards and processes applied may have an informative function, serve to price in an externality,
or have the capacity to single out projects (where the expected emissions of a project exceed a
certain threshold). The following standards and criteria relevant to SLCPs are applied in the Bank.
60. Best Available Techniques (BATs) and the guidelines of the accompanying BREFs are applied to all
industrial installations including for example wastewater or solid waste management systems.
61. Carbon Footprints are undertaken for all projects that have significant emissions4. The Carbon
Footprint exercise takes not only CO2 emissions into account, but again the seven gases listed in
the Kyoto Protocol including the SLCPs methane (CH4) as well as some hydrofluorocarbons (HFCs).
The Carbon Footprint currently has mainly an informative function. An area where the information
gained from the Carbon Footprint exercise is used, is the Emission Performance Standard described
below.
62. An Emission Performance Standard (EPS) for electricity generation excludes projects where the
expected emissions exceed the set threshold (currently 550g CO2-eq./kWh and to be reviewed over
time) and are not in line with EU emission reduction targets. The estimated emissions from a project
consider not only carbon dioxide (CO2), but also other gases commonly emitted during the
generation of electricity (all 7 gases of the Kyoto basket). One of the gases considered is methane
(CH4) which for the estimate is converted into CO2-eq. emissions. This means the EPS excludes
electricity production projects where the cumulative CO2-eq. emissions including the SLCP,
methane (CH4) exceed the threshold.
63. When reporting on the footprint of projects financed by the Bank, non CO2 emissions are often
converted into CO2-eq. emissions, which means that the reported emission figures do not show the
specific share of an SLCP emitted by a project.
64. As part of its economic analysis of a project, the Bank carries out a Cost Benefit Analysis (CBA)
which not only measures the monetary benefits and costs of a project to the direct owner of an
asset, but also takes into account the external costs/benefits or environmental externalities. The
environmental externalities taken into account may include the damage and costs caused by local
air pollutants, such as ammonia, nitrogen oxides, nitrous oxide, non-methane volatile organic
compounds certain heavy metals as well as fine particulate matter (PM), as appropriate on a project
4 Emissions are considered significant where the absolute emissions are >100,000 kt CO2-eq./yr and/or the relative (positive or negative) emissions >20,000 kt CO2-eq./yr.

27
basis. The categories considered include damage to human health, materials, crops and
biodiversity losses. The unit values applied by the Bank for local air pollution are taken from
different sources such as a recent report, commissioned by the Bank and carried out by the Institute
for Energy Economics and the Rational Use of Energy (IER). This study inter alia explores and reports
on the costs caused by the emission of PM2.5 and its component black carbon. Other sources are
the TREMOVE10 and EMEP/EEA11 databases.
65. Today, the external costs caused by emissions of particulate matter (PM10) are already integrated in
the Cost Benefit Analysis (CBA) in the energy and the transport sector. The smaller fine particulate
matter (PM2.5) and its component black carbon are, however, only included in the Cost Benefit
Analysis (CBA) for projects in the energy sector, but not yet in the transport sector. As one of the
sectors with the highest impact on PM2.5 emissions it is, however, important that the costs caused by
PM2.5 emissions are internalised in the costs of transport projects. Therefore a key output of this
report is to consider further the inclusion of PM2.5 in Cost Benefit Analysis (CBA) for transport
projects.
66. The Bank may also consider extending the practice of carrying out Cost Benefit Analysis taking
account of air pollutants emissions from other sectors and project types where emissions of PM2.5
and its component black carbon are significant. Yet, in other areas and sectors (residential heating,
replacing traditional cooking ovens, banning open burning of agricultural waste) in which the
UNEP/WMO report suggests measures (Table 2) to reduce emissions of black carbon, the Bank has
traditionally very limited activities.
67. It can be concluded that the consideration of SLCP emissions is widely integrated into the Bank’s
activities and that there is awareness of all four SLCPs at the Bank. While some of the standards and
criteria applied contribute to preventing or reducing the emission of SLCPs, other standards have an
informative function only. The Bank will therefore seek to explore whether standards and criteria
may be applied even more widely across sectors and areas in which the Bank finances projects.
Conclusions & Opportunities
The consideration of SLCP emissions is widely integrated into the bank’s activities and there is
awareness of all four SLCPs at the Bank. While some of the standards and criteria applied
contribute to singling out and/or internalising the costs of emissions of SLCPs, other standards have
an informative function only.
The Bank has already integrated the costs and damage caused by the coarser fine particulate
matter (PM10) in the energy and transport sector, but those of fine particulate matter (PM2.5) are
included for the energy sector only. Therefore the Bank will explore whether the inclusion of the
external costs caused by PM2.5 into the Cost Benefit Analysis (CBA) for transport projects is of value.

28
6.3 Understanding the impact of EIB’s lending activities on SLCP emissions & Financing of SLCP mitigating projects
68. The preceding section looked at the Bank’s standards and criteria which are relevant to SLCPs and
which guide projects that the Bank finances. The following section will focus on the Bank’s lending
activities which are relevant to the emission of SLCPs. The section will explore what impact projects
have on SLCP emissions, provide an overview to potential project developers of what type and
where the Bank can offer support, and finally identify options for increasing support and scaling up
finance for projects with a positive impact on the mitigation of SLCP emissions.
69. For the identification of areas where the Bank could step up and fine-tune its efforts, it is important
to have in mind what the Bank can and cannot offer. While the EIB is a not-for-profit bank, it only
finances projects which are economically viable and which provide added value to EU policy
objectives. In contrast to purely commercial banks, the EIB offers a number of additional benefits.
On the financial side these include concessional lending, lowering of the project risk and a variety
of innovative financial instruments. On the technical side, the Bank offers technical support through
in-house technical experts as well as technical assistance (TA) for technical and/or financial project
preparation, implementation and monitoring which is often funded through grants.
6.3.1 Methodology
70. To understand the impact of EIB activities, and in particular the sectors or areas of EIB projects
related to the emissions of SLCPs, and which areas the Bank should focus its attention on, this
report assesses the 16 measures addressing SLCPs identified by the report “Integrated Assessment
of Black Carbon and Tropospheric Ozone” (UNEP/WMO, 2011). The UNEP/WMO report
identified 16 measures addressing emissions of black carbon (BC) and methane (CH4) which are
considered to have the greatest potential to both deliver health benefits and reduce near-term
global warming. This and later reports estimate that full implementation of the 16 identified
measures globally would reduce near-term global warming by between 0.4˚C and 0.5˚C
(UNEP/WMO, 2011).
71. Table 2 below shows the measures identified by the UNEP/WMO report and the sectors in which
these measures are suggested, and compares this to where these overlap with the sectors and areas
in which the EIB is traditionally active. As the identified measures only address the abatement of
methane and black carbon, but not HFCs, we have complemented the UNEP/WMO measures by
areas where HFCs are known to be regularly emitted. In those sectors and specific areas where the
Bank is active, the report i) briefly describes the Bank’s activities to date, and ii) describes the
estimated impacts with respect to SLCPs. In the final step the report iii) identifies potential
opportunities for future action by the Bank. This will be done by taking into account in which sectors
and specific areas the Bank is active and has expertise.

29
Table 2: Overlap between 16 selected UNEP/WMO measures and EIB activities
Sector Suggested measure EIB activity
Mitigation of main substance: methane (CH4) En
ergy
1 Extended pre-mine degasification and recovery and oxidation of CH4 from ventilation air from coal mines
No activity
2 Extended recovery and utilization, rather than venting, of associated gas and improved control of unintended fugitive emissions from the production of oil and natural gas.
Yes
3 Reduced gas leakage from long-distance transmission lines
Yes
Solid
Was
te m
anag
emen
t
4 Separation and treatment of biodegradable municipal waste through recycling, composting and anaerobic digestion as well as landfill gas collection with combustion/utilization
Yes - Collection, separation and treatment (MBT)
through recycling
5 Yes - Composting and anaerobic digestion (AD)
6 Yes - Landfill with gas collection, incineration, waste-to-energy (WTE)
7 Yes - Rehabilitation of dumpsites
Was
tew
ater
m
anag
emen
t 8 Upgrading primary wastewater treatment to secondary/tertiary treatment with gas recovery and overflow control
Yes
Agr
icul
ture
9 Control of CH4 emissions from livestock, mainly through farm-scale anaerobic digestion of manure from cattle and pigs
No activity
Agr
icul
ture
10 Intermittent aeration of continuously flooded rice paddies
No activity

30
* Policy related action, outside the EIB’s scope of activities.
Sector Suggested measure EIB activity
Mitigation of main substance: fine particulate (PM2.5) matter and its component black carbon
Tran
spor
t
11 Diesel particle filters as part of a Euro 6/VI package for road and off-road diesel vehicles
Yes, partly*
12 Elimination of high-emitting vehicles in road and off-road diesel vehicles
Yes, partly*
Resi
dent
ial
13 Replacing coal by coal briquettes in cooking and heating stoves
No activity
14 Pellet stoves and boilers, using fuel made from recycled wood waste or sawdust, to replace current wood-burning biomass stoves for cooking and heating in developing countries
No activity
15 Substitution of clean-burning cook stoves using modern fuels for traditional biomass cook stoves in developing countries.
No activity
Indu
stry
Replacing traditional coke-ovens with modern recovery ovens, including the improvement of end-of-pipe abatement measures in developing countries
No activity
Agr
icul
ture
16 Ban of open field burning of agricultural waste
No activity*
Mitigation of main substance: hydrofluorocarbon (HFCs) (Additionally added to complement UNEP/WMO suggested measures)
Indu
stry
Production of refrigeration Yes, partly
Air conditioning Yes, partly
Fire protection Yes, partly
Foams Yes, partly
Aerosols Yes, partly

31
6.3.2 Overview of SLCP-relevant financing at EIB
72. Table 2 shows that the EIB traditionally finances projects in a number of those areas and sectors in
which the UNEP/WMO (2011) report has identified the 16 measures which are considered most
effective to mitigate the emissions of SLCPs. Those areas include the energy, solid waste, wastewater
and transport sector.
73. The report refers to ‘SLCP-relevant projects’ where a project is in one of the areas in which the
UNEP/WMO report suggests measures and where the project has an impact on the emission of
SLCPs.
74. A more granular picture of the impact of EIB financed projects on SLCPs can be derived from
looking at those SLCP-relevant projects which are included in the Bank’s carbon footprint exercise.
Table 3 provides an overview of the relative emissions of SLCP-relevant projects in the six year
period between 2009 and 2014 that were included in the carbon footprint. Projects have been
included either, because their absolute emissions or their relative emissions surpassed the threshold
set by the Bank’s carbon footprint methodology. Where relative emissions are negative this indicates
a saving compared to a baseline economically viable alternative project. The relative emission
savings have to be seen in relation to the number of projects as well as to the financing volume of
the project. No immediate conclusion can be drawn from the overview. Savings are, for example,
not consistently higher in one sector than in another. The emission saving potential of SLCPs will be
discussed in more detail in the following sector sections. The informative value of this overview of
emissions from the included projects seems at first limited. Firstly, it only includes those SLCP-
relevant projects where emissions are according to the EIB’s carbon footprint methodology
significant5 and other smaller projects which may also reduce SLCP emissions do not appear in this
overview. Secondly, the data in the carbon footprint does not always show the specific greenhouse
gas, i.e. which share of the relative emission is CO2, methane (CH4) or other, because all emissions
have been converted into CO2-eq. emissions. Finally, lending through intermediaries is not
captured in the footprint exercise either. The total CO2-eq. emission savings from SLCP-relevant
projects in the six years between 2009 and 2014 amounts to 663 kt CO2-eq. emissions saved.
5 Emissions are considered significant where the absolute emissions are >100,000 kt CO2-eq./yr and/or the relative (positive or negative) emissions >20,000 kt CO2-eq./yr.

32
Table 3: Relative emissions (avoided emissions) from SLCP-relevant projects
Activity & Relative Emissions
Year of Financing contract
Retrofitting gas pipelines6
Solid waste Wastewater Transport (Elimination of high-emitting
vehicles*
Nr. of projects
Relative emissions
Nr. of projects
Relative emissions
Nr. of projects
Relative emissions
Nr. of projects
Relative emissions
2009 1 -29 no data no data 2 18 1 -259
2010 2 -14 0 0 0 0 1 -3
2011 0 0 2 13 8 -62 2 -5
2012 4 -83 0 0 0 0 0 0
2013 2 -56 2 -24 0 0 0 0
2014 2 -101 2 -32 0 0 2 -26
TOTAL -283 -43 -44 -293
* Includes GHGs but not PM2.5
6.3.3 The Energy Sector
75. In 2014 the EIB provided EUR 12.8 billion of lending in support of projects in the energy sector,
representing 16.6% of the total financing provided by the Bank. The type and mix of energy projects
financed is determined by the Bank’s Energy Lending Criteria. In the context of climate action one of
the most important standards for projects in the energy sector is the Emission Performance Standard
(EPS) which sets a maximum threshold for emissions per kWh of electricity produced (currently 550g
CO2-eq./kWh). The Bank’s portfolio of projects in the energy sector includes finance for renewable
energy, energy efficiency investments, heat production and heat transmission, electricity and gas
systems such as, electricity generation and gas production as well as transmission and distribution
networks, smart grids, and storage facilities. In 2014 the Bank provided almost EUR 6 billion for
renewable energy projects, EUR 2.27 billion for energy efficiency and EUR 6 billion for energy
networks (heat transmission, electricity, gas and oil infrastructure).
6 The Bank finances gas transmission and distribution for both new and refurbishment of gas pipelines 7 The EE figure comprises EE financing not only in the energy sector, but also from various other sectors (e.g. EE in industry or buildings) contribute. Hence, the figures indicated above add up to an amount higher than the total amount of financing indicated for the energy sector.
( r e l a t i v e e m i s s i o n s i n k t )

33
Refurbishing and replacing old gas pipelines contributes to reducing methane emissions.
76. The EIB is active in the areas targeted by Measure 2 and 3 proposed in the UNEP/WMO report.
The activity in these areas and potential to mitigating SLCPs are described below.
UNEP/WMO Measure 2: ‘Extended recovery and utilization, rather than venting, of associated gas and
improved control of unintended fugitive emissions from the production of oil and natural gas’
77. Measure 2 of the UNEP/WMO report relates to the area of oil and gas production where methane
emissions could be more efficiently recovered and utilized rather than vented or flared. While the
EIB does not finance exploration of gas or oil, the Bank could support the development of new gas
and oil production. Projects which aim at an extended recovery and a more efficient utilization of
gas produced during oil production are in theory eligible for financing by the Bank. In practice,
however, a project that recovers and utilizes gas associated with the production of oil has not been
financed by the Bank during the last 5 years. Projects recovering and utilizing gas associated with
oil production are of interest not only with respect to their potential to mitigate emissions of
methane, but also with respect to their economic potential. The economic impacts of flaring and
venting are significant in terms of loss of revenues. In Nigeria alone, a joint UNDP – World Bank
report estimated in 2004 that the annual economic loss to Nigeria from flaring and venting (based
on LNG values) was approximately USD 2.5 billion12.
78. It can be concluded that while the Bank has not financed a project specifically focused on the
recovery and utilization of gas associated with the production of oil, it is possible to finance projects
which focus on the recovery of gas in the future, provided a project complies with all applicable EIB
standards.
UNEP/WMO Measure 3: ‘Reduced gas leakage from long-distance transmission lines’ and retrofitting gas
distribution lines
79. Measure 3 of the UNEP/WMO report relates to reducing fugitive emissions from leakages in long-
distance gas transmission lines. At the EU level trans-European energy network projects (TEN-E),
including long-distance gas transmission lines’ are considered projects of ‘high priority’ because
they contribute to the security of supply and the integration of the internal energy market. As an EU
priority, TEN-E projects are automatically also a priority for the EIB. Gas transmission and
distribution, especially interconnections are considered
critical investments.
80. As a result, the building of new transmission lines, extensions
and/or refurbishing of old transmission and distribution lines
is carried out on a regular basis and the Bank is one of the
major investors in energy network projects in the EU. The
Bank provided EUR 895 million for gas transmission and
distribution lines in 2014 and more than EUR 7.8 billion

34
over the last 5 years. Financing from one year to the other and from one country to the other can,
however, vary significantly depending on market demand and the national legislative framework.
81. The Bank not only refurbishes long-distance transmission lines, but also distribution lines.
Refurbishing gas networks considerably reduces leakages and hence contributes to reducing fugitive
methane emissions. This means that by replacing old pipelines the Bank contributes to reducing
fugitive methane emissions and the proposed ‘measure 3’.
82. Table 3 shows the avoided emissions from SLCP-relevant operations in those areas and sectors in
which the UNEP/WMO report suggested that measures to address SLCP would have the greatest
impact. The replacement of old gas networks financed by the Bank avoided 283 kt CO2-eq. over
the six year period analysed between 2009 and 2014. An advantage of the emission data available
for gas pipelines is that it has a relatively high informative value, because the emission savings
indicated as CO2-eq. are methane (CH4) emissions only. For other areas in which measures have
been suggested, e.g. waste and transport the Bank only has the CO2-eq. emission data, but not the
exact share of the different gases (e.g. methane, carbon dioxide, etc.) or avoided particulate matter
emissions. In the transport sector, for example, the avoided emissions were higher, 293 kt CO2-eq.
over the six year period analysed, but this figure is not as directly linked to SLCP emission savings as
in the energy sector. All refurbished gas networks projects show consistently negative relative
emissions, i.e. avoided emissions. The available data indicates that from all the areas in which the
UNEP/WMO report suggests measures, the EIB makes the biggest direct contribution to mitigating
the SLCP methane in the area of leakage reduction by replacing and refurbishing gas networks.
Conclusion & Opportunities
The EIB does not currently finance any projects which focus on the recovery and utilization of gas
associated with the production of oil. The Bank would, however, take into consideration project
proposals in this area. Projects in this area are generally eligible and will be financed if viable and in line
with all EIB standards.
Data from the carbon footprint shows that replacing and/or refurbishing of old gas pipelines reliably
reduces SLCP (CH4) emissions. The data available at present indicates that gas pipelines are among
those projects in the EIB’s portfolio which contribute most to avoiding the SLCP methane (CH4). The EIB
already treats energy network projects in the EU as priority. Unless more energy network projects are,
however, proposed to the EIB and there is market demand, potential for scaling up is limited.
The EIB can support projects that replace and refurbish gas pipelines outside of the EU. Demand for
such projects strongly depends on market demand which in turn is closely linked to national regulatory
frameworks.
The Bank has recently endorsed the World Bank’s ‘Zero Routine Flaring by 2030’ initiative. The Bank de
facto has implemented a no routine flaring policy in its petroleum sector investments for at least the last
20 years.

35
EIB loan helped financing the rehabilitation of an open dumpsite and introducing a sustainable solid waste management system in Tunisia
6.3.4 Waste management – Solid Municipal Waste
83. The Bank provided almost EUR 432
million for 18 solid waste management
projects in 2014 and more than EUR 2
billion for solid waste projects inside and
outside the EU over six years between
2009 and 2014. The waste treatment
technologies supported by the Bank
range from waste collection, mechanical
and biological treatment (MBT) facilities,
recycling, composting, anaerobic digestion
(AD), waste to energy (WTE) and the
rehabilitation of dumpsites. Beyond funding waste treatment facilities, the Bank also supports
upstream activities such as raising public awareness of the need for avoidance and minimisation of
waste which are key to any comprehensive waste programme. Compared to projects in other
sectors where the Bank is active, some waste processes with a high economic and environmental
return such as recycling and composting have relatively small financing needs of between EUR 4
and EUR 40 million. By contrast a large offshore windfarm can have a financing volume of up to
EUR 500 million. Therefore, innovative financing instruments are strongly required to address those
specific processes. Furthermore, the provision of waste services (as public goods) involves multiple
stakeholders and different layers of governance and hence requires a large amount of preparation
and time from EIB staff. The frequent absence of a stringent regulatory framework and the lack of
basic awareness of the benefits of waste management, e.g. recycling, in the population also add to
the complexity of solid waste projects. These characteristics often make solid waste projects a
challenge for a mainly volume-driven bank. Yet, for the very reason of being complex projects and
operations with multiple benefits to society, the environment and climate, the Bank recognizes that
solid waste management is an area in which the Bank can truly provide an added value.
Sector and Opportunities
84. According to ‘The European environment – state and outlook’ (SOER, 2015) report overall per
capita waste generation in the EU-28 declined by 7% in the period 2004–2012. Recycling rates
have increased and waste is more frequently used for energy recovery and production. Material that
was deposited to landfill in the EU 28, Iceland and Norway dropped from 31 percent of total waste
generated to 22 percent between 2004 and 2010 (ibid).
85. Despite this progress, EU waste generation remains substantial, and performance relative to policy
targets is mixed. In order to achieve the EU target of phasing out landfilling by 2025, waste
management in the EU will have to change fundamentally. Substantial efforts are needed from

36
many Member States in order to achieve the target of 50% recycling by 2020. Currently, the
recycling rates of municipal waste streams vary considerably between different European countries.
While some of the frontrunners recycle more than 50% of their municipal waste (e.g. Germany,
Austria) other countries (e.g. Romania, Malta) show extremely low recycling rates (see figure below).
In neighbouring countries of the EU (e.g. Turkey or Ukraine) and in countries in the Mediterranean
region (Tunisia) the share of municipal waste that is still being landfilled amounts to approximately
80-95 percent. At a global level it is estimated that the world currently produces 1.3 billion tonnes
of landfill waste annually. The World Bank report (What a Waste, 2012) estimated that global solid-
waste generation will rise from more than 3.5 million tonnes per day in 2010 to more than 6
million tonnes per day in 2025.
Figure: Municipal waste recycling rates in European countries 2004 and 2012 (in SOER, 2015)
86. In many regions of the world, however, waste is not even sent to sanitary landfills, i.e. sites where
waste is isolated from the environment until relatively safe, but is deposited in dumpsites where
measures to control the operation and to protect the surrounding environment do not or only to a
very limited degree exist. Such dumpsites are particularly frequent in Latin American and parts of
Asia and Africa and the majority of the world’s largest dumpsites can be found in these regions
(Waste Atlas, 2014)13. Yet, even though dumping waste is illegal, dumpsites still also exist in some
of the EU-28 (e.g. Italy, Bulgaria, Greece) and other European countries (e.g. two of the largest
dumpsites globally can be found in Ukraine, Alushta and Serbia, Vinča).
87. Bad waste management is negative from various points of view – climate, environmental, health,
economic. From a climate perspective waste considerably contributes to the emission of greenhouse
37
gases, in particular methane (CH4). Firstly, material that is sent to landfill or dumpsites not only
constitutes lost resources, but also a loss of the energy that was used for extracting and producing
the material sent to landfill. Secondly, the deposition of waste also directly leads to the emission of
GHGs, fine particulate and black carbon emissions. Waste that is deposited in landfills or
dumpsites often has different components, in particular the biodegradable waste which under
anaerobic conditions is broken down by bacteria and produces approximately 40-60 percent
methane (GWP 21) and 40-60 percent carbon dioxide as well as some nitrous oxide (N2O). Gas
production in a landfill continues for 10 to 20 years and it takes approximately 100 years until all
the degradable materials are broken down and all emissions are released. It is estimated that
emissions from waste account for 11% of global greenhouse gases (UNEP, CCAC). The study
“Climate Protection Potential in the Waste Management Sector” by the German Environment
Agency finds that “landfills give rise to substantial methane emissions: 50 million and 80 million
CO2-eq. per annum. Therefore, based on the replacement of landfilling with the high-quality
material and energetic use of waste, there are still substantial climate protection potentials – within
the range of 140 million to approx. 200 million t CO2-eq. per annum – to be realised in the EU”
(German Federal Environment Agency, 201014). Worldwide CH4 emissions from landfill/dumpsite
waste were estimated to amount to 640 to 760 million t CO2-eq. in 2010 (IPCC, AR4, 2007
chapter 10, p.595), a moderate figure in comparison to the figures estimated for the EU where
waste management is comparatively advanced.
88. From an environmental and health perspective, landfills and especially dumpsites have a number of
undesirable impacts. Poorly engineered landfills or dumpsites often contaminate surface and
ground water, release potentially toxic elements into the soil and consequently contaminate the
surrounding fauna and flora. The development of methane emission contributes to the development
of ground-level ozone which negatively impacts on the growth of vegetation and human health.
Sometimes the build-up of gases also leads to underground fires and open burning of dumpsites
which in turn leads to the emission of PM2.5 contributing to local air pollution. As a result, people
living in the vicinity of a dumpsite often suffer from a number of negative health impacts (infectious
diseases, dermatological problems, gastrointestinal, respiratory diseases, chest pain or headaches).
89. Finally, from an economic point of view the disposal of material as waste constitutes lost economic
opportunities. Already today recycled materials meet a considerable demand for material in the EU
and help to reduce the EU’s dependency on imported resources. For example, recycled steel has
accounted for about 56% of EU-27 steel production in recent years (BIR, 201315). However, the low
recycling rate for municipal waste across a number of EU countries also points to significant
opportunities for increased recycling in many areas. It is estimated that resource efficiency
improvements all along the value chains could reduce the resource need by 17–24 percent by
203016 and better use of resources represents an overall savings potential of EUR 630 billion per
year17 for European industry. In the impact assessment for the 2014 Circular Economy Package, the
European Commission estimated that better implementation and simplification of existing EU waste

38
legislation could create more than 180.000 direct jobs in the EU. The investment needs in the solid
waste sector are estimated to be between EUR 5.4 billion and EUR 20.6 billion in the EU alone (P.
Dorvil, 201418). Despite the variety of benefits offered by waste management, they are often not
fully taken into account by decision makers when making a decision with respect to the
management of resources. The EIB is active in the areas targeted by Measures 4, 5 and 6 proposed
in the UNEP/WMO report. The Bank’s activity in these areas and potential to mitigating SLCPs are
described below.
UNEP/WMO Measures 4, 5 & 6: ‘Separation and treatment of biodegradable municipal waste through recycling, composting and anaerobic digestion as well as landfill gas collection with combustion/utilization’
90. The EIB supports a wide range of different types of waste projects and technologies and is
traditionally active in the areas in which measures 4, 5 and 6 are suggested. Projects that the Bank
supports range from municipal waste collection and recycling schemes, including Mechanical and
Biological Treatment (MBT) facilities, composting, municipal solid waste-to-energy (WTE) plants,
municipal solid waste incineration to solid waste landfilling projects and the rehabilitation of
landfills or dumpsites. Following the concept of the ‘circular economy’, the Bank also supports
projects which adopt a more holistic approach to managing resources and integrating
considerations of resource efficiency into its activities. This is for example explored by supporting a
project which searches for ways to design products following the “cradle-to cradle” approach.
91. Waste projects financed by the Bank often bundle several components of a waste management
scheme (e.g. financing of a waste collection fleet, a recycling scheme and a waste-to-energy
component) or waste projects of different municipalities. Sometimes the waste management
component is part of a larger urban development project.
92. The Bank consistently finances MBT facilities, recycling, composting as well as anaerobic digestion
(AD) facilities which help divert not only recyclable, but also wet components and thus reduce the
development of methane and carbon dioxide emissions from the remaining material. The Bank also
regularly finances the rehabilitation of badly engineered landfills or dumpsites. Sometimes the
collected gas can be used to produce energy that can be fed into the electricity grid or used locally.
The Bank also rehabilitates dumpsites with good economic and environmental returns (collection
and use of gas, land value, protection of groundwater, and also the overall benefits for local and
regional development).
93. The results from the carbon footprint exercise for waste projects, i.e. the total avoided emissions
from solid waste projects indicate modest benefits, especially if compared to the avoided SLCP
emissions in the energy sector. The total avoided emissions from solid waste projects that were
included in the Bank’s carbon footprint exercise amounted to -44 kt CO2-eq. This figure consists of
avoided methane (CH4) and carbon dioxide (CO2) emissions in an almost equal share, i.e.
approximately half of the avoided emissions; -22 kt correspond to an avoided SLCP. The total
relative emissions for waste projects as indicated above have, however, to be considered taking the

39
following points into consideration. First, estimating the carbon footprint of the Bank’s projects is a
relatively new exercise (since 2010) and the volume of data collected does not yet allow firm
conclusions. Secondly, the Bank’s carbon footprint exercise only includes projects which are above
the set threshold to be included. As some solid waste projects are often comparatively small, as
explained before, potential avoided emissions from many small projects are not included. Thirdly, if
the avoided emissions from, for example energy and waste are compared in relation to the volume
lent, the difference between the avoided emissions from waste (-22kt per 1 bn) and from energy (-
36kt per 1 bn) is not as stark as it seems at first sight. Finally, the reduction in the emission of PM2.5
and black carbon through stopping the open burning of dumpsites is currently not taken into
consideration at all.
94. Solid waste projects combine a high number of benefits and other factors which make them an area
worth focusing on for the EIB. As outlined above the results from the carbon footprint need to be
read with care and in isolation they do not make solid waste a priority area. The following
combination of different factors should, however, put solid waste projects further up the agenda of
the Bank: i) an emission saving potential that is probably higher than the current carbon footprint
exercise indicates, mainly because the avoided emissions from recycling and also avoided PM2.5
emissions are not taken into consideration today ii) the combination of the high number of
environmental benefits as described above iii) the immediate positive impacts on local communities
and development iv) the benefits to the economy at large v) the number of opportunities and the
demand for addressing waste management issues in Europe and globally vi) the fact that the
UNEP/WMO report suggests that a high potential for improved management of municipal waste to
avoid methane emissions lies in Europe and North America8 vii) the fact that solid waste operations
are complex projects in which the EIB can have a catalytic effect and provide significant added
value.
Conclusions & Opportunities
► Today the volume of waste projects financed is comparatively low due to the operations complexity.
Municipal solid waste projects show a good potential for SLCP emission savings. However, the savings
potential might currently not be fully reflected in the Bank’s carbon footprint data and could potentially
be higher when considering the emissions of BC and the emissions avoided through recycling and
keeping material in the value chain. Solid waste projects offer a high number of environmental, social
and economic co-benefits.
8 “The improved management of municipal waste could contribute one fifth of the potential reduction (total potential of methane emission reductions), half of which could be achieved in North America and Europe” (UNEP/WMO report, 2011, p.9)

40
► The need to address solid waste management in municipalities is great and the market potential is high.
Due to the complexity of the projects the EIB can have a catalytic effect in these operations and offer
significant added value. In view of the Bank’s 2015 Climate Strategy, which commits to giving more
weight to high impact projects, solid waste projects are an area in which the Bank can increase its
impact, even if in volume terms these projects may seem less attractive.
6.3.5 Wastewater
95. Water resource management is another important area in which the EIB provides finance inside and
outside the EU. Over the six year period analysed (2009-2014) the Bank financed more than 200
projects providing more than EUR 21 billion to the water sector. In 2014 the Bank provided EUR
2.6 billion for projects in the water sector. Projects in the water sector include water resources, water
treatment, water supply, wastewater collection, wastewater treatment, sludge treatment and
disposal, water efficiency, but also flood control, coastal protection projects and more specific
adaptation projects. The projects having the highest potential to reduce methane emissions are
sewage water treatment projects. The latter range from providing primary treatment sewage
installations in developing and emerging countries to more advanced solutions with aerobic
biological wastewater treatment, and with sludge treatment which employs anaerobic digestion to
produce stabilised sludge and biogas which is utilised for co-generation of electricity and heat
through cogeneration/combined heat and power units (CHP). Over the six year analysis period
(2009-2014), the EIB provided EUR 6 billion for sewage projects alone. In times of rising electricity
costs, adding a combined heat and power plant becomes increasingly interesting to sewage plant
operators. Wastewater treatment processes include energy-intensive operations such as aeration
and pumping. As a result, wastewater treatment plants require significant energy consumption. In
municipalities wastewater plants are often among the highest energy consumers. Sewage plants
which employ a CHP can on average cover 30% to 40% of their electricity needs and 100% of heat
needs which helps to reduce their operational costs and consequently also the wastewater fees or
the municipal taxes levied from the citizens.
96. In addition, like solid waste management projects, wastewater management projects offer a number
of health and environmental co-benefits, such as reducing the amount of pollutants entering the
environment through groundwater, soil and surface water. The EIB is active in the areas targeted by
Measure 8 proposed in the UNEP/WMO report. The activity in these areas and potential to
mitigating SLCPs are described below.
UNEP/WMO Measure 8: Upgrading primary wastewater treatment to secondary/tertiary treatment with gas
recovery and overflow control
Measure 8 relates to reducing the emission of methane from wastewater by upgrading primary
wastewater treatment plants to secondary treatment through gas recovery and overflow control.

41
Primary treatment is usually the first stage of wastewater treatment in which gross, suspended and
floating solids are removed from raw sewage, but gas is freely released into the atmosphere. More
advanced secondary and tertiary treatment plants remove the dissolved organic matter that escapes
primary treatment and tertiary treatment can eventually remove more than 99 percent of all the
impurities from sewage. The Bank regularly finances such upgrades of wastewater plants, often in
combination with anaerobic digestion and/or combined heat and power plant which captures the
methane emitted from the sewage. The financing of the upgrading of waste treatment plants, the
combination with anaerobic digestion and/or CHP and overflow control is applied to all
economically viable projects which are in line with the Bank’s standards and criteria. In the EU the
solution and level of treatment are driven by the compliance with the EU relevant environmental
directives, notably the Urban Wastewater Treatment Directive and Water Framework Directive,
while outside the EU, they depend - amongst others - on the users’ capacity to pay
97. The carbon footprinting data for wastewater projects is limited. Over the six year analysis period
(2009-2014), wastewater projects contributed to a saving of -44 kt CO2-eq. compared to baseline
scenarios. This figure accounts for ten major projects in 2009 and 2011. In later years, the Bank’s
activities in the area of wastewater concentrated on projects with financial intermediaries. While
these intermediated operations are expected to contribute significantly to SLCP to emission savings,
such projects are not tracked in the Carbon Footprint exercise.
Conclusions & Opportunities
The Bank regularly finances the construction and upgrading of wastewater treatment plants, often in
combination with anaerobic digestion and combined heat and power generation which prevents
emissions of methane from the sewage and sewage sludge.
The EIB offers financing for the upgrading of waste treatment plants, including combination with
anaerobic digestion and CHP and overflow control, to all economically and financially viable projects
which are in line with the Bank’s standards and safeguards.
The Carbon Footprint data for wastewater projects in the six years between 2009 and 2014 shows a
good contribution to reducing SLCP emissions. However, the overall contribution of this sector to
mitigating SLCPs is estimated to be considerably higher, but is currently not tracked, because significant
savings may be achieved by lending through financial intermediaries. Wastewater is a key sector for the
EIB with projects inside and outside of the EU.

42
6.3.6 Transport
98. Transport is a key sector for the EIB. On average 20-25% of EIB total lending supports projects in
the transport sector inside as well as outside the EU. The Bank provided more than EUR 86 billion
for transport projects in Europe and internationally between 2009 and 2014, and more than EUR
13 billion supported transport projects in 2014 alone. Bank lending in the transport sector
contributes to multiple EU policy objectives including environmental improvement, regional
development, the knowledge economy, and the trans-European networks. In this respect the
European Commission’s White Paper on Transport (2011) which outlines the challenges and a
future vision for transport in Europe, is particularly important in guiding the Bank’s actions. It
outlines a vision in which mobility in Europe is high and increasing whilst reaching a 60% emission
reduction target (below 1990 levels by 2050), an efficient intercity travel and transport network and
clean urban transport and commuting. At the global level the challenge to meet the demand for
transport in growing economies and for an increasing number of people in a sustainable and
climate friendly way will be an even bigger challenge.
99. Transport projects supported by the EIB typically include railways (conventional as well as high-
speed lines), urban transport (urban railways, underground, metro or bus fleets), but also roads and
motorways, sea transport, air transport as well as research and development (RDI) projects that aim
at identifying more efficient and sustainable transport options.
100. The large majority of transport projects that the Bank finances reduce the overall emissions of
GHGs (even highways often have a decongestion effect and hence contribute to reducing emissions)
101. The WMO/UNEP report estimates that some of the largest particulate matter (PM2.5), i.e. black
carbon, emission reductions in the transport sector can be obtained by using diesel particle filters
on high-emitting vehicles. The UNEP (2011) report specifies that addressing emissions from the
transport sector would bring about the largest reduction in black carbon emissions in Latin America
and the Caribbean. Yet, in Europe, Africa and Asia replacing and eliminating high-emitting vehicles
would also have a significant beneficial impact on black carbon emissions. The EIB is active in the
areas targeted by Measure 12 proposed in the UNEP/WMO report. The activity in this area and
potential to mitigating SLCPs are described below.
UNEP/WMO Measure 12: Supporting the progressive elimination of high-emitting vehicles in road and off-
road transport
102. One of the most effective ways to eliminate high-emitting vehicles in road and off-road transport is
probably policies setting standards which in practice exclude high-emitting vehicles. While the Bank
has no influence on the setting of policies, it finances a number of solutions which, both indirectly
and directly, contribute to eliminating high-emitting vehicles in road and off-road transport. The
Bank helps to take vehicles, including high-emitting vehicles off the road by providing alternative
means of transport, such as different types of railways, or by expanding public transportation in
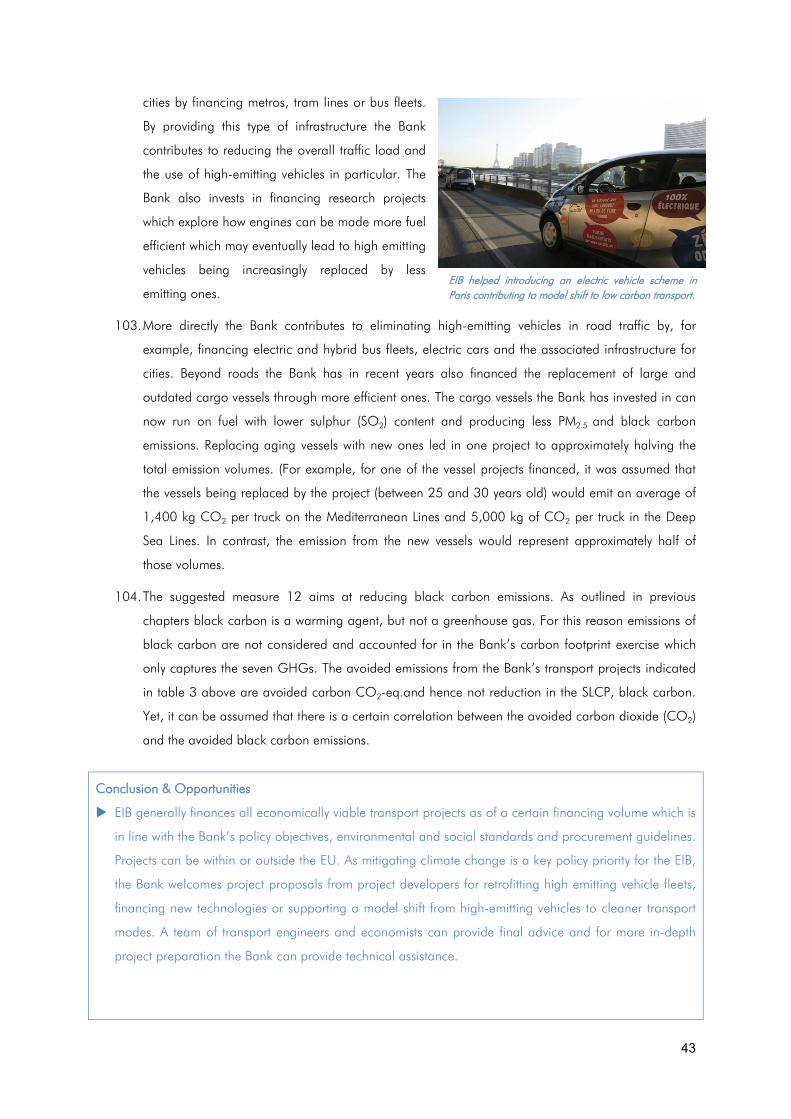
43
EIB helped introducing an electric vehicle scheme in Paris contributing to model shift to low carbon transport.
cities by financing metros, tram lines or bus fleets.
By providing this type of infrastructure the Bank
contributes to reducing the overall traffic load and
the use of high-emitting vehicles in particular. The
Bank also invests in financing research projects
which explore how engines can be made more fuel
efficient which may eventually lead to high emitting
vehicles being increasingly replaced by less
emitting ones.
103. More directly the Bank contributes to eliminating high-emitting vehicles in road traffic by, for
example, financing electric and hybrid bus fleets, electric cars and the associated infrastructure for
cities. Beyond roads the Bank has in recent years also financed the replacement of large and
outdated cargo vessels through more efficient ones. The cargo vessels the Bank has invested in can
now run on fuel with lower sulphur (SO2) content and producing less PM2.5 and black carbon
emissions. Replacing aging vessels with new ones led in one project to approximately halving the
total emission volumes. (For example, for one of the vessel projects financed, it was assumed that
the vessels being replaced by the project (between 25 and 30 years old) would emit an average of
1,400 kg CO2 per truck on the Mediterranean Lines and 5,000 kg of CO2 per truck in the Deep
Sea Lines. In contrast, the emission from the new vessels would represent approximately half of
those volumes.
104. The suggested measure 12 aims at reducing black carbon emissions. As outlined in previous
chapters black carbon is a warming agent, but not a greenhouse gas. For this reason emissions of
black carbon are not considered and accounted for in the Bank’s carbon footprint exercise which
only captures the seven GHGs. The avoided emissions from the Bank’s transport projects indicated
in table 3 above are avoided carbon CO2-eq.and hence not reduction in the SLCP, black carbon.
Yet, it can be assumed that there is a certain correlation between the avoided carbon dioxide (CO2)
and the avoided black carbon emissions.
Conclusion & Opportunities
EIB generally finances all economically viable transport projects as of a certain financing volume which is
in line with the Bank’s policy objectives, environmental and social standards and procurement guidelines.
Projects can be within or outside the EU. As mitigating climate change is a key policy priority for the EIB,
the Bank welcomes project proposals from project developers for retrofitting high emitting vehicle fleets,
financing new technologies or supporting a model shift from high-emitting vehicles to cleaner transport
modes. A team of transport engineers and economists can provide final advice and for more in-depth
project preparation the Bank can provide technical assistance.

44
The Bank’s carbon footprint exercise only shows avoided CO2-eq.emissions and only allows coarse
estimates of how CO2 savings correspond to the reduction of black carbon emissions. As stated in the
chapter on standards and criteria, the Bank will work towards the inclusion of the external costs caused
by PM2.5 into the Cost Benefit Analysis (CBA) for transport projects, if of value.
6.3.7 Agriculture
106. Between 2011 and 2015 the EIB supported rural economies inside and outside the EU by investing
more than EUR 24 billion throughout the bio-based value chains and in natural capital protection.
107. The EIB activities in the agricultural sector (here only crop and livestock production is considered)
includes on-farm investments in fixed assets with the objective to contribute to access to finance for
small- and medium-sized enterprises, improving resource efficiency, the environmental impact and
to reduce the emission of greenhouse gases. The lending to the agricultural sector is mainly
implemented through intermediated lending targeting SMEs. However, there are also some
microfinance projects outside the EU which aim to support (smallholder) farmers and are thereby
making a contribution to EU development policies. This type of projects is often combined with
technical assistance to ensure the achievement of these objectives. In addition to the support via
partner financial institutions, the Bank aims at supporting the EU rural development policy through
its co-financing of EU Member States’ Rural Development Programmes under the second pillar of
the EU Common Agricultural Policy.
108. At the time of writing this report, the Bank did not have any direct projects in the two areas
suggested by Measure 9 and 10. This means projects which either specifically focus on the control
of CH4 emissions from livestock production, or projects which focus on intermittent aeration of
continuously flooded rice paddies. Such projects would, however, generally be eligible for financing
by the Bank and the Bank would consider supporting them if they are in line with our standards and
criteria.
6.3.8 Industry
109. Within the industry sector, the EIB’s lending volume for the six year period analysed (2009-2014)
totals EUR 46 billion. The EIB typically supports research, development and innovation-related
projects (RDI, accounting for the majority of lending in the industry sector) and manufacturing. EIB-
financed RDI projects typically concern improving energy efficiency, reducing fuel consumption,
improving equipment performance, reducing the weight of automotive components and safety
improvements. In manufacturing, the EIB typically supports the modernisation and expansion of
manufacturing facilities as well as in some cases the implementation of state-of-the-art greenfield
manufacturing facilities.
110. The original 16 types of SLCP reduction measures listed by UNEP/WMO do not include measures
in relation to HFCs. However, as they belong to the main SLCP group, the Bank has deemed it

45
important to include them in the overview in Table 2. Specific areas in relation to industry where
HFCs can be found are listed for the sake of completeness and to be sure that the Bank is not
overlooking an area of its activities where SLCPs are emitted in a significant way.
111. As mentioned above, the main focus of industry sector financing is on RDI as well as EE and
depollution projects. Up to now, none specifically deals with SLCPs. If there was a research project
looking, for example into developing economically viable alternative substances, the Bank would, of
course, be interested in and examine whether such a project could be financed. For projects in the
manufacturing sector, the Bank is not aware of any projects which involved significant HFCs
emissions. The Bank’s services are very attentive to the GHG emissions associated with each project
financed. This includes, of course, emissions of SLCPs. As a rule, for all projects causing or saving
significant GHG emissions, the Bank’s services prepare a detailed carbon footprint. However, by
publishing this report, we have raised further the awareness among colleagues of the importance of
SLCPs.

46
109. Conclusions & Outlook
112. This report constitutes an important building block in the EIB’s efforts to further develop and refine
its approach to addressing climate change. Addressing the emissions of short-lived climate
pollutants (SLCPs) – methane (CH4), ground-level ozone (O3), black carbon (BC) and
hydrofluorocarbons (HFCs) – can substantially contribute to tackling near-term climate change. This
report explored how SLCPs are taken into account in the Bank’s standards and criteria, it looked at
the impact the EIB’s projects have on the emissions of SLCPs and finally, at opportunities for the
Bank to address SLCPs in its projects.
113. A key finding of the report was that not only are most SLCPs taken into account in the Bank’s
monitoring exercises, but SLCPs were also considered in the Bank’s standards and criteriaand
therefore in the decision-making process. An overview of the Bank’s standards, criteria and
safeguards and the projects financed by the Bank, and potential future projects with impacts on
SLCP emissions was presented.
114. In the process of preparing this report, awareness was raised amongst EIB staff of the benefits and
potential of mitigating SLCPs. Discussions with sectoral experts were held on the EIB’s project
portfolio and their impact on the emission of SLCPs, and on how projects can potentially address
and mitigate SLCPs. This heightened awareness sets the stage for a better understanding of SLCPs
and the impact of the Bank’s activities on their emissions.
115. The report found that the external costs caused by emissions of fine particulate matter (PM2.5) are
already included in the Cost Benefit Analysis (CBA) for projects in the energy sector. An area where
fine particulate matter (PM2.5) and its component black carbon are, however, not yet integrated and
priced into the project costs is the transport sector. As one of the sectors with the highest impact on
PM2.5 emissions, it is important that the costs caused by PM2.5 emissions are internalised into the
costs of transport projects. Therefore the Bank will work towards the inclusion of the external costs
caused by PM2.5 into the Cost Benefit Analysis (CBA) for transport projects, if considered of value.
Finally, this report also aimed at illustrating for the Bank’s counterparts and potential project
developers willing to address SLCPs, what the Bank can offer. Identified opportunities in terms of
possible projects were illustrated per sector. The Bank looks forward to further project proposals
addressing the emissions of SLCPs, both inside and outside the EU.
116. Exploring the relationship between SLCPs and the EIB’s activities has helped contribute to raising
awareness about emissions of SLCPs within the different sectors financed by the Bank, as well as the
benefits of mitigating these substances. The analysis has shed light on additional opportunities to
contribute to mitigating climate change which the Bank has not explored to date. Integrating the
findings of this report will contribute to the objectives set out in the Bank’s Climate Strategy, further
refine the Bank’s approach to climate action as well as to support the Bank’s continued focus on
reducing air pollution.

47

48
References 1 UNEP/WMO, 2011: “Integrated Assessment of Black Carbon and Tropospheric Ozone” 2 WHO, 2014: http://www.who.int/mediacentre/news/releases/2014/air-pollution/en/ 3 US EPA: https://www.epa.gov/ghgemissions/global-greenhouse-gas-emissions-data Source: IPCC, 2014 4 Myhre, G., D. Shindell, F.-M. Bréon, W. Collins, J. Fuglestvedt, J. Huang, D. Koch, J.-F. Lamarque, D. Lee, B. Mendoza, T. Nakajima, A. Robock, G. Stephens, T. Takemura and H. Zhang, 2013: Anthropogenic and Natural Radiative Forcing. In: Climate Change 2013: The Physical Science Basis. Contribution of Working Group I to the Fifth Assessment Report of the Intergovernmental Panel on Climate Change [Stocker, T.F., D. Qin, G.‐K. Plattner, M. Tignor, S.K. Allen, J. Boschung, A. Nauels, Y. Xia, V. Bex and P.M. Midgley (eds.)]. Cambridge University Press, Cambridge, United Kingdom and New York, NY, USA. 5 EEA, 2012: Evaluation of progress under the EU National Emission Ceilings Directive. Progress towards EU air quality objectives. EEA Technical report/No 14/2012“ 6 S. Avnery, 2011: “Global crop yield reductions due to surface ozone exposure: 2. Year 2030 potential crop production losses and economic damage under two scenarios of O3 pollution” 7 Amann M, Borken-Kleefeld J, et al. (2014) The Final Policy Scenarios of the EU Clean Air Policy Package. TSAP Report #11. International Institute for Applied Systems Analysis, Laxenburg, Austria 8 Aphekom: www.aphekom.org, 2013: http://pm10.kormany.hu/download/c/11/70000/APHE%20Az%20APHEKOM%20projekt%20eredm%C3%A9nyei%20(eng).pdf 9 EC, 2012: Cars 2020: Action Plan for a competitive and sustainable automotive industry in Europe 10 Transport & Mobility Leuven: ‘TREMOVE economic transport and emissions model’ http://www.tmleuven.be/methode/tremove/home.htm 11 EEA, 2013: “EMEP/EEA air pollutant emission inventory guidebook – 2013” 12 UNDP/World Bank Energy Sector Management Assistance Programme (ESMAP), 2004: “Strategic Gas Plan for Nigeria” 13 Waste Atlas, 2014: The World’s 50 Biggest Dumpsites: http://www.d-waste.com/d-waste-news/item/263-the-world-s-50-biggest-dumpsites-official-launching-of-the-2nd-waste-atlas-report.html 14 EEA, 2010 : ‘Climate Protection Potential in the Waste Management Sector’: http://www.umweltbundesamt.de/sites/default/files/medien/461/publikationen/4049.pdf 15 BIR, 2013, World steel recycling in figures 2008–2012: Steel scrap – a raw material for steelmaking, Bureau of International Recycling. 16 Meyer, B. et al (2011) "Macroeconomic modelling of sustainable development and the links between the economy and the environment". Study for the European Commission (DG Environment), available at http://ec.europa.eu/environment/enveco/studies_modelling/pdf/report_macroeconomic.pdf in EC ‘Towards a Circular Economy: A zero waste programme for Europe‘, 2014 17 "Guide to resource efficiency in manufacturing: Experiences from improving resource efficiency in manufacturing companies". Europe INNOVA (2012). in EC ‘Towards a Circular Economy: A zero waste programme for Europe‘, 2014, 18 Dorvil, P., 2014 : Müll und Abfall. « Finanzierung von Abfallwirtschaftsprojekten in der EU ein Paradigmenwechsel. Financing waste projects in the EU: A paradigm shift“ EC, JRC, 2015: “Preliminary exploratory impact assessment of short-lived pollutants over the Danube Basin; An analysis of the year 2010 HTAP V2 emission scenario with the TM5-FASST tool” World Bank, 2012: “What a waste: a global review of solid waste management” IPCC, 2007: Working Group I: The Physical Science Basis Royal Society, 2008: “Ground-level ozone in the 21st century: future trends, impacts and policy implications” The EIB wishes to thank the following promoters and suppliers for the photographs illustrating this report: © EIB Library, © Shutterstock, © Agence Nationale de Gestion de Dechets (ANGeD), © Amber Grid Lithuania.


Information Desk3 +352 4379-220005 +352 4379-62000U [email protected]
European Investment Bank98-100, boulevard Konrad AdenauerL-2950 Luxembourg3 +352 4379-15 +352 437704www.eib.org
© EIB 11/2016 EN © EIB GraphicTeam


![Assessment of GHGs and SLCPs emissions projections in Asia ... · Assessment of GHGs and SLCPs emissions projections in Asia based on SSP scenarios by using AIM/Enduse[Global] Tatsuya](https://static.fdocuments.net/doc/165x107/5d5ccdfd88c9936f1b8bc21d/assessment-of-ghgs-and-slcps-emissions-projections-in-asia-assessment-of.jpg)


