Shoreline reconstructions for the Persian Gulf since...
15
ELSEVIER Ear&h and Planetary Science Letters 142 ( 1996) 43-57 EPSL Shoreline reconstructions for the Persian Gulf since the last glacial maximum Kurt Lambeck * Research School of Earth Sciences, The Australian National University. Canberra, ACT 0200, Australia Received 24 October 1995; accepted 2? March 1996 Abstract Sea-level change in the Persian Gulf since the time of the last maximum glaciation at about 18 000 yr BP is predicted to exhibit considerable spatial variability, because of the response of the Earth to glacial unloading of the distant ice sheets and to the meltwater loading of the Gulf itself and the adjacent ocean. Models for these glacio-hydro-isostatic effects have been compared with observations of sea-level change and palaeoshoreline reconstructions of the Gulf have been made. From the peak of the glaciation until about 14000 yr BP the Gulf is free of marine influence out to the edge of the Biaban Shelf. By 14000 yr BP the Strait of Hormuz had opened up as a narrow waterway and by about 12500 years ago the marine incursion into the Central Basin had started. The Western Basin flooded about 1000 years later. Momentary stillstands may have occurred during the Gulf flooding phase at about 11300 and 10500 yr BP. The present shorelines was reached shortly before 6000 yr ago and exceeded as relative sea level rose l-2 m above its present level, inundating the low-lying areas of lower Mesopotamia. These reconstructions have implications for models of the evolution of the Euphrates-Tigris-Kan delta, as well as for the movements of people and the timing of the earliest settlements in lower Mesopotamia. For example, the early Gulf floor would have provided a natural route for people moving westwards from regions to the east of Iran from the late Palaeolithic to early Neolithic. Keywords: Persian Gulf; paleogeography; coastlines; last glacial maximum; upper Paleolithic; Neolithic 1. Introduction The Persian Gulf is a long and shallow, enclosed sea bounded at the south and west Arabian platform and to the north and east -, ---- tectonically active Zagros Mountains (Fig. 1). The latter, defining the zone of convergence between the Arabian and Eurasian plates, represent a zone of active tectonics and uplift, whereas the Gulf, and its northwesterly extension into Mesopotamia, is a zone almost by the hv the where subsidence is postulated to have been signifi- cant in recent geological time. Today, the Tigris and Euphrates rivers flow along the length of the topo- graphic low of the Mesopotamian lowlands and, with * Fax: + 61 6 249 5443. E-mail: [email protected] the Karun River, they combine to form the extensive Shatt-al-Arab estuary, marsh area and deltaic system at the head of the Gulf. Water depths in the Gulf do not generally exceed 100 m and the average depth is only about 35 m. Thus, as has been widely recog- nised, much, if not all, of the Gulf has been above sea level during glacial time 111. The timing and progress of the flooding of the Gulf since the last 0032-821X/96/$12.00 Copyright 0 1996 Published by Elsevier Science B.V. All rights reserved. f/I SOOl2-821X(96)00069-6
-
Upload
trannguyet -
Category
Documents
-
view
215 -
download
0
Transcript of Shoreline reconstructions for the Persian Gulf since...

ELSEVIER Ear&h and Planetary Science Letters 142 ( 1996) 43-57
EPSL
Shoreline reconstructions for the Persian Gulf since the last glacial maximum
Kurt Lambeck *
Research School of Earth Sciences, The Australian National University. Canberra, ACT 0200, Australia
Received 24 October 1995; accepted 2? March 1996
Abstract
Sea-level change in the Persian Gulf since the time of the last maximum glaciation at about 18 000 yr BP is predicted to exhibit considerable spatial variability, because of the response of the Earth to glacial unloading of the distant ice sheets and to the meltwater loading of the Gulf itself and the adjacent ocean. Models for these glacio-hydro-isostatic effects have been compared with observations of sea-level change and palaeoshoreline reconstructions of the Gulf have been made. From the peak of the glaciation until about 14000 yr BP the Gulf is free of marine influence out to the edge of the Biaban Shelf. By 14000 yr BP the Strait of Hormuz had opened up as a narrow waterway and by about 12500 years ago the marine incursion into the Central Basin had started. The Western Basin flooded about 1000 years later. Momentary stillstands may have occurred during the Gulf flooding phase at about 11300 and 10500 yr BP. The present shorelines was reached shortly before 6000 yr ago and exceeded as relative sea level rose l-2 m above its present level, inundating the low-lying areas of lower
Mesopotamia. These reconstructions have implications for models of the evolution of the Euphrates-Tigris-Kan delta, as well as for the movements of people and the timing of the earliest settlements in lower Mesopotamia. For example, the early Gulf floor would have provided a natural route for people moving westwards from regions to the east of Iran from the late Palaeolithic to early Neolithic.
Keywords: Persian Gulf; paleogeography; coastlines; last glacial maximum; upper Paleolithic; Neolithic
1. Introduction
The Persian Gulf is a long and shallow, enclosed sea bounded at the south and west
Arabian platform and to the north and east -, ---- tectonically active Zagros Mountains (Fig. 1). The latter, defining the zone of convergence between the
Arabian and Eurasian plates, represent a zone of active tectonics and uplift, whereas the Gulf, and its northwesterly extension into Mesopotamia, is a zone
almost by the hv the
where subsidence is postulated to have been signifi-
cant in recent geological time. Today, the Tigris and Euphrates rivers flow along the length of the topo- graphic low of the Mesopotamian lowlands and, with
* Fax: + 61 6 249 5443. E-mail: [email protected]
the Karun River, they combine to form the extensive
Shatt-al-Arab estuary, marsh area and deltaic system at the head of the Gulf. Water depths in the Gulf do not generally exceed 100 m and the average depth is only about 35 m. Thus, as has been widely recog-
nised, much, if not all, of the Gulf has been above sea level during glacial time 111. The timing and progress of the flooding of the Gulf since the last
0032-821X/96/$12.00 Copyright 0 1996 Published by Elsevier Science B.V. All rights reserved. f/I SOOl2-821X(96)00069-6

44 K. Lambeck / Earth and Planetary Science Letters I42 (19%) 43-57
26
22 44 m 56
Fig. 1. Setting of the Persian Gulf. The areas of darker shading define the relief above 1000 m. The depth contours in the Persian and Oman Gulfs are at 50 and 100 m. Locations of some sites mentioned in text are numbered l-12. I = Umm Al Qayayn; 2 = Salwah; .?=Qurayyah; 4= Dhahran; 5= Al Jabayl; 6= Lawdham; 7 = Al Wusail and Khor; 8 = Bir Zekrit; 9 = Khor Milh; 10 = Abu Abah; II= Shinas; 12 = Rud-e Chaharu. The locations 45, 46, 57, 58 refer to four Atlantis II core sites. Other place locations for lower Mesopotamia are given in Fig. 8.
glacial maximum has, however, been poorly con-
strained; in part because the knowledge of the eu-
static sea-level change remains imperfect, in part because the isostatic consequences of glacial loading
and unloading have not previously been considered, and in part because the tectonic uplift or subsidence
over the period are not readily evaluated indepen- dently of the sea-level fluctuation. The sequence of flooding and desiccation events before the last glacial maximum are even less well constrained for exactly
the same reasons. The glacio-hydro-isostatic models, particularly
for regions away from the former areas of glaciation,
are now sufficiently well constrained and of ade- quate spatial resolution to enable realistic models of the palaeo-shorelines and water depths to be con- structed since the time the ice sheets were last at their maximum volume. Such models would con- tribute to the understanding of the sedimentology of the gulf floor and may provide constraints on models of the movement of the northern shoreline at the head of the gulf through progradation of the Tigris- Euphrates Delta in the latest Pleistocene and
Holocene. Furthermore, the models provide the ref- erence with respect to which rates of vertical tecton- ics can be evaluated for areas where such move-
ments are of a magnitude that is comparable to the
rates of sea-level change. At the same time, observa- tions of the sedimentary record, or of the sea-level
change, provide further constraints on both the eu- static sea-level function and the glacio-hydro-iso-
static models. Finally, they permit reconstructions to
be made of the shorelines of the region, which are of
interest for assessing possible human settlement loca- tions and migration routes from the Palaeolithic to
Neolithic.
2. The glacio-hydro-isostatie model
The elements of the glacio-hydro-isostatic model
have been discussed elsewhere and have been tested against observational data in numerous localities. An
essential aspect of the model is that the sea-level
change produced by the melting of the ice sheets of Late Pleistocene time is not spatially uniform and that, in general, it will differ substantially from the eustatic sea-level curve. Schematically, this vatiabil- ity, Ac((p,t) of past sea levels at time t and position
cp expressed relative to present sea level, can be
written as [2,3]:
(la)
= K(r) + A{,;( cp~) + A&( cp~) (lb)
The first term on the right-hand side of Eq. (la) is the eustatic sea-level change, defined as:
K’,(r) = change in ocean volume
area of ocean surface (14
and the last term is the change from other tectonic
processes. The three terms making up A{,((p,t) de- fined by Eq. (lb) are the glacio-hydro-isostatic departures of sea level from the eustatic approxima-
tion. The first of these, At,, is the change produced by the gravitational attraction between the ice sheets, the ocean waters and the land, evaluated in the first instance as if the Earth were rigid. It is a function of
K. Lambeck/ Earth and Planetary Science Letters 142 119%) 43-57 45
both time and position and its influence extends
beyond the limits of the ice sheet. The second term, Ali, describes the glacio-isostatic effect, the change in sea level produced by the response of the crust,
elastic and viscous, to the unloading (or loading) of
the ice. It includes both the radial deflection of the crust and the gravitational effect of the redistribution
of mass within the Earth. This term can also be significant out to large distances beyond the former
areas of glaciation. It is a function of position and
time and its evaluation requires a knowledge of the changing ice sheets and of the rheological response
of the planet. The third term, A[ w, making up A<,, describes the hydro-isostatic effect of the loading of
the crust by the meltwater added into the oceans (or
extracted from it> as the ice sheets decay (or grow).
This term is a function of the Earth’s rheology, the
timing of the addition of the meltwater, of the amount of meltwater added, and of the geometry of the
32”
a
b
ocean basins into which the meltwater is added. This
last will itself be a function of time and of the sea-level change and the A(, term is evaluated in an iterative manner. The actual formulation and solution
of Eq. (la) is complex because, as noted above, the
sea-level change A(((p,t) enters into the hydro-iso- static term A{,,, on the right-hand side as well.
Details of the formulation are discussed in [3-51.
In tectonically quiet areas observations of sea-level change permit the eustatic sea-level function and the
earth and ice model parameters defining A<, to be
evaluated (e.g. [6]). In tectonically active areas At, and A(r may be of comparable magnitude, as in the
Aegean area, and the neglect of At, can lead to
misleading estimates for rates of tectonic movement
[71. In this case, it may be better to assume that A<,
and AC1 are known, based on analyses from stable regions, and to evaluate the ‘corrected’ relative sea-
level data in terms of tectonic processes.
ICC load componcnr
Rigid compncn~
4x0 56”
ICC load component
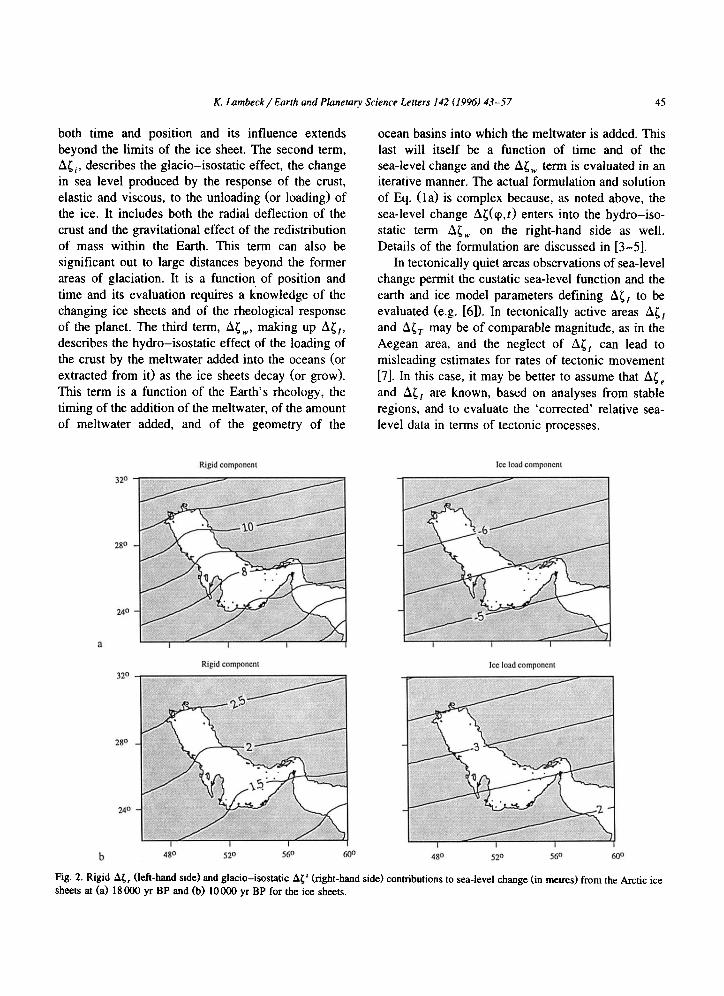
Fig. 2. Rigid A[, (left-hand side) and glacio-isostatic A<’ (right-hand side) contributions to sea-level change (in metres) from the Arctic ice
sheets at (a> 18 000 yr BP and (b) 10 000 yr BP for the ice sheets.
46 K. Lambeck/ Earth and Planetary Science Letters 142 (19%) 43-57
The evaluation of the isostatic terms requires, in
addition to the physical and mathematical framework and the eustatic sea-level function, a knowledge of
the Earth’s rheology and of the ice-sheet configura- tions through time. Figs. 2 and 3 illustrate the three
isostatic contributions for the Persian Gulf region
based on ice and earth models that describe well the
sea-level change in other regions where tectonic factors are believed to be small [6,8-lo]. The ice
models are observationally constrained to the radio-
carbon timescale and all ages in this and subsequent sections, with the exception of the last, refer to this
timescale. The eustatic sea-level curve used in these
models [l l] (Fig. 4 below) is consistent with the Barbados coral growth curve [12], when the latter is
corrected for the isostatic contributions primarily
from the Laurentide ice sheet and from the global
changes in the ocean basins. The major contribution
to the eustatic sea-level rise comes from the former
ice sheet over North America and Europe, with a major contribution also coming from a reduction in
the Antarctic ice volume over the past 18 000 years
T= 18OOOyemBP
[l 11. Fig. 2 illustrates the components for the Arctic ice sheet model whose eustatic contribution at the time of the last glacial maximum is 90 m. The Antarctic eustatic contribution is about 37 m, making
up a total eustatic change of 127 m since the last glacial maximum. While far from the nearest zone of
glaciation, some 40” from Scandinavia, the rigid
Arctic term is not insignificant in the Gulf region. The glacio-isostatic ice load has a shorter wave-
length than the rigid term and its Arctic contribution
to the sea-level change over the Gulf area is smaller than the rigid part, but not insignificant, and of
opposite sign. Together, the two terms introduce a
perturbation of up to about 5 m over the region. The Antarctic contributions to A<, and A(; adds a small
amount to the total departure from eustasy and un- certainties in the change in ice volume of this ice
sheet are unlikely to have important consequences on the model predictions. Fig. 2 also illustrates similar
results at 10000 yr BP, when the Arctic eustatic model contribution was about 29 m. Both corrective terms are small and any limitations in the ice models
T= IOOOOyearsBP T=6OOOyearsBP
b 500 600 500 @IQ 50” 60’
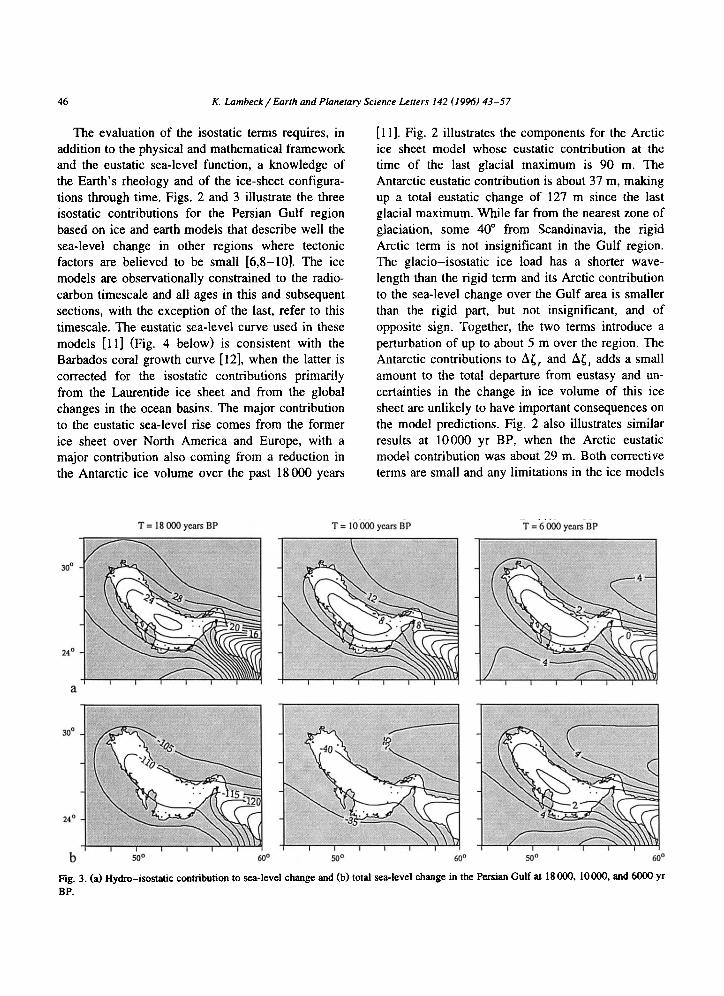
Fig. 3. (a) Hydro-isostatic contribution to sea-level change and (b) total sea-level change in the Persian Gulf at 18 000, 10000, and 6000 yr BP.

K. Lmnbeck /Earth and Planetary Science Letters 142 (19%) 43-57 4-l
5 ,...,..,,l,,,,,,
20 1s IO 5 0
time (x 1000 years RPI
Fig. 4. Predicted sea-level change at two locations at Fao and
Muscat on opposite ends of the Gulf and the corresponding
eustatic sea-level (es11 function. The upper part illustrates the
predicted change in the late Holocene (note the different scales).
are unlikely to have an important consequence on the
predicted spatial variability of sea level over the region, provided that their combined integrated rate of melting is consistent with the eustatic sea-level
function.
More important is the hydro-isostatic term result- ing from the loading of the Indian Ocean crust and the Gulf itself by an average water load of 127 m
(Fig. 3). These predictions are based on a third iteration of the sea-level equation in which the shore-
line is allowed to migrate with time. Fig. 3 illustrates
the A(, results for several epochs (top) together with the total sea-level change At (bottom). At 18 000 yr BP the hydro-isostatic correction varies by about 15 m over the region of the Gulf and the Biaban Shelf and the total sea-level change ranges from about - 106 m in the northern part of the Gulf
to about - 120 m on the Biaban Shelf. This com- pares with the assumed eustatic value of - 127 m for
this epoch. At 10000 yr BP the predicted sea levels are of the order of -40 m for the area compared with a eustatic value of about -46 m. For both
epochs the predicted change equals the eustatic change only in the Gulf of Oman beyond the conti-
nental shelf. At 6000 yr BP the predicted sea levels
lie above the present level by about 2-3 m. The pattern of sea-level change at this time is almost
wholly the consequence of the water-load term.
The earth model parameters adopted for the re-
gion are similar to those found for other regions where the sea-level data is sufficient to constrain
such parameters and where tectonic displacements
are believed to be comparatively small. These areas include the Australian margin [9], the British Isles [6]
and northwestern Europe [lo]. All point to a litho-
sphere with an effective elastic thickness, H,, of
60-80 km; an upper mantle viscosity, qUm (above
the 670 km depth seismic discontinuity) of (2-5) X
102’ Pa s and a lower mantle viscosity, Q,, , of about 102* Pa s. Some trade-off between these parameters
occurs such that combinations of lower effective lithospheric thickness and lower upper mantle vis- cosity lead to similar sea-level predictions, as do
combinations of thicker lithosphere and higher upper mantle viscosity [7,13]. Where the choice of mantle
parameters is of greatest consequence is in the pre- diction of the amplitudes of the highstands at about
6000 yr BP. However, in the absence of satisfactory sea-level data for the region, the nominal values of
H, = 65 km, rl,,,, = 4 X lo*’ Pa s, v,, = lO22 Pa s
are adopted. The time series of the predicted sea levels at two
locations based on the above model are compared
with the eustatic change in Fig. 4. Predicted sea levels at the Fao site in the north of the Gulf lie well
above the eustatic change throughout the last 18 000 years and a small amplitude highstand is developed at 6000 yr BP. In contrast, the prediction for a site
near Muscat on the Gulf of Oman is close to the eustatic sea-level curve at all times and a much smaller mid-Holocene highstand occurs.
These component calculations are based on a simplified ice model in which the ice sheets are assumed to have been at their maximum limit for a long period before melting starts. In reality, the ice

48 K. Lambeck / Earth and Planetary Science Letters 142 (19%) 43-57
sheets appear to have remained at their maximum
volumes for only a relatively short period and this has the effect of reducing the predicted sea-level
change at 18 000 yr BP, thereby increasing further
the departures from eustasy. Also, the model used here assumes that all melting ceased at 6000 yr BP,
whereas some studies have suggested that a small
increase in ocean volume occurred after about 6000
yr ago, sufficient to raise eustatic sea level by per- haps 2 m [6,9]. This has the effect of reducing the
mid-Holocene highstand illustrated in Fig. 3 and in delaying the occurrence of the maximum highstand
to about 5000 yr BP. Apart from these minor modifi-
cations, the characteristic variability in the sea-level
change illustrated in Figs. 3 and 4 is preserved.
3. Observational evidence for relative sea-level change in the Persian Gulf
Evidence for the change in the latest Pleistocene
and Holocene sea level relative to the shore or floor of the Persian Gulf falls into three principal cate- gories: shorelines or relict beach deposits mainly
younger than about 6000 yr BP that now lie above the level of the present development of such fea-
tures; terrigenous or very shallow-water sediments that are now below sea level; and evidence that the
shorelines have been horizontally displaced in time. Evidence from the eastern Saudi Arabian shore as
well as from Qatar has been discussed in [14-161. This data is based on the height-age relations of
raised shoreline features relative to their modem
counterparts (Table 1). The Qatar results are consis- tent with the observation by Taylor and Illing [17] that levels were at about 2.0 m at 4000-4300 yr BP. Together, these observations point to levels along this section of the coast having been l-3 m above
the present levels between about 3500 and 6000 yr BP. The accuracies of these highstands are difficult to evaluate because the raised beach deposits do not bear a well defined relationship to mean sea level at the time of formation, occurring at supratidal levels today [18]. The average tidal range in the Gulf is
presently small, of the order l-2 m, but more signif- icant may be the effect of winds and storms on the formation heights of the beach deposits, particularly at the sites exposed to the seasonal winds such as the
Table 1
Summary of observational evidence for sea-level change in the
Persian Gulf and surrounds
Site Lat Long Age H Ref (m)
Ezatem Saudi Arabia and Qnatar
salwah 24053’ 50043’ 4585 f60 1.0 [14]
Qurayyah (1) 25“ 53’ 58 07’ 3695 zk 50 1.8 1141
Qurayyah (2) 26001’ 490 59’ 446Ok60 2.0 [14]
Dhahran 26O 13’ 58 07’ 6020 f 80 1.2 [14]
Lawdhan 210 32’ 490 12’ 4205 f 70 3.0 [14]
Al Jubayl 270 10’ 49030’ 3810f 140 1.8 [16] Qatar Khor 25024’ 51032’ 4280f 160 3.0 [15]
Al Wusail 25O 30’ 51° 30’ 5420f 140 2.0 [15]
Bir Z&it 25036’ 50050’ 4950f 160 1.5 [15] MusdanPeninsula
umm Al- 25O35’ 55O 35’ 7000 0 t191 Qayayn 6090 2.6 1191
5ooo 2.1 [19]
4000 1.8 [19]
3000 1.2 [I91
2000 0.8 [19]
1000 0.4 [19] OllUm
Khor-Milh 230 14’ 58“ 57’ 4715 f 160 -1 [I51 Abu-Abah 23047’ 58041’ 4555 f 170 -0.3 [15]
Shinas (I) 24044’ 56028’ 4015f 160 -1 [l51
Shinas (2) 24041’ 56028 5390f 160 -1 U51 W. Mnkram
Rude. - 25“ 42 570 58’ 4870 f 200 1.3 [22]
Chaharu 6595 f 250 1.3 [22] Northern Gulf
Failalra 29016’ 48” 16’ 4000 1.8 [21]
3000 1.3 [211
2000 0.8 [21]
1000 0.4 [21]
Fao 29059’ 48027’ 9910f220 -31.7 [26] Persian Gulf Floor
45 29” 20’ 49” 45’ 984Of 160 -30.5 [24]
46 29“ 04’ 58 16’ 10430f 82 -46 [24]
57 260 27’ 56002 llC00~ 80 -74 [24]
58 250 59’ 56“ 47’ 14380f 100 -105 [24]
Ages am in radiocarbon years before present. The heights or
depths (H) of the shorelines are with respect to mean sea level.
Sham&. Also, some of the deposits may have formed in lagoonal environments at levels above those in more open coastal environments. Information is not

K. Lambeck / Earth and Planetary Science Letters 142 (19%) 43-57 49
available to assess these factors and a nominal accu- racy estimate of f 1 m has been adopted for all points; although, for the reasons indicated, the re- ported observations may systematically overestimate the highstand amplitude of mean sea level.
Results for the western side of the Musadan
Peninsula are discussed in [19]. The data, from a number of different but nearby sites, also points to
levels having been higher than present by about 2 m
(see also [20]). These data [ 191 have been interpreted
in terms of a gradually falling sea level for the past 6000 years, upon which large (ca. + 1 m) amplitude
oscillations are superimposed. Such fluctuations are attributed here to local factors, such as the move-
ments of coastal spits by wind-driven currents, and
the mean trend is adopted instead. Of importance is that sea level is noted to have first reached its
present level at about 7000 yr BP, to have exceeded
this level by about 2.5 m at 6000 yr BP and then to
have fallen at an average rate of about 0.4 m/1000 yr until the present. Near the head of the Gulf, on the Island of Failaka, similar oscillatory sea-level be-
haviour has been suggested [21], with levels 4500 years ago being about 2 m higher than present. As for the Musadan data, only the mean trend is consid-
ered here (Table 1) and accuracy estimates of + 1 m are adopted throughout.
Evidence for relative sea-level change during the
past 6000 years near the Strait of Hormuz and the coast of Makran, to the east of Hormuz, has been
discussed in [15,22,23]. To the west of the Strait, Late Holocene beach deposits are reported to occur up to elevations approaching 30 m and to the east,
along the western part of the Makran coast, such deposits occur at elevations exceeding 6 m. Along this entire section of the coast, corresponding to the
eastern end of the Zagros Mountains, these heights
exceed any plausible predictions based on eustatic and glacio-hydro-isostatic models and tectonic up-
lift appears to play a major role in controlling the relative land and sea levels. On the southern side of the Gulf of Oman, between Musadan and Muscat,
the evidence for raised shorelines appears minimal
and some results [I51 suggest that levels may have been less than 1 m above present during the last 5000 years (Table I).
Evidence for early Holocene sea levels below their present level has been derived mainly from
sediment cores collected during a 1977 Atlantis II cruise [24]. Generally, the sediments deposited in the Gulf since the time of the last transgression form only a relatively thin veneer, less than 2 m thick, over the Late Pleistocene sediments [25]. Three dis-
tinct units have been identified. The uppermost one
(unit I> corresponds to deposits of the last 5000-6000 years, once sea level approached its present level.
The second unit was deposited in shallow waters at a
time of rising sea level and the third unit corresponds
to deposits from the time the Gulf floor was above
sea level. The base of the second unit therefore
forms a lower limit on the time of the transgression.
Radiocarbon ages have been obtained for some of the core samples, although reservations about their
meaning have been raised because of the possibility
of contamination by older carbonate materials [25]. Table 1 summarises the relevant results from four
cores whose locations are shown in Fig. 1. Together,
these results point to a rapid rise in sea level between about 14500 yr BP and 10000 yr BP, from less than 105 m to less than 30 m below the present level.
However, the first two cores (45 and 46) are from the northwestern part of the Gulf, whereas 57 is from
the Hormuz Strait and 58 is from the shelf edge in
the Oman Gulf, so that some differential isostatic effect can be expected (cf. Fig. 3). Another useful
observation has been reported by Godwin et al. [26],
consisting of freshwater peats at about 32 m depth with an age of nearly 10000 yr BP (Table 1). This indicates that the sea level at Fao, near the head of
the Gulf, was below about 32 m at 10000 yr BP.
4. Comparison of observations with predictions
The model results in Figs. 2-4 indicate that the
isostatic corrections are substantial and that depar- tures of the local sea-level changes from the eustatic values can be significant. Table 2 summarizes these
corrections for the latest Pleistocene and early Holocene observations. These predictions are based
on the same model discussed above, except that the
ice-load history before 18 000 yr BP is considered using a model described previously [6], based on inferences drawn from the sea floor oxygen isotope signal [27]. The observed sea levels corrected for the isostatic function, A{,(cp,t), are also summarized.

50 K. Lambeck/ Earih and Planetary Science Letters 142 (19%) 43-57
Table 2 Summary of isostatic corrections and the estimated eustatic sea
level at the four core sites 1241 and at Fao [26] (see Table 1)
Site Isostatic Eustatic Age Comment Corr” sea
(m) level
45 6.4 -36.9 9840 rt 160 lower limit
46 7.7 -53.7 10430f 82 lower limit
57 8.0 -82.0 11000 f 80 lower limit
58 10.7 -115.7 14380 f 100 lower limit
Fao 8.1 -39.8 9910 f 220 upper limit
For the four Persian Gulf core samples of shallow- water sediments these estimates provide lower limits,
if the inferred ages are correct. In contrast, the observation of the subaerial deposit from Fao estab-
lishes an upper limit and, together with the core 45
data point, provides a quite tight constraint on eu-
static sea level shortly after 10000 yr BP. Fig. 5 illustrates the estimates of eustatic sea level, together
with the global curve adopted for the model predic- tions [l 11. Of the four core sites, three (46, 57 and
58) fall below the nominal eustatic sea-level curve,
consistent with the sediments having been deposited in shallow waters. Core site 45, however, lies a few metres above the curve, suggesting that either the
rise in eustatic sea level was more rapid after 10000 years ago than assumed in the model or that the age
of the sediments has been contaminated by older carbonate material, as suggested by Stoffers and
Ross [24]. In the latter case the age of the base of the unit II sediments would be about 9600 yr BP or
younger. The Fao results suggests that the sampled peat may have been as much as 7 m above mean sea level at the time of formation. Generally, the overall
agreement between the observations and predictions is satisfactory when compared with the observational uncertainty and the eustatic sea-level model used to estimate the isostatic correction terms is consistent with the observational evidence for the region.
The predicted sea levels for the past 6000 years point to a small mid-Holocene highstand of 2-3 m around the Gulf margin for the model in which eustatic sea level has remained at its present value for the last 6000 years (Fig. 3~). The highest pre-
Fao .” t:
PG#46i ,’ PG#45
t
.,’ . 4 : PG #51
,’
8’
-120 - ,,&‘G#58 .a.. f
-140 ’ a ’ I 20 15 10 5 0
time (x1000 years BP)
Fig. 5. Sea-level indicators corrected for the glacio-hydro-iso-
static effects and compared with the model eustatic sea-level
function (dashed line). Arrows pointing upwards indicate that the
estimates are lower limits; downwards pointing arrows indicate
upper limits.
dieted levels occur along the southern coast, between Qatar and Abu Dhabi, where the amplitudes reach 3.5 m, and along the northern shore of the Strait of
n 1 2 3
predicted rsl (m)
Fig. 6. Comparison of predicted and observed (with error bars)
relative sea level after 6000 yr BP in the Gulf area for the
standard earth and ice models in which no increase in ocean
vohxne. occurs in this interval.

K. Lambeck /Earth and Planetary Science Letters 142 (19%) 43-57 51
Hormuz where similar magnitudes are predicted. The
lowest values occur around the Oman Gulf where the predicted amplitudes at 6000 yr BP range from - 1 to + 1 m along the Muscat coast. At the north end of
the Gulf the predicted amplitudes are about 2.5 m,
increasing inland to about 3.2-3.5 m between Bas- rah, Amarah, and Nasiriyah (see Fig. 8 for locations).
Fig. 6 compares the post-6000 yr BP observations and predictions. Agreement is generally satisfactory
when the relatively large uncertainties of many of
the data points are considered. Studies from other
localities, however, suggest that the ocean volume
may have increased by about 1.5-2 m in the last 6000 years 16,111. Hence the corrected maximum
predicted highstands within the Gulf are only of the
order of OS-l.5 m, lower than the reported observed
values although within the error bounds. However, as previously noted, the observations here tend to
overestimate the highstand amplitudes. This differ-
ence could also indicate that the correction to the eustatic sea-level function is not warranted, even though analyses of sea levels from other regions support such a modification. Alternatively, it may indicate that the choice of earth mode1 parameters is
not appropriate: models with a somewhat higher value for the upper mantle viscosity, for example, lead to higher amplitudes for these highstands. (A value of 6 X 10 2o Pa s suffices to increase the
predicted highstands by 1.5-2 m). Unfortunately, the presently available data is insufficiently reliable to
use the spatial variation in the highstand amplitude to estimate the rheological parameters specifically for this area. What the comparisons do suggest is
that there has been no significant tectonic subsidence of the region in Holocene time, other than on the northern side of the Strait of Hormuz, and the smaller
highstands noted along the Oman coast, when com- pared with the Gulf results, do not require differen- tial tectonic movements.
5. Shoreline reconstructions
The predictions of the palaeo-sea levels are con-
sistent with the observations to within the observa- tional uncertainty of the data and the estimates for
tectonic vertical displacements are small, with the
exception for the sites along the northern shore of the Hormuz Strait and the coast of Makram. The
mode1 therefore appears adequate for predicting
palaeoshorelines since the time of the last glacial
maximum, although additional observational data,
particularly in the critical interval up to about 8000
yr BP, is clearly desirable. Improved data on the spatial variability of the mid-Holocene highstand is
also highly desirable in order to estimate the mantle
parameters specifically for the region. If the present water depth, D(cp,t,), at location cp
is known and the sea-level change, A[((p,,), since
time t has been computed, then the palaeo-water
depths at time t, assuming that no sedimentation or erosion has occurred, is:
and the locus D(cp,r) = 0 gives the shoreline at time
t. The assumption of minimal sedimentation appears to be valid for much of the Gulf region, since the
amounts of post glacial maximum sediments identi- lied in the Atlantis II cruise cores is generally less
than l-2 m 124,251. Results are illustrated in Fig. 7 for a few selected epochs, based on the glacio-hy- dro-isostatic mode1 discussed above and digitized
and gridded Gulf bathymetry [28] and topographic [29] data.
At the peak of the last glaciation, the Gulf is free
of marine influence out to the edge of the Biaban Shelf. The potential exists for the development of
lakes or shallow depressions in several localities,
with the primary ones corresponding to what are now the Eastern, Central and Western Basins and a
Fig. 7. Palaeoshoreline reconstructions of the Persian Gulf at (a) 18000 yr BP; (b) 12000 yr BP; (c) 10000 yr BP; and (d) 8000 yr BP. The
enclosed blue areas define the maximum limits of the lakes that could form if filled to their sill levels. The blue-grey areas to the south of
the Gulf axis define shallow topographic depressions in which swamp conditions could have developed if climatic conditions were
appropriate. The elevations above sea level are contoured at 20, 50, 100 and 150 m. The water depth contours are at -20, - 50, -75.
- 100, - 150 m.

52 K. Lambeck/Earth and Planetary Science Letters 142 (19%) 43-57
30
28
26
24
30
28
26
24
54 58

30
28
26
24
30
28
26
24
K. L.ambeck/ Earth and Planetary Science Letters 142 (19%) 43-57 53
50 54 58
50 54 58

54 K. Lambeck/Earth and Planetary Science Letters 142 (1996) 43-57
relatively deep and narrow basin in the Strait of Hormuz (Fig. 7a). Whether these basins filled with freshwater to the maximum levels determined by their respective sills will have depended on the cli- matic conditions in the Gulf area and in the hinter- land catchment area of the major rivers but the potential exists for the deposition of shallow fresh- water sediments in several localities as the palaeo Shatt-al-Arab wound its way to its mouth in the Gulf of Oman. The absence of a well developed river delta on the Biaban shelf and the generally small volumes of river sediments in the Gulf [25], suggests that the rivers may have deposited their sediments long before reaching the sea and that extreme sea- sonal floods carrying large sediment loads may not have been frequent. To the south of the river bed the area would have been gently sloping, with numerous shallow hollows or depressions in which lagoonal or swamp conditions could have developed if appropri- ate climatic conditions existed. However, the glacial maximum and the late glacial stage appear to have been a time of generally cooler and drier conditions than today 11,301 and there may have been little scope for freshwater sediments to have developed in these topographic lows.
The situation remains little changed for the next few thousand years of the late glacial stage as the sea-level rise is relatively slow and sufficient only to encroach onto the Biaban Shelf and into the small Hormuz Strait Basin. By 14000 yr BP the Hormuz Strait has opened up as a narrow waterway and the flooding of the lowlands to the west begins, first with the flooding of the Eastern Basin by marine water soon after 13 000 yr BP. Marine influence is first experienced in the Central Basin before about 12 500 yr BP. Thus, the oldest post-glacial maximum marine sediments expected in this basin would be about 12500 years or younger. The Western Basin lake remains free from marine incursion until about 11 500 BP (Fig. 7b). The northern part of the Gulf remains dry at this time, as does a vast area south of the palaeo-gulf, although, as before, this plain con- tains numerous shallow topographic depressions. Un- til about 11000 yr BP, the northern part of the Persian Gulf floor would have been a relatively flat but narrow plain, hemmed in between the palaeo-gulf and the southern foothills of the Zagros Mountains, forming the present coastline.
As the eustatic sea-level rises, the Gulf continues to expand and the marine influence spreads into the northern region. By about 10000 yr BP the north- eastern margin of the Gulf has approached its present position in several localities, particularly east of about 52” longitude (Fig. 7~). Much of the southern part of the Gulf remains exposed until about 8000 yr BP and areas such as the Great Pearl Bank are not submerged until shortly after this time (Fig. 7d). During the early Holocene the topographic depres- sions on the southern side of the Gulf are progres- sively inundated (compare Fig. 7c and d> and some of the deeper ones may provide potential sites for further investigations of sea level and climate change throughout this period.
One of the assumptions made in the model dis- cussed here is that the sea-level rise up to about 6000 years ago has been continuous without stillstands or regressions. Sea-level data from different localities has suggested that this rise may be less uniform but no consistent global picture has yet emerged and the adopted curve represents a function that represents well the bulk of the data. It has been suggested [25] that two (and possibly a third) stillstands occurred during the flooding phase at depth ranges of 64-61 m and 53-40 m, respectively. The deeper deposits occur within the Western Basin and the predicted spatial variability of sea level when it was 60-70 m below the present level, for the locations where this feature is identified, is about 2-3 m. Thus, if this shoreline were a synchronous and instantaneous event it would now not occur at a constant depth because of the subsequent glacio-hydro isostatic adjust- ments. The model predictions for this shoreline loca- tion indicate an age of formation of about 11 200- 11 500 yr BP. The second stillstand is more widespread, within the northern part of the Gulf, within the Western and Central Basins and in the Straits of Hormuz. The predicted spatial variability for these locations is correspondingly greater, at about 4-5 m, with the greatest depths predicted for the central area (near 26” and 53”E). Comparing the observed depths with predictions suggests a forma- tion age within the range 10 100-10900 yr BP. The third stillstand is less well documented. It occurs at a depth of about 30 m in the northern part of the Gulf and its predicted formation age is about 9100-9200 yr BP.

K. Lambeck/ Earth and Planetary Science Letters 142 (19%) 43-57 55
The present shoreline was reached slightly more than 6000 years ago and was surpassed as sea levels rose above their present level by perhaps 1 or 2 m. The available topographic data is insufficiently pre- cise to establish the extent of this incursion into the low-lying areas of the Mesopotamian Plain, nor is
the knowledge of the recent surficial sedimentary
record sufficient to reconstruct the evolution of the deltaic system through the Holocene. However, much
of the area between the present coast east of Basrah
and Nasiriyah and Amarah (Fig. 8), including the
Hammar Lake and marshes, appears to be only a few
meters above present mean sea level. Thus, the
summer (dry) season level of the Euphrates at Nasiriyah, upstream from Hammar Lake, is only 2.5
m above present mean sea level [31]. Hammar Lake
itself is isolated from marine waters at present but it does experience semi-diurnal oscillations driven in-
directly by the Gulf tides. Such tidal influences are
seen up to 1.50 km inland from the present coast [31] and, as the present tidal amplitudes at the head of the
Gulf are generally less than 1 m, this implies very
low terrain elevations. Thus, much of this area is likely to have been a shallow marine-lagoonal envi-
ronment in the mid Holocene, even in the absence of any subsequent sedimentation that may have raised the surface elevations to their present heights.
6. Speculations on some archaeological implica- tions
The region at the northern end of the present Gulf and at the junction of the Euphrates and Tigris
Rivers was settled by the early Sumerians during the
fourth millennium B.C. This ancient civilisation is
credited with many of the basic elements - art,
religion, law, mathematics and astronomy - that
became the characteristics of the subsequent civilisa-
tion of Mesopotamia. The early record is incomplete
and numerous questions have been raised. Who were
the Sumerians? Where did they come from? When
did they arrive? Did they arrive from a mountainous
region beyond Iran or did they arrive by sea? Were
they descendants from earlier Neolithic settlers in the
region, from the Ubaid culture at 4500-3500 BC, or
from the even earlier Eridu culture at about 5000 BC
[32-35]? Whatever directions the search for answers
to such questions may take, a significant element in the puzzle must be the evolution of the physical
environment of the Gulf itself: particularly during
the latter period of the flooding of the Gulf and the subsequent flooding of the low-lying delta region
when sea levels rose perhaps a few meters above its
present level between about 6000 and 3000 yr BP. (The archaeological ages refer to the calendar time
FZ30 I I I I ,
50 56
Fig. 8. Location map for sites in lower Mesopotamia.
56 K. Lambeck / Earth and Planetary Science Letters I42 (I 996) 43-57
scale but ages older than about 2600 B.C. are poorly constrained. Differences between this and the radio- carbon time scale are probably not significant in
terms of the uncertainty of the early archaeological
ages). During the Palaeolithic (before about 8000 yr
B.C.), Mesolithic and Early Neolithic (from 8000 to
about 6000 yr B.C.) much of the Gulf floor would
have been exposed (Fig. 7) and the broad river
valley, with lakes and marshes in the flatter regions,
would have formed a natural route for people mov-
ing westwards from east of Iran. Is this the route
travelled by the ancestors of the Sumerians? Roux
[36] recognized this possibility, as well as the possi- bility that this solution provides a rational basis for
some of the legends set against a background of
rivers and marshes; such as the water god Enki, already worshipped at Eridu, or the fish-man Oannes,
also from Eridu, who personifies a people retreating
from a rising sea. Roux also recognizes that, by hiding the evidence beneath a rising sea, it becomes
difficult to test the hypothesis, although During- Caspers [37] notes evidence for ancient civilisations on the bottom of the now northern part of the Persian
Gulf. Excavations at Ur and elsewhere have led to
evidence of a flooding event at about 4000-3000 B.C. and it is tempting to associate the Sumerian
‘Flood’ legend [36] with the peak of the Holocene transgression. Perhaps reconstructions of the kind
illustrated in Fig. 7, coupled with climatological models, will provide an improved framework for exploring the ancient valley system and the implica-
tions of these changes on the early settlers of the
region. During the Late Holocene the Gulf margin could
have extended a considerable distance inland as a
very shallow tidal environment, such that the Sume- rian sites of Obeid, Ur and Erridu, between An
Nasiriyah and Hammar Lake (Fig. 81, would have
been close to the coast, as recorded in the Sumerian cuneiforms [38]. The subsequent retreat of the shore- line would not have reflected a major evolution of
the delta system [39-421 but, more simply, a conse- quence of the late Holocene relative sea-level change and a modification of only the uppermost layer of an older delta system. This would be consistent with the Euphrates and Tigris shedding much of their sedi- ment loads before they reached the sea, except for
times of high flood. Better topographic data and constraints on the latest Holocene sedimentation are
required before detailed reconstructions of the shore- lines here can be made (see [43] for such an attempt
for Failaka) but, broadly, the models are consistent with archaeological evidence that suggests that the
Sumerian civilisation and its precursors, the Obeid and Eridu cultures, developed in a coastal shallow-
water environment by the fourth millennium B.C.
without subsequently requiring major delta evolu-
tion.
Acknowledgements
I thank Dr. C. Smither and Mrs. C. Krayshek for
the digitisation of the bathymetric data and prepara-
tion of the figures. [FAI
References
111
121
[31
[41
151
E. Uchupi, S.A. Swift and D.A. Ross, The Late Wisconsin
and Holocene geology of the Persian Gulf, a shallow epicon-
tine&d sea, Mar. Geol. (in press).
W.E. Farrell and J.A. Clark, On postglacial sea level, Geo-
phys. J. 46, 79-116, 1976.
M. Nakada and K. Lambeck, Glacial rebound and relative
sealevel variations: A new appraisal, Geophys. J. R. Astron.
Sot. 90, 171-224, 1987.
J.X. Mitrovica and W.R. Peltier, On postglacial geoid subsi-
dence over the equatorial oceans, 1. Geophys. Res. 96,
20053-20071, 1991.
P. Johnston, The effect of spatially non-uniform water loads
on the prediction of sea-level change, Geophys. J. Int. 114,
615-634, 1993.
[6] K. Lambeck, Glacial rebound of the British Isles. II: A high resolution, high-precision model, Geophys. J. Int. 115, 960-
990, 1993.
[7] K. Lambeck, Late Pleistocene and Holocene sea-level change
in Greece and southwestern Turkey: A separation of eustatic,
isostatic and tectonic contributions, Geophys. J. Int. 122,
1022-1044, 1995.
[8] K. Lambeck, Late Devensian and Holocene shorelines of the
British Isles and North Sea from models of glacio-hydro-
isostatic rebound, J. Geol. Sot. London 152, 437-448, 1995.
[9] K. Lambeck and M. Nakada, Late Pleistocene and Holocene
sea-level change along the Australian Coast, Palaeogeogr.
Palaeoclimatol. Palaeoecol. (Global Planet. Change Sect.) 89,
143-176, 1990.
[lo] K. Lambeck, P. Johnston and M. Nakada, Holocene glacial
rebound and sea-level change in NW Europe, Geophys. J.
Int. 103, 451-468, 1990.

I( Lambeck / Earth and Planetary Science Letters 142 (I 996143557 57
[I 1] M. Nakada and K. Lambeck. The melting history of the Late
Pleistocene Antarctic ice sheet, Nature 333, 36-40, 1988.
[12] R.G. Fairbanks, A ff,OOO-year glacio-eustatic sea level
record: influence of glacial melting dates on the Younger
Dryas event and deep ocean circulation, Nature 342, 637-
642, 1989.
[13] K. Lambeck, P. Johnston, C. Smither and M. Nakada, Glacial
rebound of the British Isles - III. Constraints on mantle
viscosity, Geophys. J. hit. 125, in press, 1996.
[14] H.A. McClure and C. Vita-Finzi, Holocene shorelines and
tectonic movements in eastern Saudi Arabia. Tectonophysics
85, 37-43, 1982.
[15] C. Vita-Finzi, Recent coastal deformation near the Strait of
Hormuz, Proc. R. Sot. London Ser. A 382, 44-457, 1982.
[16] A. Ridley and M.W. Seeley, Evidence for recent coastal
uplift near Al Jubail, Saudi Arabia, Tectonophysics 52, 319-
327, 1979.
[17] J.C.M. Taylor and L.V. Illing, Recent intertidal calcium
carbonate sedimentation at Qatar, Persian Gulf, Sedimentol-
ogy 12, 69-107, 1969.
[I81 B.H. Purser and J.P. Loreau, Argonitic, supratidal encrusta-
tions on the Trucial coast, Persian Gulf, in: The Persian Gulf,
B.H. Purser, ed., pp. 343-376, Springer, 1973.
[19] R. Dalongeville, P. Bemier, B. Dupuis and V. de Medwecki,
Holocene variations of the shoreline in the Persian Gulf:
Example of the Umm al-Quwayn Lagoon (U-A-E.), Bull.
Inst. Geol. Bassin d’Aquitaine, Bordeaux 53, 179-192, 1993.
[20] G. Evans, V. Schmidt, P. Bush and H. Nelson, Stratigraphy
and geologic history of the Sabkha, Abu Dhabi, Persian Gulf,
Sedimentology 12, 145-159, 1969.
[21] R. Dalongeville, Pr6sentation physique gCnCrale de L’ile de
Failaka, in: Failaka, Fouilles Francaises 1986-1988. No. 18,
Y. Calvet and J. Gachet, eds., pp. 23-40, Maison de 1’Orient.
Lyon, 1990.
1221 C. Vita-Finzi, 14C Dating of recent crustal movement in the
Persian Gulf and lranian Makran, Radiocarbon 22, 763-773,
1981.
[23] C. Vita-Finzi, 14C deformation chronologies in coastal Iran,
Greece and Jordan, J. Geol. Sot. London 144, 553-560,
1987.
]24] P. Stoffers and D.A. Ross, Late Pleistocene and Holocene
sedimentation in the Persian Gulf-Gulf of Oman, Sediment.
Geol. 23, 181-208, 1979.
]25] M. Sarnthein, Sediments and history of the Postglacial trans-
gression in the Persian Gulf and Northwest Gulf of Oman,
Mar. Geol. 12, 245-266, 1972.
[26] H. Godwin, R.P. Suggate and E.H. Willis, Radiocarbon
dating of the eustatic rise in ocean-level, Nature 181, 1518-
1519, 1958.
[27] N.J. Shackleton, Oxygen isotopes, ice volume and sea level,
Quat. Sci. Rev. 6, 183-190, 1987.
[28] E. Seibold and K. Vollbrecht, Die Bodenqestalt des Persis-
then Golfs, Meteor Forchungsergebnisse, C2, 1979.
[29] GETECH. Global Digital Terrain Model 5, Univ. Leeds,
1995.
[30] C. Vita-Finzi, Recent alluvial history in the catchment of the
Arab-Persian gulfs, in: The Environmental History of the
Near and Middle East Since the Last Ice Age, W.C. Brice
ed., pp. 255-261, Academic Press, 1978.
[31] Naval Intelligence Division, Iraq and the Persian Gulf, Geo-
graphical Handbook Series. U.K.. 1944.
[32] T.B. Jones, The Sumerian Problem, 142 pp.. Wiley, New
York, 1969.
[33] S.N. Kramer, The Sumerians, 355 pp., University of Chicago
Press, Chicago, 1963.
[34] G. Roux, Ancient Iraq, 547 pp., Penguin, London, 3rd ed.,
1992.
[35] J. Oates, Ur and Eridu, the prehistory, Iraq 22. 32-50, 1960.
[36] G. Roux, Les Sum&ens sortaient-ils de la mer, in: Initiation
in I’Orient Ancien, J. Botttro, ed., pp. 37-56, Editions du
Seuil, Paris, 1992.
]37] E.C.L. During-Caspers, New archaeological evidence for
maritime trade in the Persian Gulf during the Late Protoliter-
ate period, East West 21, 21-44, 1971.
[38] Th. Jacobsen, The waters of Ur, Iraq 22, 184-185, 1960.
1391 G.M. Lees and N.L. Falcon, The geographical history of the
Mesopotamian Plains, Geogr. J. 118, 24-39, 1952.
[40] C.E. Larsen, The Mesopotamian delta region: a reconsidera-
tion of Lees and Falcon, J. Am. Oriental Sot. 95, 43-57,
1975.
[41] P. Sanlaville, Considerations sur I’Cvolution de la basse
Mesopotamie au cours des demiers milltnaires, Paleorient
15, 5-27, 1989.
]42] W.A. Macfadyen and C. Vita-Finzi, Mesopotamia: the
Tigris-Euphrates delta and its Holocene Hammar fauna,
Geol. Mag. 115, 287-300, 1978.
[43] P. Sanlaville, R. Dalongeville, J. Evin and R. Paskoff, Modi-
fication du trace littoral sur la c&e arabe du Golfe Persique
en relation avec I’archtologie, in: Deplacements des Lignes
de Rivage en M6dit&ran6e, pp. 21 l-222, Coil. lnt. CNRS, Paris, 1987.