Shopping Floorspace Monitor - June 2016 - Norwich
29
Norwich City Centre Shopping Floorspace Monitor & Local & District Centres Monitor Survey of June 2016
Transcript of Shopping Floorspace Monitor - June 2016 - Norwich

Norwich City Centre Shopping Floorspace Monitor &
Local & District Centres Monitor
Survey of June 2016

2

3
Contents
Introduction ..................................................................... 4
Policy Context ............................................................. 4
Retailing in Norwich .................................................... 5
Main Findings .................................................................. 6
City Centre Overview .................................................. 6
The Primary Area: Retail Vacancy .............................. 8
The Primary Area: Retail Frontages .......................... 10
The Secondary Area ................................................. 12
Large District Centres ............................................... 14
Rest of the City Centre .............................................. 17
District and Local Centres ......................................... 19
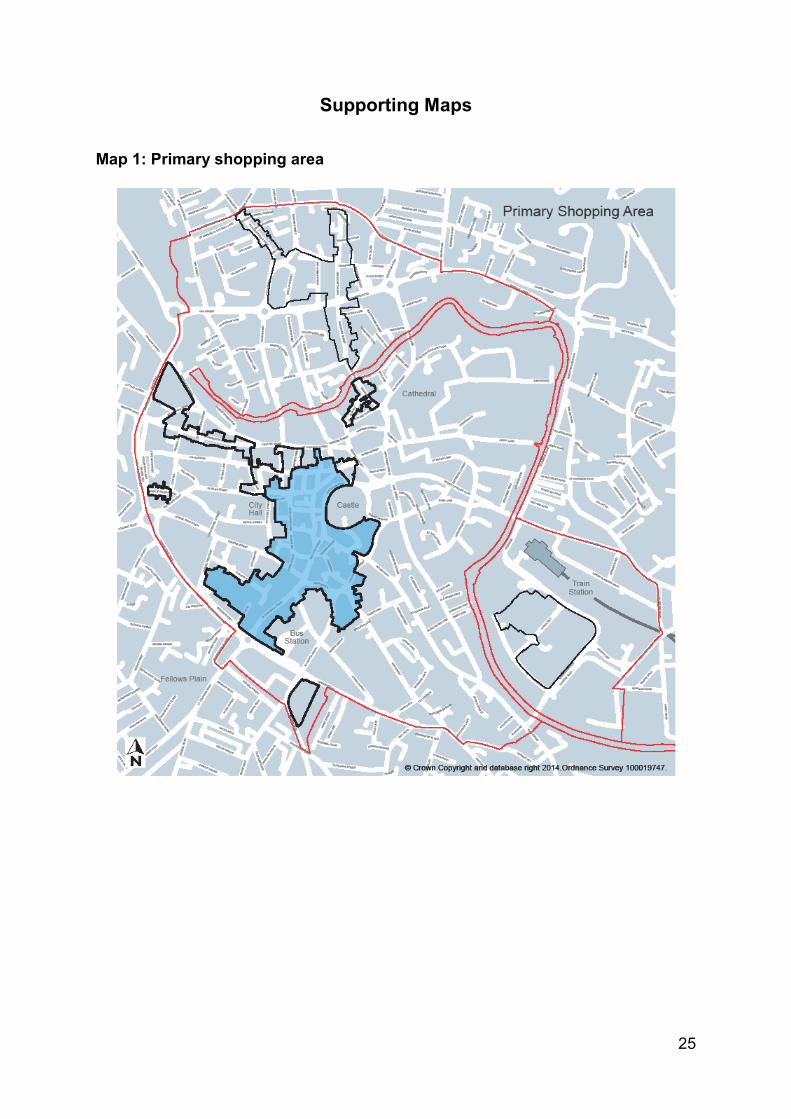
Conclusions ................................................................... 24
Supporting Maps ........................................................... 25
Contact Information ...................................................... 29

4
Introduction
Policy Context
1. The National Planning Policy Framework (NPPF) states in paragraph 23 that planning policies should be “positive, promote competitive town centre environments… provide for customer choice and a diverse retail offer, and reflect the individuality of town centres”.
2. The Joint Core Strategy (JCS) was adopted in March 2011, with amendments adopted in January 2014 by the three local planning authorities in the Greater Norwich Development Partnership (GNDP)1, since superseded by the Greater Norwich Growth Board (GNGB). The plan covers the period from 2008 to 2026.
3. Policy 11 of the JCS for Norwich city centre states that its regional centre role will be strengthened and that the retail, cultural and leisure facilities offered in the city will be expanded and enhanced through intensification of retail uses in the primary retail area and its expansion if necessary. The policy also promotes the strengthening of specialist shopping areas in secondary areas of the city centre.
4. Policy 19 of the JCS promotes the strengthening of the large district centres (LDCs) at Anglia Square, Magdalen Street & St Augustines and at Riverside, which are at the second level of the retail hierarchy headed by the city centre. The essential role of district and local centres in meeting everyday shopping needs is also supported.
5. The adopted Development management policies local plan (the DM plan) provides the detail to enable the strategic policies above to be implemented and to protect the vitality and viability of centres. In particular, policies DM20 and DM21 aim to protect retail function by managing the proportion of shops - as opposed to other services and facilities - in defined city centre shopping frontages (policy DM20) and suburban shopping areas (policy DM21). In both cases local policies seek to ensure that proposals for change of use will not result in the proportion of shops falling below a specified minimum level.
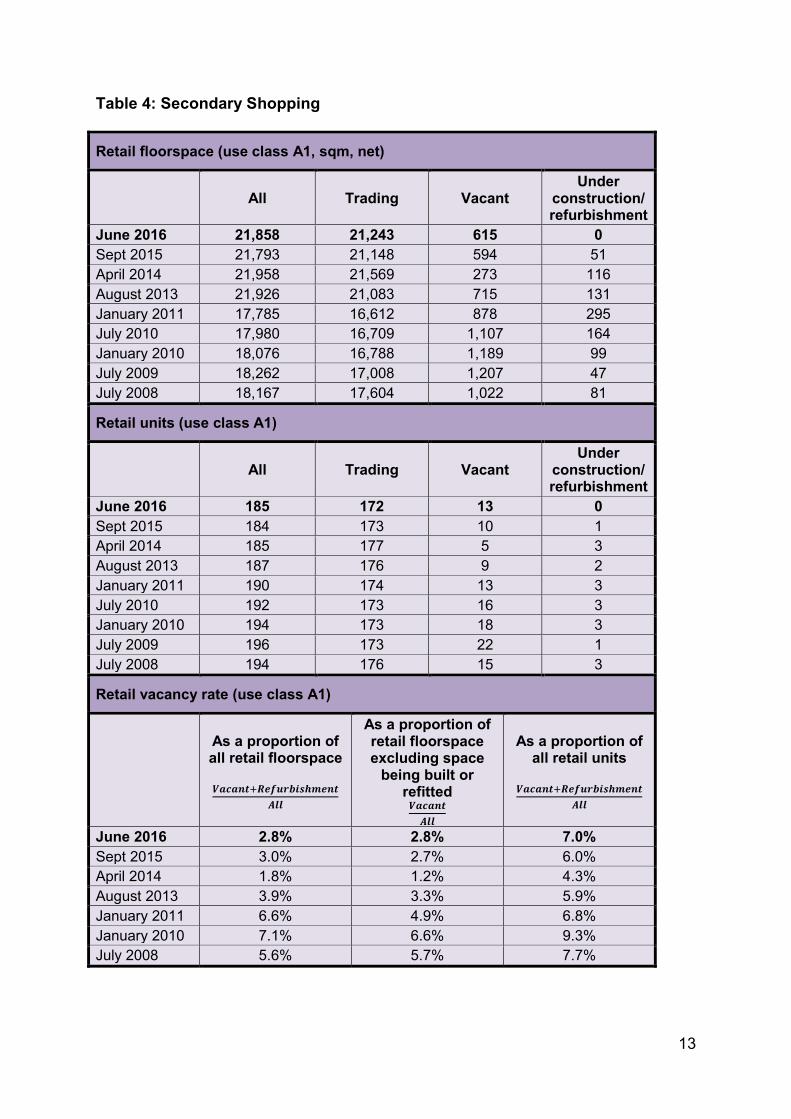
6. For the city centre retail frontages the applicable minimum thresholds for policy DM20 are set out in a separate supplementary planning document (the Main town centre uses and retail frontages SPD, adopted in December 2014). For district and local centres the thresholds are set out in policy DM21.
7. The government has incrementally increased permitted development rights and as such there is now the flexibility to change shops to a variety of different uses without the need for planning permission – both on a temporary basis through the prior notification procedure and permanently. Of particular impact is the removal of the need for planning permission for change of use from A1
1 The GNDP is made up of Broadland District Council, Norwich City Council and South Norfolk Council, working in partnership with Norfolk County Council and the Broads Authority

5
retail to A2 professional services (i.e. banks). Largely uncontrolled changes between shops, banks and other financial/professional services. These measures are undoubtedly helpful to encourage new uses into underperforming centres but they also make it increasingly difficult for local planning policy to influence directly the mix of uses in a centre, or prevent the incremental loss of shops in comparatively prosperous city centres such as Norwich where is important to retain them.
8. This document presents the results of the most recent survey of the city centre and district and local shopping centres. It provides monitoring details for 2015/2016 on these thresholds and on retail vacancy rates. This monitoring data is used both to assess the performance of policies and to assist their implementation.
Retailing in Norwich
9. Norwich city centre is a thriving retail and visitor destination in terms of retail spend and attractiveness and has maintained its position as 13th best performing retail centre nationally (source: CACI). The city centre is the most accessible and sustainable location in the greater Norwich area for retail, leisure, office, cultural and tourism related development.
10. Retail uses are critical in underpinning the city centre’s continued vitality and viability. However, an appropriate diversity of other town centre uses such as restaurants, cafés, financial services, leisure, cultural uses and offices help to support the economic vitality and health of the city centre for the community and visitors throughout the day and evening.
11. Regular monitoring of change in retail frontages ensures that any thresholds applied remain relevant and necessary. The survey data reported here was collected in June 2016 over a 1 week period. The data reported is based on the frontages as defined in appendix 4 of the Development management policies plan.

6
Main Findings
City Centre Overview
12. City centre retail vacancy rates have increased slightly since the last survey in September 2015.
13. The vacant available floorspace in the city centre as a whole is 5.8%, a rise from 2015’s figure of 4.9%. This has reduced significantly from the worst figure in the plan period of 12.4% in 2010. While the long-term picture appears healthy, this survey shows a rise in vacant floorspace within the city centre with vacancy rates increasing year-on-year since 2014.
14. The percentage of vacant units has risen to 11.4% which is one of the highest figures in the plan period but compares favourably to a national city centre average of 11.7% (Local Data Company, September 2015). However, direct comparison with national rates is difficult due to methodological differences between surveys.
15. Overall retail floorspace in the city centre has essentially remained stable with an increase of 0.01% since September 2015. There have been no significant retail developments within the city centre in the past 12 months.
16. Recent years have seen a trend towards a diversification of uses within the city centre with a particular increase in the number of cafes and restaurants on offer. There has been a 2.2% decrease in retail floorspace since the start of the plan period. Although this runs counter to the aims of JCS policy 11 (to increase the amount of retailing in the city centre), it is in support of the policy’s aim to increase other uses such as the early evening economy, employment and cultural and visitor functions to enhance vitality and viability.
17. The city centre is undergoing some major traffic changes with a number of streets being closed to general traffic, being made one-way or being pedestrianised. This increases the attractiveness of the city to shoppers, particularly on streets such as Westlegate which were, until recently, difficult for pedestrians to navigate. The works to the public realm on Westlegate are now complete and improve access to the Ber Street and All Saints Green areas.
18. The level of floorspace growth promoted by JCS policy 11 was based on assumptions in a 2007 study and the retail market has changed radically since then. A 2.2% loss in retail floorspace is nevertheless considered favourable against the national picture. An updated retail study to assess Norwich’s current retail needs is an early priority to inform the emerging Greater Norwich Local Plan (GNLP).
19. Recent figures from the Norwich Business Improvement District (BID) report that the shopping centre is experiencing an increase in footfall and that there are a number of major retailers looking to open new stores in the city.
20. Table 1, below, provides city centre overview data on retail floorspace, enabling comparison over the time period of the plan.

7
Table 1: Norwich city centre – provision of A1 retail floorspace
Retail floorspace (use class A1)
All Trading Vacant Under
construction/ refurbishment
June 2016 223,987 208,342 13,006 2,639 Sept 2015 223,762 210,509 11,028 2,225 April 2014 224,653 213,652 9,513 1,488 August 2013 224,109 208,779 11,849 3,481 January 2011 227,377 203,948 21,035 2,394 July 2010 227,949 198,379 28,315 1,255 January 2010 228,432 206,379 21,810 243 July 2009 229,509 208,674 20,579 256 July 2008 229,120 213,902 14.248 970
Retail units (use class A1)
All Trading Vacant Under
construction/ refurbishment
June 2016 1023 906 110 7 Sept 2015 1020 908 103 10 April 2014 1048 930 107 11 August 2013 1054 936 97 21 January 2011 1067 949 108 10 July 2010 1070 938 121 11 January 2010 1079 948 126 5 July 2009 1086 955 128 3 July 2008 1084 967 109 8
Retail vacancy rate (use class A1)
As a proportion of all retail
floorspace 𝑽𝑽𝑽𝑽𝑽𝑽𝑽𝑽𝑽𝑽𝑽𝑽+𝑹𝑹𝑹𝑹𝑹𝑹𝑹𝑹𝑹𝑹𝑹𝑹𝑹𝑹𝑹𝑹𝑹𝑹𝑹𝑹𝑹𝑹𝑽𝑽𝑽𝑽
𝑨𝑨𝑨𝑨𝑨𝑨
As a proportion of retail floorspace
excluding space being built or refitted
𝑽𝑽𝑽𝑽𝑽𝑽𝑽𝑽𝑽𝑽𝑽𝑽𝑨𝑨𝑨𝑨𝑨𝑨
As a proportion of all retail units
𝑽𝑽𝑽𝑽𝑽𝑽𝑽𝑽𝑽𝑽𝑽𝑽+𝑹𝑹𝑹𝑹𝑹𝑹𝑹𝑹𝑹𝑹𝑹𝑹𝑹𝑹𝑹𝑹𝑹𝑹𝑹𝑹𝑹𝑹𝑽𝑽𝑽𝑽
𝑨𝑨𝑨𝑨𝑨𝑨
June 2016 7.0% 5.8% 11.4% Sept 2015 5.9% 4.9% 11.1% April 2014 4.9% 4.2% 11.3% August 2013 6.8% 5.3% 11.2% January 2011 10.3% 9.3% 10.1% July 2010 13.0% 12.4% 11.3% January 2010 9.7% 9.5% 11.7% July 2009 9.1% 9.0% 11.8% July 2008 6.2% 6.2% 10.0%
Overall retail floorspace change
Since Sept 2015 Increased by 225 sqm (0.01% increase) Since July 2008 Decreased by 5,133 sqm (2.2% decrease)

8
The Primary Area: Retail Vacancy
21. The extent of the primary area, containing the malls and main comparison goods stores, is shown on Map 1. The boundaries have been amended slightly over time to reflect changes, so direct comparison with previous years is not always possible.
22. The floorspace vacancy rate is 5.7% in the primary retail area. This is a significant decrease in vacant floorspace from the peak vacancy rate of 11.7% in 2010, but is a slight increase on 2015’s figure of 5.0%.
23. The current vacancy rate for retail units is 14.0%, down slightly from 2015’s figure of 14.1% which was the highest figure in the plan period. This figure being higher than the floorspace vacancy figure implies that the smaller shops continue to be more difficult to let in the primary area. Changes to permitted development rights at a national level are intended to encourage a wider range of uses in smaller shops, although there has been little evidence of a widespread take up of these rights in the primary area. It may therefore be an issue related to rental values or the viability of small businesses in general.
24. The figures have been affected by the fact that Castle Mall is at the latter stages of a comprehensive refurbishment. Many of the units are currently being refitted and are expected to be occupied in the near future.
25. Some current and upcoming works are expected to have a positive effect on vacancy rates in the primary area. Such works include the pedestrianisation of Westlegate and the refurbishment of parts of Castle Mall. As such, vacancy rates may fall in the long term.
26. Table 2, below, provides retail floorspace data for the primary area.

9
Table 2: Primary shopping area
Retail floorspace (use class A1, sqm, net)
All Trading Vacant Under
construction/ refurbishment
June 2016 155,389 143,867 8,883 2,639 Sept 2015 155,139 145,445 7,711 2,017 April 2014 155,884 149,059 5,865 960 August 2013 152,497 141,705 9,382 1,410 January 2011 173,789 157,817 13,967 2,005 July 2010 174,252 153,199 20,448 605 January 2010 174,525 160,541 13,909 75 July 2009 175,256 162,962 12,294 0 July 2008 175,028 168,511 6,434 83
Retail units (use class A1)
All Trading Vacant Under
construction/ refurbishment
June 2016 562 484 72 7 Sept 2015 559 481 72 7 April 2014 579 499 74 6 August 2013 567 490 72 5 January 2011 574 524 45 5 July 2010 576 513 58 5 January 2010 578 524 53 1 July 2009 581 524 57 0 July 2008 584 537 46 1
Retail vacancy rate (use class A1)
As a proportion of all retail floorspace
𝑽𝑽𝑽𝑽𝑽𝑽𝑽𝑽𝑽𝑽𝑽𝑽+𝑹𝑹𝑹𝑹𝑹𝑹𝑹𝑹𝑹𝑹𝑹𝑹𝑹𝑹𝑹𝑹𝑹𝑹𝑹𝑹𝑹𝑹𝑽𝑽𝑽𝑽
𝑨𝑨𝑨𝑨𝑨𝑨
As a proportion of retail floorspace excluding space
being built or refitted 𝑽𝑽𝑽𝑽𝑽𝑽𝑽𝑽𝑽𝑽𝑽𝑽𝑨𝑨𝑨𝑨𝑨𝑨
As a proportion of all retail units
𝑽𝑽𝑽𝑽𝑽𝑽𝑽𝑽𝑽𝑽𝑽𝑽+𝑹𝑹𝑹𝑹𝑹𝑹𝑹𝑹𝑹𝑹𝑹𝑹𝑹𝑹𝑹𝑹𝑹𝑹𝑹𝑹𝑹𝑹𝑽𝑽𝑽𝑽
𝑨𝑨𝑨𝑨𝑨𝑨
June 2016 7.4% 5.7% 14.0% Sept 2015 6.3% 5.0% 14.1% April 2014 4.4% 3.8% 13.8% August 2013 7.1% 6.2% 13.6% January 2011 9.2% 8.0% 7.8% July 2010 12.1% 11.7% 10.1% January 2010 8.0% 8.0% 9.2% July 2009 7.0% 7.0% 9.8% July 2008 3.7% 3.7% 7.9%
10
The Primary Area: Retail Frontages
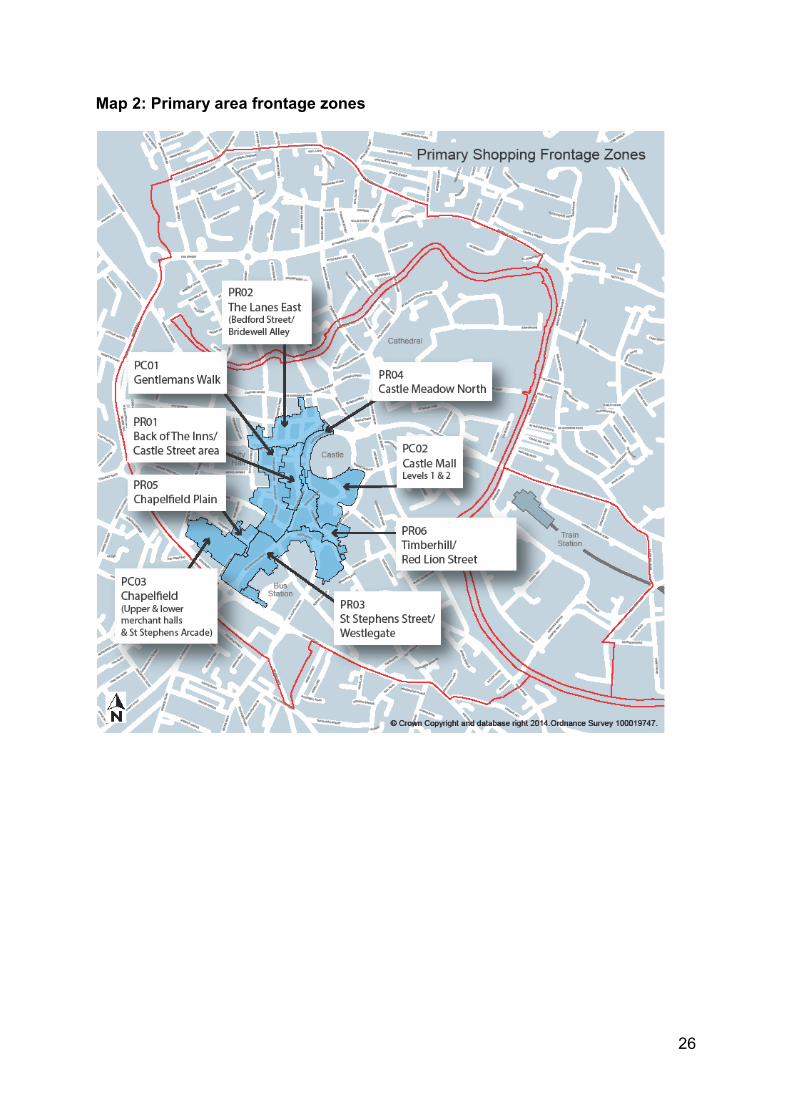
28. Policy DM20 divides the primary area into a number of smaller ‘frontage zones’ (as defined on the policies map and as identified in appendix 4 to the DM policies plan). The frontage zones are shown on Map 2. The retail threshold applicable in each of these areas is set within the Main town centre uses and retail frontages Supplementary Planning Document (December 2014).
29. Table 3 provides data on the percentage of retail uses in the primary area retail frontage zones in June 2016. None of the frontages have dropped below their minimum thresholds as set out in the Main town centre uses and retail frontages Supplementary Planning Document (December 2014). Overall the retail frontages appear healthy.
30. Changes to the percentage of A1 retail in these retail frontages over the past year have been mixed.
31. The percentage of A1 retail frontage within the primary retail area core frontage zones has remained unchanged. The percentage within two of the frontage zones (PR01 and PR02) has fallen slightly since 2015 due to a few changes of use from retail to cafés and restaurants but these retail frontages still remain at safe levels and well above their minimum thresholds.

11
Table 3: Primary Area Retail Frontage Zones - Retail frontages in September 2015 (green denotes increase in A1 retail since 2015, red denotes decrease)
Frontage zone2 Total
frontage (m)
Total non-retail
frontage June 2016
% A1 retail
June 2016 (frontage)
% A1 retail Sept
2015 (frontage)
Minimum threshold
(from 2014 SPD)
Primary retail area core frontage zones
PC01: Gentleman’s Walk/ Haymarket/Brigg Street
872.9 101.4 88.4% 88.4% 80%
PC02: Castle Mall (Levels 1 & 2)
875.1 38.3 95.6% 95.6% 80%
PC03: Chapelfield, upper & lower Merchants Hall and St Stephens Arcade
686.0 19.5 97.2% 97.2% 80%
Frontage zones in the rest of the primary retail area
PR01: Back of the Inns/Castle Street area
729.6 220.0 69.8% 70.5% 65%
PR02: The Lanes east (Bedford Street/Bridewell Alley)
1125.4 231.9 79.2% 79.8% 70%
PR03: St Stephens Street/Westlegate 784.6 105.6 86.5% 86.1% 80%
PR04: Castle Meadow north N/A3
PR05: Chapelfield Plain N/A4
PR06: Timberhill/Red Lion Street
434.2 129.8 70.1% 70.1% 60%
2 See Section 9 for definitions and maps. 3 There is no defined frontage in this zone 4 There is no defined frontage in this zone

12
The Secondary Area
32. Map 3 shows the extent of the secondary area. 33. In the secondary area the vacant unit rate is 7.0%, up from 6.0% in 2015. The
floorspace vacancy rate in the secondary area is 2.8%, up from 2.7% in 2015. The 2016 figures compare favourably across the whole monitoring period and are significantly lower than the 2008 figures of 7.7% and 5.7% respectively. Vacancy rates are lowest in the secondary area compared to all other areas of the city.
34. The secondary area includes some streets which provide a specialist mix of shops and have remained resilient to the economic downturn. For instance, Upper St Giles Street has retained an interesting mix of independent shops, bakeries, art galleries, restaurants and hairdressers. This survey reports that all 22 units are occupied.
35. The Retail and Leisure Topic Paper (2013) identified that “other shopping areas within the city centre should be strengthened to provide for retail diversity, with a particular focus on enhancing the character of specialist retailing areas and markets”.
13
Table 4: Secondary Shopping
Retail floorspace (use class A1, sqm, net)
All Trading Vacant Under
construction/ refurbishment
June 2016 21,858 21,243 615 0 Sept 2015 21,793 21,148 594 51 April 2014 21,958 21,569 273 116 August 2013 21,926 21,083 715 131 January 2011 17,785 16,612 878 295 July 2010 17,980 16,709 1,107 164 January 2010 18,076 16,788 1,189 99 July 2009 18,262 17,008 1,207 47 July 2008 18,167 17,604 1,022 81
Retail units (use class A1)
All Trading Vacant Under
construction/ refurbishment
June 2016 185 172 13 0 Sept 2015 184 173 10 1 April 2014 185 177 5 3 August 2013 187 176 9 2 January 2011 190 174 13 3 July 2010 192 173 16 3 January 2010 194 173 18 3 July 2009 196 173 22 1 July 2008 194 176 15 3
Retail vacancy rate (use class A1)
As a proportion of all retail floorspace
𝑽𝑽𝑽𝑽𝑽𝑽𝑽𝑽𝑽𝑽𝑽𝑽+𝑹𝑹𝑹𝑹𝑹𝑹𝑹𝑹𝑹𝑹𝑹𝑹𝑹𝑹𝑹𝑹𝑹𝑹𝑹𝑹𝑹𝑹𝑽𝑽𝑽𝑽
𝑨𝑨𝑨𝑨𝑨𝑨
As a proportion of retail floorspace excluding space
being built or refitted 𝑽𝑽𝑽𝑽𝑽𝑽𝑽𝑽𝑽𝑽𝑽𝑽𝑨𝑨𝑨𝑨𝑨𝑨
As a proportion of all retail units
𝑽𝑽𝑽𝑽𝑽𝑽𝑽𝑽𝑽𝑽𝑽𝑽+𝑹𝑹𝑹𝑹𝑹𝑹𝑹𝑹𝑹𝑹𝑹𝑹𝑹𝑹𝑹𝑹𝑹𝑹𝑹𝑹𝑹𝑹𝑽𝑽𝑽𝑽
𝑨𝑨𝑨𝑨𝑨𝑨
June 2016 2.8% 2.8% 7.0% Sept 2015 3.0% 2.7% 6.0% April 2014 1.8% 1.2% 4.3% August 2013 3.9% 3.3% 5.9% January 2011 6.6% 4.9% 6.8% January 2010 7.1% 6.6% 9.3% July 2008 5.6% 5.7% 7.7%
14
Large District Centres
36. Limited direct comparison in changes over the plan period is possible for the Large District Centres (LDCs) as there have been changes to the areas covered with the re-designation of Riverside. Map 4 shows the extent of the LDCs.
37. Vacant floorspace in the LDCs now stands at 5.4%. This is an increase on 2015’s figure of 3.2%. The 4 surveys which have been carried out since the re-designation of Riverside in 2013 show an upward trend in vacancy rates but nevertheless 5.4% is still a relatively low figure for shopping areas which do not form a central part of the city’s retail offer.
38. Encouragingly, Riverside is fully let and relatively close to the city centre but shopping trips remain largely car-based. The routes to be established within the emerging ‘St Annes Quarter’ development will provide new retail units and cafés creating a more attractive walking and cycling link between Riverside and the city centre.
39. The Magdalen Street, Anglia Square & St Augustines LDC has a moderate floorspace vacancy rate of 10.5% which is still relatively low when compared to similar fringe areas in other towns and cities. This figure of 10.5% is also significantly lower than the vacancy rates in the early part of the plan period (16.6-18.4%). This centre has repositioned itself as a thriving area of speciality/ethnic retailers and restaurants. A new traders association has been established and the Magdalen Street Celebration events have been ongoing since 2010. This adheres to the recommendations within the Retail and Leisure Topic Paper (2013) which refers to “… specialist retail areas… in which the aim is to continue recent success by promoting smaller scale, independent retailers”.
40. Anglia Square is under new ownership and as such, proposals for a comprehensive development are expected to emerge soon.

15
Table 5: Large District Centres (Magdalen Street, St Augustines Street, Anglia Square & Albion Way Riverside5)
Retail floorspace (use class A1)
All Trading Vacant Under
construction/ refurbishment
June 2016 32,353 30,534 1,750 69 Sept 2015 32,353 31,237 1,047 69 April 2014 32,647 31,594 784 269 August 2013 32,602 31,256 301 1,045 January 2011 18,314 14,934 3,311 69 July 2010 18,218 14,947 3,202 69 January 2010 18,239 14,811 3,359 69 July 2009 18,289 15,049 3,031 209 July 2008 18,139 15,017 3,031 91
Retail units (use class A1)
All Trading Vacant Under
construction/ refurbishment
June 2016 139 125 13 1 Sept 2015 139 129 9 1 April 2014 140 130 8 2 August 2013 77 67 7 3 January 2011 135 107 27 1 July 2010 134 109 24 1 January 2010 135 106 28 1 July 2009 136 112 22 2 July 2008 135 111 22 2
Retail vacancy rate (use class A1)
As a proportion of all retail floorspace
𝑽𝑽𝑽𝑽𝑽𝑽𝑽𝑽𝑽𝑽𝑽𝑽+𝑹𝑹𝑹𝑹𝑹𝑹𝑹𝑹𝑹𝑹𝑹𝑹𝑹𝑹𝑹𝑹𝑹𝑹𝑹𝑹𝑹𝑹𝑽𝑽𝑽𝑽
𝑨𝑨𝑨𝑨𝑨𝑨
As a proportion of retail floorspace excluding space
being built or refitted 𝑽𝑽𝑽𝑽𝑽𝑽𝑽𝑽𝑽𝑽𝑽𝑽𝑨𝑨𝑨𝑨𝑨𝑨
As a proportion of all retail units
𝑽𝑽𝑽𝑽𝑽𝑽𝑽𝑽𝑽𝑽𝑽𝑽+𝑹𝑹𝑹𝑹𝑹𝑹𝑹𝑹𝑹𝑹𝑹𝑹𝑹𝑹𝑹𝑹𝑹𝑹𝑹𝑹𝑹𝑹𝑽𝑽𝑽𝑽
𝑨𝑨𝑨𝑨𝑨𝑨
June 2016 5.6% 5.4% 10.0% Sept 2015 3.4% 3.2% 7.2% April 2014 3.2% 2.4% 7.1% August 2013 4.1% 1.0% 13% January 2011 18.5% 18.1% 20.0% July 2010 18.0% 17.6% 17.9%
5 Retail floorspace at Riverside is included in these statistics from August 2013 onwards, following the removal of Riverside from the primary shopping area in the adopted JCS (March 2011) and its re-designation as a Large District Centre

16
January 2010 18.8% 18.4% 20.7% July 2009 17.7% 16.6% 16.2% July 2008 16.7% 16.8% 16.0%
17
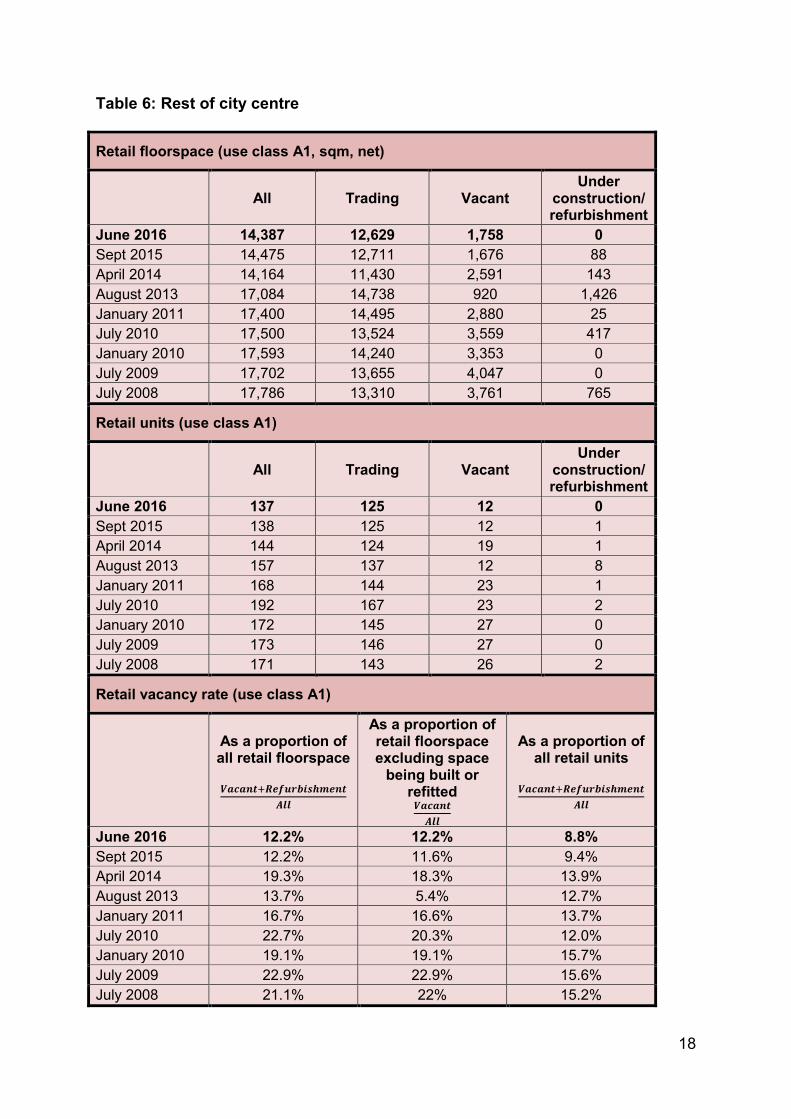
Rest of the City Centre
41. This area covers all shops within the city centre which are not included in the defined areas discussed above. There have been some boundary changes which were first reflected in the 2014 monitor. As such, the figures prior to 2014 are not directly comparable.
42. In the rest of the city centre the vacant unit rate is 8.8%, down from 9.4% in 2015. The floorspace vacancy rate in the secondary area is 12.2%, up from 11.6% in 2015. This suggests that the smaller units are faring well but that the larger units are struggling to find and retain retailers in the lesser known shopping streets which lie outside of the defined areas.
18
Table 6: Rest of city centre
Retail floorspace (use class A1, sqm, net)
All Trading Vacant Under
construction/ refurbishment
June 2016 14,387 12,629 1,758 0 Sept 2015 14,475 12,711 1,676 88 April 2014 14,164 11,430 2,591 143 August 2013 17,084 14,738 920 1,426 January 2011 17,400 14,495 2,880 25 July 2010 17,500 13,524 3,559 417 January 2010 17,593 14,240 3,353 0 July 2009 17,702 13,655 4,047 0 July 2008 17,786 13,310 3,761 765
Retail units (use class A1)
All Trading Vacant Under
construction/ refurbishment
June 2016 137 125 12 0 Sept 2015 138 125 12 1 April 2014 144 124 19 1 August 2013 157 137 12 8 January 2011 168 144 23 1 July 2010 192 167 23 2 January 2010 172 145 27 0 July 2009 173 146 27 0 July 2008 171 143 26 2
Retail vacancy rate (use class A1)
As a proportion of all retail floorspace
𝑽𝑽𝑽𝑽𝑽𝑽𝑽𝑽𝑽𝑽𝑽𝑽+𝑹𝑹𝑹𝑹𝑹𝑹𝑹𝑹𝑹𝑹𝑹𝑹𝑹𝑹𝑹𝑹𝑹𝑹𝑹𝑹𝑹𝑹𝑽𝑽𝑽𝑽
𝑨𝑨𝑨𝑨𝑨𝑨
As a proportion of retail floorspace excluding space
being built or refitted 𝑽𝑽𝑽𝑽𝑽𝑽𝑽𝑽𝑽𝑽𝑽𝑽𝑨𝑨𝑨𝑨𝑨𝑨
As a proportion of all retail units
𝑽𝑽𝑽𝑽𝑽𝑽𝑽𝑽𝑽𝑽𝑽𝑽+𝑹𝑹𝑹𝑹𝑹𝑹𝑹𝑹𝑹𝑹𝑹𝑹𝑹𝑹𝑹𝑹𝑹𝑹𝑹𝑹𝑹𝑹𝑽𝑽𝑽𝑽
𝑨𝑨𝑨𝑨𝑨𝑨
June 2016 12.2% 12.2% 8.8% Sept 2015 12.2% 11.6% 9.4% April 2014 19.3% 18.3% 13.9% August 2013 13.7% 5.4% 12.7% January 2011 16.7% 16.6% 13.7% July 2010 22.7% 20.3% 12.0% January 2010 19.1% 19.1% 15.7% July 2009 22.9% 22.9% 15.6% July 2008 21.1% 22% 15.2%
19
District and Local Centres
43. Policy DM21 of the Development management policies plan establishes A1 retail use thresholds of 60% for district centres and 50% for local centres.
44. Vacancy rates in district and local centres have increased from 2015 and are now 9.6% and 7.5% respectively. This follows the overall upward trend of vacancy rates within the city but district and local centre vacancy rates still remain at fairly healthy levels.
District Centres 45. A new district centre opened at DC09 Hall Road earlier this year with a new
Asda superstore and a number of smaller retail and community units. Due to the establishment of large retail stores, two new district centres were included in 2015’s retail monitor (DC08 & DC10 used to be local centres). As such, it is not possible to make direct comparisons with previous years.
46. Vacancy rates in the district centres have increased from 6.8% to 9.6% in the past year but this vacancy figure still remains at a fairly healthy level. Out of the 198 units in the 10 district centres, 19 units are vacant.
47. The three poorest performing district centres in terms of vacancy rates in 2016 were DC06: Earlham House, DC09: Hall Road and DC01: Bowthorpe. DC01 has had 2 further units become vacant this year so its total vacancy rate has increased from 5.9% to 17.6%. Vacancy rates within DC06 have continued to increase from 17.6% to 23.5%. The new district centre (DC09 Hall Road) has only recently opened and 2 of the 7 units are yet to be occupied and so the vacancy rate is 28.6%.
48. Two of the district centres (DC03: Eaton Centre & DC07: The Larkman) have all of their units occupied.
49. Of the 190 units in the district centres, the percentage of non-retail units is 42% which is very similar to the 2015 figure of 42.1%. Seven of the ten district centres have exceeded the 40% non-retail threshold set out in Development management policy DM21:
• DC01: Bowthorpe
• DC03: Eaton Centre
• DC04: Plumstead Road
• DC05: Aylsham Road/Mile Cross
• DC07: The Larkman
• DC09: Hall Road
• DC10: Sprowston Road/Shipfield 50. This is unchanged from the 2015 retail monitor which identified the same 6
centres exceeding the threshold (DC09 is new to this list but only opened this year). However, many of these centres have non-retail percentages only just over 40%, so in many cases it would just take one or two units changing to retail to satisfy the policy ambition. In any case, it is recognised that some

20
non-retail units such as restaurants and cafes can add to the vitality and viability of a retail centre.
Table 7: District Centres defined in the adopted Norwich Local Plan 2014
Ref No Centre name Total units
Vacant units
% vacant/ annual change
Non retail units
% non-retail
DC01 Bowthorpe 17 3 17.6% 8 47.1% DC02 Drayton Road 15 1 6.7% 4 26.7% DC03 Eaton Centre 19 0 0.0% 10 52.6% DC04 Plumstead Road 31 2 6.5% 15 48.4%
DC05 Aylsham Road/ Mile Cross 22 1 4.5% 10 45.5%
DC06 Earlham House 17 4 23.5% 4 23.5% DC07 The Larkman 13 0 0.0% 6 46.2%
DC08 Dereham Road/ Distillery Square 37 4 10.8% 14 37.8%
DC09 Hall Road 7 2 28.6% 3 42.9%
DC10 Sprowston Road/ Shipfield 20 2 10.0% 9 45.0%
TOTAL 198 19 9.6% 83 42% Key
Vacancy rate is unchanged since last survey Vacancy rate is up since last survey Vacancy rate is down since last survey
Proportion of A1 retail units is ABOVE 60%
Proportion of A1 retail units is BELOW 60%

21
Local centres 51. Table 8, below, shows vacancy rates and percentage of non-retail units for
the 28 local centres. 52. Of the 324 units, the number of vacant units is 24, representing a vacancy
rate of 7.4% compared to the 2015 figure of 7.2%. Over half of the local centres are now fully occupied (16 out of 28).
53. LC10: Aylsham Road/Glenmore Gardens is now fully occupied and has performed particularly well with a decrease in vacancy from 16.7% to 0.0%.
54. LC19: Colman Road/The Avenues had a particular sharp growth in vacancy with an increase from 6.3% to 18.9%.
55. The percentage of non-retail units across all of the centres has decreased from 44.7% in 2015 to 43.4% this year. This average figure is well below the 50% threshold.
56. The DM21 policy threshold of not less than 50% retail has been exceeded in the following five local centres:
• aLC06: Unthank Road;
• LC07: St Augustine’s Gate;
• LC17: Bishop Bridge Road;
• LC26: UEA; and
• LC29: Aylsham Road/Copenhagen Way. 57. These are the same five centres which had exceeded the threshold in last
year’s monitor. 58. The following local centres are recorded as having exactly 50% non-retail.
Any changes of use to non-retail uses will cause the policy threshold to be exceeded:
• LC02: Hall Road/Queens Road
• LC12: Woodcock Road
• LC15: Sprowston Road/Silver Road
• LC28: Magdalen Road/Clarke Road 59. Overall, the district and local centres continue to be perform their function and
to offer an appropriate range of local services and facilities, with small food stores, where present, being most important to their success. The Retail and Leisure Topic Paper (2013) states that “averaged over the period 2006‐2011, vacancy rates are lower (5%) in those centres with convenience stores (of over 250 m²) compared to 6.5% in those without.”

22
Table 8: Local Centres6 defined in the adopted Norwich Local Plan 2014
Ref No Centre name Total units
Vacant units
% vacant/ annual change
Non retail units
% non-retail
LC01 Hall Road/ Trafalgar St 7 2 28.6% 2 28.6%
LC02 Hall Road/ Queens Road 28 3 10.7% 14 50.0%
LC03 Hall Road/ Southwell Road 7 0 0.0% 3 42.9%
LC04 Grove Road 14 0 0.0% 5 35.7% LC05 Suffolk Square 9 0 0.0% 4 44.4% LC06 Unthank Road 42 3 7.1% 22 52.4%
LC07 St Augustine’s Gate 7 1 14.3% 5 71.4%
LC08 See footnote
LC09 Aylsham Road/ Junction Road 8 2 25.0% 0 0.0%
LC10 Aylsham Road/ Glenmore Gardens
12 0 0.0% 5 41.7%
LC11 Aylsham Road/ Boundary Road 12 0 0.0% 3 25.0%
LC12 Woodcock Road 6 0 0.0% 3 50.0%
LC13 Catton Grove Road/Ring Road
12 1 8.3% 3 25.0%
LC14 Magdalen Road 12 2 16.7% 5 41.7%
LC15 Sprowston Road/ Silver Road
8 2 25.0% 4 50.0%
LC16 See footnote
LC17 Bishop Bridge Road 7 0 0.0% 4 57.1%
LC18 Earlham West Centre 20 1 5.0% 9 45.0%
LC19 Colman Road/ The Avenues 16 3 18.6% 4 25.0%
6 Local centres at Dereham Road/Distillery Square (previously LC08) and Sprowston Road/Shipfield (previously LC16) were redesignated as district centres following the development of new anchor foodstores and renumbered as DC08 and DC10 respectively in the 2014 local plan. They are listed in table 7 above. The local centre at St Stephens Road newly designated in that plan (LC30) falls partly within and partly outside the city centre. The retail floorspace within that part of the local centre is included within the floorspace and unit totals in Table 6.

23
Ref No Centre name Total units
Vacant units
% vacant/ annual change
Non retail units
% non-retail
LC20 Colman Road, The Parade 11 2 18.2% 5 45.5%
LC21 Woodgrove Parade 9 0 0.0% 3 33.3%
LC22 St John’s Close/ Hall Road 10 0 0.0% 3 30.0%
LC23 Tuckswood centre 5 0 0.0% 1 20.0%
LC24 Witard Road, Heartsease 9 0 0.0% 3 33.3%
LC25 Clancy Road, Heartsease 5 0 0.0% 2 40.0%
LC26 UEA 9 0 0.0% 7 77.8% LC27 Long John Hill 5 0 0.0% 1 20.0%
LC28 Magdalen Road/ Clarke Road 8 0 0.0% 4 50.0%
LC29 Aylsham Road/ Copenhagen Way
5 0 0.0% 4 80.0%
LC30 St Stephens Road 15 2 13.3% 10 66.7%
TOTAL 318 24 7.4% 138 43.4% Key
Vacancy rate is unchanged since last
Vacancy rate is up since last survey Vacancy rate is down since last survey
Proportion of A1 retail units is ABOVE 50%
Proportion of A1 retail units is BELOW 50%
Proportion of A1 retail units is AT 50% policy

24
Conclusions
1. Overall, the survey suggests that retailing in Norwich has had a relatively successful year in parts of the city (most notably the secondary areas) but that the majority of the city has seen small rises in vacancy rates. Nationally, and in fact internationally, the growing popularity of online retailing is affecting the viability of traditional retail shops.
2. There has been a notable rise in vacancy rates in district centres this year. Whilst this appears to just be a one-off blip, the council will continue to closely monitor the performance of district centres in order to protect and enhance their value.
3. At this time of deregulation, it is important to acknowledge the changes that could take place within retail centres without the direction of the council (i.e. temporary changes of use of small retail units). The added flexibility within retail centres could reduce vacancy rates and provide a wider range of amenities and services but this flexibility is most beneficial in areas which have experienced high long-term vacancy rates. Despite modest increases in vacancies, Norwich remains a thriving retail centre and would not necessarily benefit from this deregulation.
4. As such, the council needs to identify other ways to influence and cultivate the retail offer of Norwich. The council is considering the potential benefits of developing a City Centre Strategy, possibly with the assistance of other interested parties such as the Business Improvement District (BID). Such a strategy would offer additional ways to bolster the city’s retail offer.
25
Supporting Maps
Map 1: Primary shopping area
26
Map 2: Primary area frontage zones

27
Map 3: Secondary shopping areas

28
Map 4: Large district centres (Magdalen Street, Anglia Square, St Augustine’s Street & Riverside)

29
Contact Information
Further information can be obtained using the following contact details. Planning Services Norwich City Council City Hall St Peter’s Street Norwich NR2 1NH [email protected] 0344 980 3333 The contact officer for this report is: Lara Emerson 01603 212500 [email protected]